9 - Utilities for color management
Appendix: Color Models for Mapinfo (separate html page)
1 - How MI uses colors
MapInfo
uses colors in different contexts, the most obvious being as an attribute of a
graphical object. One or two colors can be attached to an object depending on
its type. There are two colors when a background and a foreground planes can be
defined; it is the case of text objects in some circumstances (framing text in a
box, using halo effect), of true type symbols in the same circumstances, and of
fill patterns other than flat color (the “black” pattern design is the
foreground color, the “white” interstitial spaces, the background).
MI
uses also colors for displaying maps without using the colors of the objects;
colors are then attached to types of objects with the “Display Style
Override” option, or to groups of objects in thematic mapping. Continuous
maps, such as those produced by interpolation models (GRID maps) are special
cases that color the space without reference to any object.
Finally,
colors are also used in the production of graphs.
The
day might also arrive (version 6.5+???) when MI will also deal with colors in
the perspective of preparing documents for the printer.
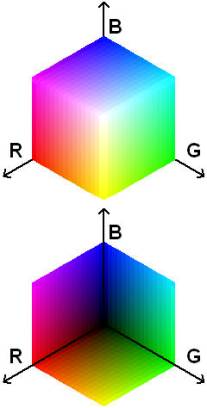
Whatever
the circumstances in which a color is used, MI handles that attribute in the
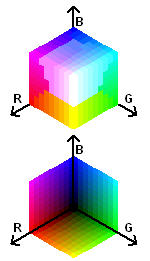
same manner as it is used by the computer to build the display, i.e. as a RGB
definition (see RGB Model) expressed as a single integer code. This code
is obtained from and can be converted to its basic R, G and B components (see R,
G, B <> RGB). It is always under the form of that code that colors are
stored as object attributes, in statements such as Shade when they are saved in
a workspace WOR, or as color definitions in the Palette.
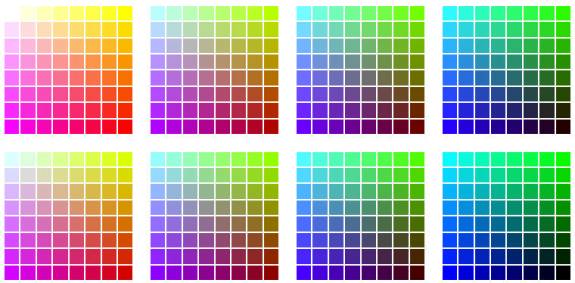
There
are however two separate circumstances in which a different color model is used
in the definition of objects or for mapping, when defining a color that is not
in the palette (custom color requester or color requester of a style definition)
or when “auto-spread” is used in a thematic definition with that option. It
is the Hue, Saturation, Value or HSV model
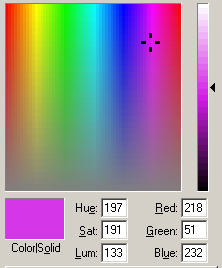
In
the first case, the user can enter the H, S, V component values instead of the
R, G, B values, but as one can see when doing it, the translation is immediately
done from one to the other system and MI will store the RGB code and not the
equivalent HSV. (see
RGB <> HSV).
In
the second context, the HSV concept is simply used to calculate colors for the
“cutting points” or categories, but the resulting colors will be stored as
RGB codes in a shade statement or in Brush variable. (see
Color auto-spread in thematic maps).
We can finally speculate on the potential use of another color model in the perspective of commercial printing. As the aim will be to create files for printing, these files must be color separated to prepare films for color transfer. Color separation is obtained by using the CMYK model but the MI user will probably see nothing more that that option as a possible output format. CMYK is a rather complex model that is generally machine controlled without any input by the user, even in some conditions partial translation is possible between models (see RGB <>
Colors are attached to objects and, in that respect, are stored independently from the palette colors offered by MI (see below details on that palette). Objects can have colors not defined in the palette and still be properly displayed. Therefore, a map prepared with a given palette can be displayed in its original colors on any MapInfo installation, whatever its color palette.
1-4
Limitation on the number of colors
As the colors
“exist” within a table, any limit will apply to the contents of that table.
If someone writes a program to generate more than 256 objects each with a
different color, MapInfo will force on the extra objects colors different from
the programmed ones on the basis of the “closest” color found in the set of
the first 256. But this limitation is not due to the programming, it is imposed
by the structure of the .MAP file itself, the file that contains all the (geo)graphic
information of the objects.
The
number of 256 applies to the number of colors in a table and not of differently
colored objects as we wrote originally for reason of simplicity. The number of
objects can indeed be well below that value, given the fact that regions can
used up to 3 colors each, one for the border (by default it is always Black,
counting for one color but possibly common to several objects), another for
foreground and the last for background.
This
constraint does not apply to the viewing of maps; a mapper can display several
tables each with 256 “colors” all different as a whole without alteration of
the colors as long as the computer installation allows that number. There was a
time when monitors could not display more than 256 colors, and that is probably
why in its early days MI adopted that limit.
Examples
of color “reduction” and of working around that limitation can be found in
“Color limitation and unlimited use”
2 - Using colors in MI
2-1
Choosing color for an object
Assigning
a color to an object is done via specialized requesters that do not require
handling RGB codes or component values if the user limits his choices to the palette
of predefined colors that MI offers. But the user is not limited to these
specific colors if he remains within the limits on the number of colors for the
table he is using, because he can redefine some of the predefined colors
temporarily for up to 15 new colors. He can also adopt more drastic measures
and change the color palette to an entirely different one.
2-2
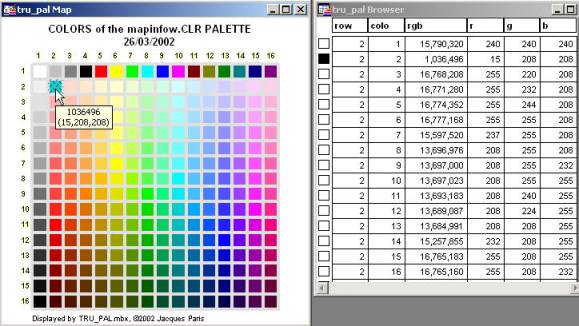
MI palette of predefined colors
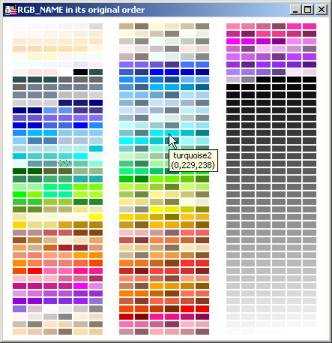
MapInfo
offers a set of 256 predefined colors. They are contained in the MAPINFOW.CLR
file located in the same directory as the program file itself.
This
number is totally independent from any hardware restriction, be it the maximum
number that can be displayed at any time on the monitor, or the number of
different shades a printer is able to produce. It is neither a limit to number
of different shades that a map, or a mapper window, can contain.
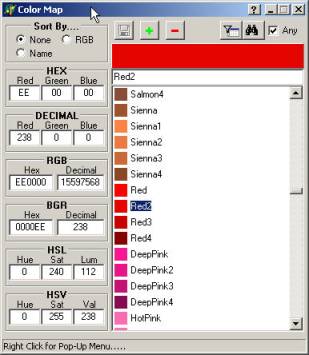
The
contents can be displayed as a color palette under two slightly different
formats
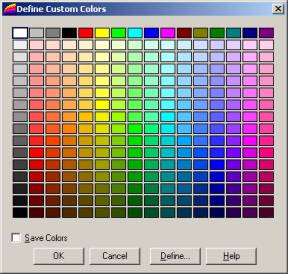
1
- via Menu Options > Custom Colors
2
- by clicking on the color bar of a style requester opened by a style button
(Draw Tool bar) or a menu command (Options > ... style). The example is for
Symbol.
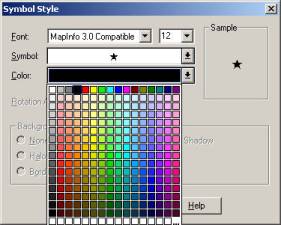
One
can notice in this format that an additional row of 15 empty cells plus a space
marked by ... at the right corner has been added at the bottom. The use of these
cells are explained below.
2-3 Redefining colors temporarily
Redefining
palette colors temporarily can be done in two different ways: with the
“Options | Custom Colors” menu item that opens a requester of the first
style above, or with a Style requester. The effects are different; with Custom
Colors, the selected colored among the 256 original palette colors is modified
and all 256 can be altered; with the Style requester a new color is added to the
palette and only 15 can be added. With both, the changes are valid only for the
on-going MI session, but if the option “Save colors” is ticked before
closing the Custom Colors requester, the palette is permanently altered. (see Using
different palettes)
No
object selected
a/
open the palette of a style requester (button or menu command),
b1/ if a color is used as a basis to modify
- select the color that could be used as a base for the new one. The palette will close.
- reopen the palette by clicking on the color bar
- click on the bottom right corner cell (with the ...)
b2/ if the color to modify is the “current” color
- open the palette by clicking on the color bar
- click on the bottom right corner cell (with the ...)
b3/
if no color is used as a basis
-
click on one of
the empty cells, if any is empty
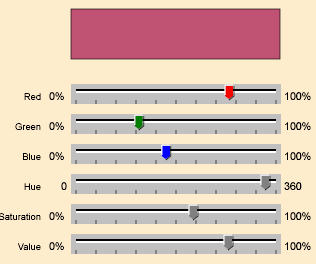
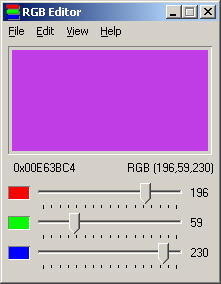
c/
redefine the color (RGB or HSV)
An
object is selected
The layer containing the object for must be editable; the color of that object will be altered.
a/
double clicking on the object opens the “object” window, then clicking on
the style button opens the requester
b/
clicking on the color bar opens the palette
c/
click on the bottom right corner cell (with the ...)
d/
redefine the color (RGB or HSV) of the selected object
In
both cases, the new color is added to the bottom row in the first empty cell
from the left. It will remain available through the rest of the session as any
of the 256 predefined, offering the possibility to use the same "new"
color for other objects. However, this bottom row of "on the fly"
colors is erased when MapInfo is closed, but during one session, the colors can
be "passed" between different layers or mappers without any
restriction.
Changes made that way to colors apply to all types of objects, to all parts of styles. New fill color is also new pen color, new font foreground and background color. There is only one palette for all the styles.
If
one redefines more than 15 colors, the next (16th) will replace the
first of the bottom row, and so on in a loop.
One
cannot clear an extra cell by redefining it “white”; it exists already.
Generally speaking, if the redefined color exists already in the palette (the
256 original colors and the “new extras” if any), it is not considered as a
new color and is not added to the bottom row.
2-4 Using different permanent palettes
The first question is generating different palettes. As far as I know “today”, MI does not offer another way but to go through the process of redefining colors one by one with the “Custom Colors” requester and saving the new palette.
The format of the MapInfoW.clr is a simple list of the colors R,G,B components. I have written a prototype program Make_Pal.mbx (offered initially for Beta testing - in col_pal_mkr.zip downloadable from here) that could be of help for building new files in the CLR format.
The second question is managing the palette. There is only one CLR file possible hat can be recognized by MI and it is read in when MI is launched. One must first adopt some “proper” naming for these files.
It is important to make first of all a copy of the original file, because any change made to it will wipe out the original definitions. Make thus a copy and name it CL0 and when the changes are made and registered, make a copy of the CLR as CL1, and so on. The CL0, CL1,... will be all your different palettes, the CLR the one in use.
Then
switching palettes requires closing MI, changing palette and reopening MI. With
the technique I am proposing, changing palettes is done in three steps:
-
deleting
mapinfow.CLR
-
making a copy
of mapinfow.CL? (the palette to use)
-
renaming the
copy mapinfow.CLR
I will just mention here the question of the localization of these files; I cannot offer a general solution, I just want to open the subject. Until version 6.5, the mapinfow.CLR file was located in the Windows directory or the Program directory. Starting with 6.5, that “appdata” file can be “installed in a ‘per user location’ and look for in other areas as well”. For network installations, a clear policy of where CLR files should be located must be formulated in order to define clearly the network domains affected by eventual palette changes and the authorization required for such changes.
3
- Working with existing colors
3-1 Recycling colors
To
use a color existing in a file displayed in a mapper, make its layer editable,
and double click on an object, select the style button and open the color bar:
the color of the object, if not present in the palette, will be added to the
bottom row, as if it were a newly created color.
Only
those colors that are identified with that procedure will be added to the
palette bottom row; there is no automatic procedure for finding all the
not-on-the-palette colors and adding them.
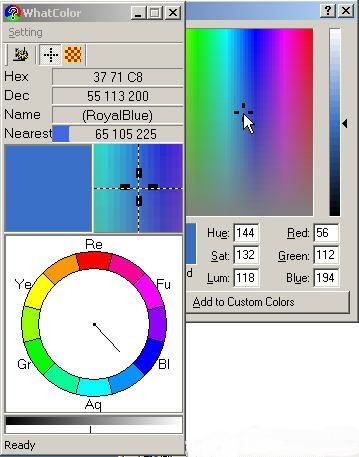
3-2 Getting information on a color
If
one wants to know the precise color definition of an object, several ways are
open to him. It is easier to obtain the full code of the color than the detailed
R, G, B components
Full code
1-
The following is a very secure but clumsy way of obtaining the numerical code of
an object
a/
select the object
b/
export selection (Menu Table >
Export > choose Selection then MapInfo Interchange)
c/
read in the .MIF file just created
Excerpt
from a MIF file, one symbol exported
.......
Point
169835.63 254853.83
Symbol (32,8224125,8)
RGB
code for the symbol = 8224125
2
- A more elaborate and probably faster way to get numerical code uses the
MapBasic window.
a/
open the MapBasic window
b/
select the object
c/
type in the following line and run it
print
styleattr(objectinfo(selection.obj,2),2)
d/
the result (the RGB code) is displayed in the message window
Warning
: The two digits have to be adapted to the type of object selected and the
information desired as follows :
2
2 symbol
color (example above)
2
4 font
foreground color
2
5 font
background color
2
4 pen
color
3
2 brush
foreground color
3
3 brush
background color
3
- To get the RGB code of the current style, using the MapBasic window, type and
run the following line that will display all the elements defining a style,
print
currentbrush()
or
currentfont() or currentpen() or currentsymbol(). The position of the code to be
extracted is different for almost each style:
pen, symbol