
Vous pouvez lire le billet sur le blog La Minute pour plus d'informations sur les RSS !
Canaux
2684 éléments (0 non lus) dans 55 canaux
-
 Décryptagéo, l'information géographique
-
Cybergeo
-
Revue Internationale de Géomatique (RIG)
-
SIGMAG & SIGTV.FR - Un autre regard sur la géomatique
-
Mappemonde
-
Imagerie Géospatiale
-
Toute l’actualité des Geoservices de l'IGN
-
arcOrama, un blog sur les SIG, ceux d ESRI en particulier
-
arcOpole - Actualités du Programme
-
Géoclip, le générateur d'observatoires cartographiques
-
Blog GEOCONCEPT FR
-
Géoblogs (GeoRezo.net)
-
Conseil national de l'information géolocalisée
-
 Geotribu
-
Les cafés géographiques
-
UrbaLine (le blog d'Aline sur l'urba, la géomatique, et l'habitat)
-
Icem7
-
Séries temporelles (CESBIO)
-
Datafoncier, données pour les territoires (Cerema)
-
Cartes et figures du monde
-
SIGEA: actualités des SIG pour l'enseignement agricole
-
Data and GIS tips
-
Neogeo Technologies
-
ReLucBlog
-
L'Atelier de Cartographie
-
My Geomatic
-
archeomatic (le blog d'un archéologue à l’INRAP)
-
Cartographies numériques
-
Veille cartographie
-
Makina Corpus
-
Oslandia
-
Camptocamp
-
Carnet (neo)cartographique
-
Le blog de Geomatys
-
GEOMATIQUE
-
Geomatick
-
CartONG (actualités)

 Géomatique anglophone
-
sur Mappery: Arab Islands in Reflection
Publié: 18 April 2024, 11:00am CEST
Stan Carey shared this mirror map.
“Mirrors in the shape of the Aran Islands at Connemara Airport, alongside Tim Robinson’s map for lo-fi comparison (below)”

MapsintheWild Arab Islands in Reflection
-
sur The American Home Values Map
Publié: 18 April 2024, 9:04am CEST par Keir Clarke
Home Values in America is a dot density map showing the self-reported value of homes across the whole United States.The map shows home values across the United States using data from the U.S. Census Bureau's 2018-2022 American Community Survey (ACS). The ACS is a large-scale survey that gathers information about the American population every year.The colored dots on the map
-
sur Paul Ramsey: Cancer 4
Publié: 18 April 2024, 2:00am CEST
Cancer is a mind fuck.
I mean, it’s a body fuck too, obviously, but the early experience for me has been of weird gyrations of mental health and mood with each passing day.
The first thing I did was the first thing everyone does – look up all the different probabilities of five year survival, because that’s what at the top of the Google search.
With a stage two diagnosis (hard to know if that’s actually what I have, though) Google says I have a 10% chance of dying over the next five years.

Now, here’s an fact – my odds of dying just in the ordinary course of affairs over the next five years are about 4.5%.
Does that stop me from being 1000% more terrified, on a daily basis, since receiving my diagnosis? No it does not.
A good deal of that terror, I think, is that cancer promises a patient a long and painful interaction with a medical system that has only destructive rear-guard actions at hand to stop it. Cut things out; kill it with poison; zap it with radiation. These procedures all leave a body worse for wear, and if they don’t work… they bring you back and do some more of them.
My great grandfather died while rolling a ball on the lawn bowling green in his late 80s. Massive stroke, he died doing something he loved and was dead before he hit the ground. Floyd Ramsey hit the mortality jackpot.
Naturally, I would also like to hit that jackpot. Cancer says, “not so fast, you might have a different life experience ahead of you”.
It would be a little too pat to say that getting a diagnosis starts you off on the stages of grief, because that implies some orderly process to the mental evolution. I am not progressing linearly through the stages of grief, so much as visiting them randomly, over and over, in an emotional shuffle mode.
Some days are denial days. Some days are acceptance days. Some days are bargaining days.
I told my councillor last week that “I only feel OK to the extent that I am dissociative”, and that seems to still hold true. I am at my most together when I have fully distracted myself from the diagnosis. I’m not sure if this counts as “taking one day at a time”. Probably not.
Talk to you again soon, on the other side, inshalla.
-
sur A recap of the 128th OGC Member Meeting, Delft, The Netherlands
Publié: 17 April 2024, 11:32pm CEST par Simon Chester
Two records were broken in Delft this March: not only was OGC’s 128th Member Meeting our biggest ever – with over 300 representatives from industry, government, and academia attending in-person (and over 100 virtual) – but the meeting also saw a record number of motions for votes on new Standards, highlighting the very productive activities undertaken by the OGC community in recent months.
Held in Delft, Netherlands from 25-28 March, 2024, OGC’s 128th Member Meeting brought together global standards leaders and geospatial experts looking to learn about the latest happenings at OGC, advance geospatial standards, and see what’s coming next. Hosted by TU Delft and sponsored by Geonovum with support from GeoCat and digiGO, the overarching theme for the meeting was GeoBIM for the Built Environment.
As well as the many Standards and Domain Working Group meetings, the 128th Member Meeting also included a Land Administration Special Session, a Geospatial Reporting Indicators ad hoc, a Data Requirements ad hoc, the OGC Europe Forum, an Observational Data Special Session, two Built Environment sessions subtitled The Future of LandInfra and What Urban Digital Twins Mean to OGC, a public GeoBIM Summit, a Quantum Computing ad hoc, and the usual Monday evening reception & networking session and Wednesday night dinner.
The dinner was held at the historic Museum Prinsenhof Delft, former residence of William of Orange, and – grimly – where he was assassinated. On a lighter note, during the dinner Ecere Corporation, represented by Jérôme Jacovella-St-Louis, received an OGC Community Impact Award for their tireless work in driving OGC Standards forward. Congratulations Ecere and Jérôme!
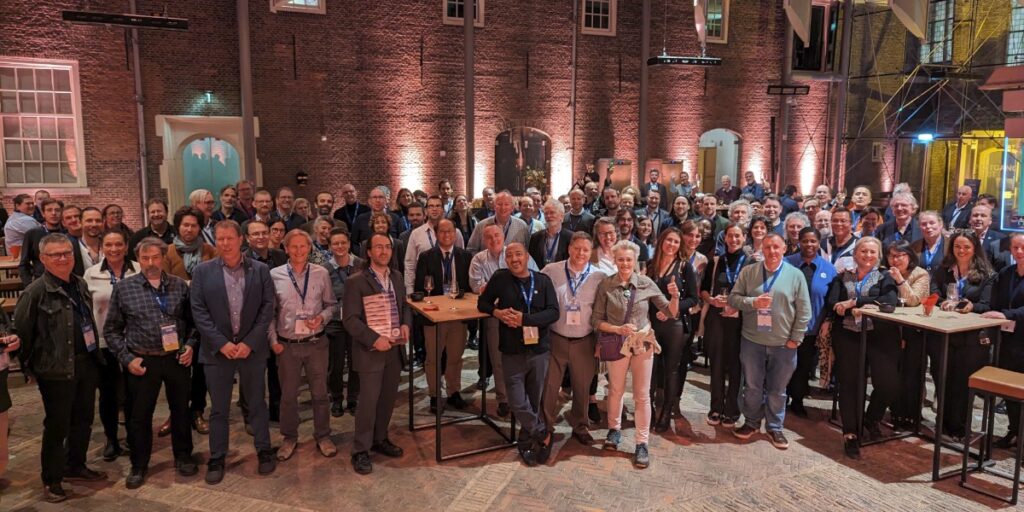 Attendees of the Wednesday night dinner at OGC’s 128th Member Meeting.
In tandem with the theme of GeoBIM, two other technology areas stood out during the meetings: Data Spaces, and the transition from OGC Web Services to OGC APIs.
Data SpacesThere has lately been a dramatic increase in the number of discussions on Data Spaces, both in and outside of OGC, as the concept becomes more commonplace in European projects and policy. As per the European Union Data Spaces Support Centre, a Data Space is defined as “an infrastructure that enables data transactions between different data ecosystem parties based on the governance framework of that data space.” In other words, the “space” in a Data Space defines a context for which the data are useful: a container, governance, and access. Given the ubiquitous use of geospatial data, directly and indirectly, an understanding of the Data Space ecosystem may be key to participate in emerging data infrastructures.
OGC Web Services to OGC API transitionThe full set of capabilities offered by the OGC Web Services Standards (e.g., Web Map Service (WMS), Web Feature Service (WFS), etc.) is now reflected in OGC API Standards that have either been published, are approaching final approval vote, or are being actively developed. Over the coming months, OGC will establish a process and resources to aid in the transition to the more modern Standards, while ensuring that the user community recognizes that the legacy web services are still functional and valuable.
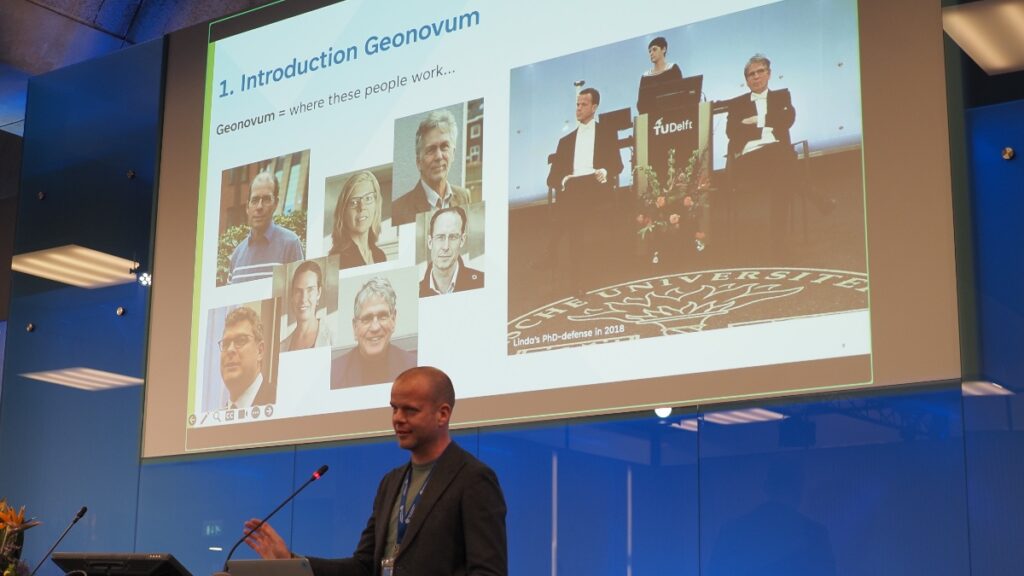 Friso Penninga, CEO of Geonovum, opens the week with an introduction to Geonoum and Delft.
Opening Session
Friso Penninga, CEO of Geonovum, opens the week with an introduction to Geonoum and Delft.
Opening Session
The week opened with a welcome from Friso Penninga, CEO of Geonovum, who outlined not only the work of Geonovum, but also the culture of Delft. Following this, Prof. Jantien Stoter of 3Dgeoinfo, TU Delft highlighted activities at TU Delft in the meeting theme area and previewed Wednesday’s GeoBIM Summit. Pieter van Teeffelen of digiGO then presented a Dutch platform for digital collaboration in the built environment. Finally, Jeroen Ticheler of GeoCat explained challenges in social welfare and the work of the GeoNetwork to address these challenges.
Next, it was time to settle a long-running dispute in OGC: who has the better chocolate, Switzerland or Belgium? After a blind taste-test, the audience voted Belgium as the winner. Is the debate now settled? Only time – and perhaps our taste buds – shall tell.
The chocolate contest was followed by a demonstration of the Netherlands Publieke Dienstverlening Op de Kaart (PDOK) geodata platform, which integrates a number of published and draft OGC API Standards.
Special tribute was then paid to two instrumental figures in OGC’s history who passed away in November 2023: Jeff de la Beaujardiere (OGC Gardels and Lifetime Achievement Awards recipient) and Jeff Burnett (former OGC Chief Financial Officer).
 Prof. Jantien Stoter of 3Dgeoinfo, TU Delft, offered a preview of Wednesday’s GeoBim Summit during the Opening Session.
Today’s Innovation, Tomorrow’s Technology, and Future Directions
Prof. Jantien Stoter of 3Dgeoinfo, TU Delft, offered a preview of Wednesday’s GeoBim Summit during the Opening Session.
Today’s Innovation, Tomorrow’s Technology, and Future Directions
As always, the popular Today’s Innovation, Tomorrow’s Technology, and Future Directions session runs unopposed on the schedule so that all meeting participants can attend. At this Member Meeting, the session was presented by Marie-Françoise Voidrot and Piotr Zaborowski of OGC’s Collaborative Solutions and Innovation Program (COSI). The session focused on several projects that OGC is participating in and are developing capabilities that will be of use to all members. Many of these projects are sponsored by the European Union to advance interoperable science and data management and are supporting OGC resources such as the OGC RAINBOW registry, GeoBIM integration, and learning and developer resources, such as the Location Innovation Academy.
OGC Members can access the presentations and a recording from the session on this page in the OGC Portal. An overview of some of the European projects highlighted during the session, entitled European Innovation, Global Impact, was published on the OGC Blog last year.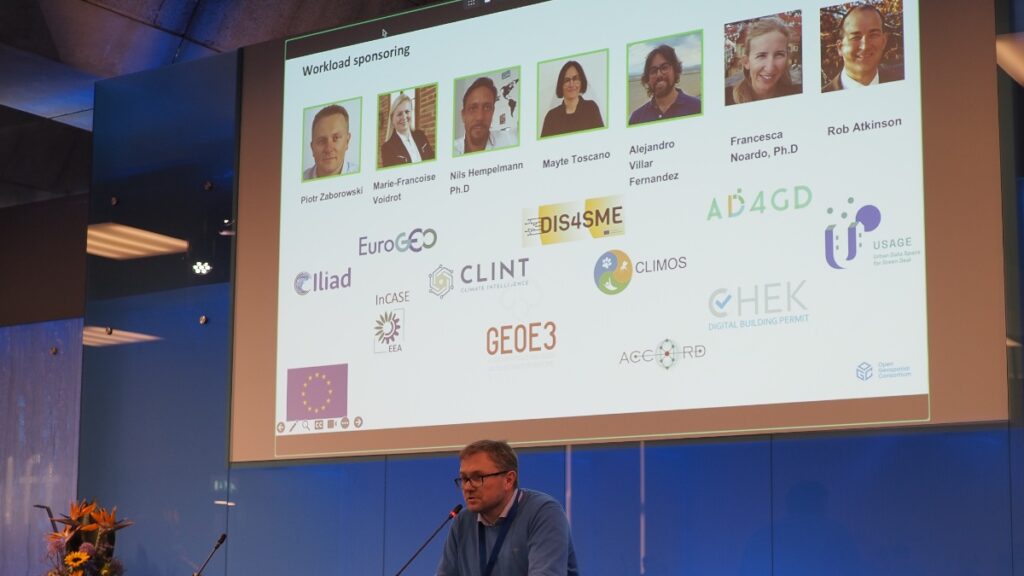 Piotr Zaborowski, Senior Director, of OGC’s Collaborative Solutions and Innovation Program, presents some of the European Union funded projects in which OGC is involved.
Meeting Special Sessions
Piotr Zaborowski, Senior Director, of OGC’s Collaborative Solutions and Innovation Program, presents some of the European Union funded projects in which OGC is involved.
Meeting Special Sessions
The Land Administration Special Session was dedicated to updating OGC membership on the progress of Land Administration activities amongst members and in ISO/TC 211, where the Land Administration Domain Model (LADM) is managed. A new Land Administration Domain Model Standards Working Group (SWG) is being considered to create Part 6 of LADM: the encoding of Parts 1-5 in one or more formats. OGC Members can access the presentations and a recording here (Session 1) and here (Session 2) in the OGC Portal.
Geospatial Reporting Indicators have been discussed in the OGC Climate Resilience Domain Working Group (DWG) in the context of Land Degradation. However, the means to exchange indicator information reporting the degree of land degradation (or influencing factors) is not standardized in the community. OGC members are therefore proposing a new SWG to develop such standardized reporting indicators, possibly as extended functionality of work in Analysis Ready Data (ARD). OGC Members can access the presentations and a recording on this page in the OGC Portal.
An ad hoc session on Geospatial Data Requirements was held to assess the chartering of a new SWG. The purpose of this proposed SWG is to develop a Standard for describing what geospatial data a project or task needs to collect, store, analyze, and present to achieve the project objectives. OGC Members can access the presentations and a recording on this page in the OGC Portal.
The OGC Europe Forum met on Tuesday with presentations focused on Data Spaces: understanding the European Commission principles of data spaces and how OGC members can engage in the topic. The Forum featured speakers from the International Data Spaces Association (IDSA), ISO/TC211, and the European Commission’s Joint Research Centre (JRC) as well as an open panel discussion. OGC Members can access the presentations and a recording on this page in the OGC Portal.
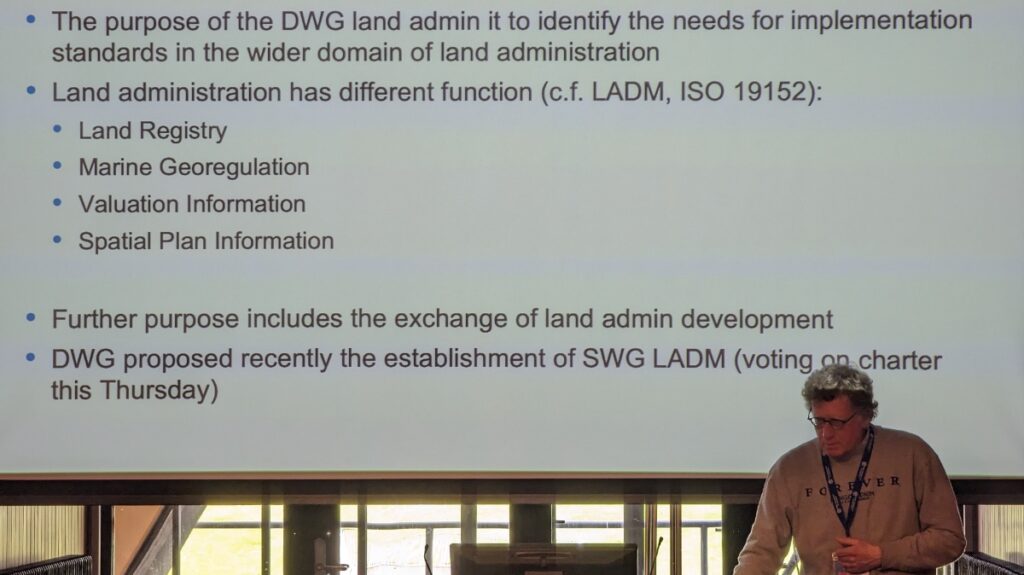 Peter van Oosterom, from TU Delft and the co-chair of the OGC Land Administration DWG, presents during the Land Administration Special Session.
The Observational Data Special Session was organized to identify the various OGC Working Groups that are building Standards or assessing the collection & use of observational data. The session clarified the commonalities between these WGs so they can be considered in future development of observational data Standards. OGC Members can access the presentations and a recording on this page in the OGC Portal.
Two sessions were held to discuss and prioritize the next steps for OGC activities concerning standardization in the Built Environment. The first of these sessions focused on the future development of the LandInfra suite of Standards: whether priority should be made on new encodings, new Parts, or other tasks. OGC Members can access the presentations and a recording on this page in the OGC Portal.
The second Built Environment session considered the topic of what Urban Digital Twins mean to OGC. Presentations on human engagement as sensors and the place for digital twins in data spaces were followed by a preview of the OGC Urban Digital Twins Discussion Paper and a panel of OGC specialists to discuss where Urban Digital Twins are most important in OGC. OGC Members can access the presentations and a recording on this page in the OGC Portal.
The public GeoBIM Summit emphasized the theme of this meeting: there is a great amount of continuity between the geospatial and Building Information Modeling (BIM) communities and their respective technologies and practices. Numerous rapid presentations highlighted activities using OGC and BIM Standards and use-cases for interoperability. OGC Members can access the presentations and a recording on this page in the OGC Portal. Presentations and recordings will soon be made available to the public on the GeoBIM Summit event page.
The Quantum Computing ad hoc session included open discussion from OGC Members working with or researching the application of quantum computing technology on geospatial issues. Future ad hoc meetings are planned to move towards the development of an OGC Quantum Computing Working Group.
Closing PlenaryThe Closing Plenary normally includes two sessions: an open discussion of Important Things suggested by members, followed by motions, votes, and presentations from members to advance the work of the Consortium. However, with the Member Meeting being compressed down to four days (as Friday was a regional holiday) the Important Things discussion was not held. As such, I opened the Closing Plenary with a rapid, 7-minute summary of the entire meeting week, which included Slides and content from a large number of the week’s Working Group sessions, available to OGC Members on this page in the OGC Portal. The Closing Plenary included a record number of motions for votes on new Standards, highlighting the very productive activities of OGC members in recent months.
Thank youOur 128th Member Meeting was our biggest yet. As always, it’s a pleasure to see hundreds of OGC Members get together to discuss, collaborate, and drive technology and standards development forward. Once again, a sincere thank you to our members for investing their time and energy, as well as their dedication to making OGC the world’s leading and most comprehensive community of location experts.
Be sure to join us at Centre Mont-Royal in Montreal, Canada, June 17-21, 2024, for our 129th Member Meeting. Registration is open now on ogcmeet.org. Sponsorship opportunities remain available – contact OGC for more info.
To receive a digest of the latest OGC news in your inbox every two weeks, be sure to subscribe to the OGC Newsletter.
The post A recap of the 128th OGC Member Meeting, Delft, The Netherlands appeared first on Open Geospatial Consortium.
-
sur Mappery: Floor Puzzle Map
Publié: 17 April 2024, 11:00am CEST
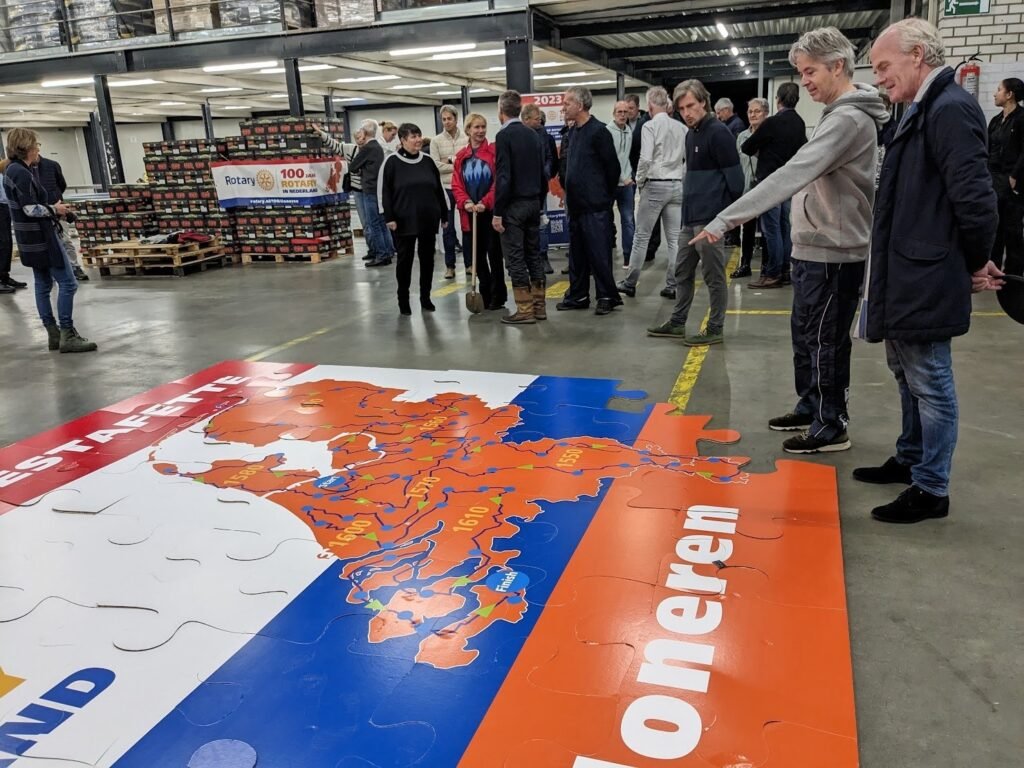
Erik shared this great puzzle map.
“100 years of #RotaryInternational in the Netherlands celebrated with a biking marathon for charity through the country. Today”
MapsintheWild Floor Puzzle Map
-
sur The 2024 Cicadapocalypse
Publié: 17 April 2024, 9:21am CEST par Keir Clarke
2024 is set to see the emergence of two large periodical cicada broods. Both Brood XIX (13-year cicada) and Brood XIII (17-year cicada), are expected to emerge together in 2024 for the first time since 1803. This double emergence has been nicknamed a "cicada-geddon" by some.Periodical cicadas are native to eastern North America. They spend most of their lives underground as nymphs, feeding
-
sur Mappery: Peaks Island Cooler
Publié: 16 April 2024, 11:00am CEST

Doug shared this “Map of Peaks Island keeping my hands warm and my beer cool.”
MapsintheWild Peaks Island Cooler
-
sur Backdrop - the Ultimate Challenge
Publié: 16 April 2024, 6:30am CEST par Keir Clarke
Backdrop Backdrop is a map based game which is somewhat similar to the very popular GeoGuessr game. However in Backdrop instead of Google Maps Street View images you have to identify the locations depicted in famous paintings by some of history's greatest artists.In GeoGuessr you can stroll around in Street View to pick-up clues as to the location that you have been dropped in. In Backdrop if -
sur Spikkin Scots
Publié: 16 April 2024, 2:00am CEST par Keir Clarke
The Shetland Dialect map allows you to listen to examples of the Shetland Dialect spoken across the Shetland Isles. The Shetland Isles are the northernmost region of the United Kingdom, Shetland, positioned between Orkney, the Faroe Islands, and Norway. Due to the isolated geography of the Shetland Isles the Shetland dialect (also called Shetlandic or auld Shetland) has continued to
-
sur Paul Ramsey: Cancer 3
Publié: 16 April 2024, 2:00am CEST
A common refrain on my Facebook cancer support groups is that the first months after diagnosis can be among the most stressful. You know the least about the actual extent of your condition, but you simultaneously know for sure that your life is going to change a great deal, starting now.
It is also the first time for grieving.
In the worst case it is grieving actual mortality, the very real threat of the end. But even in a relatively low impact diagnosis like my (current) one, there is grief. It is the grief of lost futures, lost plans, lost self-image.
I am a person who runs and climbs and rows and goes on long walks and travels and teaches and speaks publicly. At least, I was. If all goes according to plan, there will eventually be a new me, who does some or many of those things. Maybe not all of them anymore, there is no predictability or control.

Last Christmas I took my family to Rome over the holidays. “No time like the present!” I said, little knowing how apt that would be. I’m glad for everything I have done with my family. Climbing mountains, scaling cliffs, travelling afar, and even the predictable summer trips to the beach.
Some of these adventures were quite hard, and in the moment I wondered to myself “what the heck were you thinking?” In the end, I regretted none of it, and we all have lifelong memories we share.
Before she was killed by cancer, Amy Ettinger wrote:
I’ve always tried to say yes to the voice that tells me I should go out and do something now, even when that decision seems wildly impractical … Money always comes back, but if you miss out on an experience, the opportunity may never come back.
I am trying to pack as much climbing, and eating out, and walks to the cafe, and evening date nights into my life as I can, before the start of treatment. It’s too late for anything big, but these are little things that bring me joy that may become harder to do, after.

My surgery date is set now, and the procedure will mark an abrupt decline and then the start of a long slow climb back up to whatever “new normal” my body can fashion from my reconfigured plumbing. Some people have great results, some people have terrible ones.
As always, there’s no way to know, the grey area is omnipresent, which is perhaps why I sound so morose.
Talk to you again soon, inshalla.
-
sur Sean Gillies: Bear training weeks 1-8
Publié: 15 April 2024, 11:28pm CEST
The first quarter of my season has been challenging. I've had to deal with injuries and other niggles, and I'm just starting to feel better when I run. Moving forward on fitness while not being able to run very much has been an interesting problem to work on.
As I mentioned in Preason running I started my 8 week block of interval workouts with nagging knee pain. This pain continued for 6 weeks. I dealt with it by alternating outdoor runs with low-impact sessions on an elliptical or stair-stepper machine. I did one outdoor session of hill intervals and one indoor session of stair-stepper intervals every week. By the end of the block, I was doing 36 minutes of hard uphill running, and 4 hours of easier running or stepping in a week. It's not where I want to be. At least I didn't have to skimp on the hard intervals. I'm satisfied with doing as much hard running as my knee allowed, and enjoy feeling more fit.
At the end of last year, I was determined to get some physical therapy and rehabilitate my ankles and feet. I've been visiting a local clinic once a month and have been diligent about doing the recommended exercises. The therapist says that I have good range of motion in my ankles, though there is an imbalance; my right ankle has excellent mobility while the left is only better than average. My bigger problem, in the therapist's view, was that my toes and feet are weak. I needed to build muscle so that I can do toe stands easily and lift my arches. So, I've been going to the gym to build muscle three times a week. I do sets of back squats (5 x 5) for overall strength, and then do sets (3 x 10) of single-leg calf raises on a step with a kettlebell, single-leg squats with toe taps using a barbell and band around my thighs, and single-leg deadlifts with dumbbells. The Three Amigos, as I've been calling these single-leg exercises, have been working for me. My feet and lower legs are stronger and their imbalances are getting ironed out. I feel almost equally good with the deadlifts now, wobbling just one time out of ten, at most, on my left leg. The therapist has me progressing to single-leg jumping now, and I'm feeling better balance with the new exercises, too.
Consistent strength training, conservative running, and changing the way I sit at work seem to have let my knee recover. I'm standing, sitting on a stool, and reclining more when I work, using a conventional office chair less, and at maximum height when I do.
A radiology visit in December revealed that I'm developing a bone spur on my right heel. I wonder if this is yet another symptom of imbalance in my feet and legs, more stress on my right foot caused by favoring my weaker left? I'm getting some consultation on this and meanwhile am icing regularly. Two weeks ago I had to stop running for 3 days to treat aggravation of my right sciatic nerve. It was a good reminder to be more diligent about stretching and foam rolling. Otherwise, I'm doing pretty well. Heart palpitations are behind me. I'm eating and sleeping well, keeping sinus infections at bay, and enjoying longer days and generally nice spring weather.
I'm grateful to be able to continue training and am looking forward to a productive block of tempo running.
-
sur Mappery: Can you guess where this fingerpost is?
Publié: 15 April 2024, 12:00pm CEST

Harel Dan shared this pic with me. Can you guess where it is? Scroll down to find out.

Harel explained “The uniquely American passion for copying other placenames from every corner of the world, led to there being all these places within a few hundred miles of each other in the state of Maine. Someone was clever enough to make a tourist trap out of it.”
MapsintheWild Can you guess where this fingerpost is?
-
sur GeoGuessr for Art
Publié: 15 April 2024, 8:09am CEST par Keir Clarke
Calling all art sleuths and geography buffs! There's a new game in town that will test your knowledge of both the artistic and the actual world. Buckle up, because Backdrop is here to take you on a virtual journey through the works of the world's most famous artists.Inspired by the wildly popular GeoGuessr, Backdrop throws you into the heart of stunning landscapes and iconic cityscapes, all
-
sur Mappery: Compass Coffee
Publié: 14 April 2024, 12:00pm CEST
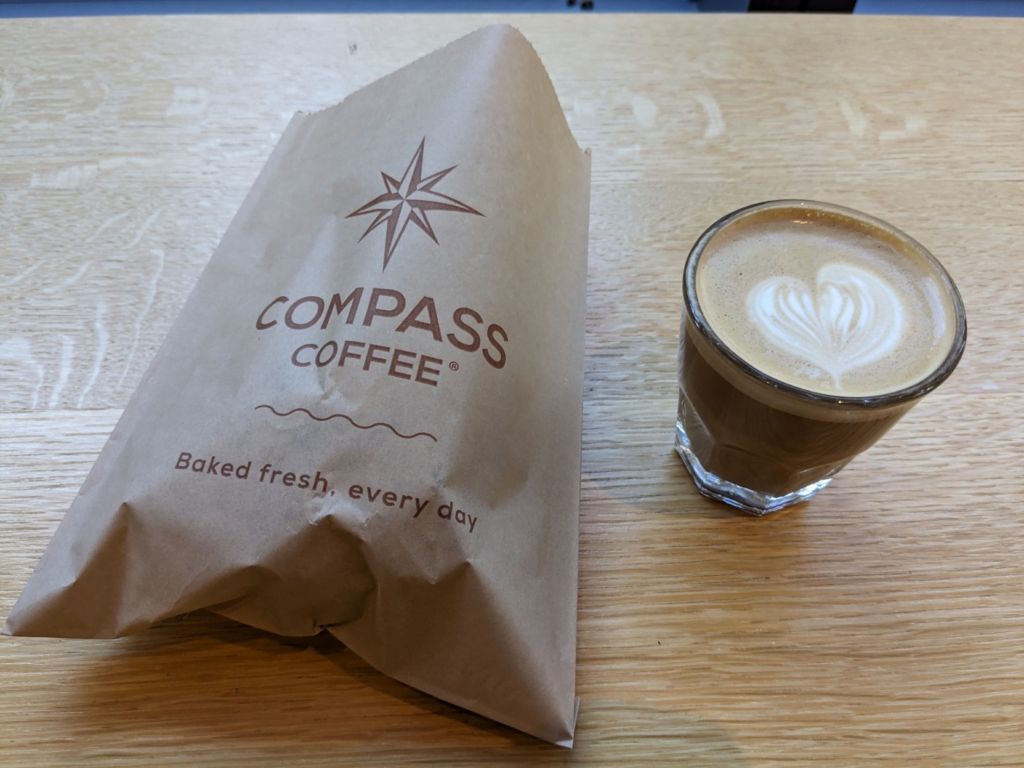
Another one from Erik’s US trip
I know that some will complain about the cardinal points not being a map but we have had them before and if you want to go ultra geek you could probably visualise a country outline in a weird projection in the coffee.
MapsintheWild Compass Coffee
-
sur Paul Ramsey: Cancer 2
Publié: 14 April 2024, 2:00am CEST
Before I joined the population of fellow cancer travellers, I had the same simple linear understanding of the “process” that most people do.
You get diagnosed, you get treatment, it works or it doesn’t.
What I didn’t appreciate (and this will vary from cancer to cancer, but my experience is with colorectal) is how little certainty there is, and how wide the grey areas are.
Like, in my previous post, I said I was “diagnosed” with cancer. Which maybe made you think I have it. But that’s not how it works. I had a colonoscopy, and a large polyp was removed, and that polyp was cancerous, and a very small part of it could not be excised. So it’s still in me.
Do I have cancer? Maybe! I have a probability of having live cancer cells in me that is significantly higher than zero. But not as high as one.

How bad is what I have? This is also a game of probabilty. Modern technology can shave off the edges of the distribution, but it can’t quite nail it down.
A computed tomography (CT) scan didn’t show any other tumors in my body, so that means I probably don’t have “stage 4” (modulo the resolution of the scan), which is mostly incurable (though it can be manageable), where the cancer has managed to spread outside the colon.
An MRI didn’t show any swollen lymph nodes, which means I maybe do not have “stage 3”, which requires chemotherapy, because the cancer has partially escaped the colon. But MRI results are better at proving rather than disproving nodal involvement and people report having surgical results that run counter to the MRI all the time.
That leaves me (theoretically) at “stage 2”, looking at a surgical “cure” that involves removing the majority of my rectum and a bunch of lymph nodes. At that point (after the major life-altering surgery!) the excised bits are sent to a pathologist, and the probability tree narrows a little more. Either the pathologist finds cancer in the nodes (MRI was wrong), and I am “upstaged” to stage 3 and sent to chemotherapy, or she doesn’t and I remain a stage 2 and move to a program of monitoring.
In an exciting third possibility, the pathologist finds no cancer in the lymph nodes or the rectum, which means I will have had major life-altering surgery to remove… nothing dangerous. My surgeon says I should find this a happy result (no cancer!) which is probably because he’s seen so many unhappy results, but it’s a major surgery with life-long side effects and I would do almost anything to not have to have it.
Amazingly, despite our modern technology there’s just no way to know for sure if there are still live cancer cells in me short of taking the affected bits out and doing the pathology. Or waiting to see if something grows back, which is to flirt with a much worse prognosis.
Monitoring will be regular blood tests, annual scans and colonoscopies for several years, as the probability of recurrence slowly and asymptotically moves toward (but never quite arrives at) zero. And all those tests and procedures have their own error rates and blind spots.
There are no certainties. All the measuring and cutting and chemicals, and I will still have not driven the cancer entirely out, it will stubbornly remain as a probability, a non-zero ghost haunting me every year of the rest of my hopefully long life.

And of course worth mentioning, I am getting the snack-sized, easy-mode version of this experience! People in stage three or stage four face a probability tree with a lot more “and then you probably die in a few years” branches, and the same continuous reevaluation of that tree, with each new procedure and scan, each new discovery of progression or remission.
Talk to you again soon, inshalla.
-
sur Mappery: The Pieces of London
Publié: 13 April 2024, 11:00am CEST

We all love a map jigsaw, well at least Harry Woods and I do. Here’s Harry making a jigsaw map of London that was made from OpenStreetMap.
I guess you could make a jigsaw of your favourite location, could be one for my friends at SplashMaps.
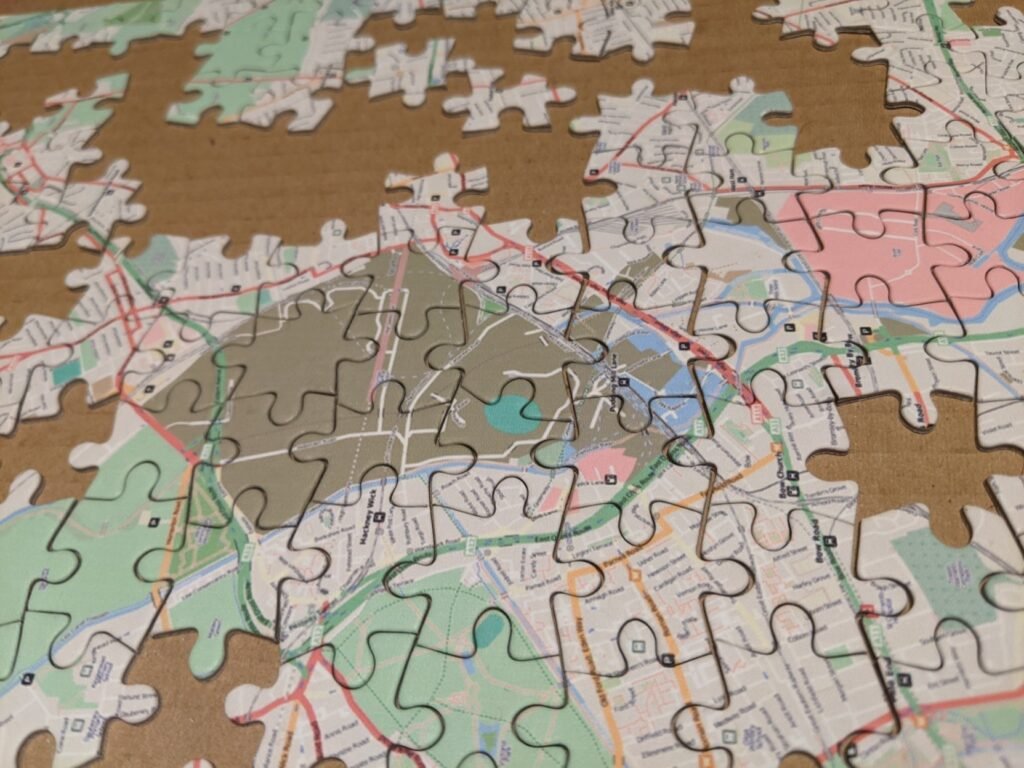

MapsintheWild The Pieces of London
-
sur The AI Music Map
Publié: 13 April 2024, 10:07am CEST par Keir Clarke
Over the last few days my Twitter feed has been lit up by people sharing the songs that they have created on Udio. For the one or two cave dwellers out there who have only just installed spelunking wi-fi, Udio is an AI-powered music generation tool which allows users to create songs from a text prompt. The tool allows you to create tunes with customized lyrics, vocal styles, and musical
-
sur gvSIG Batoví: Participante en concurso Proyectos de Geografía con estudiantes y gvSIG Batoví seleccionado para el programa ICT Training for Colombian Teachers 2024
Publié: 12 April 2024, 9:24pm CEST
 logo del proyecto
Es con gran placer que informamos que el equipo ganador por Colombia de la edición 2023 del concurso Proyectos con Estudiantes y gvSIG Batoví fue seleccionado para el Programa de entrenamiento en el uso pedagógico de las TIC – Convocatoria 2024

Como resultado, el proyecto viaja a Corea del Sur.
Postulación al programa ICT Training for Colombian Teachers 2024: Estrategia desarrollo sostenible, turismo y cartografia en Choachí.Nos llena de orgullo saber que la iniciativa del Curso – Concurso Geoalfabetización mediante la utilización de Tecnologías de la Información Geográfica (que en el año 2023 tuvo por primera vez participantes fuera de Uruguay) permita que un proyecto desarrollado en Colombia (y que ameritó haber sido declarado ganador del concurso) dé a conocer la experiencia aún más internacionalmente.
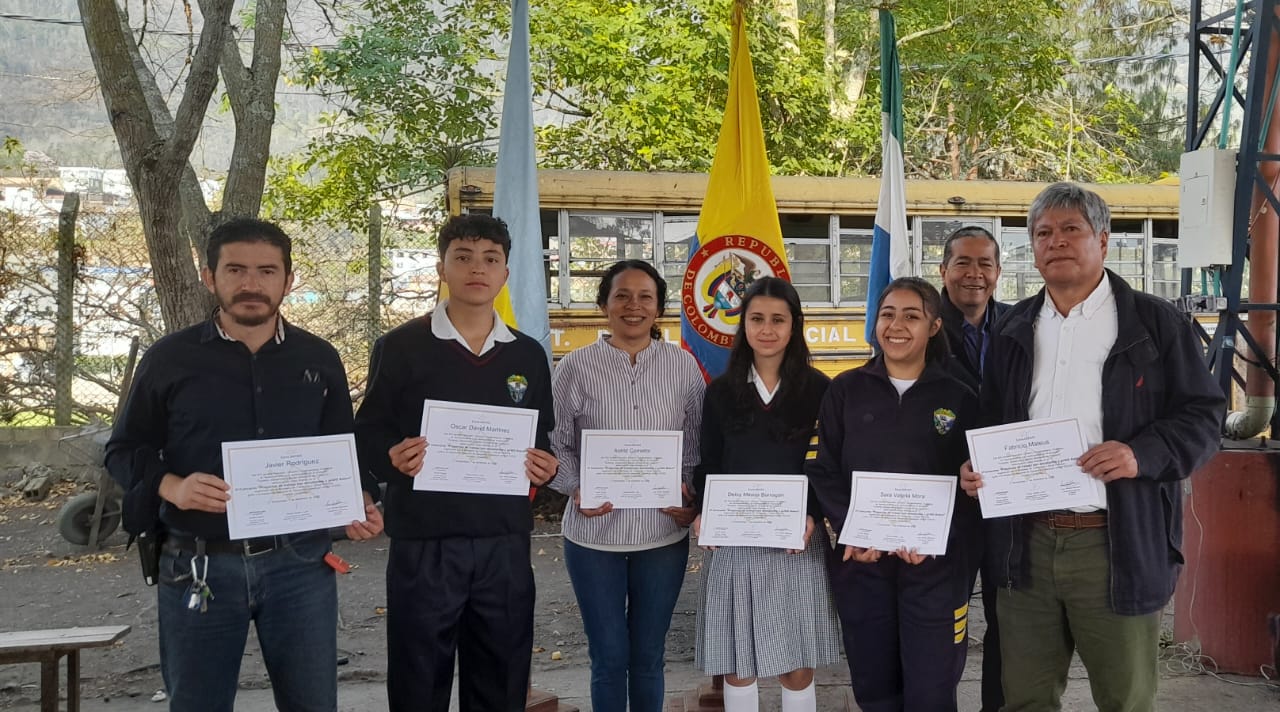
 el equipo colombiano ganador con los diplomas del concurso Proyectos de Geografía con estudiantes y gvSIG Batoví
Felicitamos a la profesora Astrid Corredor por el logro obtenido. Estos resultados son los que nos convencen cada día de continuar con la iniciativa del curso-concurso para seguir difundiendo el uso de las Tecnologías Libres de Información Geográfica como herramientas de enseñanza y de generación de conocimiento.
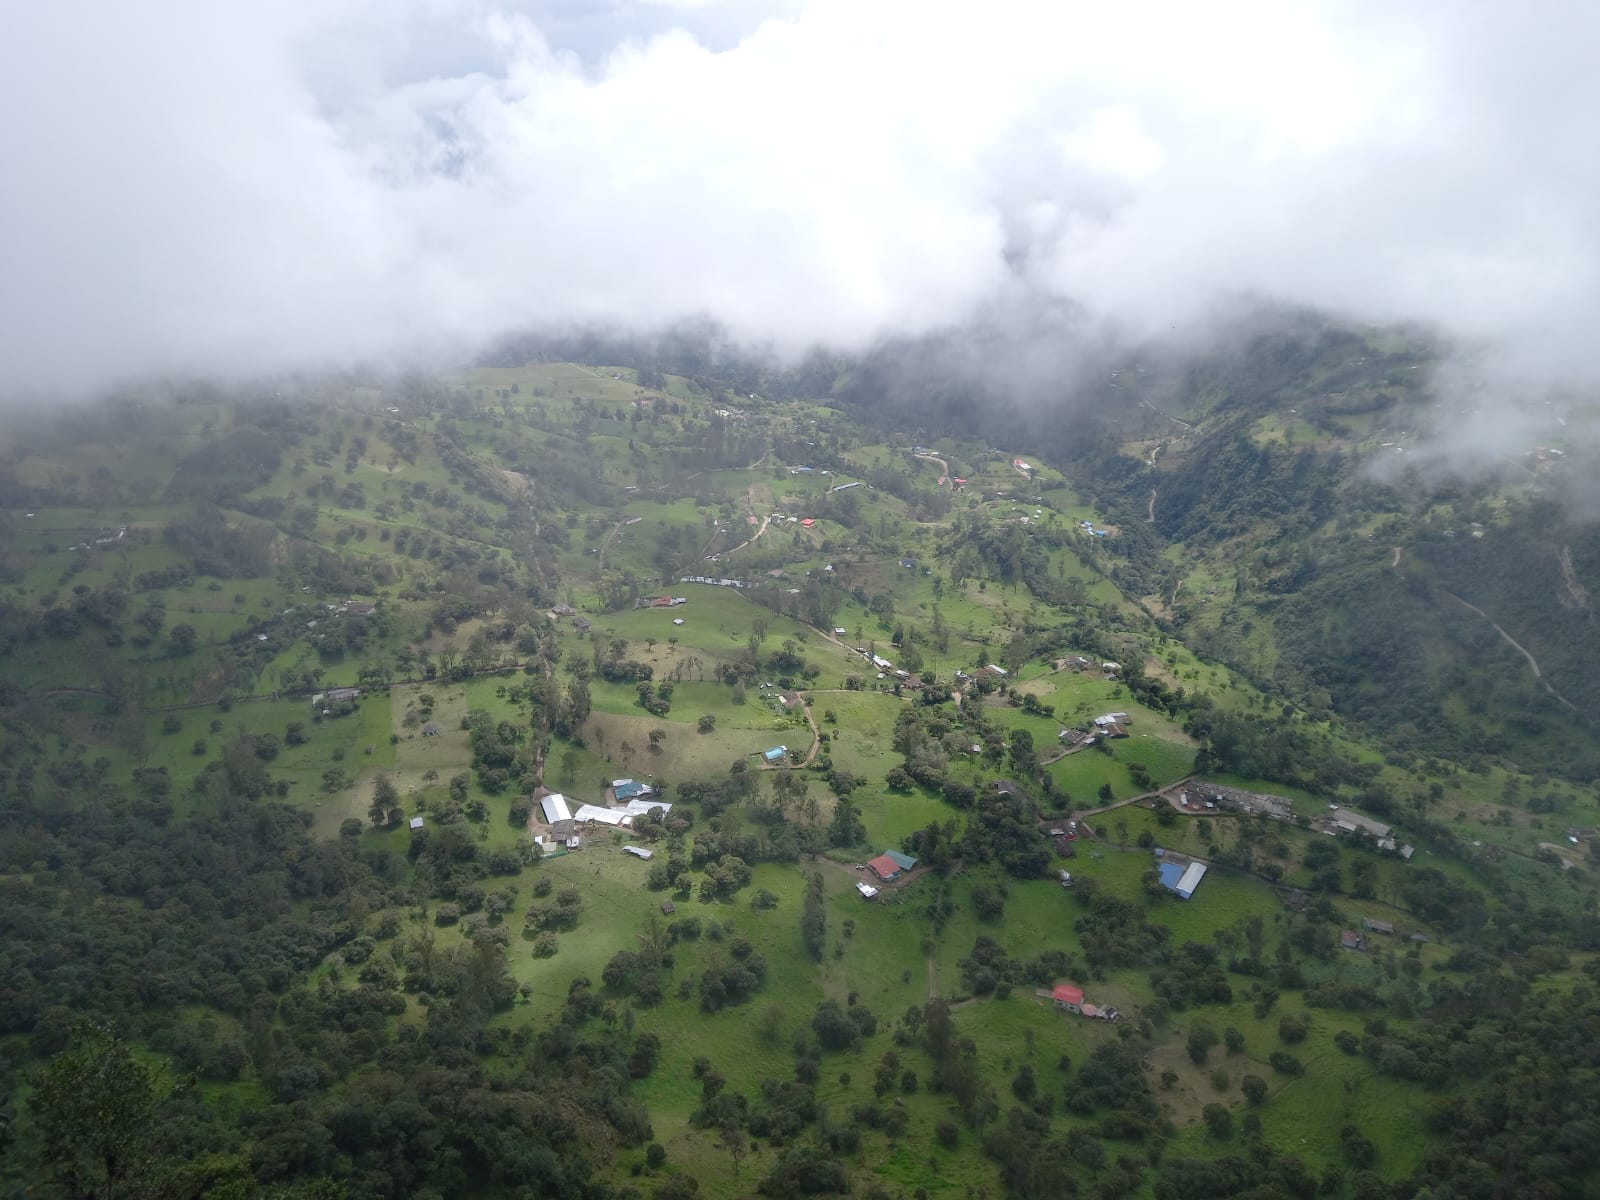
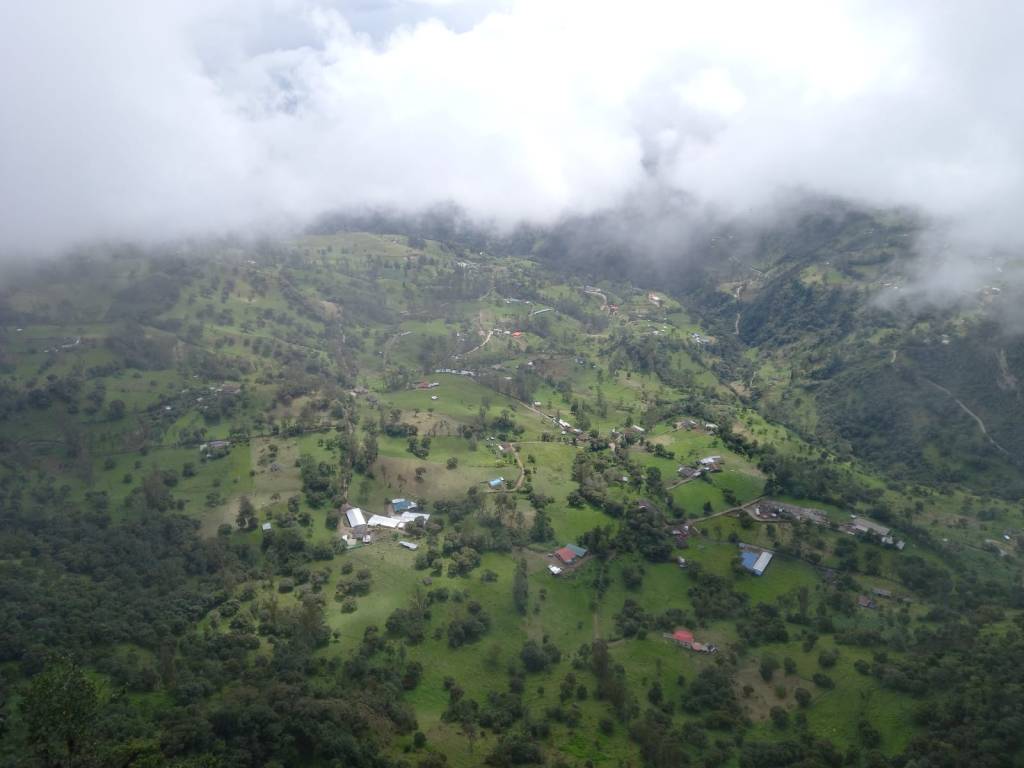 vista del municipio de Choachí desde el páramo
 -
sur Mappery: Great Lakes Drainage Basin Map Umbrella
Publié: 12 April 2024, 11:00am CEST
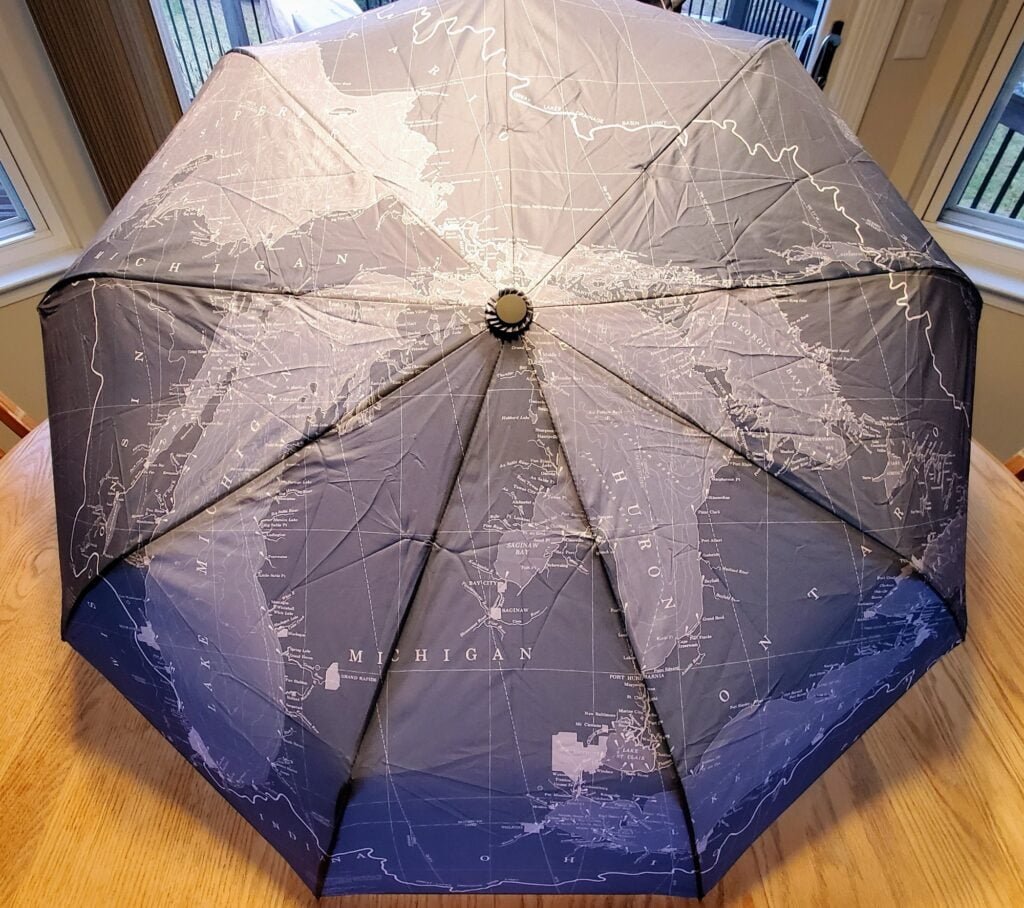
Matt Malone was one happy geographer when he got this umbrella for Christmas.
MapsintheWild Great Lakes Drainage Basin Map Umbrella

-
sur The 2024 Submarine Cable Map
Publié: 12 April 2024, 8:36am CEST par Keir Clarke
Every year the telecommunications company Telegeography releases a new, updated version of its Submarine Cable map. This map shows all the undersea telecommunication cables which carry data around the world.The 2024 Submarine Cable Map is now available. Subsea cables carry telecommunication signals under the oceans, communicating information between different countries and regions of the
-
sur Mappery: As Strong as Worcester Sauce
Publié: 11 April 2024, 11:00am CEST

Harry Wood spotted this on the Archway Road in north London. I’m guessing that this is a removal van with some strong people but the connection to Worcester Sauce baffles me
MapsintheWild As Strong as Worcester Sauce
-
sur Mapping Conflicts Around the World
Publié: 11 April 2024, 2:00am CEST par Keir Clarke
In 2024 the specter of military conflicts haunts the world. Israel is engaged in conflict in Gaza, Russia continues its illegal invasion of Ukraine and the Syrian civil war is now in its thirteenth year. It should be a matter of extreme shame that there are so many organizations who feel the need to publish interactive maps dedicated to tracking the progress of military action around the globe.
-
sur Paul Ramsey: Cancer 1
Publié: 10 April 2024, 6:00pm CEST
A little over a month ago, three days after my 53rd birthday, I received a diagnosis of rectal cancer. Happy birthday to me.
Since then, I have been wrestling with how public to be about it. I have a sense that writing is good for me. But it also keeps like milk. I wrote most of this a couple weeks ago and my head space has already evolved.
So writing like this is mostly a work of self-absorption (I’m sure you can forgive me) but hopefully it also helps to raise awareness amongst the cohort of people who might know me or read this.
Colorectal cancer rates are going up, and the expected age of occurance is going down. Please get screened. No matter your age, ask your clinician for a “FIT test”. If you’re over 45, just ask for a colonoscopy, the FIT test isn’t perfect.
I have a pretty good prognosis, mostly because my case was caught by screening, not by experiencing symptoms bad enough to warrant a trip to the doctor. Most of the people who get diagnosed after showing symptoms have it worse than I, and will have a longer, harder road to recovery. Get screened.
Our language of cancer borrows a bit from the language of contagion. I “got” cancer. It’s not quite a neutral description, there’s a hint of agency in there, maybe I did something wrong? This article drives me crazy, the author “went vegan and became a distance runner” after his father died of colorectal cancer.
Sorry friend, cancer is not something you “get”, and it’s not something you can opt out of with clean living. It’s something that happens to you. Take it from this running, cycling, ocean rowing, rock climbing, healthy eater – driving down the marginal probability of cancer (and heart disease (and depression (and more))) with exercise and diet is its own reward, but you are not in control. When cancer wants you, it will come for you.

This is why you should get screened (right?). It’s the one way to proactively protect yourself. The amazing thing about a colonoscopy is, not only can it detect cancer, but it also prevent it, by removing pre-cancerous polyps. It’s possible that screening could have prevented my case, if I had been screened a few years earlier.
I am now a denizen of numerous Facebook fora for fellow travellers along this life path, and one of the posts last week asked “what do you think cancer taught you”? I am a little too early on the path to write an answer myself, but one woman’s answer struck me.
She said it taught her that control is an illusion.
Before, I had plans. I could tell you I was going to go places, and do things, and when I was going to do them, next month, next season, next year. I was in control. Now, I can tell you what I will be doing next week. Perhaps. The rest is in other hands than mine.
Talk to you again soon, inshalla.

-
sur Mappery: The World in a Coffee Shop
Publié: 10 April 2024, 11:00am CEST

Irdi spotted this in the STOA coffee shop in Tirana. I’m not sure what the map is showing, but it’s fun
MapsintheWild The World in a Coffee Shop
-
sur Canada's Hidden Subterranean Rivers
Publié: 10 April 2024, 10:35am CEST par Keir Clarke
Canadian cities, like many cities around the world, have a history of hiding waterways underground. As cities grow rivers can become obstacles to the movement of people, can be seen as wasted real-estate, and historically (when cities had poor sanitation) they often became open sewers. For these reasons cities often culvert and divert rivers underground.In Discover Where Ancient Rivers Flow CBC
-
sur Mappery: The Luggage That You Just Have to Have
Publié: 9 April 2024, 11:00am CEST

Raf spotted this beautiful luggage in a store in Takeshita Street in Tokyo
MapsintheWild The Luggage That You Just Have to Have
-
sur 15 Minute US Cities
Publié: 9 April 2024, 9:59am CEST par Keir Clarke
The idea of the 15 Minute City is that urban living is much more enjoyable and sustainable when all our essential needs are close by. These essential needs include such things as grocery stores, health care facilities, cultural attractions, transit stops, educational facilities and leisure activities. Individuals living in a 15 Minute neighborhood should be able to access all these essential
-
sur OPENGIS.ch: Status of Cloud Optimized Geospatial Formats
Publié: 9 April 2024, 7:04am CEST

Cloud-optimized formats are changing how we handle geospatial data, making it easier to access and work with large datasets directly in the cloud. These formats reduce the need to download entire datasets, facilitating quicker and more focused data analysis and visualization. For those interested in the specifics of these advancements, our recent Cloud Optimized Geospatial Formats – Status Report, offers an introduction into the topic, recommendations for usage and an overview of promising formats.
Within this project, we also released a sample of various tiles downloaded from swissSURFACE3D as a single cloud optimized point cloud file and made it accessible also via a potree powered web viewer that demonstrates how one single file can be used for visualization in the web and making accessible for applications like QGIS and QField via the direct access URL .

I would like to thank GeoStandards.ch and SGS to allow us working on this.
We’re keen to hear from you as well. Please share your experiences or additional insights and formats in the comments.
-
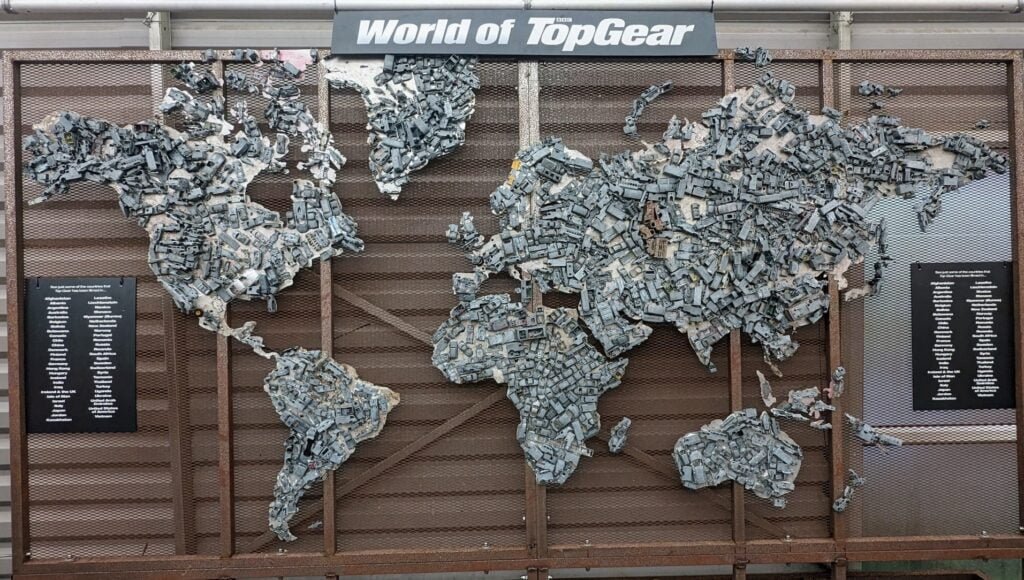
sur Mappery: The World of Top Gear
Publié: 8 April 2024, 11:00am CEST
-
sur longwayaround.org.uk: Sorting lines in (Neo)Vim
Publié: 8 April 2024, 9:45am CEST
The built-in Vim
:sortcommand supports sorting either all lines in a buffer or a range of lines.For example to sort a range of lines it's possible to visually select those lines then run
:sort.Help docs can be accessed via
:help :sortand can be viewed online via …
-
sur Live from the Sundhnúkur Eruption
Publié: 8 April 2024, 9:08am CEST par Keir Clarke
The Reykjanes peninsula in Iceland has been experiencing a period of heightened volcanic activity since December 2023. This follows an increase in seismic activity that began in late 2019. The most recent eruption started on March 16th in Sundhnúkur near the town of Grindavík.You can view a live webcam of volcanic activity in Sundhnúkur on Live from Iceland. This webcam shows a live
-
sur Mappery: Giant Relief Map, Why Not?
Publié: 7 April 2024, 11:00am CEST
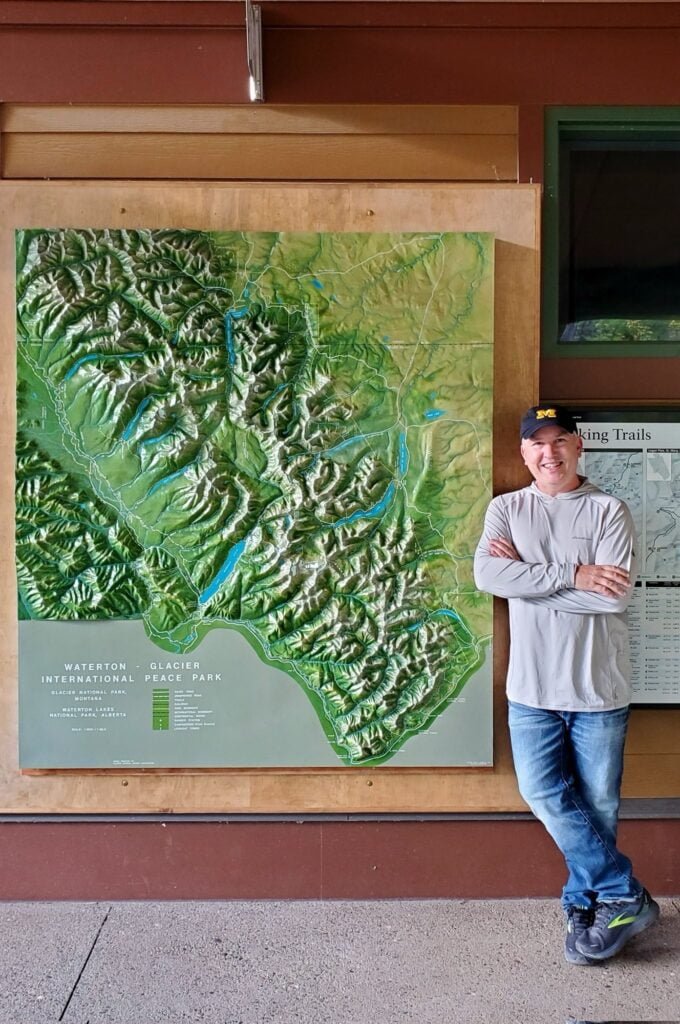
Matt Malone spotted this relief map at Waterton Glacier in Montana. He said “”Do you want your pic taken by the giant map?” isn’t really even a legit question for a geographer.”
MapsintheWild Giant Relief Map, Why Not?
-
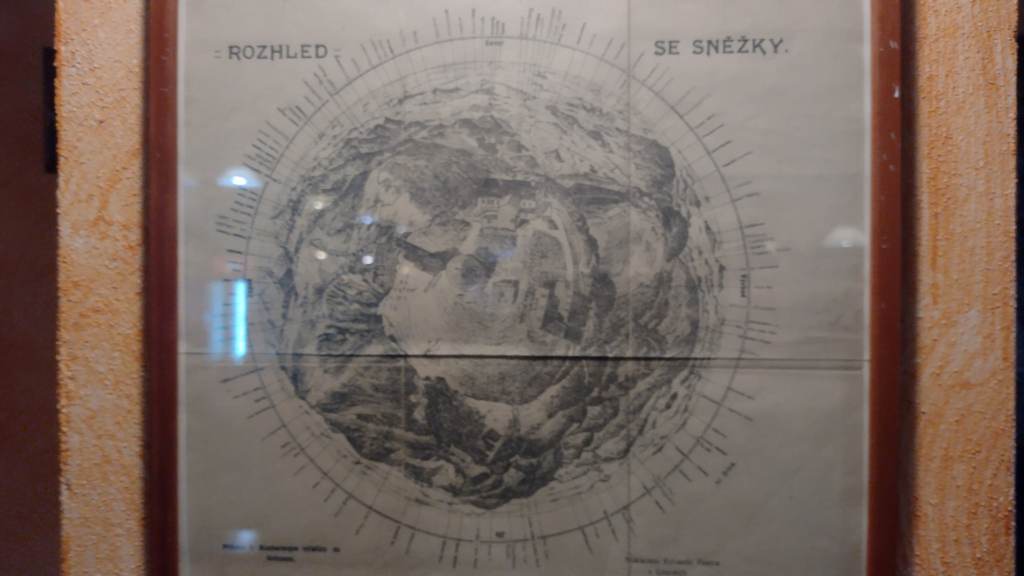
sur Mappery: L’aéropostale
Publié: 6 April 2024, 12:00pm CEST

As I get one year wiser, I want to share something from my past. I used to live in Toulouse, in the southwest part of France. Property development is huge there, but sometimes, in the middle of the new neighbourhood, we keep remains of the past. The map in Montaudran shows the former starting point of the postal service l’aéropostale. The short part of the runway is preserved during this ongoing Uban renewal.
The area will host the Aeroposace campus, which will be the future base of the Galileo satellite navigation system.
Below is a picture of the runway from Wikipedia:
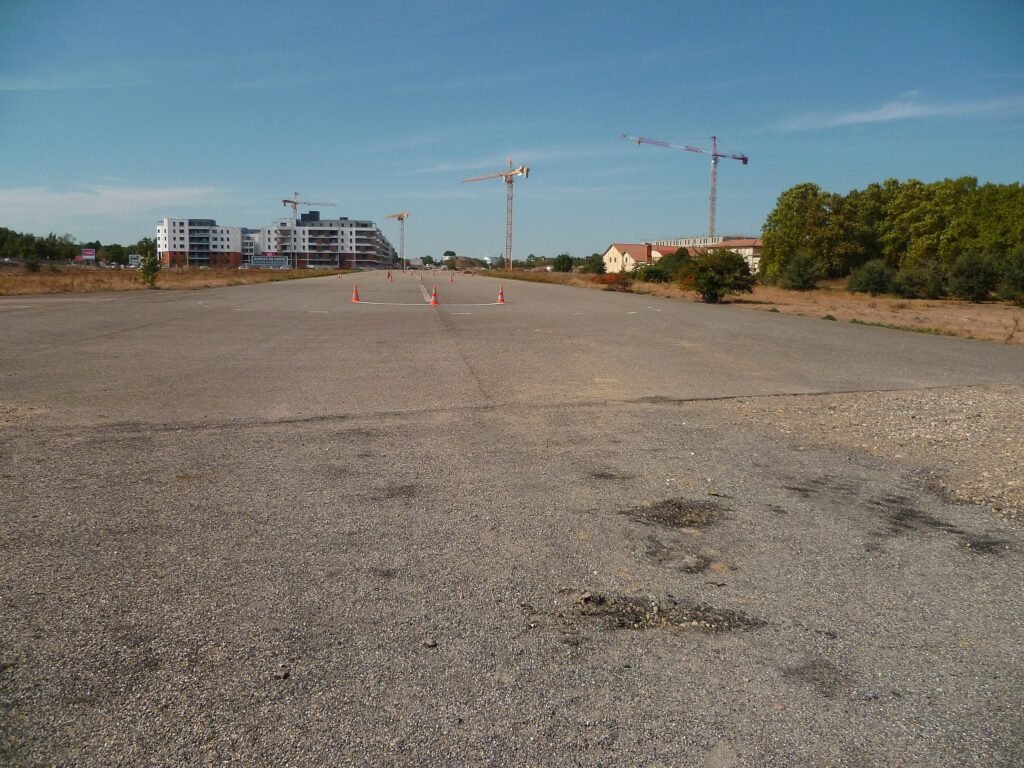
And the next one taken in 2023

MapsintheWild L’aéropostale
-
sur The D-Day Memorial Map
Publié: 6 April 2024, 8:52am CEST par Keir Clarke
KilRoyTrip is an interactive map of World War II memorials in Normandy. It provides a fantastic guide to anyone visiting the region who is interested in the D-Day landings and the liberation of France.The Allied invasion of Normandy on D-Day Tuesday, 6 June 1944 was the largest seaborne invasion in history. On D-Day the Allied forces from the United States, Britain, Canada, and other countries -
sur The US Foreign Assistance Map
Publié: 5 April 2024, 11:16am CEST par Keir Clarke
The US government's Foreign Assistance website provides detailed information and data on U.S. foreign assistance programs. The website serves as a central platform for transparency and accountability in U.S. foreign aid efforts. It also provides a fascinating insight into the shifting geo-political ambitions of the United States over the last 75 years.The Foreign Assistance Dashboard reveals
-
sur Mappery: Immersive Background
Publié: 5 April 2024, 11:00am CEST

Raf shared this “Nice use of maps as background at Sorolla immersive exhibition at Casa Amatller in Barcelona”
MapsintheWild Immersive Background
-
sur Mappery: Bliss Lane
Publié: 4 April 2024, 12:00pm CEST

Elizabeth sent me these pics of the signs for Bliss Lane in Old Tapovan, you may need to zoom in on the image below to see all of the detail. There is a helpful arrow pointing you towards the Ganges

Makes me want to go back to India
MapsintheWild Bliss Lane
-
sur OPENGIS.ch: QField 3.2 “Congo”: Making your life easier
Publié: 4 April 2024, 9:58am CEST
Focused on stability and usability improvements, most users will find something to celebrate in QField 3.2
Main highlights
This new release introduces project-defined tracking sessions, which are automatically activated when the project is loaded. Defined while setting up and tweaking a project on QGIS, these sessions permit the automated tracking of device positions without taking any action in QField beyond opening the project itself. This liberates field users from remembering to launch a session on app launch and lowers the knowledge required to collect such data. For more details, please read the relevant QField documentation section.

As good as the above-described functionality sounds, it really shines through in cloud projects when paired with two other new featurs.
First, cloud projects can now automatically push accumulated changes at regular intervals. The functionality can be manually toggled for any cloud project by going to the synchronization panel in QField and activating the relevant toggle (see middle screenshot above). It can also be turned on project load by enabling automatic push when setting up the project in QGIS via the project properties dialog. When activated through this project setting, the functionality will always be activated, and the need for field users to take any action will be removed.
Pushing changes regularly is great, but it could easily have gotten in the way of blocking popups. This is why QField 3.2 can now push changes and synchronize cloud projects in the background. We still kept a ‘successfully pushed changes’ toast message to let you know the magic has happened

With all of the above, cloud projects on QField can now deliver near real-time tracking of devices in the field, all configured on one desktop machine and deployed through QFieldCloud. Thanks to Groupements forestiers Québec for sponsoring these enhancements.
Other noteworthy feature additions in this release include:
- A brand new undo/redo mechanism allows users to rollback feature addition, editing, and/or deletion at will. The redesigned QField main menu is accessible by long pressing on the top-left dashboard button.
- Support for projects’ titles and copyright map decorations as overlays on top of the map canvas in QField allows projects to better convey attributions and additional context through informative titles.

The QFieldCloud user experience continues to be improved. In this release, we have reworked the visual feedback provided when downloading and synchronizing projects through the addition of a progress bar as well as additional details, such as the overall size of the files being fetched. In addition, a visual indicator has been added to the dashboard and the cloud projects list to alert users to the presence of a newer project file on the cloud for projects locally available on the device.
With that said, if you haven’t signed onto QFieldCloud yet, try it! Psst, the community account is free

The creation of relationship children during feature digitizing is now smoother as we lifted the requirement to save a parent feature before creating children. Users can now proceed in the order that feels most natural to them.
Finally, Android users will be happy to hear that a significant rework of native camera, gallery, and file picker activities has led to increased stability and much better integration with Android itself. Activities such as the gallery are now properly overlayed on top of the QField map canvas instead of showing a black screen.
-
sur The Drug Map of Europe
Publié: 4 April 2024, 8:49am CEST par Keir Clarke
Cocaine use has been increasing rapidly in Europe over the last seven years. Europeans are also taking more MDMA and ketamine. Every year the European Monitoring Centre for Drugs and Drug Addiction (EMCDDA) undertakes an annual wastewater drug survey in order to evaluate trends in the consumption of 'recreational' drugs. By analyzing residues of different recreational drugs in sewage the EMCDDA
-
sur GeoServer Team: How to style layers using GeoServer and QGIS
Publié: 4 April 2024, 2:00am CEST
GeoSpatial Techno is a startup focused on geospatial information that is providing e-learning courses to enhance the knowledge of geospatial information users, students, and other startups. The main approach of this startup is providing quality, valid specialized training in the field of geospatial information.
( YouTube | LinkedIn | Facebook | X )
Using GeoServer and QGIS to style a layerIn this session, we will explore “How to style layers using GeoServer and QGIS” to produce beautiful maps. If you want to access the complete tutorial, simply click on the link
Introduction
Geospatial data has no intrinsic visual component and it must be styled to be visually represented on a map. By default, GeoServer uses a markup language called Styled Layer Descriptor (SLD) to define styling rules for displaying data. SLD is an XML-based language that allows users and software to control the visual portrayal of geospatial data. This language ensures that clients and servers can both understand how to render the data visually.
Note. This video was recorded on GeoServer 2.20.0, which is not the most up-to-date version. Currently, versions 2.24.x and 2.25.x are supported. To ensure you have the latest release, please visit geoserver.org and avoid using older versions of GeoServer.
Add a StyleTo add a new style, navigate to the Data > Styles page, then click on the Add a new style link. You will be redirected to the new style page, which is the same as the Style Editor Data tab.
This tab includes basic style information, the ability to generate a style and legend details. It has some mandatory basic style information, such as:
- Name: It’s the name of the style and it must be a unique name.
- Workspace: Styles can be inside workspaces which causes restrictions. In other words, the styles in a workspace can only be assigned to the services of that, and other services outside it, cannot use these styles. Styles also can be “global” or no workspace, so they don’t have any restrictions and services can be used for all suitable styles.
- Format: Default options are SLD and ZIP formats. To use other formats such as CSS and YSLD, you should download and install extensions. Make sure to match the version of the extension to the version of the GeoServer.
The “Style Content” area provides options for creating, copying, or uploading a style. It has three options:
- Generate a default style: Choose a generic style based on geometry such as Point, Line, Polygon, Raster, or Generic and click the Generate link when selected.
- Copy from existing style: Select an existing style from GeoServer and copy its contents to the current style. Note that not all styles may be compatible with all layers. Click the Copy link when selected.
- Upload a style file: Press the Browse button to locate and select a plain text file from your local system to add as the style. Click on the Upload link to add the style file.
The Legend area allows you to preview the legend for the style. Click on the Preview legend link to generate a legend based on the current settings.
At the bottom of the Style Editor page, you’ll find several options: Validate, Apply, Save and Cancel. During editing and especially after editing is complete, you can check the validation of the syntax by pressing the Validate button at the bottom. If any validation errors are found, a red message is displayed, and if no errors are found, a green message is displayed. To make changes, press the Apply button to access all the tabs and finally press the Save button.
After having created the style, it’s time to apply it to the layer. To do it, follow these steps:
- Navigate to the Data > Layers page then click on the layer’s name link to open the layer’s properties form. Switch to the Publishing tab.
- Go to the Style section and from the Default Style list, select the suitable style, then press the Save button.
- Navigate to the **Data > Layer Preview ** page and open up OpenLayers preview for the layer.
On the Styles page, click on the style name to open the Style Editor. The Style Editor page presents the style definition and contains four tabs with many configuration options: Data , Publishing , Layer Preview and Layer Attributes.
- Data tab: The Data tab includes basic style information, the ability to generate a style, and legend details. Moreover, it allows for direct editing of style definitions at the bottom, with support for line numbering, automatic indentation, and real-time syntax highlighting. You can switch between tabs to create and edit styles easily and can adjust the font size of the editor.
- Publishing tab: This tab shows all layers available on the server, along with their default style and any additional styles they may have. You can easily see which layers are linked to the current style by checking a box in the table.
- Layer Preview tab: This tab enables you to preview and edit the current style of any layer without switching pages. You can easily select the desired layer to preview and fine-tune styles to continuously test visualization changes.
- Layer Attributes tab: The Layer Attributes tab shows a list of attributes for the selected layer, making it easy to see and work with the attributes associated with the layer. This can help in deciding which attribute to use for labeling or setting up scale-dependent rules.
QGIS has a style editor for map rendering with various possibilities, including the export of raster styles to SLD for use in GeoServer. For versions before 3.4.5, a plugin called SLD4raster is required for exporting SLD for use in GeoServer.
Here’s a simple guide to styling a vector layer in GeoServer:
- Open QGIS (minimum version 3.0) and loading the vector dataset into your project.
- Double click on the layer to open the Properties dialog and navigate to the Symbology page.
- Select a Graduated rendering, choose the desired column, and press the Classify button.
- Return to the Properties dialog and go to the bottom of the Styles page. Select Style > Save Style.
- Save the style in SLD format and choose the location for the file.
- Use the Choose File button to locate your exported file in the folder and select it.
- Click on the Upload link to load the file into the editor form.
- Press the Validate button to ensure there are no errors, then press the Save button.
- Switch to the Publishing tab and choose either Default or Associated checkbox to apply the new style to the desired layer.
Here is a step by step guide to style a raster layer for GeoServer:
- Begin by opening QGIS with a minimum version of 3.4.5.
- Load the raster layer into your project.
- Double click on the layer to access the Properties and go to the Symbology tab.
- Select Singleband pseudocolor as the Render type, choose Linear method for Interpolation, and select a desired Color ramp.
- Press the Classify button to create a new color classification, then press the Apply button to save this classification. At the bottom-left of the page, choose Style and press Save Style button.
- Choose a name and export it in SLD format to your preferred location.
- In GeoServer, navigate to the Style section and click on Add a new style to open the editor form.
- Use the Choose File button to locate your exported file in the folder and select it.
- Click on the Upload link to load the file into the editor form.
- Validate the style by pressing the Validate button to ensure there are no errors, then press the Save button.
- Navigate to Data > Layers page and open the layer’s properties form by clicking on the layer’s name. Switch to the Publishing tab.
- Set the style as Default Style and press the Save button.
- Finally, in the Layer Preview section, open the OpenLayers preview for the raster layer.
To remove a style, click on the checkbox next to the style. Multiple styles can be selected at the same time. Press the Remove selected style(s) button at the top of the page. You will be asked for confirmation and press the OK button to remove the selected style(s).
In this session, we explored “How to style layers using GeoServer and QGIS” to produce beautiful maps. If you want to access the complete tutorial, simply click on the link
-
sur Mappery: These Tourists Won’t Get Lost
Publié: 3 April 2024, 12:00pm CEST

Reinder shared this. Spotted outside the International Peace Palace in the Hague
MapsintheWild These Tourists Won’t Get Lost
-
sur Four Free Alternatives to GeoGuessr
Publié: 3 April 2024, 10:58am CEST par Keir Clarke
OpenGuessr I am a huge fan of GeoGuessr, but unfortunately without becoming a paid subscriber it is now a very limited game. I don't blame GeoGuessr for developing its subscription model. The Google Maps API isn't cheap and I'm sure Google sends GeoGuesssr huge invoices every month. However that does mean there is a huge potential market for a free Street View game. A market that OpenGuessr
-
sur Mappery: Cambridge, Massachusetts
Publié: 2 April 2024, 12:00pm CEST
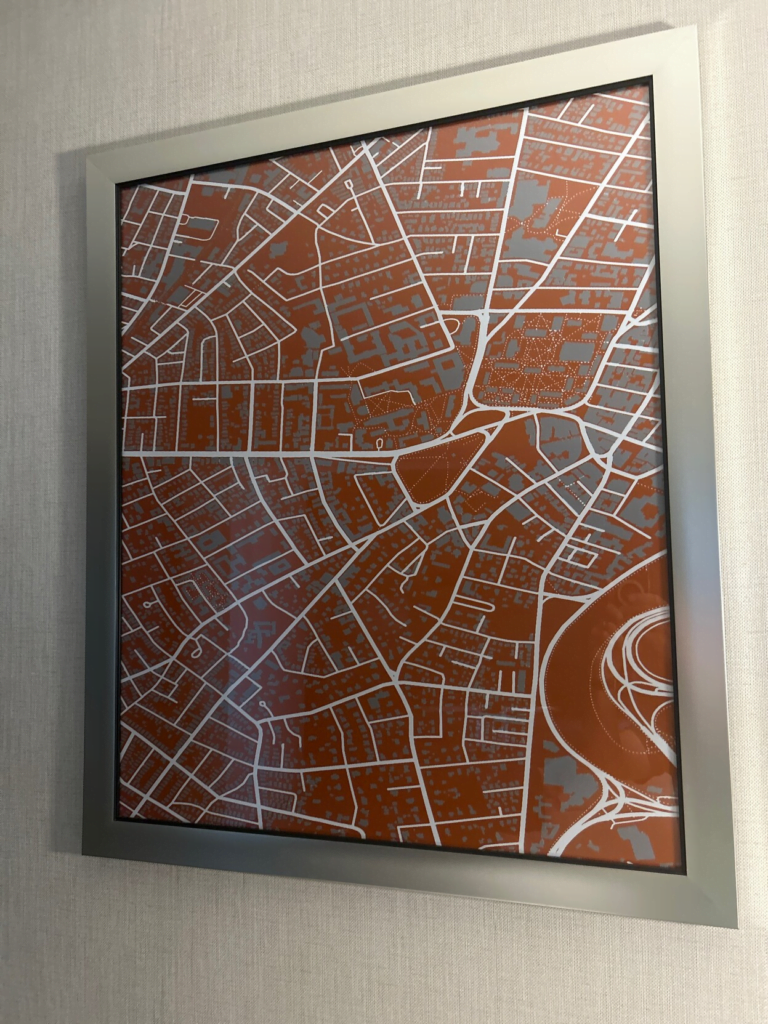
Marc Prioleau spotted this in the Marriott in Cambridge Massachusetts. It’s a different spin on the local info maps that you get in some hotels.
MapsintheWild Cambridge, Massachusetts
-
sur Playing Placename Detective
Publié: 2 April 2024, 10:09am CEST par Keir Clarke
The British Placenames Mapper is an interactive map which allows you to search for patterns in British placenames. The map uses 'regular expressions' to find defined text patterns within placenames. These text patterns could be prefixes used at the beginning of a name (eg 'Great' or 'Little'), suffixes used at the end of a name (eg 'ford' or 'mouth'), or even patterns that occur anywhere within a
-
sur Mappery: Never Eat Shredded Wheat
Publié: 1 April 2024, 12:00pm CEST

Derick Rethans shared this from his travels in Oxfordshire. I love the cardinal points at the top.
MapsintheWild Never Eat Shredded Wheat
-
sur Mappery: IMPORTANT: Mappery Editorial Policy Changes
Publié: 1 April 2024, 11:00am CEST
Dear followers. The Mappery team have been reflecting on some of the content we have posted recently. We’re concerned that cartography is being commercially exploited in some sectors (particularly the drinks industry) with the creation of entirely fictitious maps to promote a brand. We think this is wrong and is disrespectful of the art and science of cartography.
In posting some of this content, we recognise that our promotion has contributed to this problem, and for this error in judgement we are genuinely sorry and ask for your forgiveness. In future we will only post maps that have gone wild in good faith, rather than being fictitious creations produced solely for commercial gain. Once again, sorry for our part in this. In the meantime here are some shallots that look like a contour map. (Original credit Amanda Huber)

MapsintheWild IMPORTANT: Mappery Editorial Policy Changes
-
sur Highly Artificial Locations
Publié: 1 April 2024, 1:04am CEST par Keir Clarke
Today, a revolutionary new AI-powered map has been released that goes beyond traditional navigation. The new map-based search engine Highly Artificial Locations leverages cutting-edge artificial intelligence to transform how users experience and interact with the world around them.Highly Artificial Locations is more than just a map; it’s an intelligent companion that empowers users to explore
-
sur Mappery: Mapped It!
Publié: 31 March 2024, 12:00pm CEST

Matt Malone said “Gonna make a wild guess that one of my fellow surveying or GIS colleagues here in Michigan has this awesome plate that I spied recently.”
On the edge of being a Map in the Wild, no doubt some will want to draw the line somewhere else.
MapsintheWild Mapped It!
-
sur The Easter Bunny's Egg-cellent Adventure
Publié: 30 March 2024, 11:14am CET par Keir Clarke
This year the Easter Bunny has been on a whirlwind world tour, hopping from continent to continent and hiding eggs in some of the most amazing places on Earth! Take part in the world's largest egg hunt today by visiting the Tripgeo Global Egg Hunt.Are you ready to undertake a global egg hunt? If so grab your basket and get ready to embark on a virtual adventure of some of the world's most
-
sur Mappery: Tad’s Montana Tablecloth
Publié: 30 March 2024, 11:00am CET
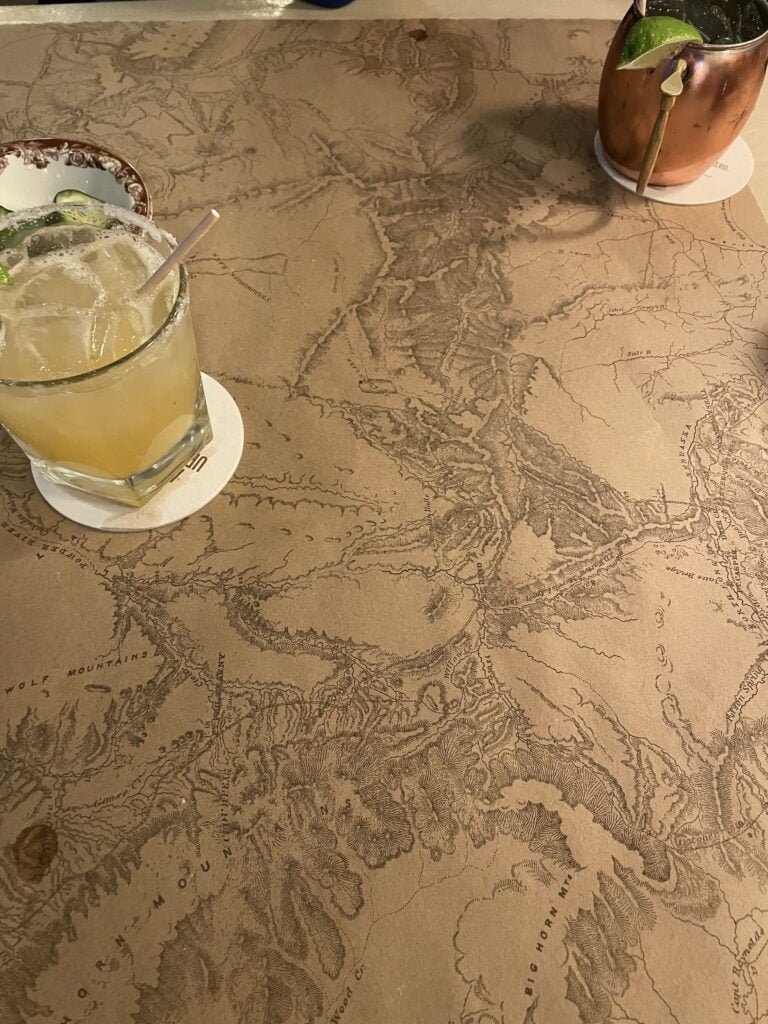
Eric Lund sent this to me, it’s a paper ‘tablecloth’ with a map of the Yellowstone area at Tad’s Montana Grill in Bozeman, Montana. Note the fruity cocktails while studying the elegant cartography.
MapsintheWild Tad’s Montana Tablecloth
-
sur Mappery: Definitely a Well Used Map in the Wild
Publié: 29 March 2024, 11:00am CET
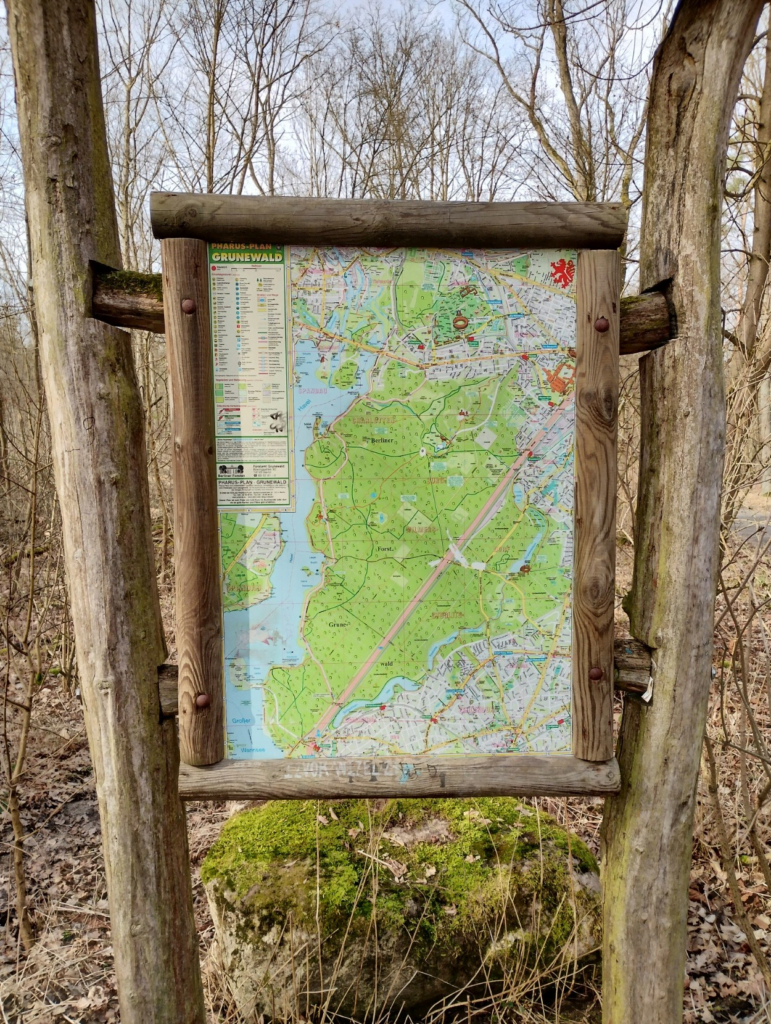
Another one from Javier Jimenez Shaw. “Map in Grunewald, Berlin, Germany. The point where the map is in the map (like “you are here” or “aktueller Standort”) is worn from touching it so much, that you can see the material behind the painting.
MapsintheWild Definitely a Well Used Map in the Wild
-
sur Oslandia: (Fr) En direct des Journées Utilisateurs QGIS-fr !
Publié: 29 March 2024, 10:19am CET
Sorry, this entry is only available in French.
-
sur The Islamic State Attack Map
Publié: 29 March 2024, 9:57am CET par Keir Clarke
In the last 12 months the Islamic State has claimed responsibility for 1,121 attacks around the world. Just last week the terrorist organization claimed that four of its members carried out the attack on concert goers at the Crocus City Hall, Moscow, leaving over one hundred people dead.The Islamic State Worldwide Activity Map is attempting to track IS's global activity and to make this
-
sur Ecere Corporation receives OGC Community Impact Award
Publié: 28 March 2024, 11:43am CET par Simon Chester
The Open Geospatial Consortium (OGC) has announced Ecere Corporation, represented by Jérôme Jacovella-St-Louis, as the latest recipient of the OGC Community Impact Award. The award was presented last night at the Executive and VIP Dinner of the 128th OGC Member Meeting in Delft, The Netherlands.
The Community Impact Award is given by OGC to highlight and recognize those members of the OGC Community who, through their exceptional leadership, volunteerism, collaboration, and investment, have had a positive impact on the wider geospatial community.
Gobe Hobona, OGC Director of Product Management, Standards, commented: “Jérôme and colleagues from Ecere have been active participants of most OGC Code Sprints over the past five years, as well as contributors to several activities of Standards Working Groups. Their willingness to assist other participants during Code Sprints has helped to get many participants up to speed and to boost the work of the Code Sprints’ community of experts.
“Jérôme has also been a steadfast advocate of OGC Standards for symbology and portrayal, as demonstrated by his engagement of the cartographic community on the next generation of OGC web mapping and portrayal Standards. This engagement has facilitated the collaboration between the OGC and its partner communities in the cartographic domain.”
“Jérôme has been a key enabler for the implementation of OGC Standards,” added Joana Simoes, OGC Developer Relations. “Besides providing extremely complete implementations in GNOSIS, which can be used by others as a reference, he has always been available to help other projects – both online through Github and in-person during Code Sprints. Many OSGeo projects have improved their standards support thanks to GitHub issues filed or answered by Jérôme.”
Notably, Jérôme is also the Co-Chair of five OGC Standards Working Groups: OGC API – Common SWG, Coverages SWG, Styles & Symbology Encoding SWG, Discrete Global Grid Systems SWG, and OGC API – Tiles SWG. In addition to this, Jérôme is also Co-Editor of the OGC API – Maps, OGC API – Processes – Part 3: Workflows, OGC CDB 2.0 – Part 2: GeoPackage Data Store, and OGC API – 3D GeoVolumes Standards.
Ecere Corporation has, and continues to, make an impact within the OGC Community through their active leadership, collaboration, and engagement across numerous OGC Code Sprints, Collaborative Solutions and Innovation Program (COSI) Initiatives, Working Groups, and Member Meetings.
The OGC Community Impact award highlights the importance of collaboration, volunteering time and energy, advancing technologies and Standards, raising awareness, and helping solve critical issues across the geospatial community. Jérôme and Ecere Corporation exemplify all of these qualities in their tireless work during Code Sprints and across so many Standards Working Groups.
The post Ecere Corporation receives OGC Community Impact Award appeared first on Open Geospatial Consortium.
-
sur Mappery: Scotland’s Geology
Publié: 28 March 2024, 11:00am CET

I am not sure who pointed me to this magnificent geological map of Scotland which was shared by Europe Says who said “Geologically correct map of Scotland. 30 years of collecting!”
MapsintheWild Scotland’s Geology
-
sur The SpaceX Starlink Map
Publié: 28 March 2024, 10:13am CET par Keir Clarke
StarLinkMap is a new real-time animated map of the 5,601 satellites currently orbiting the Earth as part of Starlink's huge satellite internet constellation. Starlink's megaconstellation of satellites, built and operated by SpaceX, provides high-speed broadband to even the most remote corners of the globe. Launched in 2019, Starlink boasts over 5,000 satellites in low Earth orbit (LEO), and
-
sur Mappery: 3D Globe Jigsaw
Publié: 27 March 2024, 11:00am CET
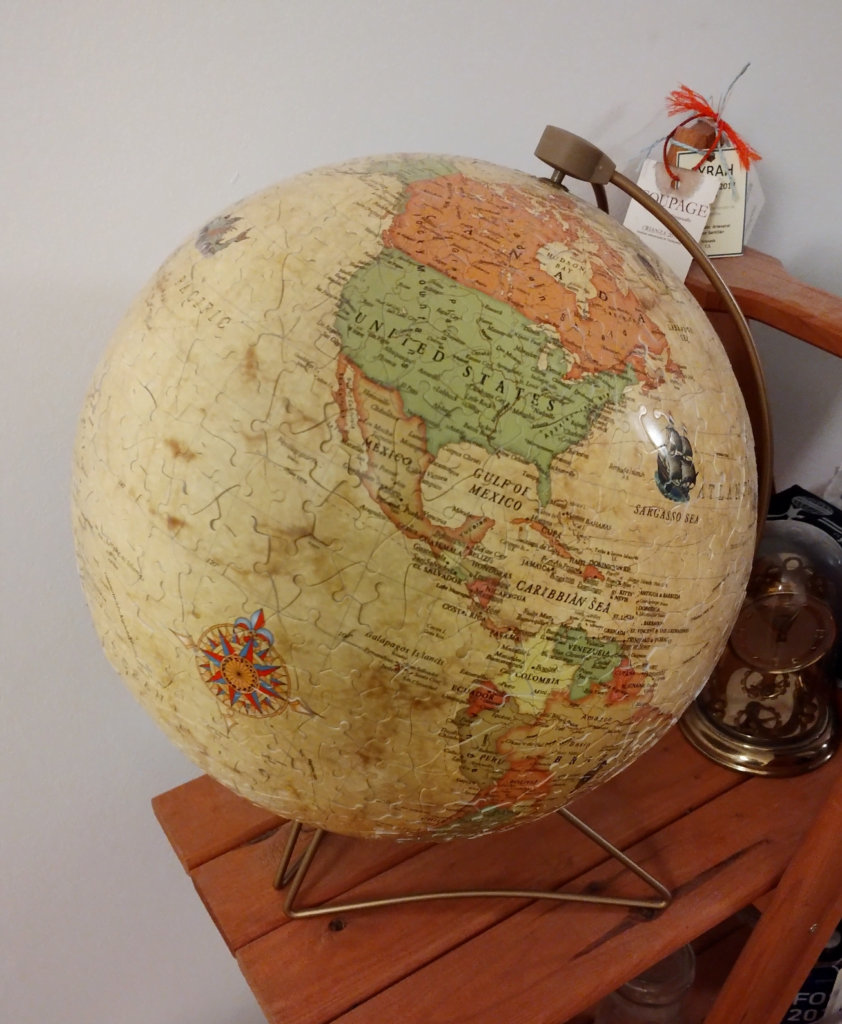
Javier Jimenez Shaw shared this beauty “3D globe jigsaw puzzle in my living room. 30 cm diameter. Unfortunately it is not produced anymore.” Amazing object, I have never seen anything like this before, have you?
It turns out that Ravensburger make a newer version of a 3D globe which you can buy here or from other online places that we can do without boosting
MapsintheWild 3D Globe Jigsaw
-
sur GeoSolutions: GeoSolutions at FedGeoDay in Washington, DC
Publié: 26 March 2024, 8:10pm CET
You must be logged into the site to view this content.
-
sur Mappery: Stone Town, Zanzibar
Publié: 26 March 2024, 11:00am CET

Stephen Mather, a good friend of Mapppery, shared this “Here’s one from Stone Town, Zanzibar, November of 2016. I think it’s up top of Emerson Spice.”
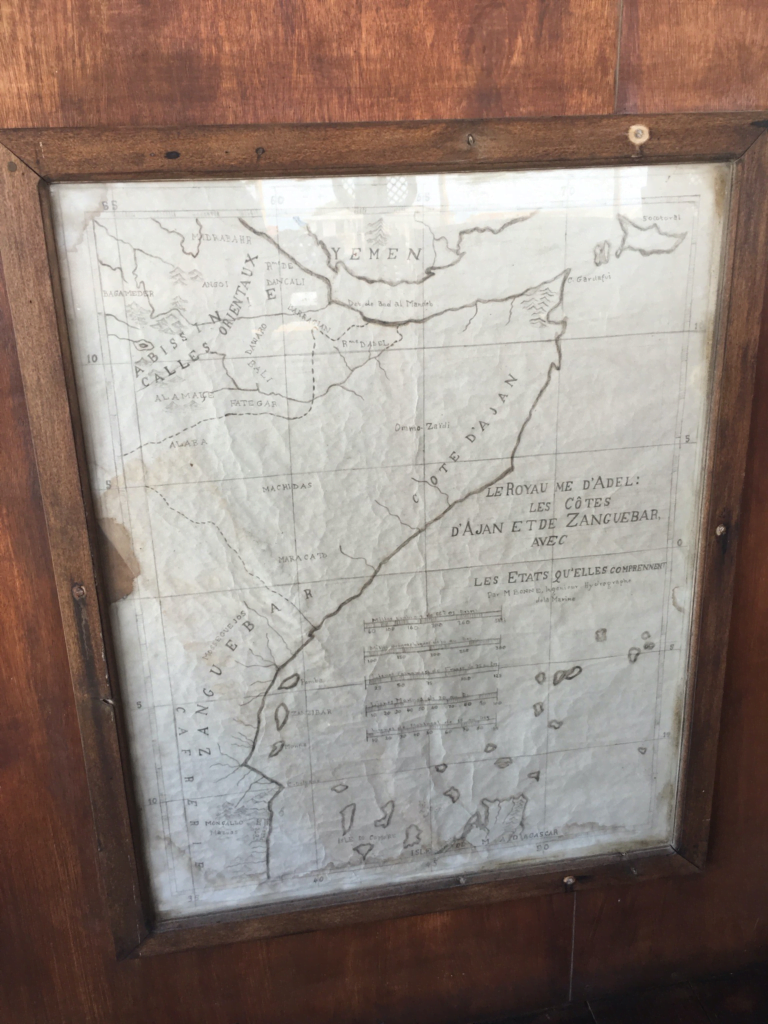
You might say “not very wild” but I love the idea of a hotel called Emerson Spice, sounds pretty wild to me.
MapsintheWild Stone Town, Zanzibar
-
sur Mapping SpaceTime
Publié: 26 March 2024, 9:37am CET par Keir Clarke
I recently stumbled upon Time Map, an interactive map which attempts to show points of interest around a location by walking time. Enter a location into the Time Map and a venue category (eg pizza restaurants) and the map will display a series of concentric circles around your location, each of which represents a minute of walking time. All the nearby points of interest are overlaid on top
-
sur Mappery: Birds Eye View
Publié: 25 March 2024, 11:00am CET
-
sur OTB Team: OTB works with QGis 3.36
Publié: 25 March 2024, 10:20am CET
The OTB Provider QGis plugin is now available on QGis plugin catalog. Since QGis version 3.36, the plugin previously packaged is no longer in QGis package. To use OTB with QGis 3.36 you need to install plugin from QGis plugin catalog (“Extensions menu –> Install/Manage Extensions” and type OTB in not-installed tab). Then follow plugin […]
-
sur The World Air Quality Report 2023
Publié: 25 March 2024, 9:29am CET par Keir Clarke
IQAir has released its annual World Air Quality Report. The 2023 report reveals that last year only seven countries met the World Health Organizations' PM2.5 air pollution guideline.The IQAir Annual World Air Quality Report is a yearly analysis of global air quality, compiled by the Swiss air quality monitoring firm IQAir. The report gathers data on PM2.5 (which is particulate matter with a
-
sur Mappery: The Meanderings of the River Ahr
Publié: 24 March 2024, 11:00am CET
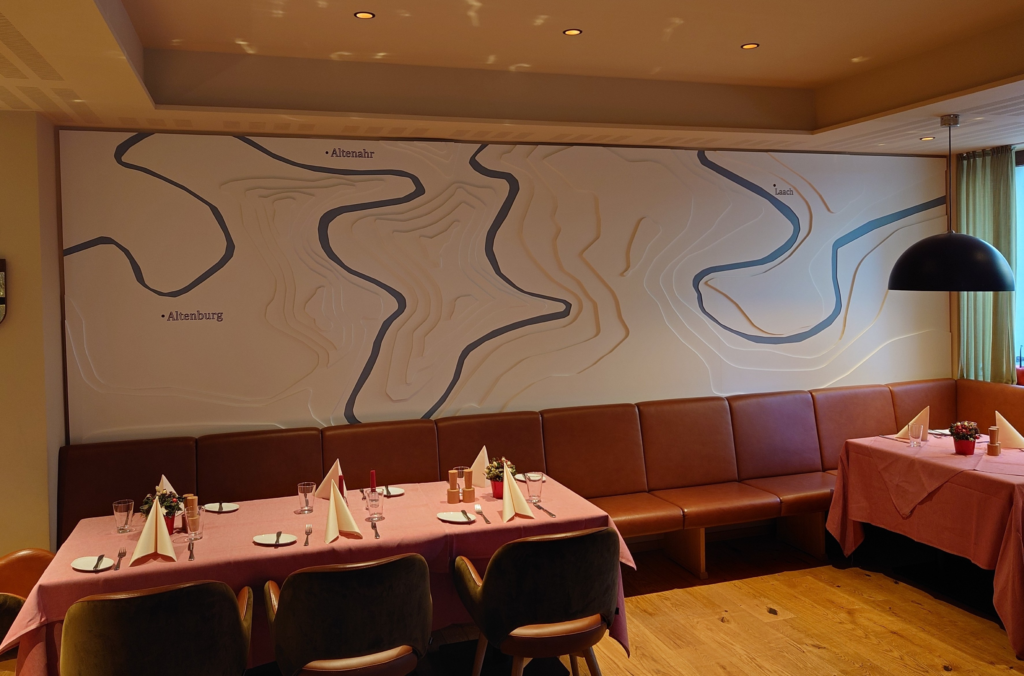
Anton van Tetering shared this “Map of the meanders of the river Ahr on the wall of restaurant Ruland in Altenahr, Germany. Just like many other buildings in the Ahr-valley, this restaurant was severely damaged in the flood catastrophe of July 2021 which killed at least 135 people in this valley alone.”
MapsintheWild The Meanderings of the River Ahr
-
sur SourcePole: FOSSGIS 2024
Publié: 24 March 2024, 1:00am CET
Sourcepole hat an der FOSSGIS 2024 in Hamburg verschiedene Themen mit Vorträgen abgedeckt:
- QGIS Web Client 2 (QWC2) - Neues aus dem Projekt
- QGIS Server Plugins
- BBOX: Kompakter OGC API Server für Features, Tiles und mehr
-
sur Mappery: Pinocchio Theme Park
Publié: 23 March 2024, 11:00am CET
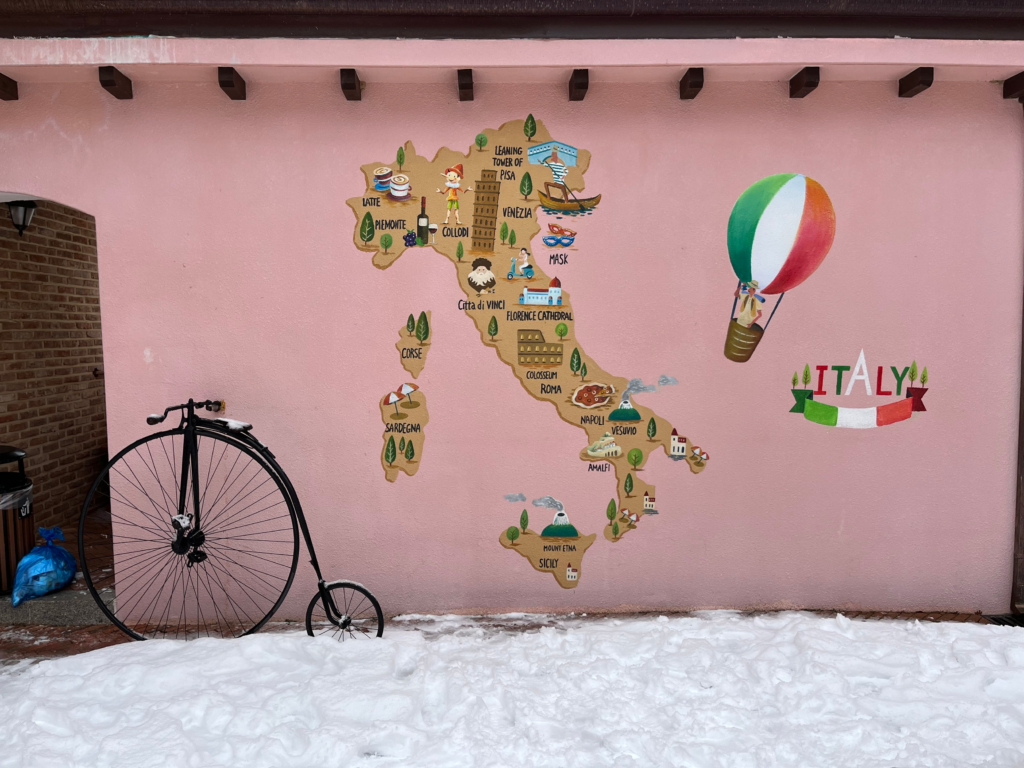
Ian Wagner shared this pic of a map of Italy in a Pinocchio themed park in South Korea. Who knew Pinocchio was a thing there?
MapsintheWild Pinocchio Theme Park
-
sur The Future for Trees
Publié: 23 March 2024, 10:09am CET par Keir Clarke
Like many people a few years ago I realized that not only is climate change happening but that human beings as a species are doing next to nothing to prevent its escalation. I do believe that the worst excesses of climate change are still preventable. I just see very little evidence that we are making the changes necessary to stop global heating, or even slow our ever increasing rush towards
-
sur Ecodiv.earth: An addon to download the AHN data in GRASS GIS
Publié: 23 March 2024, 12:00am CET
The r.in.ahn addonIn the previous post, I introduced the ‘Actueel Hoogtebestand Nederland’. To start with a small correction, the version 4 I mentioned isn’t the latest version. Version 5 is being rolled out and is already available for the northern part of the country. But for now, let’s focus on version 4.
In the previous post, I presented some steps to download the AHN for a specific area and import it in GRASS GIS. Downloading was easy using the r.in.wcs addon. However, a few extra steps were required to ensure the imported data would align with the extent and resolution of the original AHN data.
Easy, but why not make it easier yet? So, as it was a rainy day anyway, I used the code presented earlier and wrapped it up in the addon r.in.ahn. Let’s see how to download the DTM for the Land van Cuijk again, but this time using the new addon.
©
Download the DTM for a selected areaNote that this addon only works in locations with the coordinate reference system RD New (EPSG 28992). This is that the CRS of the original data, and the addon is meant to ensure you download the data as it is. This is akin to how the
r.in.gdalimport function works. If you want to import and reproject the data on the fly (similar to ther.importfunction), you can use ther.in.wcsaddon.This example shows the steps to download the 0.5-meter resolution DTM for the Land van Cuijk. You’ll need to install the r.in.wcs and r.in.ahn addons 1 2.
Install the required addons.
First step is to import the Python libraries. Note, this will not be repeated with the next scripts.
import grass.script as gsNow, you can install the two addons using the g.extension function.
gs.run_command("g.extension", extension="r.in.wcs")
gs.run_command("g.extension", extension="r.in.ahn")
Install the two addons using the g.extension function.
g.extension extension=r.in.wcs
g.extension extension=r.in.ahn
You need the
g.extensionfunction to install addons. In the main menu, go toSettings > Addons extension > Install extension from addon. Alternatively, type ing.extensionon the command line. The example below is forr.in.wcs. Repeat this step forr.in.ahn. Figure 1: The g.extension function, started from the command line.
Figure 1: The g.extension function, started from the command line.
Figure 1: The g.extension function, started from the command line.
Now, download the administrative boundaries of the Dutch municipalities, and extract the boundaries of the “Land van Cuijk”.
Download layer with administrative boundaries of the neighborhood.
gs.run_command(
    "v.in.wfs",
    url="https://service.pdok.nl/cbs/wijkenbuurten/2022/wfs/v1_0?",
    output="municipalities",
    name="gemeenten",
)
Next, extract the boundaries of the municipality of “Land van Cuijk”
gs.run_command(
    "v.extract",
    input="municipalities",
    where="naam = 'Land van Cuijk'",
    output="LandvanCuijk",
)
Get the vector layer with the boundaries of the municipality.
v.in.wfs url="https://service.pdok.nl/cbs/wijkenbuurten/2022/wfs/v1_0?" \
    output=municipalities name=gemeenten
Next, extract the boundaries of the municipality of “Land van Cuijk”
v.extract input=municipalities where="naam = 'Land van Cuijk'" \
    output="LandvanCuijk"
Type in
v.in.wfson the command line or in the console. You can also find the function undermain menu > File > Import vector data. This opens the following screen (you need to fill in parameters in two tabs): Figure 2: Download the vector layer with the municipality boundaries. Define the base URL and the name of the output layer.
Figure 2: Download the vector layer with the municipality boundaries. Define the base URL and the name of the output layer.
Figure 2: Download the vector layer with the municipality boundaries. Define the base URL and the name of the output layer.
 Figure 3: Download the vector layer with the municipality boundaries. Fill in the name of the WFS layer to download.
Figure 3: Download the vector layer with the municipality boundaries. Fill in the name of the WFS layer to download.
Figure 3: Download the vector layer with the municipality boundaries. Fill in the name of the WFS layer to download.
 Figure 4: Extract the boundaries of the municipality of Land van Cuijk. Select the name of the vector layer with municipalities and give the name of the output layer.
Figure 4: Extract the boundaries of the municipality of Land van Cuijk. Select the name of the vector layer with municipalities and give the name of the output layer.
Figure 4: Extract the boundaries of the municipality of Land van Cuijk. Select the name of the vector layer with municipalities and give the name of the output layer.
 Figure 5: Extract the boundaries of the municipality of Land van Cuijk. Fill in the query, which defines which features you want to select and save. Tip: Use the convenient query builder.
Figure 5: Extract the boundaries of the municipality of Land van Cuijk. Fill in the query, which defines which features you want to select and save. Tip: Use the convenient query builder.
Figure 5: Extract the boundaries of the municipality of Land van Cuijk. Fill in the query, which defines which features you want to select and save. Tip: Use the convenient query builder.
Now, set the region to match the extent of the municipality. Note, you do not need to be concerned with the resolution;
r.in.ahnwill adjust the resolution and extent to make sure the imported data aligns perfectly with the original AHN data. This is done by setting the resolution to 0.5 meters and subsequently extending the region’s extent until it aligns with the original AHN data layer.Set the region to match the vector layer LandvanCuijk.
gs.run_command("g.region", vector="LandvanCuijk")Get the vector layer with the boundaries of the municipality.
g.region vector=LandvanCuijkType in
g.regionon the command line or console, or open the function’s window viamenu | Settings | Computational region | Set region. Figure 6: Set the region to match the extent of the vector layer LandvanCuijk.
Figure 6: Set the region to match the extent of the vector layer LandvanCuijk.
Figure 6: Set the region to match the extent of the vector layer LandvanCuijk.
Now, you can run the
r.in.ahnfunction to import the layer. Note that by default, the addon will change the region you just defined. It will set the resolution to 0.5 meters (this is the resolution of the AHN data you are about to download). It will furthermore expand the extent so that it aligns perfectly with the AHN data.Import the DTM using the
r.in.ahnfunction.gs.run_command("r.in.ahn", product="dtm", output="dtm_05")Get the vector layer with the boundaries of the municipality.
r.in.ahn product=dtm output=dtm_05Type in
r.in.ahnon the command line or console. A third way is shown in the image below. Open theTools taband go toAddons. The function should be available there. Figure 7: Open the r.in.ahn plugin, select the product to download (dtm or dsm) and provide the output layer name.
Download whole tiles
Figure 7: Open the r.in.ahn plugin, select the product to download (dtm or dsm) and provide the output layer name.
Figure 7: Open the r.in.ahn plugin, select the product to download (dtm or dsm) and provide the output layer name.
Download whole tiles
If you set the
-t flag, the function will import the DTM or DSM for all 6.5×5 km AHN tiles that overlap with the current region. In addition, a vector polygon layer will be created with the tile boundaries.Define the region for which you want to download the data, and import the DSM using the
r.in.ahnfunction. Set the -t flag to download the DTM for the area covered by the tiles that overlap with the region.# Set the region gs.run_command("g.region", n=412572, s=411280, w=188911, e=190085) # Import the tile(s) that include the selected region gs.run_command("r.in.ahn", product="dtm", flags="t", output="dtm_05_subset")# Set the region g.region n=412572 s=411280 w=188911 e=190085) # Import the tile(s) that include the selected region r.in.ahn -t product=dtm output=dtm_05_subset)Open the
g.regionaddon by typing g.region on the command line, in the console, or using the menu. Fill in the northern, southern, western, and eastern limits of the area for which you want to download the data. Figure 8: Set the region bounds.
Figure 8: Set the region bounds.
Figure 8: Set the region bounds.
Type in
r.in.ahnon the command line or console. Or go to theTools taband go toAddons. The function should be available there. Fill in the required fields, like in the previous examples. Next, go to theOptionaltab and selectDownload whole tiles. Figure 9: Open the r.in.ahn plugin, select the product to download (DTM or DSM) and provide the output layer name.
Figure 9: Open the r.in.ahn plugin, select the product to download (DTM or DSM) and provide the output layer name.
Figure 9: Open the r.in.ahn plugin, select the product to download (DTM or DSM) and provide the output layer name.
The extent of the imported layer covers the 6.5×5 km AHN tile. In addition to the raster layer, you’ll have a vector layer with the boundary of the downloaded tile(s). This vector layer has the same name but with the suffix *_tiles*.
You should be aware that running the function will adjust the computational region so that it aligns with the imported data. You can avoid this by setting the -g flag, as illustrated in Figure 10.
 Figure 10: A: The downloaded 6.5 x 5 km AHN tiles that intersect with the user-defined region, here indicated by the orange outline. In addition, a vector layer with the boundaries of the tiles is created. The red outline shows the adjusted region extent after running the function. The blue outlines show the boundaries of the downloaded tiles. B: The same, but with the -g flag set. With this flag set, the user-defined region (red outline) will not be altered .
Footnotes
Figure 10: A: The downloaded 6.5 x 5 km AHN tiles that intersect with the user-defined region, here indicated by the orange outline. In addition, a vector layer with the boundaries of the tiles is created. The red outline shows the adjusted region extent after running the function. The blue outlines show the boundaries of the downloaded tiles. B: The same, but with the -g flag set. With this flag set, the user-defined region (red outline) will not be altered .
Figure 10: A: The downloaded 6.5 x 5 km AHN tiles that intersect with the user-defined region, here indicated by the orange outline. In addition, a vector layer with the boundaries of the tiles is created. The red outline shows the adjusted region extent after running the function. The blue outlines show the boundaries of the downloaded tiles. B: The same, but with the -g flag set. With this flag set, the user-defined region (red outline) will not be altered .
Footnotes
You are expected to be familiar with GRASS GIS and the concept of region used in GRASS GIS. If you are new to GRASS GIS, you are warmly recommended to first check out the GRASS GIS Quickstart and the explanation about the GRASS GIS database.??
Downloading the DTM for the whole municipality will take a while. If you want to speed things up, you can work with a smaller area by using your own vector data.??
-
sur Mappery: A map lover’s birthday present
Publié: 22 March 2024, 11:00am CET
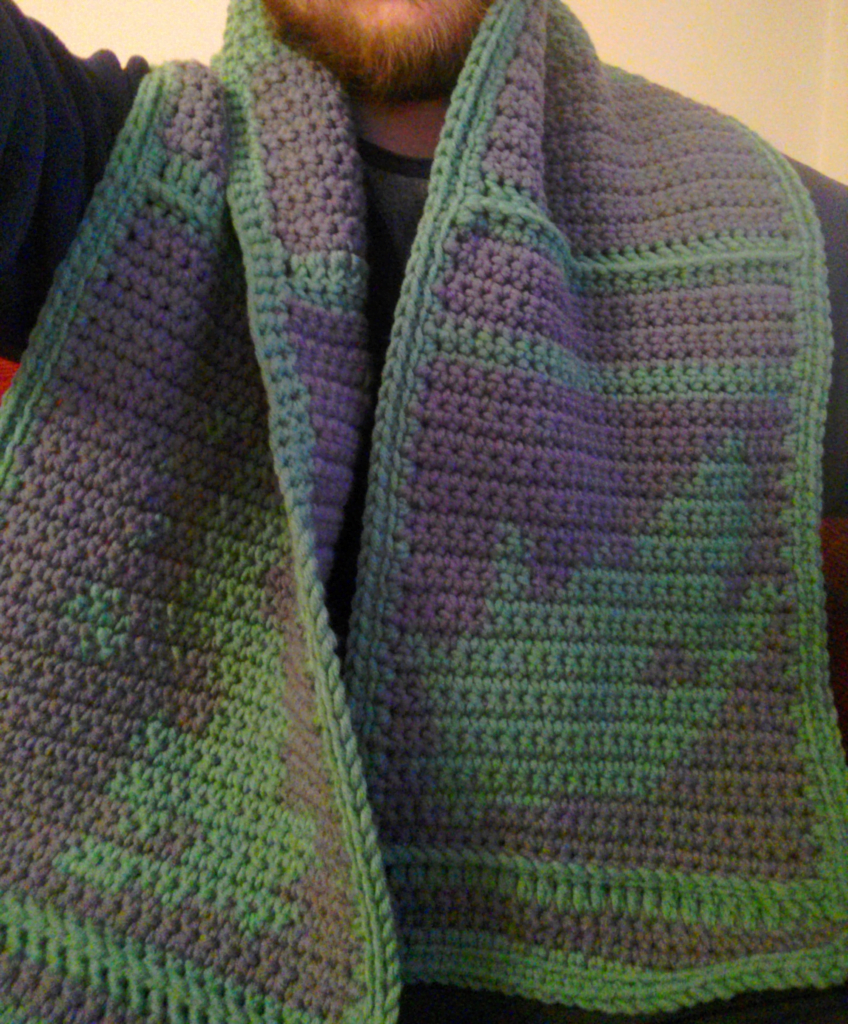
Gregory Marler said “I got a scarf for my birthday, it’s got 2 country maps on it! Would @mappery count this as a map in the wild? At the least it is being worn beside my wild/unkempt beard.”
The answer is definitely “Yes”
Who can work out the country that is not UK? (Greg can’t answer)
MapsintheWild A map lover’s birthday present
-
sur Jackie Ng: Avalonia UI Test Drive
Publié: 22 March 2024, 9:40am CET
As the title implies, this blog post is about my experience test driving Avalonia UI.
So why am I doing this?
I've been getting growing questions lately about whether MapGuide Maestro works on Linux via Mono.
Sadly I no longer emphasize anything regarding Mono compatibility because.
- WinForms support (in legacy .net Framework 4.x) on Mono is pretty much a hack.
- And since we've moved away from legacy .net Framework to .net 6.0, the combination of WinForms + .net 6.0 is probably an unsupported combination (you don't use Mono to run .net core/5.0+ applications, you use Microsoft's official SDK/runtime). I'm also not too keen to waste time and resources to test and find out.
And in terms of .net multi-platform UI frameworks, there's only one logical choice: Avalonia UI
While it is not in my immediate plans to rewrite MapGuide Maestro's UI in Avalonia, I wanted to at least explore the feasibility of building such a UI even if all the actual functionality is mocked up, just to see how easy or difficult the whole process is.
Hence the motivation for this post.

So why Avalonia?
Avalonia is effectively the "spiritual successor" to WPF, and adopts most of the same patterns and practices when building UIs for Avalonia.
I had first heard about Avalonia when it was formerly known as Perspex and at the time, from the screenshots of example Perspex applications on Windows and non-Windows platforms, it was clear at that point in time the range of possible applications one can build with Perspex was quite limited and building an application like Maestro on top of Perspex was not feasible.
Just recently, I had heard about the framework now known as Avalonia again and this time round there was a lot more positive buzz around it, so I gave it another look and was much more impressed at its capabilities and richer suite of UI controls to build applications with.
Our objectiveMy objective with this Avalonia learning exercise was to build a minimal multi-document interface skeleton application, mimicking the primary functionality (UI-wise) of MapGuide Maestro.
- Being able to present a login UI to connect to a MapGuide Server
- Present MapGuide Server resources in a tree view
- Open resources in a region of tabbed editor panels and being able to close them.
 If this kind of UI looks familiar, yes it's basically the UI for tools like:
- Visual Studio Code
- Azure Data Studio
- Azure Storage Explorer
- any many others like them!
The benefit of such a UI, is that it doesn't require an explicit VS-style window docking control like I have for the current WinForms-based MapGuide Maestro. I can already see the controls needed to build such a UI Any UI toolkit worth its salt should to able to provide these basic controls.
This is a proof-of-concept, so we won't be using the existing Maestro API to talk to actual MapGuide Servers. Instead such functionality will be mocked up for this application. The main purpose of this exercise is to see if Avalonia provides enough of the base UI elements to build a hypothetical version of MapGuide Maestro on top of.
It turns out this exercise was fraught with several challengesChallenge #1: Getting familiar with Avalonia conceptsThe first challenge was simply getting familiar with Avalonia concepts. Being someone who did .net desktop app development primarily in Windows Forms, I skipped over WPF, and its XAML-based variants/successors like Silverlight, Xamarin Forms, UWP, and MAUI, and Avalonia being a "spiritual successor" to WPF meant that I didn't have a potential conceptual head start on Avalonia that one might have if they already had experience with WPF and its XAML-based derivatives.
However, I was familiar with the MVVM pattern and data-binding, which is used heavily in Avalonia. I already had experience in knockout.js building/maintaining some of our web apps in my day job, and these concepts learned from knockout.js mostly translate cleanly 1:1 to Avalonia.
The other Avalonia concepts I'll have to figure out as we go along.
Challenge #2: WebAssembly (WASM) supportBefore I begin, I must take the MapGuide-knowledgable readers of this post back in time, way back to when MapGuide Open Source 1.0 was released.
Do you remember how this new (at the time), re-invented version of MapGuide was released, but the only authoring option at the time was to buy a license of Autodesk MapGuide Studio? Not a pretty look if you are offering a free and open source web map GIS server, but the authoring tools are not?
Some members of the MapGuide community were aware of this glaring discrepancy and created a web-based equivalent of MapGuide Studio called Web Studio built fully with HTML/JS/CSS. Unfortunately, Web Studio was really bare-bones in terms of authoring capabilities and the code being written in the pre-historic era of javascript (this was circa 2006-2007) which did not make it conductive to external contribution. React, TypeScript and friends weren't around then, so trying to enhance Web Studio with new features was extremely challenging. I once tried to add at least a generic XML text editor fallback for Web Studio so you had something to edit various resources where Web Studio did not provide a dedicated editor UI for, but alas this was just too challenging for me and I gave up on such an idea.
But eventually another user of the MapGuide community solved this problem more directly by developing and releasing a v1.0 of a windows .net desktop application that you all know as MapGuide Maestro. As an aside, I am not the original author of MapGuide Maestro in case you're wondering, I merely took over development and maintenance of Maestro from the 2.1 release onwards.
Anyways, back to the topic at hand, when I created the new Avalonia application with the provided project template, I was most surprised to see that the generated solution came with a project that compiled to WebAssembly (WASM) that was ready to run in your web browser!
This was a mind-blowing revelation for me from a conceptual standpoint. It means our hypothetical MapGuide Maestro built on Avalonia could not only exist as a regular desktop application, but the WASM build of this application could be dropped in the the wwwroot of a MapGuide Web tier installation and you would now have a modern version of Web Studio, but much more powerful and capable, because it is just MapGuide Maestro ... now in your web browser!
Since our starter project template includes a functioning WASM browser target. I now had a strong incentive to keep this target active and working, because the prospect of being able to run MapGuide Maestro in a web browser is a very tempting proposition. Therefore, the choice of libraries and APIs I use is constrained by my new requirement of being able to work in a browser/WASM environment.
For example, I originally wanted to use MVVMDialogs to simplify working with dialogs (Maestro has lots of dialogs, so I figure such a library could be useful), but I couldn't get this library to work in a WASM environment with some of my testing dialogs, so this was a no-go. Since this was just a proof-of-concept, there wasn't a need to have working dialog system, but it does mean if this were to go beyond a proof-of-concept and into an actual application where we will inevitably have to present a dialog of some sort, I'd have to come with a paradigm that can work in both desktop and browsers.
Another problem with this WASM target is that I can't seem to debug it in Visual Studio. You can launch the WASM target in the debugger and spawn a new browser window to launch your app, but any breakpoints you stick in your C# code are not being hit. I'm not sure if this a shortcoming or a broken feature, but it is somewhat concerning if we were to go full steam ahead with support WASM as a compilation/deployment target.Challenge #3: "Large scale" MVVMAlthough I already knew the MVVM pattern from knockout.js, my scope of usage was mostly limited to using knockout.js to building "islands" of interactive client-side content on primarily server-generated web pages. So I didn't really have an idea of how to apply such a pattern on a full blown Single Page Application (SPA), which is pretty much what we're trying to achieve (conceptually) in Avalonia. By the time I was building SPAs proper, I had moved on the popular stuff like React, which is how I gained the knowledge needed to build a modern replacement map viewer for MapGuide and my usage of knockout.js fell by the wayside as a result, so I never figured out the answer for how to do large scale MVVM.
The main problem was that in a large scale MVVM, how do view models communicate with each other without a tight parent-child coupling?
I deduced that for starters, we definitely need to use dependency injection. Various view models will need to access different services and if we had a root view model with explicit nested child view models (each with their own service requirements), it would be an absolute pain to have to setup these various view models. Using a DI container means we can offload this concern to it and we can focus on just asking the DI container for a particular view model and it will setup all the required services for it for us provided we register everything properly with the DI container.
For better WASM support, I wanted a dependency injection container that is not driven by reflection to make the code more friendlier to app trimming. We want to be able to app trim on publish so that we can eliminate unused code and reduce the final binary size. This is most desirable for the WASM target as app trimming means smaller binaries, which means smaller payloads to download in a web browser. StrongInject was chosen for this reason as it was a "compile-time" DI container that can verify all your dependencies are registered properly before running the application through the magic of source generators, generating all the necessary registration and validation code for you.
Finally, to be able to communicate between view models without necessary parent-child coupling, the messenger facility of the MVVM toolkit can be used. With this messenger facility, we simply:- Have select view models be recipients of certain messages
- Have our application services (that various view model commands call) send these messages.
- Relevant recipients get notified and update themselves (and their bound UIs) accordingly as a result.
The reason is because the tab content we want to show is not homogenous. One open editor tab could be for a layer, one for a map, one for a feature source, etc, etc. So we need to be able to show different tabs on the same tab control.
Avalonia documentation is pretty scant on this topic. All examples I found assume homogenous series of tab content, which is not our case.
Just for laughs, since AI has been hyped for soon taking away everyone's jobs (even us devs), I figured I'd ask huggingface chat (as a guest), how would you solve this problem?
Unfortunately, the provided code sample does not work out of the box. It clearly assumed Avalonia = WPF and gave me a WPF-based solution. The giveaway was the Avalonia TabControl does not have an ItemTemplateSelector, but the WPF TabControl does.
But Avalonia sharing many conceptual similarities with WPF meant that although the answer provided wasn't correct, parts of the answer were applicable and did lead me down to further avenues of inquiry and eventually I found the solution: It was to define a data template for every possible derived tab view model class in the same UserControl where the TabControl was specified.Final challenge: Avalonia VS designerThis wasn't so much a challenge, rather an annoyance. The Avalonia designer in Visual Studio has some teething issues- Intellisense/autocomplete is somewhat flaky when writing binding expressions and when you're doing a lot of data-binding, having the editor giving you and incomplete or outdated list of properties you can bind to becomes annoying. A full project build generally fixes this, but it is annoying having to do this every time I add new observable properties or commands to an existing view model class.
- It's also not rename-aware, so observable property or command renames will result in stale binding expressions, causing havoc with the designer and have to be manually fixed up in the XAML. Choose your observable property names wisely I suppose, because renaming them afterwards is painful.
%20-%20Microsoft%20Visual%20Studio.png)
%20-%20Microsoft%20Visual%20Studio.png)
%20-%20Microsoft%20Visual%20Studio.png)
And if these screenshots don't convince you, thanks to being able to deploy as a WASM target, I deployed a copy to GitHub pages, so you can see this app for yourself right in your WASM-enabled web browser!%20-%20Brave.png)
The source code for this app can be found here. One day this may form the basis of a new (true) multi-platform version of MapGuide Maestro, but for now this lies as a potentially useful starting point for building a tabbed-multi-document editor application with Avalonia.
So what did I think of Avalonia from this little experiment?- I like it mostly. My pre-existing experience on knockout.js helped greatly with picking up MVVM and data-binding. My initial prediction of a VSCode-style UI layout being buildable turned out to be true.
- I like the default (project template provided) choice of MVVM Toolkit for applying the MVVM pattern. I like their heavy use of source generators to make adding new observable properties and commands to a view model being a simple case of tacking [ObservableProperty] on a field or tacking [RelayCommand] to a private method and having the source generator generate all of the boilerplate code for you (and it's a lot of boilerplate!).
- The revelation that Avalonia has a WASM deployment target was both exciting and "cramping my style". It meant that certain libraries I wanted to use (eg. The MVVM dialogs library) could not be used and it wasn't clear what would work in a WASM browser environment and what wouldn't. Which leads to ...
- Documentation is lacking in some areas. What really stumped me for a while was how do a TabControl bound to a collection of polymorphic or heterogenous tab view models. Their provided examples completely failed to tell me how to do this. I suppose if I came into this with existing WPF experience, this wouldn't have been so difficult as most of the concepts and patterns seem to be mostly transferable, but I happened to have skipped WPF and its bajillion XAML-based derivatives, so I didn't have this pre-existing knowledge to fall back on. Through perseverance and looking at the source code for many existing Avalonia applications on GitHub, I was finally able to determine that data templates was the solution.
Now I better get back onto this MapGuide/FDO work.


%20-%20Microsoft%20Visual%20Studio.png)
%20-%20Microsoft%20Visual%20Studio.png)
%20-%20Microsoft%20Visual%20Studio.png)
%20-%20Brave.png)
-
sur FlightRadar's New GPS Jamming Map
Publié: 22 March 2024, 8:34am CET par Keir Clarke
Yesterday the live real-time global plane tracking website FlightRadar released a new interactive map which detects and tracks interference and jamming of GPS signals across the world. The map uses a simple to understand colored overlay to show in near real-time areas around the globe currently experiencing levels of interference to global navigation satellite systems. GPS jamming
-
sur GIScussions: Your Map Inside
Publié: 21 March 2024, 5:47pm CET

A few weeks ago I recorded a Geomob Podcast with Ana Lucía González Paz about her beautiful flipbook, A Map Inside. You can read the book in a few minutes and then you can listen to the podcast
[https:]]Towards the end of each podcast, I give my guest the opportunity to go off piste and talk about a subject that they choose (in the past we have talked about digital privacy, mental health and open source sustainability to mention just a few). Ana said that she would like to ask me to describe my Map Inside and you can hear how I replied at the end of the podcast.
After we recorded the podcast, I was chatting with Ana and we thought that it would be fun to get other people to share their Map Inside. Everyone has a Map Inside connected to memories, people, special moments, would you like to share yours? Just record a short audio clip in mp3 format running for 60 to 120 seconds and mail it to me (if you don’t know my email use the Contact Form to reach me or find me at Mastodon). Assuming we get a few responses, Ana and I will put together an episode of the podcast with a selection of your Maps Inside.
Hope to hear from you with your Map Inside
-
sur Mappery: Route Map Not Available
Publié: 21 March 2024, 11:00am CET

Kaakapoo shared this “A lack of #MapsintheWild today”
I’m sure this will prompt some debate as to whether the absence of a Map qualifies as an entry here, but you know the rules (editors are always right)
MapsintheWild Route Map Not Available
-
sur The Sea Trade Monitor
Publié: 21 March 2024, 9:27am CET par Keir Clarke
PortWatch is a new platform which monitors disruptions to global maritime trade. The platform uses real-time data on ship traffic and maritime trade to provide an alert system on trade disruptions likely to impact shipping trade routes. Recent attacks by Houthi rebels on ships traversing the Red Sea have helped to highlight how marine trade is vulnerable to geopolitical instability..
-
sur Jorge Sanz: Interview at Geomob Podcast
Publié: 20 March 2024, 3:19pm CET
Pièce jointe: [télécharger]

Earlier this week an episode of the Geomob Podcast was published where Steven Feldman interviews yours truly. It was a lot of fun to chat with Steven about Elastic, my experience in the geospatial industry, and Open Source in general. I could also advocate a bit about data privacy and digital identity which is a topic that has picked my interest even more lately with all the shit that is hitting that social network we all know about.
If you want to learn a bit about Elastic and Geo this is maybe a good opportunity to get a condensed gist of why would anyone want to store and analyze geospatial data in Elasticsearch, a few compelling use cases and so on.
Cheers!
-
sur Mappery: Fushimi Inari-taisha Park
Publié: 20 March 2024, 11:00am CET

Raf shared this beautiful map from Fushimi Inari-taisha park in Kyoto.
MapsintheWild Fushimi Inari-taisha Park
-
sur The most mis-mapped US states
Publié: 20 March 2024, 9:36am CET par Keir Clarke
According to the 55,387 players of the online game 'Find the Location of ...' Texas, California and Virginia are the most well-known states in the United States. Based on the results of this popular mapping game North Dakota, Missouri and Wyoming are the least well-known statesFlagWhiz.com's map game Find the Location of ... requires players to position the outlines of states onto a near empty
-
sur Camptocamp: Camptocamp at FOSSGIS 2024
Publié: 20 March 2024, 1:00am CET
Pièce jointe: [télécharger]
Camptocamp will join other geospatial professionals at the FOSSGIS conference in Hamburg, Germany from March 20 to 23, 2024. -
sur GeoTools Team: GeoTools 31.0 released
Publié: 19 March 2024, 8:12pm CET
GeoTools 31.0 released The GeoTools team is pleased to announce the release of the latest stable version of GeoTools 31.0: geotools-31.0-bin.zip geotools-31.0-doc.zip geotools-31.0-userguide.zip geotools-31.0-project.zip This release is also available from the OSGeo Maven Repository and is made in conjunction with GeoServer 2.25.0 and -
sur Mappery: Drinking Longitude
Publié: 19 March 2024, 11:00am CET
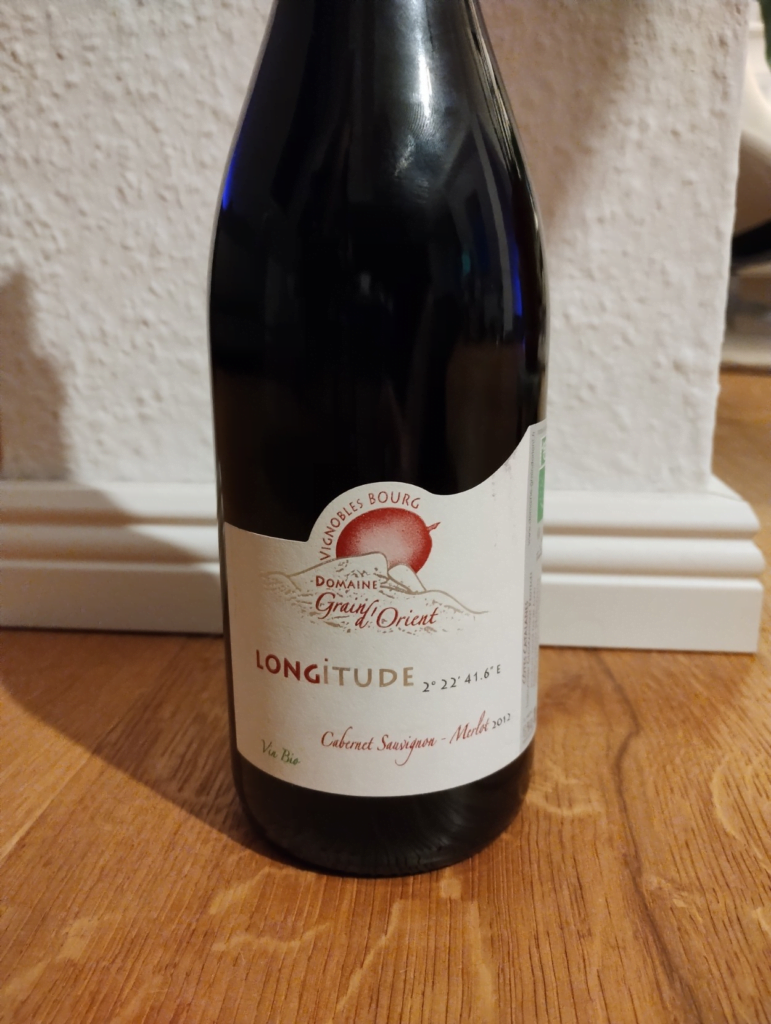
Javier asks whether this qualifies as a map in the wild? And we say “Why not?”
The blurb on the bottle should say “This wine will coordinate well with food from any latitude”
MapsintheWild Drinking Longitude
-
sur A Total Scrolly Eclipse
Publié: 19 March 2024, 10:10am CET par Keir Clarke
In three weeks time, on April 8, people across large parts of the USA will be able to watch a total solar eclipse. The path of totality, where the Moon's shadow completely falls during a total solar eclipse and where the view of the sun is completely obscured by the moon, will travel around 4,000 miles over North America from the Pacific Ocean west of Mexico, through 15 U.S. states, to the
-
sur GeoServer Team: GeoServer 2.25.0 Release
Publié: 19 March 2024, 1:00am CET
GeoServer 2.25.0 release is now available with downloads (bin, war, windows), along with docs and extensions.
This is a stable release of GeoServer recommended for production use. GeoServer 2.25.0 is made in conjunction with GeoTools 31.0, and GeoWebCache 1.25.0.
Thanks to Peter Smythe for making this release. Thanks to Levy Steve, Peter Smythe, Jody Garnett, and Mark Prins for testing the 2.25.0 release.
Security ConsiderationsThis release addresses several security vulnerabilities, all of which require admin access.
- If you have updated to GeoServer 2.24.2 Release or GeoServer 2.23.5 Release you are already patched.
- If you are working with a commercial support provider that volunteers with the geoserver-security email list they are already informed.
Vulnerabilities:
- CVE-2023-51444 Arbitrary file upload vulnerability in REST Coverage Store API (High).
- CVE-2023-41877 GeoServer log file path traversal vulnerability (High).
- CVE-2024-23634 Arbitrary file renaming vulnerability in REST Coverage/Data Store API (Moderate).
- CVE-2024-23643 Stored Cross-Site Scripting (XSS) vulnerability in GWC Seed Form (Moderate).
- CVE-2024-23821 Stored Cross-Site Scripting (XSS) vulnerability in GWC Demos Page (Moderate).
- CVE-2024-23819 Stored Cross-Site Scripting (XSS) vulnerability in MapML HTML Page (Moderate).
- CVE-2024-23818 Stored Cross-Site Scripting (XSS) vulnerability in WMS OpenLayers Format (Moderate).
- CVE-2024-23642 Stored Cross-Site Scripting (XSS) vulnerability in Simple SVG Renderer (Moderate).
- CVE-2024-23640 Stored Cross-Site Scripting (XSS) vulnerability in Style Publisher (Moderate).
- CVE-2023-51445 Stored Cross-Site Scripting (XSS) vulnerability in REST Resources API (Moderate).
We would like to thank everyone who contributed to reporting, verifying and fixing the above vulnerabilities (see each CVE for appropriate credits). A special thank you to Steve Ikeoka for reporting most of the issues and doing the majority of the actual fixes.
The use of the CVE system allows the GeoServer team to reach a wider audience than blog posts. See the project security policy for more information on how security vulnerabilities are managed.
Upgrade NotesWe have a number of configuration changes when updating an existing system:
-
The longstanding
ENTITY_RESOLUTION_ALLOWLISTsetting has been recommended as a way to control the locations available for external entity resolution when parsing XML documents and requests.The default has changed from
*(allowing any location) to allowing the recommendedwww.w3.org,schemas.opengis.net,www.opengis.netlocations used for OGC Web Services, along with theinspire.ec.europa.eu/schemaslocation used by our friends in Europe. -
The FreeMarker Template HTML Auto-escaping is now enabled by default.
-
The spring security firewall is now enabled by default.
-
A new configuration setting is available to limit content served from the
geoserver/wwwfolder.If you have not met the
wwwfolder before it is used to share content, and there is a tutorial serving static files. -
We do add recommendations to production considerations over time, if you have not checked that page in a while please review.
Thanks to Steve Ikeoka and Jody Garnett for these improvements.
JTS fast polygon intersection enabled by defaultThe JTS Next Generation polygon intersection algorithm has been enabled by default, which will improve performance of a number of operations, including WPS processes and the vector tiles generation. We deem the functionality well tested enough that it should be opened to the majority of users, even if it’s still possible to turn it off by adding the
-Djts.overlay=old.
MapML Extension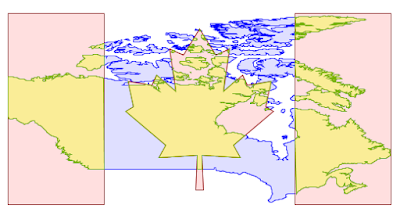
The MapML extension is receiving a number of updates and improvements, with more to come in the following months. It’s now possible to declare “Tiled CRS” as the CRS for a layer, with the implication not just of the CRS, but also of the gridset that will be used by the MapML viewer:
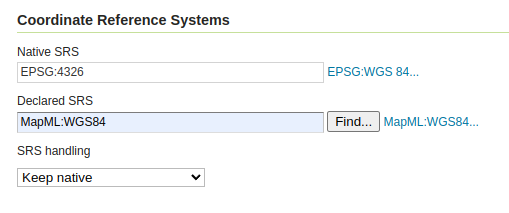
This portion builds on top of the work done months ago to support astronomical CRSs, which allows GeoServer to support multiple CRS authorities.
The MapML preview links are now using the new MapML output format, while the old dedicated REST controller has been removed. This allows for better integration of the MapML format in the GeoServer ecosystem. The MapML viewer has also been updated to the latest version:
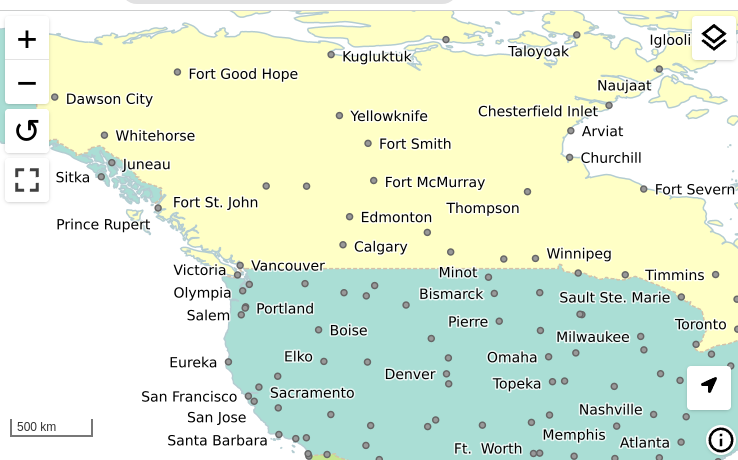
Thanks to Joseph Miller and Andrea Aime (GeoSolutions) for this work, and Natural Resources Canada for sponsoring it.
Community Module UpdatesMuch of the new activity in GeoServer starts as a community module. We’d like to remind you that these modules are not yet supported, and invite you to join the effort by participating in their development, as well as testing them and providing feedback.
Raster Attribute Table community moduleDeveloped as part of GEOS-11175, the Raster Attribute Table community module uses the GDAL Raster Attribute Table (RAT) to provide a way to associate attribute information for individual pixel values within the raster, to create styles as well as to provide a richer GetFeatureInfo output.
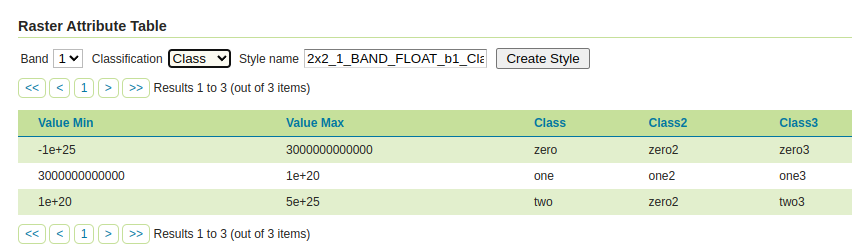
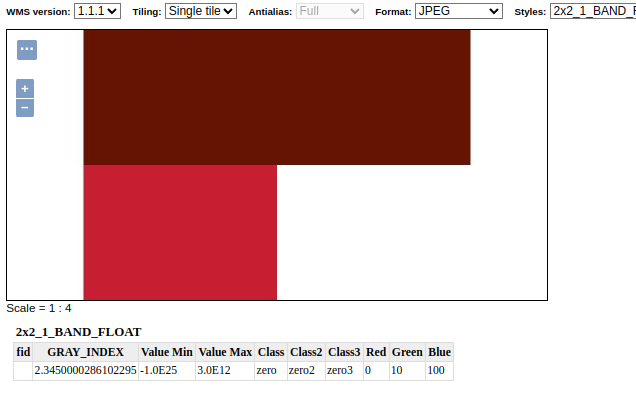
For more information see the user guide.
We’d like to thank Andrea Aime (GeoSolutions) for the development and NOAA for sponsoring.
Graticules for WMS mapsThe graticules community module, developed as part of GEOS-11216, provides a datastore generating graticules for WMS maps, along with a rendering transformation that can be used to label them. The module can be used to draw a graticule in WMS maps, as well as to download them as part of WFS (or in combination with the WPS download module).
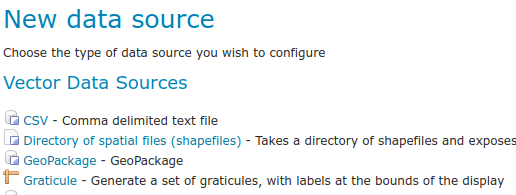
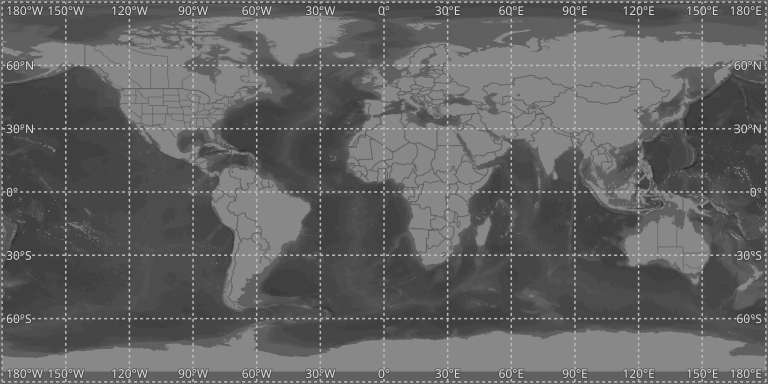
We’d like to thank Ian Turton for development and GeoSolutions for sponsoring the work.
GeoServer monitor Kafka storageThe monitoring Kafka storage module, developed as part of GEOS-11150, allows storing the requests captured by the monitoring extension into a Kafka topic.

We’d like to thank Simon Hofer for sharing his work with the community. To learn more about the module, how to install and use it, see the user-guide.
JWT HeadersThe JWT headers module has been developed as part of GEOS-11317.

The module is a new authentication filter that can read JWT Headers, as well as general JSON payloads and simple strings, to identify a user, as well as to extract their roles. The combination of Apache mod_auth_openidc with geoserver-jwt-headers-plugin provides an alternative to using the geoserver-sec-oauth2-openid-connect-plugin plugin.
We’d like to thank David Blasby (GeoCat) for this work on this module.
Developer Updates ResourceStore / Paths API ChangeDevelopers should keep in mind some important maintenance work performed by Niels Charlier on the use absolute and relative paths in the
ResourceStore. See the Developers Guide for more information.This does not affect end users.
Experimental Java 21 supportGeoServer, along with GeoTools and GeoWebCache, are now tested to build and pass tests with Java 21.
This is not yet an endorsement to run GeoServer in production with Java 21. We are looking ahead at the 2024 roadmap, and are making sure the basics are covered for the newer Java releases.
Full Release notesNew Feature:
- GEOS-11225 [AuthKey] AuthKey synchronize the user/group automatically
MapML:
- GEOS-10438 ENTITY_RESOLUTION_ALLOWLIST property not parsing empty setting
- GEOS-11207 Refactor MapML MVC controller as GetMap-based operation with standard parameter format
- GEOS-11221 mkdocs preflight rst fixes
- GEOS-11289 Enable Spring Security Stric [HttpFirewall] by default
- GEOS-11297 Escape WMS GetFeatureInfo HTML output by default
- GEOS-11300 Centralize access to static web files
Improvement:
- GEOS-11306 Java 17 does not support GetFeature lazy JDBC count(*)
- GEOS-11130 Sort parent role dropdown in Add a new role
- GEOS-11142 Add mime type mapping for yaml files
- GEOS-11148 Update response headers for the Resources REST API
- GEOS-11149 Update response headers for the Style Publisher
- GEOS-11152 Improve handling special characters in the Simple SVG Renderer
- GEOS-11153 Improve handling special characters in the WMS OpenLayers Format
- GEOS-11155 Add the X-Content-Type-Options header
- GEOS-11173 Default to using [HttpOnly] session cookies
- GEOS-11176 Add validation to file wrapper resource paths
- GEOS-11213 Improve REST external upload method unzipping
- GEOS-11222 Include Conformance Class for “Search” from OGC API - Features Part 5 proposal
- GEOS-11226 Enable JTS OverlayNG by default
- GEOS-11246 Schemaless plugin performance for WFS
- GEOS-11247 Avoid HTML annotations special status in APIBodyProcessor
- GEOS-11248 Move version header handling from APIBodyMethodProcessor to APIDispatcher
- GEOS-11260 JNDI tutorial uses outdated syntax
- GEOS-11288 Improve input validation in ClasspathPublisher
- GEOS-11289 Enable Spring Security Stric [HttpFirewall] by default
- GEOS-11298 When a Raster Attribute Table is available, expose its attributes in GetFeatureInfo
- GEOS-11327 Add warning about using embedded data directories
- GEOS-11334 Update MapML viewer to release 0.13.1
Bug:
- GEOS-11050 jdbc-store broken by changes to Paths.names
- GEOS-11051 Env parametrization does not save correctly in AuthKey extension
- GEOS-11145 The GUI “wait spinner” is not visible any longer
- GEOS-11182 Avoid legends with duplicated entries
- GEOS-11187 Configuring a raster with NaN as NODATA results in two NaN in the nodata band description
- GEOS-11190 GeoFence: align log4j2 deps
- GEOS-11203 WMS GetFeatureInfo bad WKT exception for label-geometry
- GEOS-11224 Platform independent binary doesn’t start properly with default data directory
- GEOS-11250 WFS GeoJSON encoder fails with an exception if an infinity number is used in the geometry
- GEOS-11278 metadata: only selected tab is submitted
- GEOS-11312 Used memory calculation fix on legend WMS request
- GEOS-11266 csw-iso: missing fields in summary response
- GEOS-11312 Inconsistent Memory Units in Legend Image Creation
- GEOS-11335 A layer in an authority other than EPSG may fail to reload after restart
Task:
- GEOS-11242 Remove the Xalan library
- GEOS-11315 Revert to CORS commented out
- GEOS-11318 Update postgresql to 42.7.2
- GEOS-11134 Feedback on download bundles: README, RUNNING, GPL html files
- GEOS-11141 production consideration for logging configuration hardening
- GEOS-11159 Update mapfish-print-lib 2.3.0
- GEOS-11180 Update ImageIO-EXT to 1.4.9
- GEOS-11181 Update jai-ext to 1.1.25
- GEOS-11186 Fix maven enforcer failFast
- GEOS-11220 Upgrade Hazelcast from 5.3.1 to 5.3.6
- GEOS-11245 Update OSHI from 6.2.2 to 6.4.10
- GEOS-11316 Update Spring version to 5.3.32
For the complete list see 2.25.0 release notes.
Community UpdatesCommunity module development:
- GEOS-11305 Add layer information in the models backing STAC
- GEOS-11146 Fix MBTiles output format test
- GEOS-11184 ncwms module has a compile dependency on gs-web-core test jar
- GEOS-11209 Open ID Connect Proof Key of Code Exchange (PKCE)
- GEOS-11212 OIDC accessToken verification using only JWKs URI
- GEOS-11219 Upgraded mail and activation libraries for SMTP compatibility
- GEOS-11293 Improve performance of wps-lontigudinal-profile
- GEOS-11216 Create a datastore to produce graticules for WMS maps.
Community modules are shared as source code to encourage collaboration. If a topic being explored is of interest to you, please contact the module developer to offer assistance.
About GeoServer 2.25 SeriesAdditional information on GeoServer 2.25 series:
-
sur GeoServer Team: GeoServer 2.25.0 Release
Publié: 19 March 2024, 1:00am CET
GeoServer 2.25.0 release is now available with downloads (bin, war, windows), along with docs and extensions.
This is a stable release of GeoServer recommended for production use. GeoServer 2.25.0 is made in conjunction with GeoTools 31.0, and GeoWebCache 1.25.0.
Thanks to Peter Smythe for making this release. Thanks to Levy Steve, Peter Smythe, Jody Garnett, and Mark Prins for testing the 2.25.0 release.
Security ConsiderationsThis release addresses several security vulnerabilities, all of which require admin access.
- If you have updated to GeoServer 2.24.2 Release or GeoServer 2.23.5 Release you are already patched.
- If you are working with a commercial support provider that volunteers with the geoserver-security email list they are already informed.
Vulnerabilities:
-
CVE-2023-51444 Arbitrary file upload vulnerability in REST Coverage Store API (High).
-
CVE-2023-41877 GeoServer log file path traversal vulnerability (High).
-
CVE-2024-23634 Arbitrary file renaming vulnerability in REST Coverage/Data Store API (Moderate).
-
CVE-2024-23643 Stored Cross-Site Scripting (XSS) vulnerability in GWC Seed Form (Moderate).
-
CVE-2024-23821 Stored Cross-Site Scripting (XSS) vulnerability in GWC Demos Page (Moderate).
-
CVE-2024-23819 Stored Cross-Site Scripting (XSS) vulnerability in MapML HTML Page (Moderate).
-
CVE-2024-23818 Stored Cross-Site Scripting (XSS) vulnerability in WMS OpenLayers Format (Moderate).
-
CVE-2024-23642 Stored Cross-Site Scripting (XSS) vulnerability in Simple SVG Renderer (Moderate).
-
CVE-2024-23640 Stored Cross-Site Scripting (XSS) vulnerability in Style Publisher (Moderate).
-
CVE-2023-51445 Stored Cross-Site Scripting (XSS) vulnerability in REST Resources API (Moderate).
We would like to thank everyone who contributed to reporting, verifying and fixing the above vulnerabilities (see each CVE for appropriate credits). A special thank you to Steve Ikeoka for reporting most of the issues and doing the majority of the actual fixes.
The use of the CVE system allows the GeoServer team to reach a wider audience than blog posts. See the project security policy for more information on how security vulnerabilities are managed.
Upgrade NotesWe have a number of configuration changes when updating an existing system:
-
The longstanding
ENTITY_RESOLUTION_ALLOWLISTsetting has been recommended as a way to control the locations available for external entity resolution when parsing XML documents and requests.The default has changed from
*(allowing any location) to allowing the recommendedwww.w3.org,schemas.opengis.net,www.opengis.netlocations used for OGC Web Services, along with theinspire.ec.europa.eu/schemaslocation used by our friends in Europe. -
The FreeMarker Template HTML Auto-escaping is now enabled by default.
-
The spring security firewall is now enabled by default.
-
A new configuration setting is available to limit content served from the
geoserver/wwwfolder.If you have not met the
wwwfolder before it is used to share content, and there is a tutorial serving static files. -
We do add recommendations to production considerations over time, if you have not checked that page in a while please review.
Thanks to Steve Ikeoka and Jody Garnett for these improvements.
JTS fast polygon intersection enabled by defaultThe JTS Next Generation polygon intersection algorithm has been enabled by default, which will improve performance of a number of operations, including WPS processes and the vector tiles generation. We deem the functionality well tested enough that it should be opened to the majority of users, even if it’s still possible to turn it off by adding the
-Djts.overlay=old.
MapML ExtensionThe MapML extension is receiving a number of updates and improvements, with more to come in the following months. It’s now possible to declare “Tiled CRS” as the CRS for a layer, with the implication not just of the CRS, but also of the gridset that will be used by the MapML viewer:
This portion builds on top of the work done months ago to support astronomical CRSs, which allows GeoServer to support multiple CRS authorities.
The MapML preview links are now using the new MapML output format, while the old dedicated REST controller has been removed. This allows for better integration of the MapML format in the GeoServer ecosystem. The MapML viewer has also been updated to the latest version:
Thanks to Joseph Miller and Andrea Aime (GeoSolutions) for this work, and Natural Resources Canada for sponsoring it.
Community Module UpdatesMuch of the new activity in GeoServer starts as a community module. We’d like to remind you that these modules are not yet supported, and invite you to join the effort by participating in their development, as well as testing them and providing feedback.
Raster Attribute Table community moduleDeveloped as part of GEOS-11175, the Raster Attribute Table community module uses the GDAL Raster Attribute Table (RAT) to provide a way to associate attribute information for individual pixel values within the raster, to create styles as well as to provide a richer GetFeatureInfo output.
For more information see the user guide.
We’d like to thank Andrea Aime (GeoSolutions) for the development and NOAA for sponsoring.
Graticules for WMS mapsThe graticules community module, developed as part of GEOS-11216, provides a datastore generating graticules for WMS maps, along with a rendering transformation that can be used to label them. The module can be used to draw a graticule in WMS maps, as well as to download them as part of WFS (or in combination with the WPS download module).
We’d like to thank Ian Turton for development and GeoSolutions for sponsoring the work.
GeoServer monitor Kafka storageThe monitoring Kafka storage module, developed as part of GEOS-11150, allows storing the requests captured by the monitoring extension into a Kafka topic.
We’d like to thank Simon Hofer for sharing his work with the community. To learn more about the module, how to install and use it, see the user-guide.
JWT HeadersThe JWT headers module has been developed as part of GEOS-11317.
The module is a new authentication filter that can read JWT Headers, as well as general JSON payloads and simple strings, to identify a user, as well as to extract their roles. The combination of Apache mod_auth_openidc with geoserver-jwt-headers-plugin provides an alternative to using the geoserver-sec-oauth2-openid-connect-plugin plugin.
We’d like to thank David Blasby (GeoCat) for this work on this module.
Developer Updates ResourceStore / Paths API ChangeDevelopers should keep in mind some important maintenance work performed by Niels Charlier on the use absolute and relative paths in the
ResourceStore. See the Developers Guide for more information.This does not affect end users.
Experimental Java 21 supportGeoServer, along with GeoTools and GeoWebCache, are now tested to build and pass tests with Java 21.
This is not yet an endorsement to run GeoServer in production with Java 21. We are looking ahead at the 2024 roadmap, and are making sure the basics are covered for the newer Java releases.
Full Release notesNew Feature:
- GEOS-11225 [AuthKey] AuthKey synchronize the user/group automatically
MapML:
- GEOS-10438 ENTITY_RESOLUTION_ALLOWLIST property not parsing empty setting
- GEOS-11207 Refactor MapML MVC controller as GetMap-based operation with standard parameter format
- GEOS-11221 mkdocs preflight rst fixes
- GEOS-11289 Enable Spring Security Stric [HttpFirewall] by default
- GEOS-11297 Escape WMS GetFeatureInfo HTML output by default
- GEOS-11300 Centralize access to static web files
Improvement:
- GEOS-11130 Sort parent role dropdown in Add a new role
- GEOS-11142 Add mime type mapping for yaml files
- GEOS-11148 Update response headers for the Resources REST API
- GEOS-11149 Update response headers for the Style Publisher
- GEOS-11152 Improve handling special characters in the Simple SVG Renderer
- GEOS-11153 Improve handling special characters in the WMS OpenLayers Format
- GEOS-11155 Add the X-Content-Type-Options header
- GEOS-11173 Default to using [HttpOnly] session cookies
- GEOS-11176 Add validation to file wrapper resource paths
- GEOS-11213 Improve REST external upload method unzipping
- GEOS-11222 Include Conformance Class for “Search” from OGC API - Features Part 5 proposal
- GEOS-11226 Enable JTS OverlayNG by default
- GEOS-11246 Schemaless plugin performance for WFS
- GEOS-11247 Avoid HTML annotations special status in APIBodyProcessor
- GEOS-11248 Move version header handling from APIBodyMethodProcessor to APIDispatcher
- GEOS-11260 JNDI tutorial uses outdated syntax
- GEOS-11288 Improve input validation in ClasspathPublisher
- GEOS-11289 Enable Spring Security Stric [HttpFirewall] by default
- GEOS-11298 When a Raster Attribute Table is available, expose its attributes in GetFeatureInfo
- GEOS-11327 Add warning about using embedded data directories
- GEOS-11334 Update MapML viewer to release 0.13.1
Bug:
- GEOS-11050 jdbc-store broken by changes to Paths.names
- GEOS-11051 Env parametrization does not save correctly in AuthKey extension
- GEOS-11145 The GUI “wait spinner” is not visible any longer
- GEOS-11182 Avoid legends with duplicated entries
- GEOS-11187 Configuring a raster with NaN as NODATA results in two NaN in the nodata band description
- GEOS-11190 GeoFence: align log4j2 deps
- GEOS-11203 WMS GetFeatureInfo bad WKT exception for label-geometry
- GEOS-11224 Platform independent binary doesn’t start properly with default data directory
- GEOS-11250 WFS GeoJSON encoder fails with an exception if an infinity number is used in the geometry
- GEOS-11278 metadata: only selected tab is submitted
- GEOS-11312 Used memory calculation fix on legend WMS request
- GEOS-11266 csw-iso: missing fields in summary response
- GEOS-11312 Inconsistent Memory Units in Legend Image Creation
- GEOS-11335 A layer in an authority other than EPSG may fail to reload after restart
Task:
- GEOS-11242 Remove the Xalan library
- GEOS-11315 Revert to CORS commented out
- GEOS-11318 Update postgresql to 42.7.2
- GEOS-11134 Feedback on download bundles: README, RUNNING, GPL html files
- GEOS-11141 production consideration for logging configuration hardening
- GEOS-11159 Update mapfish-print-lib 2.3.0
- GEOS-11180 Update ImageIO-EXT to 1.4.9
- GEOS-11181 Update jai-ext to 1.1.25
- GEOS-11186 Fix maven enforcer failFast
- GEOS-11220 Upgrade Hazelcast from 5.3.1 to 5.3.6
- GEOS-11245 Update OSHI from 6.2.2 to 6.4.10
- GEOS-11316 Update Spring version to 5.3.32
For the complete list see 2.25.0 release notes.
Community UpdatesCommunity module development:
- GEOS-11305 Add layer information in the models backing STAC
- GEOS-11146 Fix MBTiles output format test
- GEOS-11184 ncwms module has a compile dependency on gs-web-core test jar
- GEOS-11209 Open ID Connect Proof Key of Code Exchange (PKCE)
- GEOS-11212 OIDC accessToken verification using only JWKs URI
- GEOS-11219 Upgraded mail and activation libraries for SMTP compatibility
- GEOS-11293 Improve performance of wps-lontigudinal-profile
- GEOS-11216 Create a datastore to produce graticules for WMS maps.
Community modules are shared as source code to encourage collaboration. If a topic being explored is of interest to you, please contact the module developer to offer assistance.
About GeoServer 2.25 SeriesAdditional information on GeoServer 2.25 series:
-
sur Free and Open Source GIS Ramblings: Getting started with pygeoapi processes
Publié: 18 March 2024, 8:16pm CET
Today’s post is a quick introduction to pygeoapi, a Python server implementation of the OGC API suite of standards. OGC API provides many different standards but I’m particularly interested in OGC API – Processes which standardizes geospatial data processing functionality. pygeoapi implements this standard by providing a plugin architecture, thereby allowing developers to implement custom processing workflows in Python.
I’ll provide instructions for setting up and running pygeoapi on Windows using Powershell. The official docs show how to do this on Linux systems. The pygeoapi homepage prominently features instructions for installing the dev version. For first experiments, however, I’d recommend using a release version instead. So that’s what we’ll do here.
As a first step, lets install the latest release (0.16.1 at the time of writing) from conda-forge:
conda create -n pygeoapi python=3.10
conda activate pygeoapi
mamba install -c conda-forge pygeoapi
Next, we’ll clone the GitHub repo to get the example config and datasets:
cd C:\Users\anita\Documents\GitHub\
git clone [https:]
cd pygeoapi\
To finish the setup, we need some configurations:
cp pygeoapi-config.yml example-config.yml
# There is a known issue in pygeoapi 0.16.1: [https:]
# To fix it, edit the example-config.yml: uncomment the TinyDB option in the server settings (lines 51-54)

$Env:PYGEOAPI_CONFIG = "F:/Documents/GitHub/pygeoapi/example-config.yml"
$Env:PYGEOAPI_OPENAPI = "F:/Documents/GitHub/pygeoapi/example-openapi.yml"
pygeoapi openapi generate $Env:PYGEOAPI_CONFIG --output-file $Env:PYGEOAPI_OPENAPI
Now we can start the server:
pygeoapi serveAnd once the server is running, we can send requests, e.g. the list of processes:
curl.exe [localhost:5000]And, of course, execute the example “hello-world” process:
curl.exe --% -X POST [localhost:5000] -H "Content-Type: application/json" -d "{\"inputs\":{\"name\": \"hi there\"}}"As you can see, writing JSON content for curl is a pain. Luckily, pyopenapi comes with a nice web GUI, including Swagger UI for playing with all the functionality, including the hello-world process:

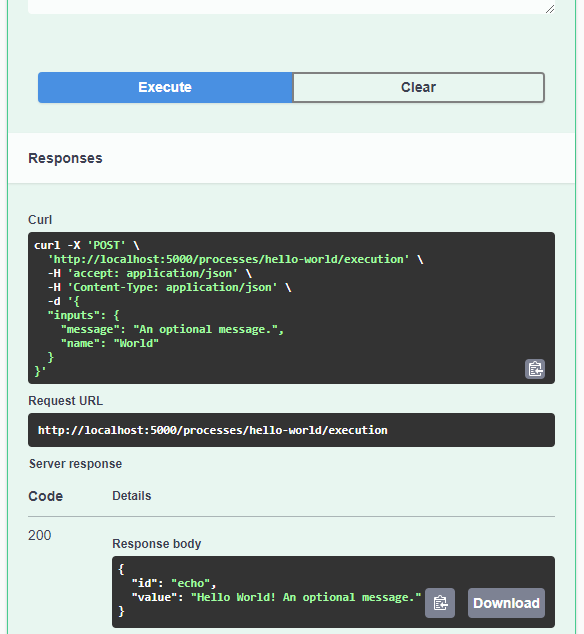
It’s not really a geospatial hello-world example, but it’s a first step.
Finally, I wan’t to leave you with a teaser since there are more interesting things going on in this space, including work on OGC API – Moving Features as shared by the pygeoapi team recently:
So, stay tuned.
-
sur GRASS GIS: 2024 GRASS GIS Community meeting in Prague!
Publié: 18 March 2024, 8:12pm CET
The GRASS GIS team announces the annual Community Meeting!! The GRASS GIS Community Meeting will take place from June 14 to 19, 2024, at the NC State European Center in Prague, Czech Republic. Community meetings are great opportunities to support the development of GRASS GIS! Join us Write code Write documentation Translation Website design and content Integrations with other software (QGIS, GDAL, R, etc.) Plan for the future The community meeting is a get-together where supporters, contributors, power users and developers make decisions and tackle larger problems related to the project, discuss and fix bugs, draw the project roadmap and work on new features. -
sur Fernando Quadro: Geoprocessamento no Agronegócio
Publié: 18 March 2024, 1:00pm CET
O geoprocessamento na agricultura reúne tecnologias e métodos essenciais para coletar, tratar e analisar diversos dados sobre a produção agropecuária.
Com isso o produtor pode ter acesso a imagens e mapas precisos, além de poder traçar planejamentos mais eficientes. Assim consegue aumentar a produtividade e se tornar mais competitivo.
Por isso, o investimento em tecnologias de geoprocessamento na agricultura é considerado fundamental para o produtor que quer melhorar seus resultados.
Mas, como isso pode ajudar o agricultor na prática? Vamos citar abaixo alguns benefícios:
 Acesso a informações mais detalhadas sobre cada talhão
Identificação de tendências de produtividade
Permitir o trabalho com parceiros de negócio
Identificação de pragas e doenças
Controle de plantas daninhasO uso do WebGIS vem sendo uma tendência que cresce a cada dia nesse setor. Sua possibilidade de interação e disponibilização de informações para o usuário é um elemento fundamental que faz com que este tipo de sistema de informação geográfica conectado à internet seja uma importante vertente para o futuro das geotecnologias.
-
sur Mappery: No Cigars!
Publié: 18 March 2024, 11:00am CET

Reinder sent this pic, he said “In Amsterdam, they named the Balthasar Floriszstraat after a 17th C. mapmaker. In this street I ran into a rather peculiar world map. The caption says ‘No Cigars'”
MapsintheWild No Cigars!
-
sur Mapping the History of the Railway
Publié: 18 March 2024, 9:58am CET par Keir Clarke
Martin Brake has created a number of interactive maps which visualize the historical development of transport networks in Germany, London, Paris and Barcelona. His Timemap Timelines project provides an animated map for each featured city which shows how its transit network has grown over time. For example the screenshot above shows the development of the London Underground between 1858 and 1947.
-
sur Camptocamp: Camptocamp Heads to FOSSGIS 2024
Publié: 18 March 2024, 1:00am CET
Pièce jointe: [télécharger]
The Camptocamp team is gearing up for another great experience at the FOSSGIS conference. -
sur Mappery: Rishikesh Hostel
Publié: 17 March 2024, 11:00am CET

Elizabeth is back in Rishikesh and sent thios pic from the lobby of her hostel
MapsintheWild Rishikesh Hostel
-
sur Ecodiv.earth: Download AHN data in GRASS GIS
Publié: 17 March 2024, 12:00am CET
The AHN
The ‘Actueel Hoogtebestand Nederland’ (AHN, version 4) is the latest digital elevation model (DEM) of the Netherlands. It includes a digital terrain model (DTM) and a digital surface model (DSM). The former represents the bare ground surface without any features such as buildings, vegetation, or other structures, while the latter includes these features.
Both layers can be downloaded at 0.5 or 5 meter resolution in tiles of 6.5 by 5 km. Downloading one tile, which is approximately 500 MB, is doable. However, if you need more tiles, the arguably easier way is to download the data using the WCS (Web Coverage Service) protocol, which allows you to choose what part of the available data to download based on spatial constraints.
Import the DTMThis example shows the steps to download the 0.5 meter resolutiom DTM for the Land van Cuijk, a municipality in which our research group Climate-robust Landscapes is carrying out several studies. The first step is to get the r.in.wcs addon. With this addon, you can use the WCS protocol to download data 1 2.
Install the r.in.wcs addon.
First step is to import the Python libraries. Note, this will not be repeated with the next scripts.
import grass.script as gsNow, you can install the
r.in.wcsaddon using the g.extension function.gs.run_command("g.extension", extension="r.in.wcs")You need the
g.extensionfunction to install addons. In the main menu, go toSettings > Addons extension > Install extension from addon. Alternatively, type ing.extensionon the command line. This will open the window shown below.
The g.extension function, started from the command line.
The r.in.wcs addon imports the raster layers using the resolution and extent of the current region. A crucial step, therefore, is to set the extent and resolution of the region so that it aligns perfectly with that of the AHN layer.
Set the extent and resolution to match those of the AHN.
gs.run_command("g.region",
    n=618750,
    s=306250,
    w=10000,
    e=280000,
    res=0.5)
Type in
g.regionon the command line or in the console. You can also find the function undermain menu > Settings > Computational region > set region. This opens the following screen:
Set the bounds
Set the resolution
With this settings, you align the region with the AHN data set.
Next, download the administrative boundaries of the Dutch municipalities, and extract the boundaries of the “Land van Cuijk”.
Download layer with administrative boundaries of the neighborhood.
gs.run_command(
    "v.in.wfs",
    url="https://service.pdok.nl/cbs/wijkenbuurten/2022/wfs/v1_0?",
    output="municipalities",
    name="gemeenten",
)
Next, extract the boundaries of the municipality of “Land van Cuijk”
gs.run_command(
    "v.extract",
    input="municipalities",
    where="naam = 'Land van Cuijk'",
    output="LandvanCuijk",
)
Type in
v.in.wfson the command line or in the console. You can also find the function undermain menu > File > Import vector data. This opens the following screen (you need to fill in parameters in two tabs):
Download the vector layer with the municipality boundaries. Define the base URL and the name of the output layer.
Download the vector layer with the municipality boundaries. Fill in the name of the WFS layer to download.
Extract the boundaries of the municipality of Land van Cuijk. Select the name of the vector layer with municipalities and give the name of the output layer.
Extract the boundaries of the municipality of Land van Cuijk. Fill in the query, which defines which features you want to select and save. Tip: Use the convenient query builder.
Now, you can set the region to match the extent of the vector layer, while taking care that the region aligns perfectly with the DTM.
Set the region to the correct extent and resolution.
First, get the north, south, east, and west coordinates of the bounding box of the vector layer and of the region’s extent.
region_tiles = gs.parse_command("g.region",
    flags="gu")
region_munic = gs.parse_command("v.info",
    flags="g",
    map="LandvanCuijk")
Now, adjust the northern boundary of the bounding box of the vector layer so that it aligns with the AHN tiles.
from math import floor

n = float(region_tiles["n"]) - floor(
    (float(region_tiles["n"]) - float(region_munic["north"]))
)
s = float(region_tiles["s"]) + floor(
    (float(region_munic["south"]) - float(region_tiles["s"]))
)
w = float(region_tiles["w"]) + floor(
    (float(region_munic["west"]) - float(region_tiles["w"]))
)
e = float(region_tiles["e"]) - floor(
    (float(region_tiles["e"]) - float(region_munic["east"]))
)
gs.run_command("g.region", n=n, s=s, e=e, w=w)
And finally, import the DTM layer. Warming, this may take some time.
Import the DTM for the defined region.
gs.run_command(
    "r.in.wcs",
    url="https://service.pdok.nl/rws/ahn/wcs/v1_0?",
    coverage="dtm_05m",
    urlparams="GetMetadata",
    output="dtm_05",
)
The maximum floating-point value (
3.4028235e+38) is not recognized as a NULL value. So use thesetnullparameter in the r.null function to specify that this value has to be set to NULL.gs.run_command("r.null", map="dtm_05", setnull=3.4028235e+38)If this does not work (it didn’t for me), you can use the r.mapcalc function to set this value to NULL.
gs.run_command("r.mapcalc",
    expression="dtm_05m = if(dtm_05m > 1000,null(),dtm_05m)",
    overwrite=True)
Fill in the WCS service URL
Get the overage name to requestTo make it a bit easier, I combined steps 2, 4, and 5 in a new addon r.in.ahn. It is a bit rough around the edges (it only works in a Location with CRS RD New), but it serves its goal. I have submitted it to the GRASS GIS addon repository, so I hope it will be available in a week or so.
FootnotesYou are expected to be familiar with GRASS GIS and the concept of region used in GRASS GIS. If you are new to GRASS GIS, you are warmly recommended to first check out the GRASS GIS Quickstart and the explanation about the GRASS GIS database.??
Downloading the DTM for the whole municipality will take a while. If you want to speed up things, you can work with a smaller area by using your own vector data.??


-
sur Visit a Virtual Medieval Farm
Publié: 16 March 2024, 11:14am CET par Keir Clarke
Havrå is a collection of 36 medieval buildings in Western Norway. It is now a living museum which allows visitors to explore a traditional Norwegian cluster farm, a traditional community settlement where multiple individual farms and their houses were built close together.If you can't visit the Havrå living museum in person you can now explore the farm in virtual reality instead. The
-
sur Mappery: Contour Insoles for Hill Climbers
Publié: 16 March 2024, 11:00am CET
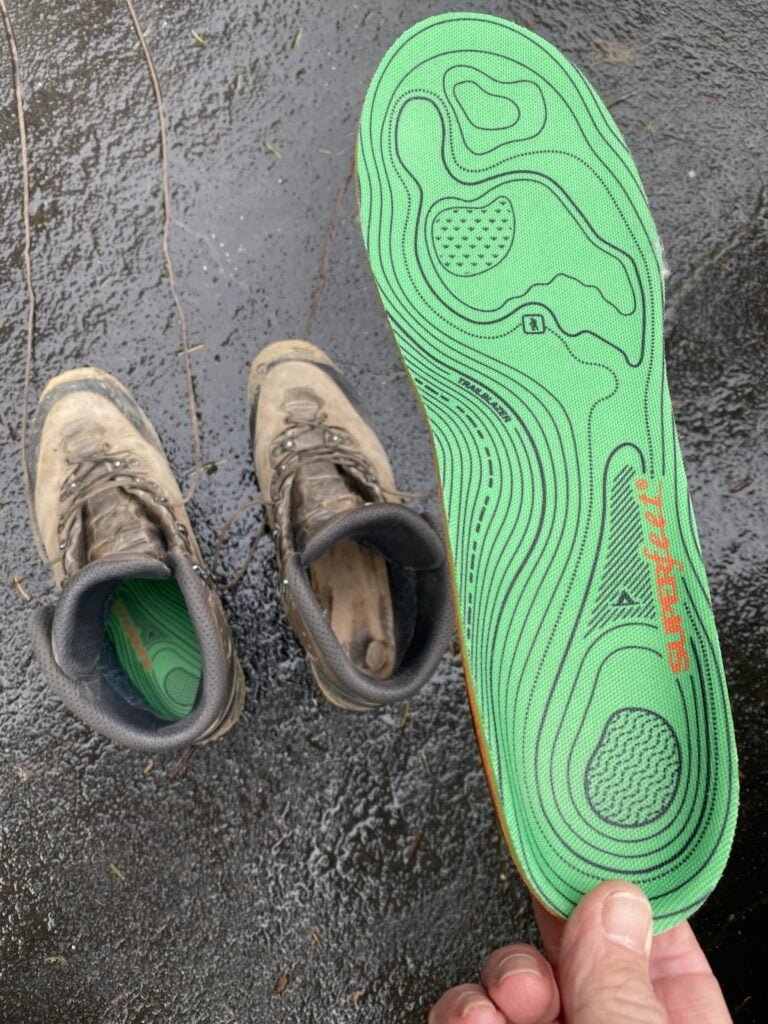
Walter Schwartz said “Every Wednesday my hiking group covers about 15 km of distance and 500 meters of elevation, almost always “in the wild.” As one of us changed into hiking shoes I spotted this insole. It’s a kind of map that has seen plenty of wild!”
I think we may have had a similar insole picture in the past but this is such a great pic even if it is a repeat.
MapsintheWild Contour Insoles for Hill Climbers
-
sur Mappery: Cape Geography Wine
Publié: 15 March 2024, 11:00am CET

Rollo was drinking this tasty South African Malbec from the Cape Geography Co and was inspired to send us a pic before he finished the bottle!
MapsintheWild Cape Geography Wine
-
sur The 100 Most Segregated School Districts in America
Publié: 15 March 2024, 9:47am CET par Keir Clarke
In the United States school district boundaries drawn onto economically and racially segregated neighborhoods ensure that most poor and non-white students receive a much worse education than students in the more affluent school districts.Back in 2016 NPR examined how school funding in the USA is used to ensure that the rich get the best schools. They created an interactive map which visualized
-
sur GRASS GIS: Cite GRASS with DOI
Publié: 15 March 2024, 8:42am CET
Cite GRASS GIS and your geospatial data in scientific works - now with Digital Object Identifiers (DOI)! The GRASS GIS project celebrated its 40th birthday last year. Over the decades, GRASS GIS has spread around the globe and has enabled generations of researchers to conduct geospatial research in many fields of science. As a new feature, reflecting the current change towards data-driven science and the paradigms of Open Science (including Open Source) and the FAIR principles (Findable, Accessible, Interoperable, Reusable), GRASS GIS software can now be referenced by Digital Object Identifiers (DOI). -
sur GeoCat: GeoCat is the proud sponsor of the 128th OGC Member Meeting in Delft, the Netherlands
Publié: 14 March 2024, 3:02pm CET
GeoCat is happy to announce that we are the proud sponsor of the 128th OGC Member Meeting that takes place in Delft in the Netherlands from March 25th – March 28th, 2024.
The meeting’s theme is “GEO-BIM for the Built Environment” and there will be a GeoBIM Summit, a special session on Land Admin, a Built Environment Joint Session, a meeting of the Europe Forum, and several SWG and DWG meetings.
Join us and members of the OGC. We are looking forward to see you all in Delft.
Read more about the meeting on the OGC website.
The post GeoCat is the proud sponsor of the 128th OGC Member Meeting in Delft, the Netherlands appeared first on GeoCat bv.
-
sur Registration opens for OGC Innovation Days Europe 2024
Publié: 14 March 2024, 2:00pm CET par Simon Chester
The Open Geospatial Consortium (OGC) is excited to announce that registration is open for OGC Innovation Days Europe. Held in conjunction with FOSS4G Europe 2024, on July 1-2, in Tartu, Estonia, the event will focus on themes of Climate and Disaster Resilience, One Health, and the corresponding Data Spaces. Registration is available here.
OGC Innovation Days Europe seeks to address stakeholders’ and policymakers’ need for digital solutions that can meet their requirements efficiently and in a user-friendly way. To this end, the event will bring internationally leading software development and data management experts together with non-technical experts – such as urban planners, policy makers, economists, and other beneficiaries of geospatial information – to exchange information and learn from each other. The stakeholders’ needs will be discussed and understood in depth while newly developed prototypes will be presented.
OGC is co-organizing Innovation Days Europe with the General Authority for Survey and Geospatial Information (GEOSA, Saudi Arabia) and FOSS4G-Europe.
The European IT landscape is changing rapidly. Several initiatives are underway, such as developing Data Spaces and Digital Twins, supporting the Green Deal, or otherwise trying to integrate the largely heterogeneous IT landscape. What do these mean for the leading challenges of our century? How can these predominantly technologically oriented efforts help with climate change and disaster resilience? Do they support Land Degradation Neutrality?
OGC Innovation Days Europe provides a platform to discuss how current technical efforts can be combined effectively with the necessary governance and policy aspects. What decision processes do we need? What agreements are required for efficient decision processes or homogeneous reporting models for, for example, Climate Change or Land Degradation Neutrality?
Thematic focus: Climate and Disaster Resilience, One Health, and Data Spaces.Achieving climate and disaster resilience and sustainability requires reliable location information on the environment, land, and climate. Generating this information dedicated to the users’ needs is challenging. It needs highly optimized spatial data infrastructures and climate resilience information systems operated within a targeted policy framework and driven by an efficient policy model. Interoperable data pipelines and well-organized data spaces with their data assessment applications, combined with analysis, visualization, and reporting tools, are required to gain the knowledge to enroll climate strategies and actions.
OGC Innovation Days Europe will foster a dialogue between technical experts, decision-makers, and policy experts, with a focus on climate & disaster resilience, one health, the role of data spaces, and the need for modernized knowledge exchange and analysis environments.
OGC Innovation Days Europe supports the shift in IT solutions from being purely technology-oriented to a more holistic approach that better accounts for the various needs of the stakeholders. The event will identify these needs and thus make an essential contribution to improving the direction of future technological developments, supporting operational setups that are driven by efficient governance models and that operate within a solution-oriented policy framework.
OGC Innovation Days Europe 2024 is sponsored by OGC, the General Authority for Survey and Geospatial Information, Saudi Arabia, and the European Commission through the Horizon projects CLINT (GA-101003876), AD4GD (GA-101061001), USAGE (GA-101059950), Iliad (GA-101037643), EuroGEOSec (GA-101134335), CLIMOS (GA-101057690) and other projects of the Climate-Health Cluster.
OGC Innovation Days Europe will run in conjunction with FOSS4G Europe 2024 from July 1-2, in Tartu, Estonia. Learn more and register on the FOSS4G Europe 2024 website.

The post Registration opens for OGC Innovation Days Europe 2024 appeared first on Open Geospatial Consortium.
-
sur Fernando Quadro: Raster no PostGIS, vale a pena?
Publié: 14 March 2024, 1:00pm CET
Você sabe quais os benefícios e as armadilhas de colocar arquivos rasters em um banco de dados relacional?
A maioria das pessoas pensa que “colocar em um banco de dados” é uma receita mágica para: desempenho mais rápido, escalabilidade infinita e gerenciamento fácil.
Se você pensar que o banco de dados está substituindo uma pilha de arquivos CSV, isso provavelmente é verdade.
Porém quando o banco de dados está substituindo uma coleção de arquivos de imagens GeoTIFF, isso provavelmente é falso. O raster no banco de dados será mais lento, ocupará mais espaço e será muito chato de gerenciar.
Então, por que fazer isso? Comece com um padrão, “não!”, e então avalie a partir daí.
Para alguns dados raster não visuais e casos de uso que envolvem o enriquecimento de vetores de fontes raster, ter o raster colocalizado com os vetores no banco de dados pode tornar o trabalho com ele mais conveniente. Porém, ainda será mais lento que o acesso direto e ainda será difícil de gerenciar, mas permite o uso de SQL como uma linguagem de consulta, o que pode oferecer muito mais flexibilidade para explorar o espaço da solução do que um script de acesso a dados criado especificamente para esse fim.
Fonte: webgis.tech
Instagram: [https:]]
LinkedIn: [https:]]Gostou desse post? Deixe seu comentário

-
sur Flip Off the World with Street View
Publié: 14 March 2024, 11:32am CET par Keir Clarke
AI and Street View seems like the perfect match. Last month panoramai released a fun tool which allowed users to change the appearance of Google Maps Street View images based on their own AI prompts. The app became so popular it had to be turned off because of the costs being incurred by the developers (you can still browse the example images created with the app).Now a new Ai and Street View