
Vous pouvez lire le billet sur le blog La Minute pour plus d'informations sur les RSS !
Canaux
2684 éléments (0 non lus) dans 55 canaux

-
 Décryptagéo, l'information géographique
-
Cybergeo
-
Revue Internationale de Géomatique (RIG)
-
SIGMAG & SIGTV.FR - Un autre regard sur la géomatique
-
Mappemonde
-
Imagerie Géospatiale
-
Toute l’actualité des Geoservices de l'IGN
-
arcOrama, un blog sur les SIG, ceux d ESRI en particulier
-
arcOpole - Actualités du Programme
-
Géoclip, le générateur d'observatoires cartographiques
-
Blog GEOCONCEPT FR
-
Géoblogs (GeoRezo.net)
-
Conseil national de l'information géolocalisée
-
 Geotribu
-
Les cafés géographiques
-
UrbaLine (le blog d'Aline sur l'urba, la géomatique, et l'habitat)
-
Icem7
-
Séries temporelles (CESBIO)
-
Datafoncier, données pour les territoires (Cerema)
-
Cartes et figures du monde
-
SIGEA: actualités des SIG pour l'enseignement agricole
-
Data and GIS tips
-
Neogeo Technologies
-
ReLucBlog
-
L'Atelier de Cartographie
-
My Geomatic
-
archeomatic (le blog d'un archéologue à l’INRAP)
-
Cartographies numériques
-
Veille cartographie
-
Makina Corpus
-
Oslandia
-
Camptocamp
-
Carnet (neo)cartographique
-
Le blog de Geomatys
-
GEOMATIQUE
-
Geomatick
-
CartONG (actualités)

Planet OSGeo
-
sur Mappery: Arab Islands in Reflection
Publié: 18 April 2024, 11:00am CEST
Stan Carey shared this mirror map.
“Mirrors in the shape of the Aran Islands at Connemara Airport, alongside Tim Robinson’s map for lo-fi comparison (below)”

MapsintheWild Arab Islands in Reflection
-
sur Paul Ramsey: Cancer 4
Publié: 18 April 2024, 2:00am CEST
Cancer is a mind fuck.
I mean, it’s a body fuck too, obviously, but the early experience for me has been of weird gyrations of mental health and mood with each passing day.
The first thing I did was the first thing everyone does – look up all the different probabilities of five year survival, because that’s what at the top of the Google search.
With a stage two diagnosis (hard to know if that’s actually what I have, though) Google says I have a 10% chance of dying over the next five years.

Now, here’s an fact – my odds of dying just in the ordinary course of affairs over the next five years are about 4.5%.
Does that stop me from being 1000% more terrified, on a daily basis, since receiving my diagnosis? No it does not.
A good deal of that terror, I think, is that cancer promises a patient a long and painful interaction with a medical system that has only destructive rear-guard actions at hand to stop it. Cut things out; kill it with poison; zap it with radiation. These procedures all leave a body worse for wear, and if they don’t work… they bring you back and do some more of them.
My great grandfather died while rolling a ball on the lawn bowling green in his late 80s. Massive stroke, he died doing something he loved and was dead before he hit the ground. Floyd Ramsey hit the mortality jackpot.
Naturally, I would also like to hit that jackpot. Cancer says, “not so fast, you might have a different life experience ahead of you”.
It would be a little too pat to say that getting a diagnosis starts you off on the stages of grief, because that implies some orderly process to the mental evolution. I am not progressing linearly through the stages of grief, so much as visiting them randomly, over and over, in an emotional shuffle mode.
Some days are denial days. Some days are acceptance days. Some days are bargaining days.
I told my councillor last week that “I only feel OK to the extent that I am dissociative”, and that seems to still hold true. I am at my most together when I have fully distracted myself from the diagnosis. I’m not sure if this counts as “taking one day at a time”. Probably not.
Talk to you again soon, on the other side, inshalla.
-
sur Mappery: Floor Puzzle Map
Publié: 17 April 2024, 11:00am CEST
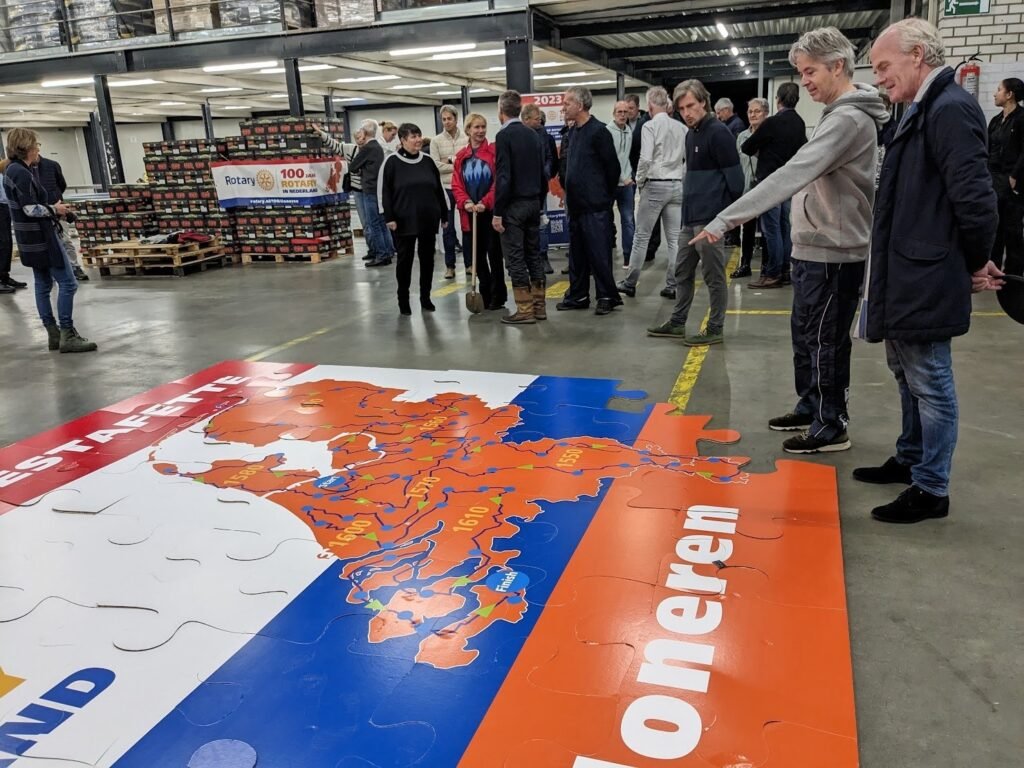
Erik shared this great puzzle map.
“100 years of #RotaryInternational in the Netherlands celebrated with a biking marathon for charity through the country. Today”
MapsintheWild Floor Puzzle Map
-
sur Mappery: Peaks Island Cooler
Publié: 16 April 2024, 11:00am CEST

Doug shared this “Map of Peaks Island keeping my hands warm and my beer cool.”
MapsintheWild Peaks Island Cooler
-
sur Paul Ramsey: Cancer 3
Publié: 16 April 2024, 2:00am CEST
A common refrain on my Facebook cancer support groups is that the first months after diagnosis can be among the most stressful. You know the least about the actual extent of your condition, but you simultaneously know for sure that your life is going to change a great deal, starting now.
It is also the first time for grieving.
In the worst case it is grieving actual mortality, the very real threat of the end. But even in a relatively low impact diagnosis like my (current) one, there is grief. It is the grief of lost futures, lost plans, lost self-image.
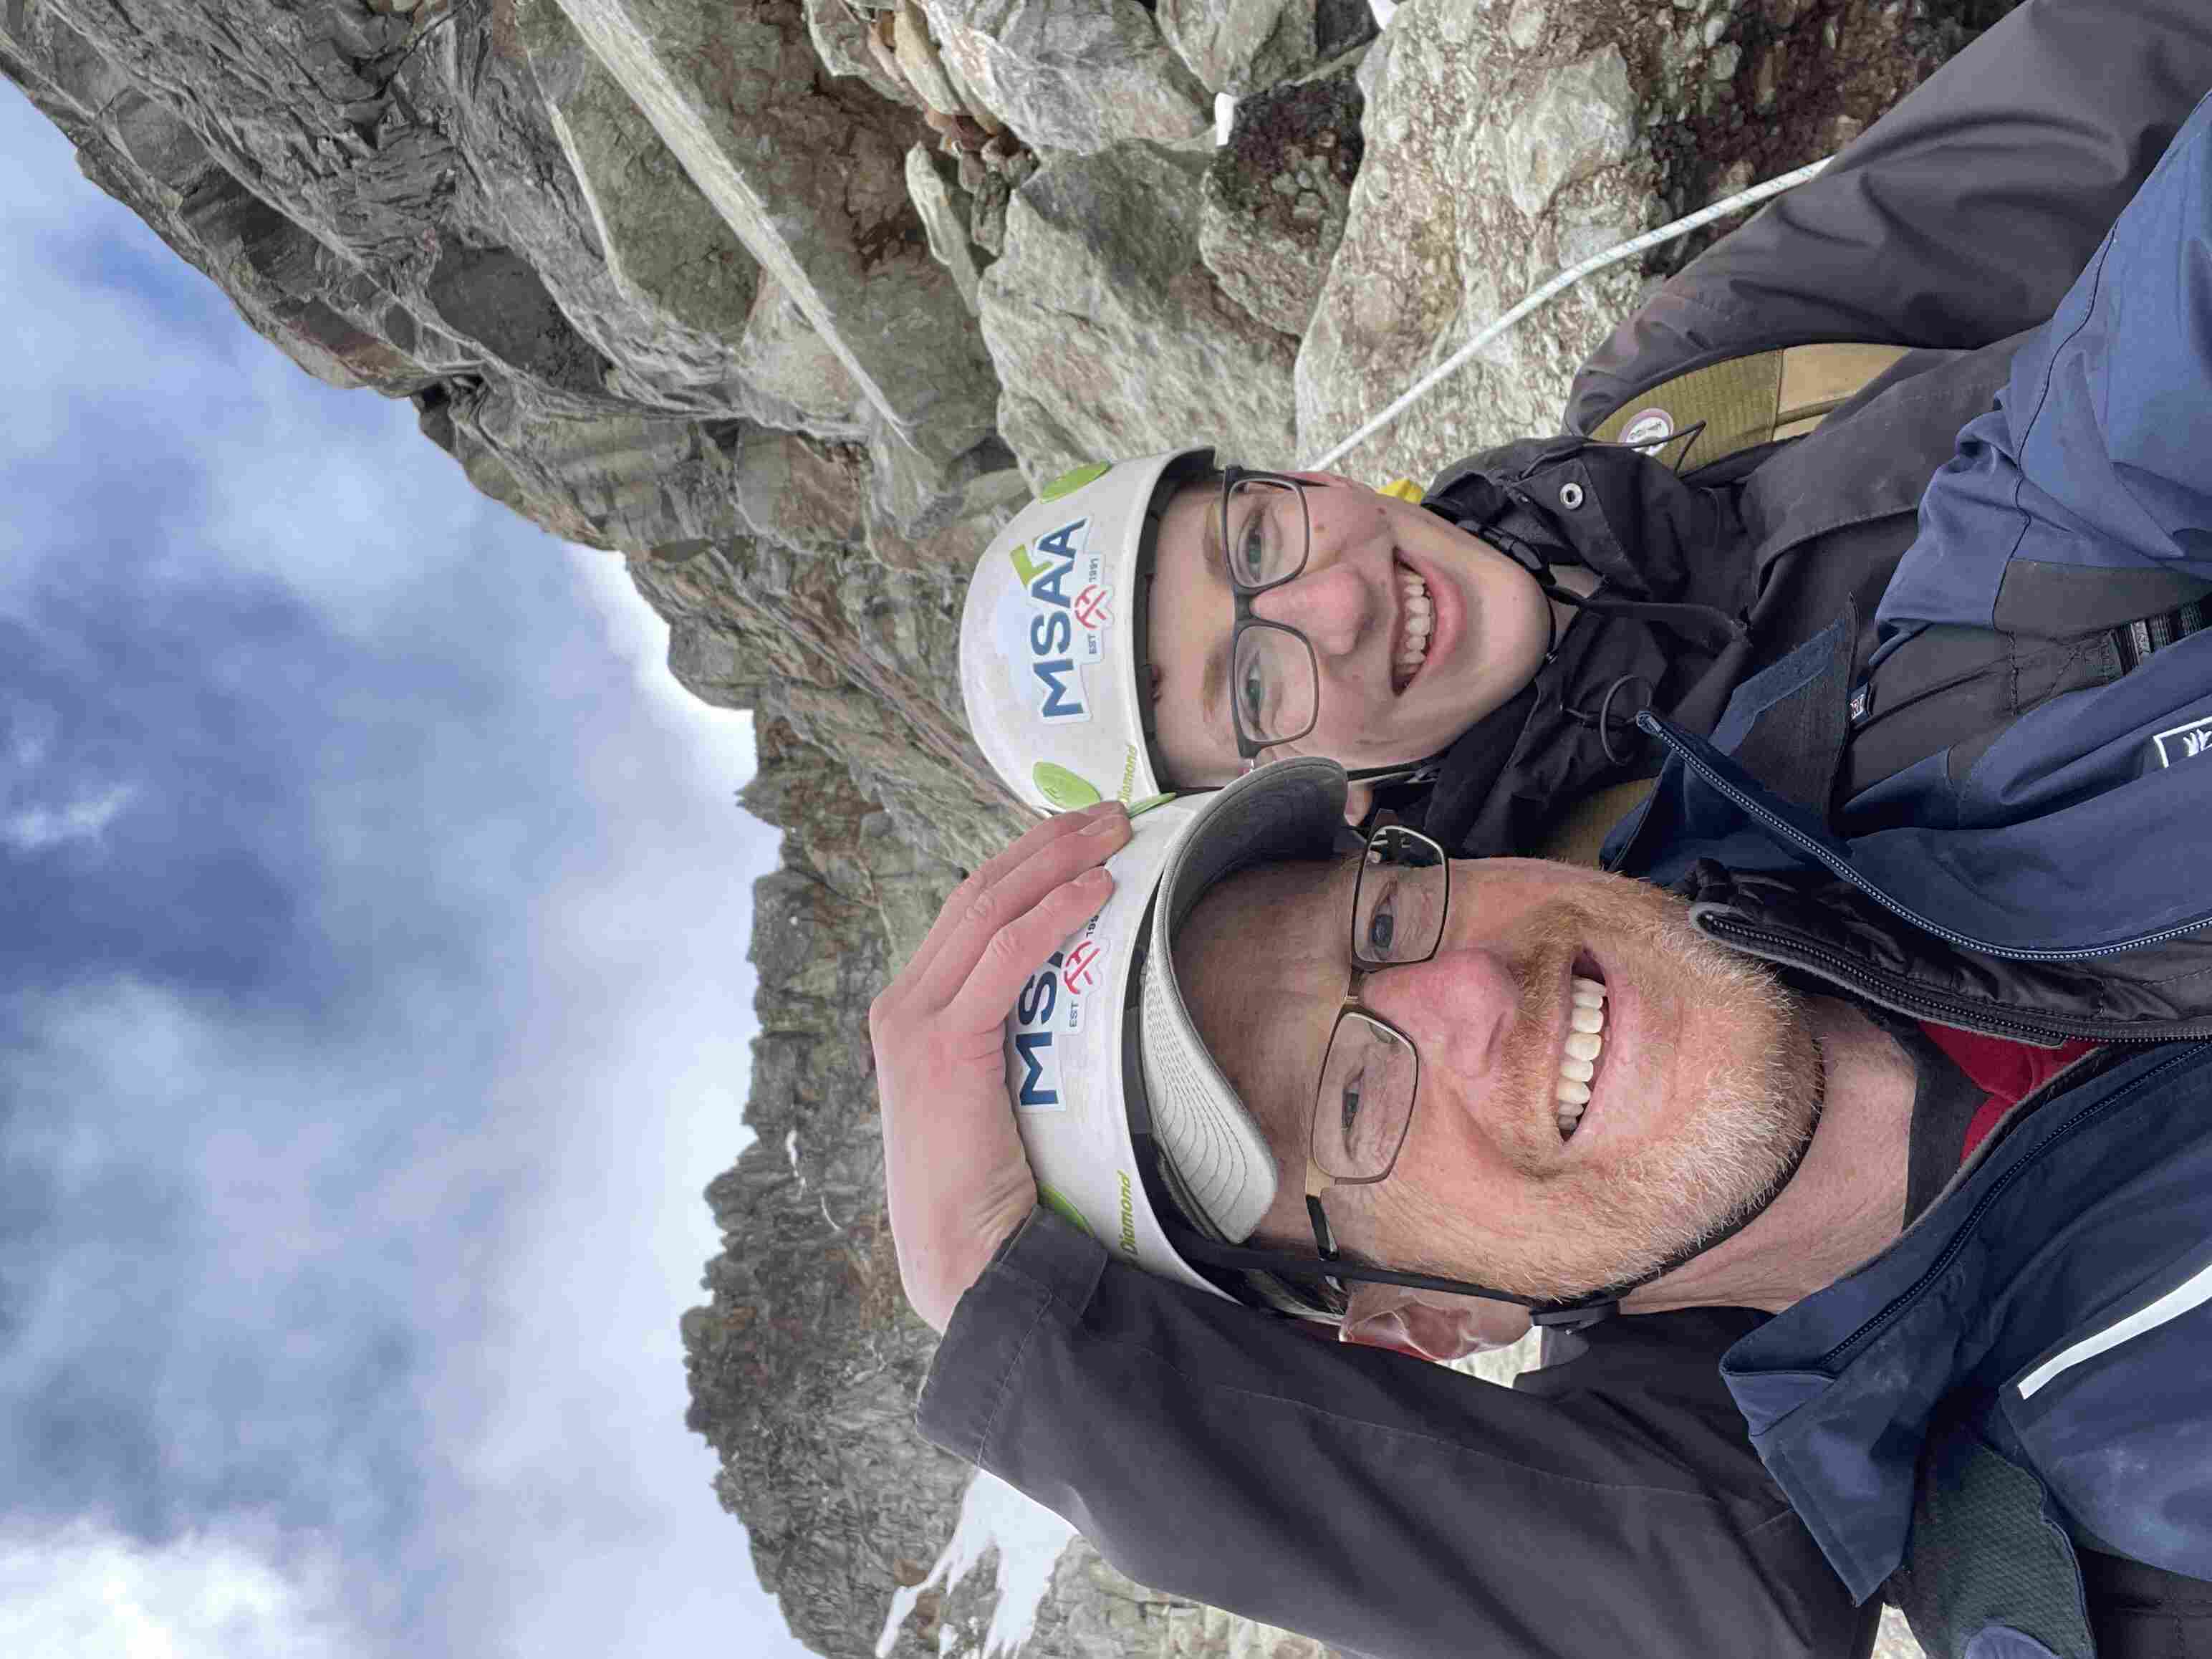
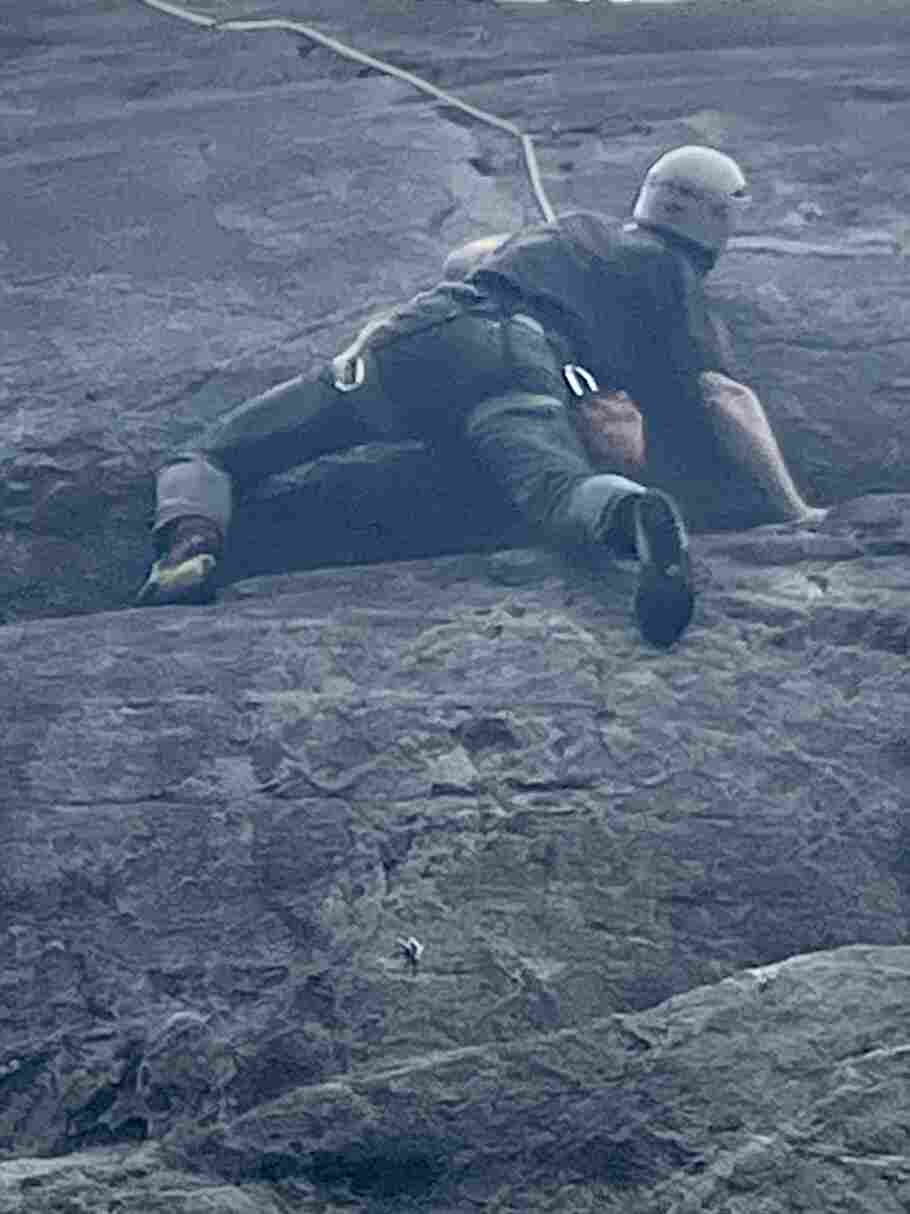
I am a person who runs and climbs and rows and goes on long walks and travels and teaches and speaks publicly. At least, I was. If all goes according to plan, there will eventually be a new me, who does some or many of those things. Maybe not all of them anymore, there is no predictability or control.

Last Christmas I took my family to Rome over the holidays. “No time like the present!” I said, little knowing how apt that would be. I’m glad for everything I have done with my family. Climbing mountains, scaling cliffs, travelling afar, and even the predictable summer trips to the beach.
Some of these adventures were quite hard, and in the moment I wondered to myself “what the heck were you thinking?” In the end, I regretted none of it, and we all have lifelong memories we share.
Before she was killed by cancer, Amy Ettinger wrote:
I’ve always tried to say yes to the voice that tells me I should go out and do something now, even when that decision seems wildly impractical … Money always comes back, but if you miss out on an experience, the opportunity may never come back.
I am trying to pack as much climbing, and eating out, and walks to the cafe, and evening date nights into my life as I can, before the start of treatment. It’s too late for anything big, but these are little things that bring me joy that may become harder to do, after.
My surgery date is set now, and the procedure will mark an abrupt decline and then the start of a long slow climb back up to whatever “new normal” my body can fashion from my reconfigured plumbing. Some people have great results, some people have terrible ones.
As always, there’s no way to know, the grey area is omnipresent, which is perhaps why I sound so morose.
Talk to you again soon, inshalla.
-
sur Sean Gillies: Bear training weeks 1-8
Publié: 15 April 2024, 11:28pm CEST
The first quarter of my season has been challenging. I've had to deal with injuries and other niggles, and I'm just starting to feel better when I run. Moving forward on fitness while not being able to run very much has been an interesting problem to work on.
As I mentioned in Preason running I started my 8 week block of interval workouts with nagging knee pain. This pain continued for 6 weeks. I dealt with it by alternating outdoor runs with low-impact sessions on an elliptical or stair-stepper machine. I did one outdoor session of hill intervals and one indoor session of stair-stepper intervals every week. By the end of the block, I was doing 36 minutes of hard uphill running, and 4 hours of easier running or stepping in a week. It's not where I want to be. At least I didn't have to skimp on the hard intervals. I'm satisfied with doing as much hard running as my knee allowed, and enjoy feeling more fit.
At the end of last year, I was determined to get some physical therapy and rehabilitate my ankles and feet. I've been visiting a local clinic once a month and have been diligent about doing the recommended exercises. The therapist says that I have good range of motion in my ankles, though there is an imbalance; my right ankle has excellent mobility while the left is only better than average. My bigger problem, in the therapist's view, was that my toes and feet are weak. I needed to build muscle so that I can do toe stands easily and lift my arches. So, I've been going to the gym to build muscle three times a week. I do sets of back squats (5 x 5) for overall strength, and then do sets (3 x 10) of single-leg calf raises on a step with a kettlebell, single-leg squats with toe taps using a barbell and band around my thighs, and single-leg deadlifts with dumbbells. The Three Amigos, as I've been calling these single-leg exercises, have been working for me. My feet and lower legs are stronger and their imbalances are getting ironed out. I feel almost equally good with the deadlifts now, wobbling just one time out of ten, at most, on my left leg. The therapist has me progressing to single-leg jumping now, and I'm feeling better balance with the new exercises, too.
Consistent strength training, conservative running, and changing the way I sit at work seem to have let my knee recover. I'm standing, sitting on a stool, and reclining more when I work, using a conventional office chair less, and at maximum height when I do.
A radiology visit in December revealed that I'm developing a bone spur on my right heel. I wonder if this is yet another symptom of imbalance in my feet and legs, more stress on my right foot caused by favoring my weaker left? I'm getting some consultation on this and meanwhile am icing regularly. Two weeks ago I had to stop running for 3 days to treat aggravation of my right sciatic nerve. It was a good reminder to be more diligent about stretching and foam rolling. Otherwise, I'm doing pretty well. Heart palpitations are behind me. I'm eating and sleeping well, keeping sinus infections at bay, and enjoying longer days and generally nice spring weather.
I'm grateful to be able to continue training and am looking forward to a productive block of tempo running.
-
sur Mappery: Can you guess where this fingerpost is?
Publié: 15 April 2024, 12:00pm CEST

Harel Dan shared this pic with me. Can you guess where it is? Scroll down to find out.

Harel explained “The uniquely American passion for copying other placenames from every corner of the world, led to there being all these places within a few hundred miles of each other in the state of Maine. Someone was clever enough to make a tourist trap out of it.”
MapsintheWild Can you guess where this fingerpost is?
-
sur Mappery: Compass Coffee
Publié: 14 April 2024, 12:00pm CEST
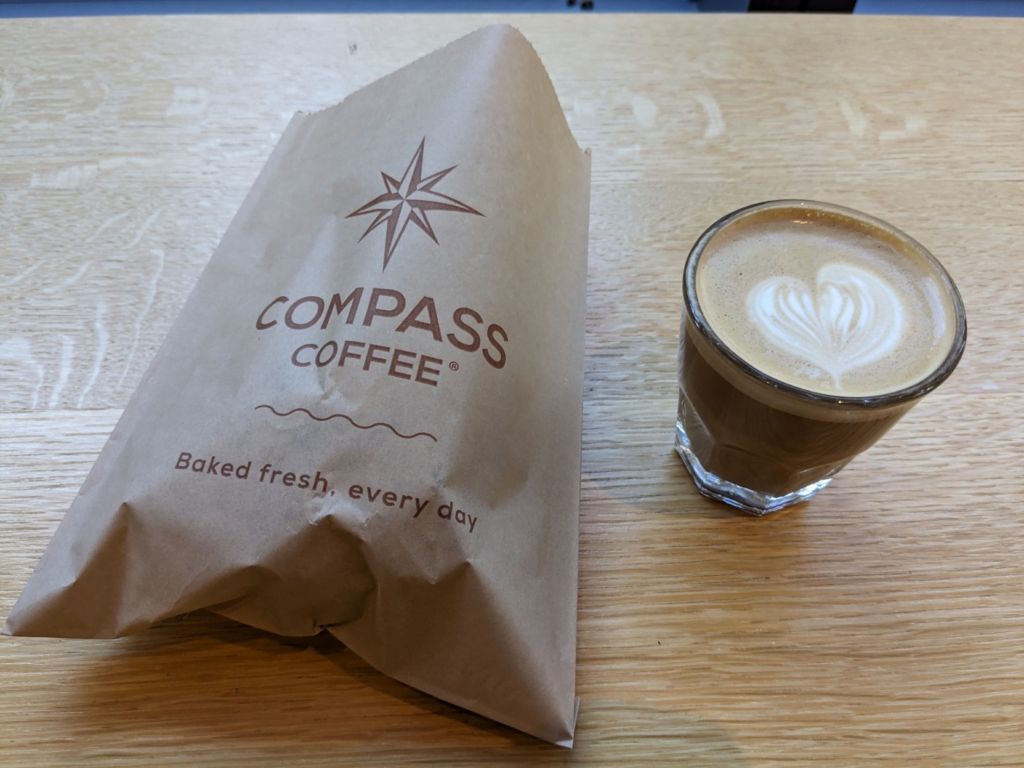
Another one from Erik’s US trip
I know that some will complain about the cardinal points not being a map but we have had them before and if you want to go ultra geek you could probably visualise a country outline in a weird projection in the coffee.
MapsintheWild Compass Coffee
-
sur Paul Ramsey: Cancer 2
Publié: 14 April 2024, 2:00am CEST
Before I joined the population of fellow cancer travellers, I had the same simple linear understanding of the “process” that most people do.
You get diagnosed, you get treatment, it works or it doesn’t.
What I didn’t appreciate (and this will vary from cancer to cancer, but my experience is with colorectal) is how little certainty there is, and how wide the grey areas are.
Like, in my previous post, I said I was “diagnosed” with cancer. Which maybe made you think I have it. But that’s not how it works. I had a colonoscopy, and a large polyp was removed, and that polyp was cancerous, and a very small part of it could not be excised. So it’s still in me.
Do I have cancer? Maybe! I have a probability of having live cancer cells in me that is significantly higher than zero. But not as high as one.
How bad is what I have? This is also a game of probabilty. Modern technology can shave off the edges of the distribution, but it can’t quite nail it down.
A computed tomography (CT) scan didn’t show any other tumors in my body, so that means I probably don’t have “stage 4” (modulo the resolution of the scan), which is mostly incurable (though it can be manageable), where the cancer has managed to spread outside the colon.
An MRI didn’t show any swollen lymph nodes, which means I maybe do not have “stage 3”, which requires chemotherapy, because the cancer has partially escaped the colon. But MRI results are better at proving rather than disproving nodal involvement and people report having surgical results that run counter to the MRI all the time.
That leaves me (theoretically) at “stage 2”, looking at a surgical “cure” that involves removing the majority of my rectum and a bunch of lymph nodes. At that point (after the major life-altering surgery!) the excised bits are sent to a pathologist, and the probability tree narrows a little more. Either the pathologist finds cancer in the nodes (MRI was wrong), and I am “upstaged” to stage 3 and sent to chemotherapy, or she doesn’t and I remain a stage 2 and move to a program of monitoring.
In an exciting third possibility, the pathologist finds no cancer in the lymph nodes or the rectum, which means I will have had major life-altering surgery to remove… nothing dangerous. My surgeon says I should find this a happy result (no cancer!) which is probably because he’s seen so many unhappy results, but it’s a major surgery with life-long side effects and I would do almost anything to not have to have it.
Amazingly, despite our modern technology there’s just no way to know for sure if there are still live cancer cells in me short of taking the affected bits out and doing the pathology. Or waiting to see if something grows back, which is to flirt with a much worse prognosis.
Monitoring will be regular blood tests, annual scans and colonoscopies for several years, as the probability of recurrence slowly and asymptotically moves toward (but never quite arrives at) zero. And all those tests and procedures have their own error rates and blind spots.
There are no certainties. All the measuring and cutting and chemicals, and I will still have not driven the cancer entirely out, it will stubbornly remain as a probability, a non-zero ghost haunting me every year of the rest of my hopefully long life.

And of course worth mentioning, I am getting the snack-sized, easy-mode version of this experience! People in stage three or stage four face a probability tree with a lot more “and then you probably die in a few years” branches, and the same continuous reevaluation of that tree, with each new procedure and scan, each new discovery of progression or remission.
Talk to you again soon, inshalla.
-
sur Mappery: The Pieces of London
Publié: 13 April 2024, 11:00am CEST

We all love a map jigsaw, well at least Harry Woods and I do. Here’s Harry making a jigsaw map of London that was made from OpenStreetMap.
I guess you could make a jigsaw of your favourite location, could be one for my friends at SplashMaps.
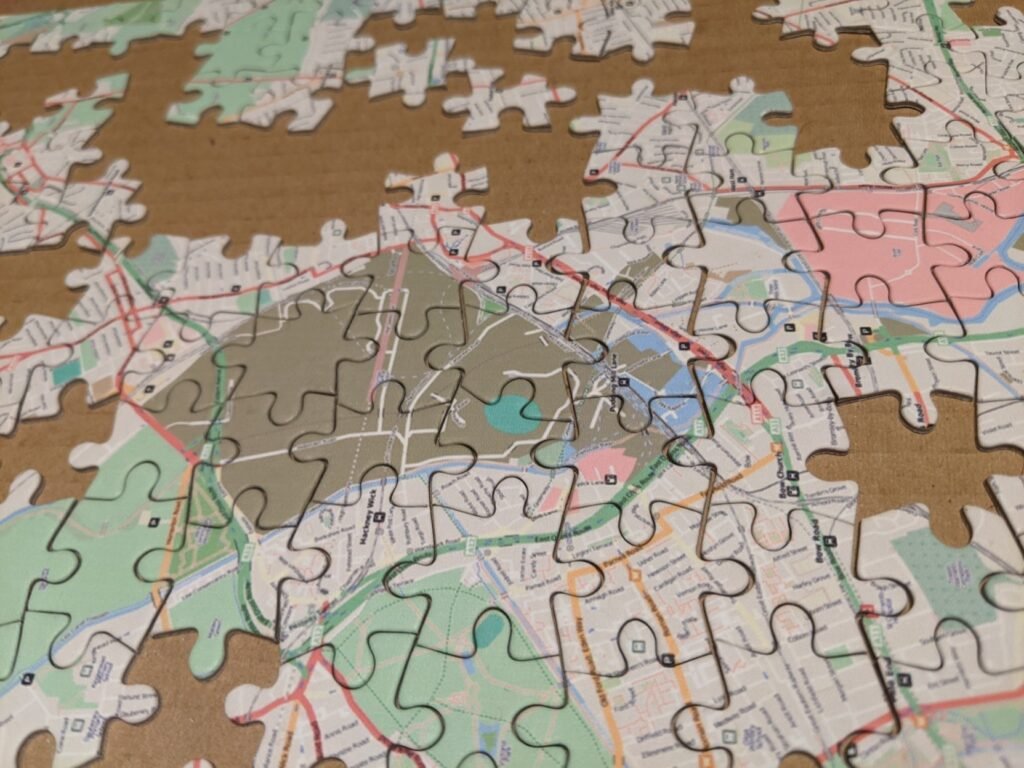

MapsintheWild The Pieces of London
-
sur gvSIG Batoví: Participante en concurso Proyectos de Geografía con estudiantes y gvSIG Batoví seleccionado para el programa ICT Training for Colombian Teachers 2024
Publié: 12 April 2024, 9:24pm CEST
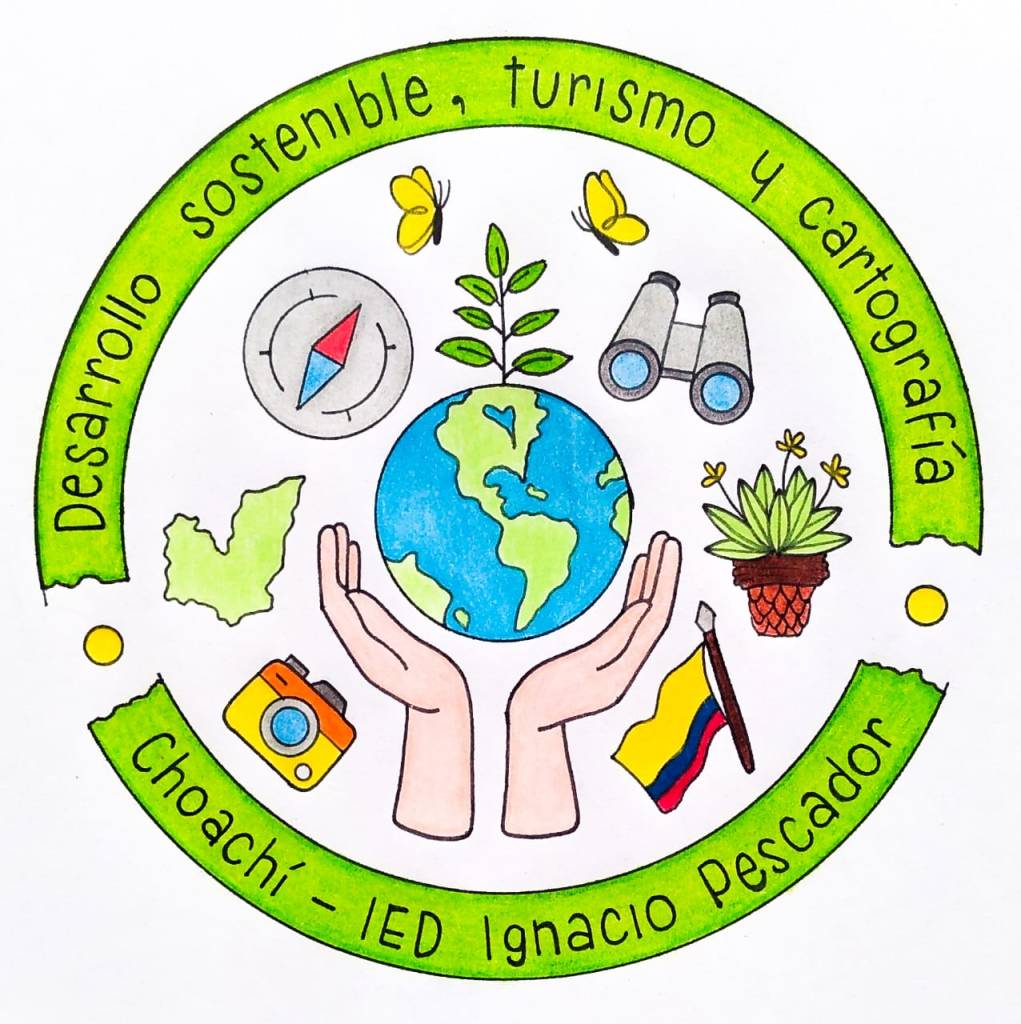 logo del proyecto
Es con gran placer que informamos que el equipo ganador por Colombia de la edición 2023 del concurso Proyectos con Estudiantes y gvSIG Batoví fue seleccionado para el Programa de entrenamiento en el uso pedagógico de las TIC – Convocatoria 2024

Como resultado, el proyecto viaja a Corea del Sur.
Postulación al programa ICT Training for Colombian Teachers 2024: Estrategia desarrollo sostenible, turismo y cartografia en Choachí.Nos llena de orgullo saber que la iniciativa del Curso – Concurso Geoalfabetización mediante la utilización de Tecnologías de la Información Geográfica (que en el año 2023 tuvo por primera vez participantes fuera de Uruguay) permita que un proyecto desarrollado en Colombia (y que ameritó haber sido declarado ganador del concurso) dé a conocer la experiencia aún más internacionalmente.
 el equipo colombiano ganador con los diplomas del concurso Proyectos de Geografía con estudiantes y gvSIG Batoví
Felicitamos a la profesora Astrid Corredor por el logro obtenido. Estos resultados son los que nos convencen cada día de continuar con la iniciativa del curso-concurso para seguir difundiendo el uso de las Tecnologías Libres de Información Geográfica como herramientas de enseñanza y de generación de conocimiento.
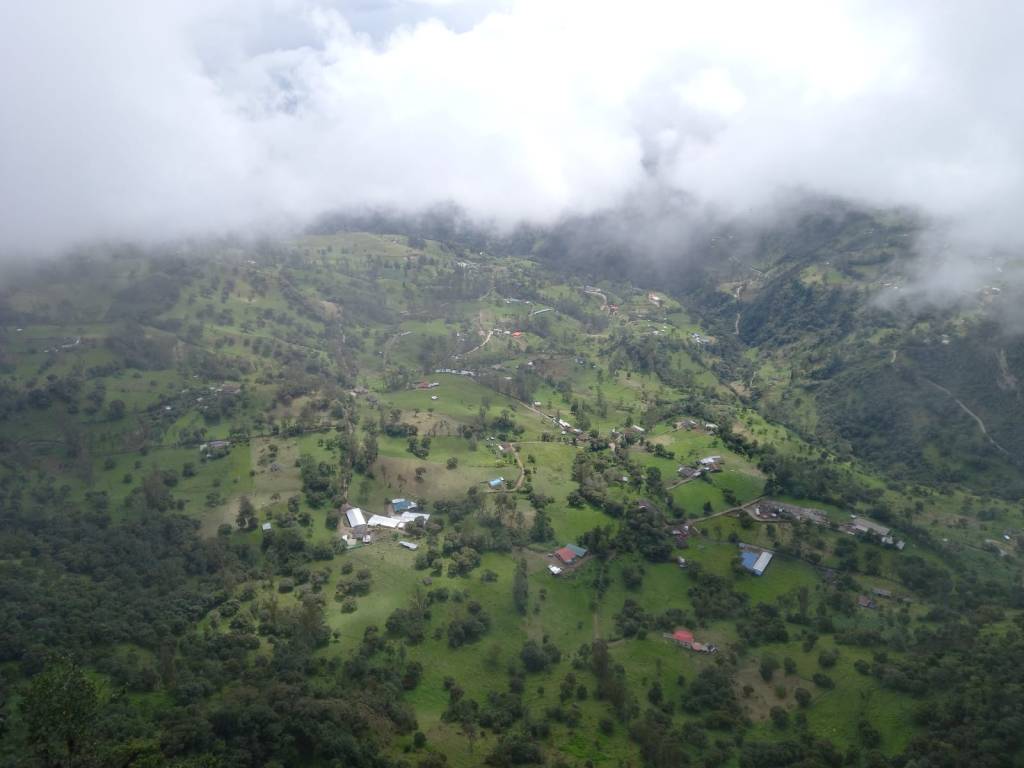 vista del municipio de Choachí desde el páramo
 -
sur Mappery: Great Lakes Drainage Basin Map Umbrella
Publié: 12 April 2024, 11:00am CEST
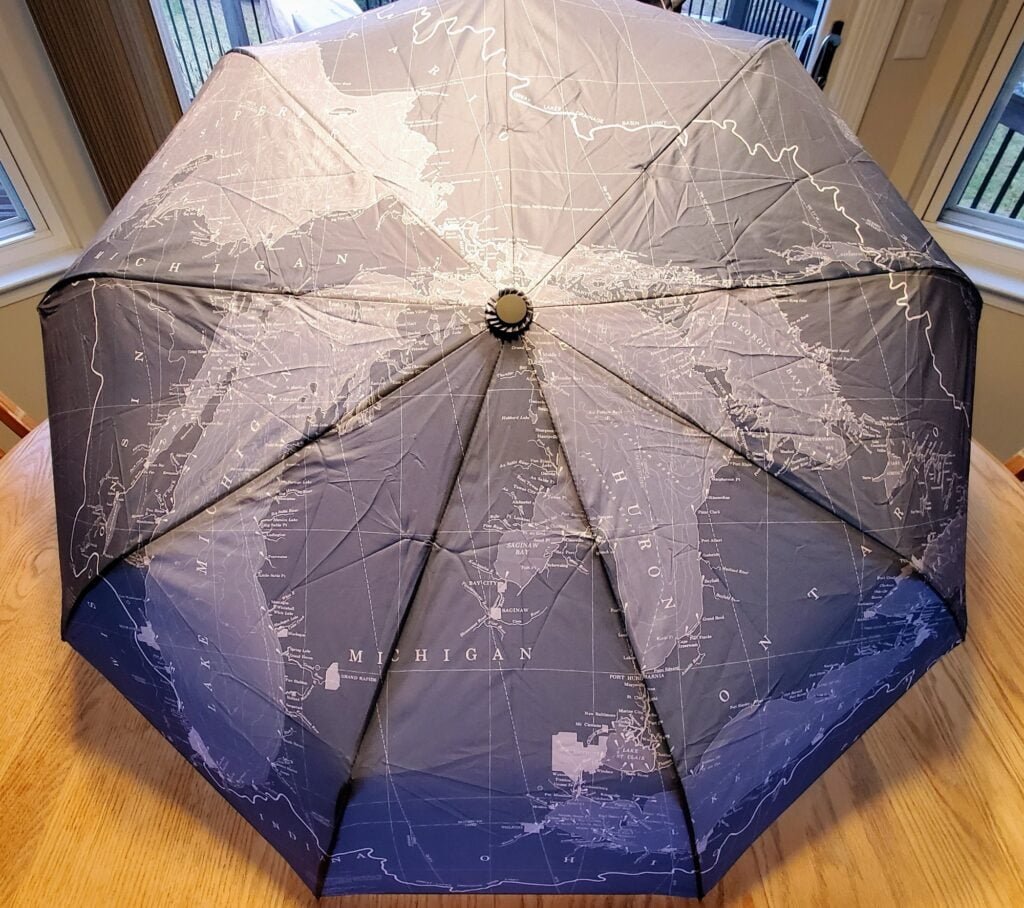
Matt Malone was one happy geographer when he got this umbrella for Christmas.
MapsintheWild Great Lakes Drainage Basin Map Umbrella
-
sur Mappery: As Strong as Worcester Sauce
Publié: 11 April 2024, 11:00am CEST

Harry Wood spotted this on the Archway Road in north London. I’m guessing that this is a removal van with some strong people but the connection to Worcester Sauce baffles me
MapsintheWild As Strong as Worcester Sauce
-
sur Paul Ramsey: Cancer 1
Publié: 10 April 2024, 6:00pm CEST
A little over a month ago, three days after my 53rd birthday, I received a diagnosis of rectal cancer. Happy birthday to me.
Since then, I have been wrestling with how public to be about it. I have a sense that writing is good for me. But it also keeps like milk. I wrote most of this a couple weeks ago and my head space has already evolved.
So writing like this is mostly a work of self-absorption (I’m sure you can forgive me) but hopefully it also helps to raise awareness amongst the cohort of people who might know me or read this.
Colorectal cancer rates are going up, and the expected age of occurance is going down. Please get screened. No matter your age, ask your clinician for a “FIT test”. If you’re over 45, just ask for a colonoscopy, the FIT test isn’t perfect.
I have a pretty good prognosis, mostly because my case was caught by screening, not by experiencing symptoms bad enough to warrant a trip to the doctor. Most of the people who get diagnosed after showing symptoms have it worse than I, and will have a longer, harder road to recovery. Get screened.
Our language of cancer borrows a bit from the language of contagion. I “got” cancer. It’s not quite a neutral description, there’s a hint of agency in there, maybe I did something wrong? This article drives me crazy, the author “went vegan and became a distance runner” after his father died of colorectal cancer.
Sorry friend, cancer is not something you “get”, and it’s not something you can opt out of with clean living. It’s something that happens to you. Take it from this running, cycling, ocean rowing, rock climbing, healthy eater – driving down the marginal probability of cancer (and heart disease (and depression (and more))) with exercise and diet is its own reward, but you are not in control. When cancer wants you, it will come for you.

This is why you should get screened (right?). It’s the one way to proactively protect yourself. The amazing thing about a colonoscopy is, not only can it detect cancer, but it also prevent it, by removing pre-cancerous polyps. It’s possible that screening could have prevented my case, if I had been screened a few years earlier.
I am now a denizen of numerous Facebook fora for fellow travellers along this life path, and one of the posts last week asked “what do you think cancer taught you”? I am a little too early on the path to write an answer myself, but one woman’s answer struck me.
She said it taught her that control is an illusion.
Before, I had plans. I could tell you I was going to go places, and do things, and when I was going to do them, next month, next season, next year. I was in control. Now, I can tell you what I will be doing next week. Perhaps. The rest is in other hands than mine.
Talk to you again soon, inshalla.

-
sur Mappery: The World in a Coffee Shop
Publié: 10 April 2024, 11:00am CEST

Irdi spotted this in the STOA coffee shop in Tirana. I’m not sure what the map is showing, but it’s fun
MapsintheWild The World in a Coffee Shop
-
sur Mappery: The Luggage That You Just Have to Have
Publié: 9 April 2024, 11:00am CEST

Raf spotted this beautiful luggage in a store in Takeshita Street in Tokyo
MapsintheWild The Luggage That You Just Have to Have
-
sur OPENGIS.ch: Status of Cloud Optimized Geospatial Formats
Publié: 9 April 2024, 7:04am CEST

Cloud-optimized formats are changing how we handle geospatial data, making it easier to access and work with large datasets directly in the cloud. These formats reduce the need to download entire datasets, facilitating quicker and more focused data analysis and visualization. For those interested in the specifics of these advancements, our recent Cloud Optimized Geospatial Formats – Status Report, offers an introduction into the topic, recommendations for usage and an overview of promising formats.
Within this project, we also released a sample of various tiles downloaded from swissSURFACE3D as a single cloud optimized point cloud file and made it accessible also via a potree powered web viewer that demonstrates how one single file can be used for visualization in the web and making accessible for applications like QGIS and QField via the direct access URL .

I would like to thank GeoStandards.ch and SGS to allow us working on this.
We’re keen to hear from you as well. Please share your experiences or additional insights and formats in the comments.
-
sur Mappery: The World of Top Gear
Publié: 8 April 2024, 11:00am CEST
-
sur longwayaround.org.uk: Sorting lines in (Neo)Vim
Publié: 8 April 2024, 9:45am CEST
The built-in Vim
:sortcommand supports sorting either all lines in a buffer or a range of lines.For example to sort a range of lines it's possible to visually select those lines then run
:sort.Help docs can be accessed via
:help :sortand can be viewed online via … -
sur Mappery: Giant Relief Map, Why Not?
Publié: 7 April 2024, 11:00am CEST
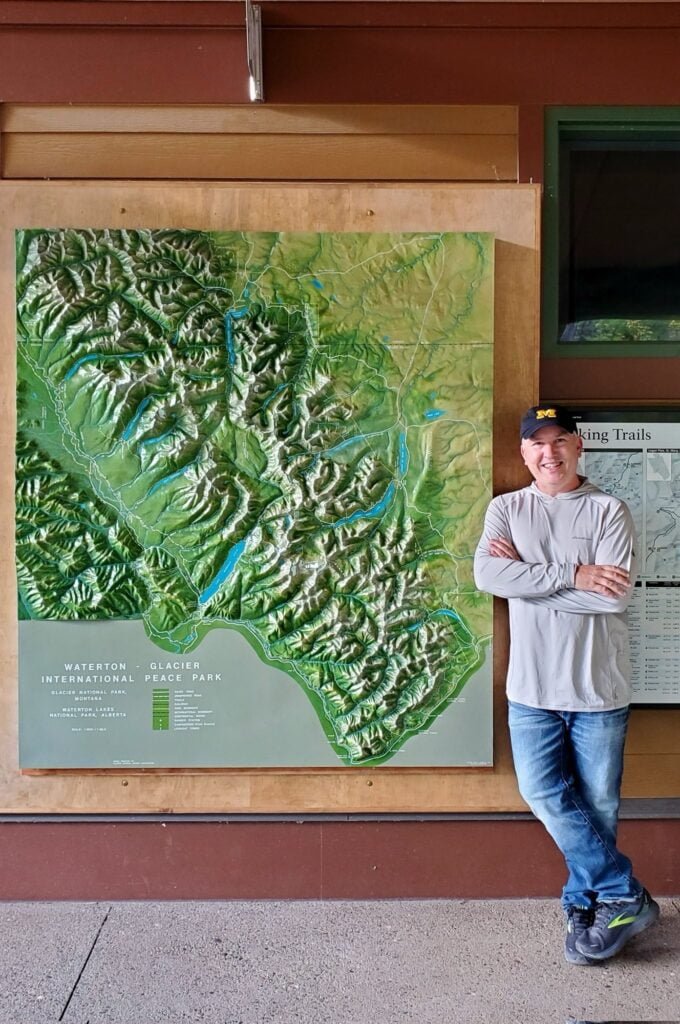
Matt Malone spotted this relief map at Waterton Glacier in Montana. He said “”Do you want your pic taken by the giant map?” isn’t really even a legit question for a geographer.”
MapsintheWild Giant Relief Map, Why Not?
-
sur Mappery: L’aéropostale
Publié: 6 April 2024, 12:00pm CEST

As I get one year wiser, I want to share something from my past. I used to live in Toulouse, in the southwest part of France. Property development is huge there, but sometimes, in the middle of the new neighbourhood, we keep remains of the past. The map in Montaudran shows the former starting point of the postal service l’aéropostale. The short part of the runway is preserved during this ongoing Uban renewal.
The area will host the Aeroposace campus, which will be the future base of the Galileo satellite navigation system.
Below is a picture of the runway from Wikipedia:
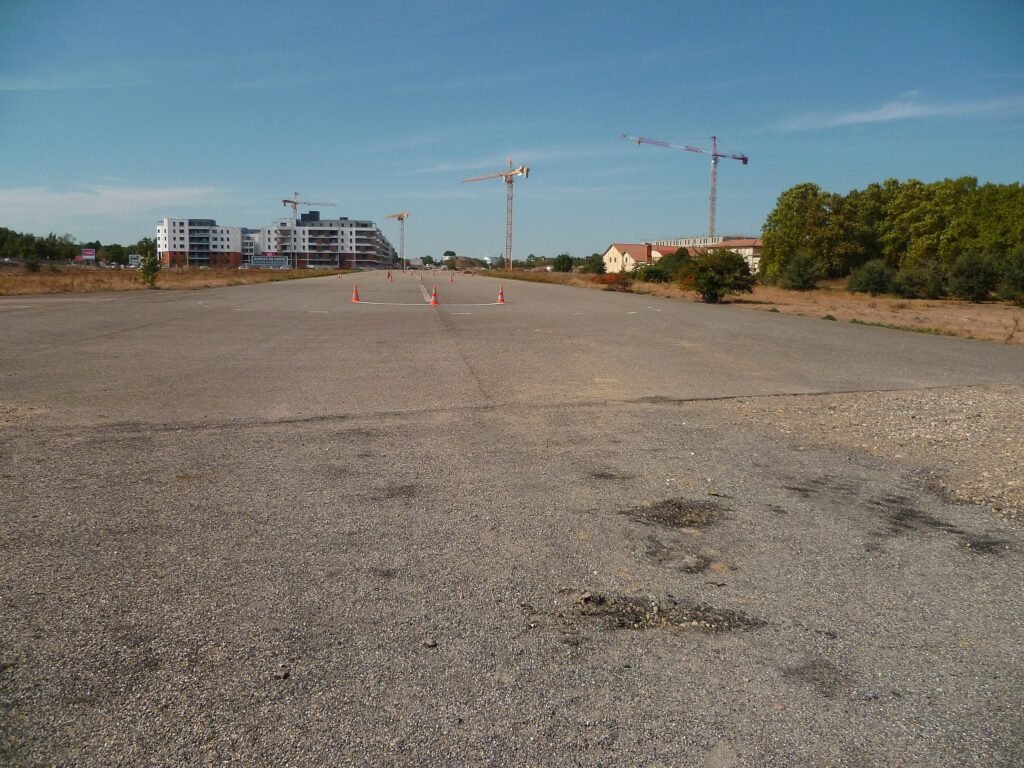
And the next one taken in 2023

MapsintheWild L’aéropostale
-
sur Mappery: Immersive Background
Publié: 5 April 2024, 11:00am CEST

Raf shared this “Nice use of maps as background at Sorolla immersive exhibition at Casa Amatller in Barcelona”
MapsintheWild Immersive Background
-
sur Mappery: Bliss Lane
Publié: 4 April 2024, 12:00pm CEST

Elizabeth sent me these pics of the signs for Bliss Lane in Old Tapovan, you may need to zoom in on the image below to see all of the detail. There is a helpful arrow pointing you towards the Ganges

Makes me want to go back to India
MapsintheWild Bliss Lane
-
sur OPENGIS.ch: QField 3.2 “Congo”: Making your life easier
Publié: 4 April 2024, 9:58am CEST
Focused on stability and usability improvements, most users will find something to celebrate in QField 3.2
Main highlights
This new release introduces project-defined tracking sessions, which are automatically activated when the project is loaded. Defined while setting up and tweaking a project on QGIS, these sessions permit the automated tracking of device positions without taking any action in QField beyond opening the project itself. This liberates field users from remembering to launch a session on app launch and lowers the knowledge required to collect such data. For more details, please read the relevant QField documentation section.

As good as the above-described functionality sounds, it really shines through in cloud projects when paired with two other new featurs.
First, cloud projects can now automatically push accumulated changes at regular intervals. The functionality can be manually toggled for any cloud project by going to the synchronization panel in QField and activating the relevant toggle (see middle screenshot above). It can also be turned on project load by enabling automatic push when setting up the project in QGIS via the project properties dialog. When activated through this project setting, the functionality will always be activated, and the need for field users to take any action will be removed.
Pushing changes regularly is great, but it could easily have gotten in the way of blocking popups. This is why QField 3.2 can now push changes and synchronize cloud projects in the background. We still kept a ‘successfully pushed changes’ toast message to let you know the magic has happened

With all of the above, cloud projects on QField can now deliver near real-time tracking of devices in the field, all configured on one desktop machine and deployed through QFieldCloud. Thanks to Groupements forestiers Québec for sponsoring these enhancements.
Other noteworthy feature additions in this release include:
- A brand new undo/redo mechanism allows users to rollback feature addition, editing, and/or deletion at will. The redesigned QField main menu is accessible by long pressing on the top-left dashboard button.
- Support for projects’ titles and copyright map decorations as overlays on top of the map canvas in QField allows projects to better convey attributions and additional context through informative titles.

The QFieldCloud user experience continues to be improved. In this release, we have reworked the visual feedback provided when downloading and synchronizing projects through the addition of a progress bar as well as additional details, such as the overall size of the files being fetched. In addition, a visual indicator has been added to the dashboard and the cloud projects list to alert users to the presence of a newer project file on the cloud for projects locally available on the device.
With that said, if you haven’t signed onto QFieldCloud yet, try it! Psst, the community account is free

The creation of relationship children during feature digitizing is now smoother as we lifted the requirement to save a parent feature before creating children. Users can now proceed in the order that feels most natural to them.
Finally, Android users will be happy to hear that a significant rework of native camera, gallery, and file picker activities has led to increased stability and much better integration with Android itself. Activities such as the gallery are now properly overlayed on top of the QField map canvas instead of showing a black screen.
-
sur GeoServer Team: How to style layers using GeoServer and QGIS
Publié: 4 April 2024, 2:00am CEST
GeoSpatial Techno is a startup focused on geospatial information that is providing e-learning courses to enhance the knowledge of geospatial information users, students, and other startups. The main approach of this startup is providing quality, valid specialized training in the field of geospatial information.
( YouTube | LinkedIn | Facebook | X )
Using GeoServer and QGIS to style a layerIn this session, we will explore “How to style layers using GeoServer and QGIS” to produce beautiful maps. If you want to access the complete tutorial, simply click on the link
Introduction
Geospatial data has no intrinsic visual component and it must be styled to be visually represented on a map. By default, GeoServer uses a markup language called Styled Layer Descriptor (SLD) to define styling rules for displaying data. SLD is an XML-based language that allows users and software to control the visual portrayal of geospatial data. This language ensures that clients and servers can both understand how to render the data visually.
Note. This video was recorded on GeoServer 2.20.0, which is not the most up-to-date version. Currently, versions 2.24.x and 2.25.x are supported. To ensure you have the latest release, please visit geoserver.org and avoid using older versions of GeoServer.
Add a StyleTo add a new style, navigate to the Data > Styles page, then click on the Add a new style link. You will be redirected to the new style page, which is the same as the Style Editor Data tab.
This tab includes basic style information, the ability to generate a style and legend details. It has some mandatory basic style information, such as:
- Name: It’s the name of the style and it must be a unique name.
- Workspace: Styles can be inside workspaces which causes restrictions. In other words, the styles in a workspace can only be assigned to the services of that, and other services outside it, cannot use these styles. Styles also can be “global” or no workspace, so they don’t have any restrictions and services can be used for all suitable styles.
- Format: Default options are SLD and ZIP formats. To use other formats such as CSS and YSLD, you should download and install extensions. Make sure to match the version of the extension to the version of the GeoServer.
The “Style Content” area provides options for creating, copying, or uploading a style. It has three options:
- Generate a default style: Choose a generic style based on geometry such as Point, Line, Polygon, Raster, or Generic and click the Generate link when selected.
- Copy from existing style: Select an existing style from GeoServer and copy its contents to the current style. Note that not all styles may be compatible with all layers. Click the Copy link when selected.
- Upload a style file: Press the Browse button to locate and select a plain text file from your local system to add as the style. Click on the Upload link to add the style file.
The Legend area allows you to preview the legend for the style. Click on the Preview legend link to generate a legend based on the current settings.
At the bottom of the Style Editor page, you’ll find several options: Validate, Apply, Save and Cancel. During editing and especially after editing is complete, you can check the validation of the syntax by pressing the Validate button at the bottom. If any validation errors are found, a red message is displayed, and if no errors are found, a green message is displayed. To make changes, press the Apply button to access all the tabs and finally press the Save button.
After having created the style, it’s time to apply it to the layer. To do it, follow these steps:
- Navigate to the Data > Layers page then click on the layer’s name link to open the layer’s properties form. Switch to the Publishing tab.
- Go to the Style section and from the Default Style list, select the suitable style, then press the Save button.
- Navigate to the **Data > Layer Preview ** page and open up OpenLayers preview for the layer.
On the Styles page, click on the style name to open the Style Editor. The Style Editor page presents the style definition and contains four tabs with many configuration options: Data , Publishing , Layer Preview and Layer Attributes.
- Data tab: The Data tab includes basic style information, the ability to generate a style, and legend details. Moreover, it allows for direct editing of style definitions at the bottom, with support for line numbering, automatic indentation, and real-time syntax highlighting. You can switch between tabs to create and edit styles easily and can adjust the font size of the editor.
- Publishing tab: This tab shows all layers available on the server, along with their default style and any additional styles they may have. You can easily see which layers are linked to the current style by checking a box in the table.
- Layer Preview tab: This tab enables you to preview and edit the current style of any layer without switching pages. You can easily select the desired layer to preview and fine-tune styles to continuously test visualization changes.
- Layer Attributes tab: The Layer Attributes tab shows a list of attributes for the selected layer, making it easy to see and work with the attributes associated with the layer. This can help in deciding which attribute to use for labeling or setting up scale-dependent rules.
QGIS has a style editor for map rendering with various possibilities, including the export of raster styles to SLD for use in GeoServer. For versions before 3.4.5, a plugin called SLD4raster is required for exporting SLD for use in GeoServer.
Here’s a simple guide to styling a vector layer in GeoServer:
- Open QGIS (minimum version 3.0) and loading the vector dataset into your project.
- Double click on the layer to open the Properties dialog and navigate to the Symbology page.
- Select a Graduated rendering, choose the desired column, and press the Classify button.
- Return to the Properties dialog and go to the bottom of the Styles page. Select Style > Save Style.
- Save the style in SLD format and choose the location for the file.
- Use the Choose File button to locate your exported file in the folder and select it.
- Click on the Upload link to load the file into the editor form.
- Press the Validate button to ensure there are no errors, then press the Save button.
- Switch to the Publishing tab and choose either Default or Associated checkbox to apply the new style to the desired layer.
Here is a step by step guide to style a raster layer for GeoServer:
- Begin by opening QGIS with a minimum version of 3.4.5.
- Load the raster layer into your project.
- Double click on the layer to access the Properties and go to the Symbology tab.
- Select Singleband pseudocolor as the Render type, choose Linear method for Interpolation, and select a desired Color ramp.
- Press the Classify button to create a new color classification, then press the Apply button to save this classification. At the bottom-left of the page, choose Style and press Save Style button.
- Choose a name and export it in SLD format to your preferred location.
- In GeoServer, navigate to the Style section and click on Add a new style to open the editor form.
- Use the Choose File button to locate your exported file in the folder and select it.
- Click on the Upload link to load the file into the editor form.
- Validate the style by pressing the Validate button to ensure there are no errors, then press the Save button.
- Navigate to Data > Layers page and open the layer’s properties form by clicking on the layer’s name. Switch to the Publishing tab.
- Set the style as Default Style and press the Save button.
- Finally, in the Layer Preview section, open the OpenLayers preview for the raster layer.
To remove a style, click on the checkbox next to the style. Multiple styles can be selected at the same time. Press the Remove selected style(s) button at the top of the page. You will be asked for confirmation and press the OK button to remove the selected style(s).
In this session, we explored “How to style layers using GeoServer and QGIS” to produce beautiful maps. If you want to access the complete tutorial, simply click on the link
-
sur Mappery: These Tourists Won’t Get Lost
Publié: 3 April 2024, 12:00pm CEST

Reinder shared this. Spotted outside the International Peace Palace in the Hague
MapsintheWild These Tourists Won’t Get Lost
-
sur Mappery: Cambridge, Massachusetts
Publié: 2 April 2024, 12:00pm CEST
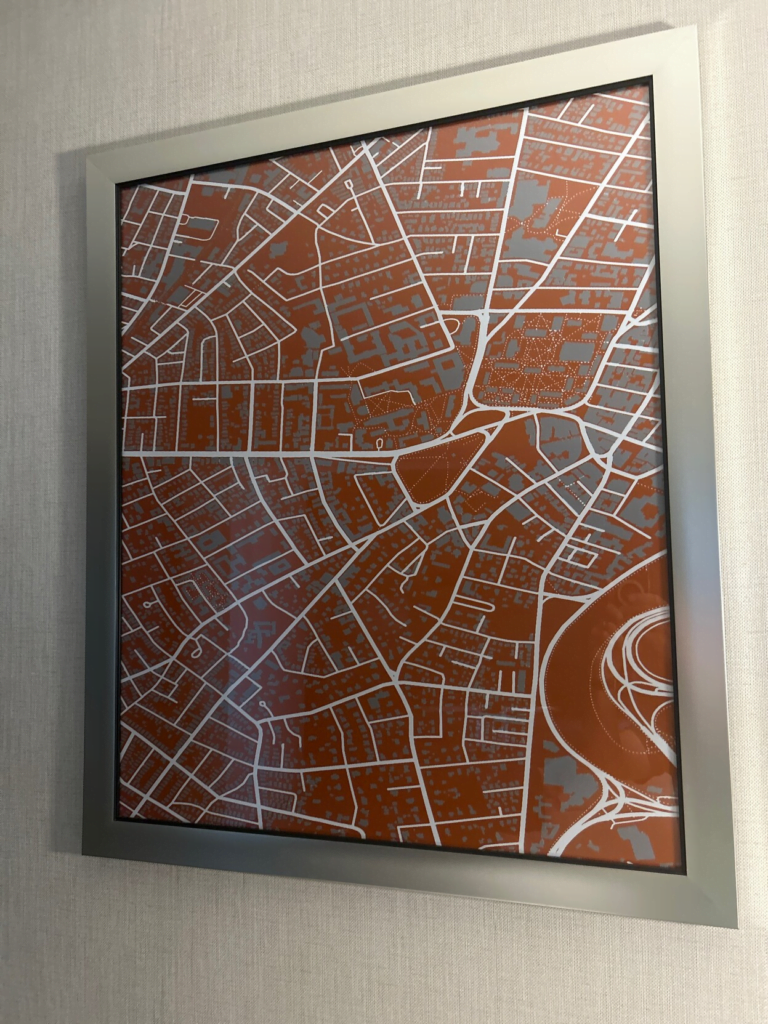
Marc Prioleau spotted this in the Marriott in Cambridge Massachusetts. It’s a different spin on the local info maps that you get in some hotels.
MapsintheWild Cambridge, Massachusetts
-
sur Mappery: Never Eat Shredded Wheat
Publié: 1 April 2024, 12:00pm CEST

Derick Rethans shared this from his travels in Oxfordshire. I love the cardinal points at the top.
MapsintheWild Never Eat Shredded Wheat
-
sur Mappery: IMPORTANT: Mappery Editorial Policy Changes
Publié: 1 April 2024, 11:00am CEST
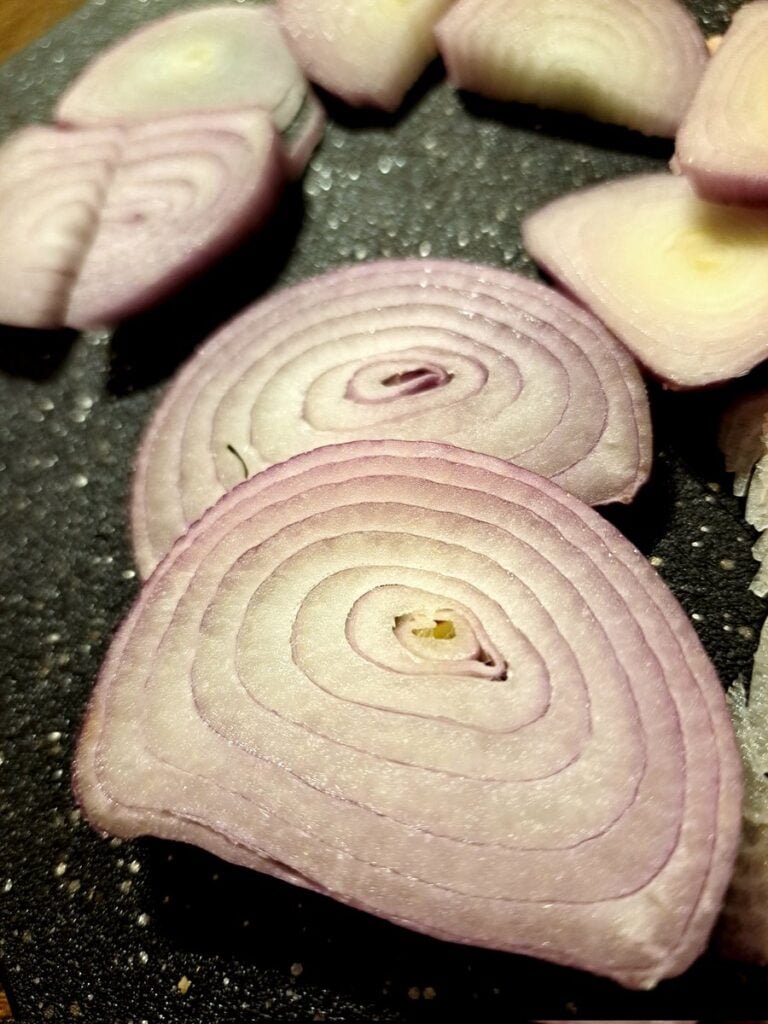
Dear followers. The Mappery team have been reflecting on some of the content we have posted recently. We’re concerned that cartography is being commercially exploited in some sectors (particularly the drinks industry) with the creation of entirely fictitious maps to promote a brand. We think this is wrong and is disrespectful of the art and science of cartography.
In posting some of this content, we recognise that our promotion has contributed to this problem, and for this error in judgement we are genuinely sorry and ask for your forgiveness. In future we will only post maps that have gone wild in good faith, rather than being fictitious creations produced solely for commercial gain. Once again, sorry for our part in this. In the meantime here are some shallots that look like a contour map. (Original credit Amanda Huber)
MapsintheWild IMPORTANT: Mappery Editorial Policy Changes
-
sur Mappery: Mapped It!
Publié: 31 March 2024, 12:00pm CEST

Matt Malone said “Gonna make a wild guess that one of my fellow surveying or GIS colleagues here in Michigan has this awesome plate that I spied recently.”
On the edge of being a Map in the Wild, no doubt some will want to draw the line somewhere else.
MapsintheWild Mapped It!
-
sur Mappery: Tad’s Montana Tablecloth
Publié: 30 March 2024, 11:00am CET
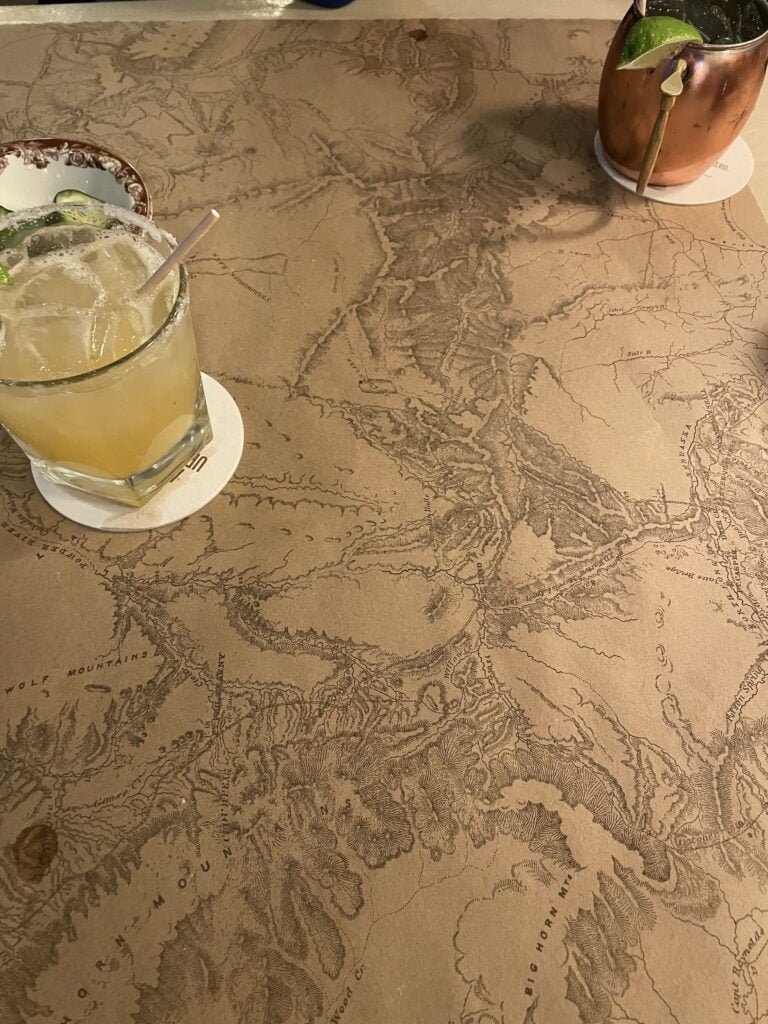
Eric Lund sent this to me, it’s a paper ‘tablecloth’ with a map of the Yellowstone area at Tad’s Montana Grill in Bozeman, Montana. Note the fruity cocktails while studying the elegant cartography.
MapsintheWild Tad’s Montana Tablecloth
-
sur Mappery: Definitely a Well Used Map in the Wild
Publié: 29 March 2024, 11:00am CET
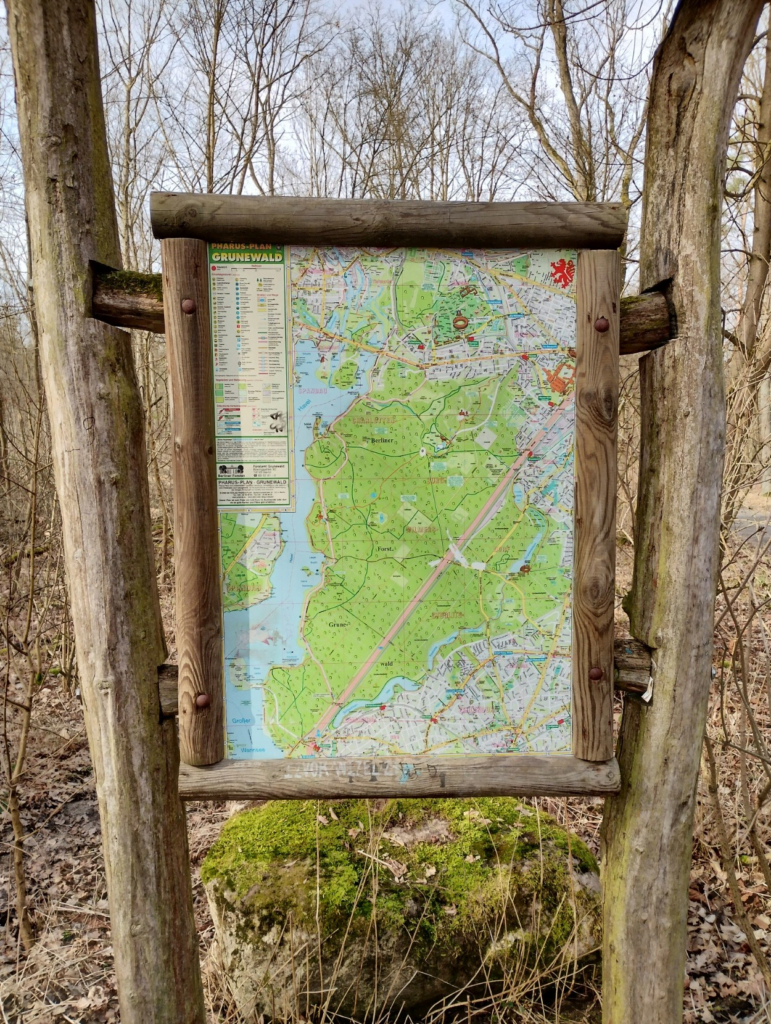
Another one from Javier Jimenez Shaw. “Map in Grunewald, Berlin, Germany. The point where the map is in the map (like “you are here” or “aktueller Standort”) is worn from touching it so much, that you can see the material behind the painting.
MapsintheWild Definitely a Well Used Map in the Wild
-
sur Oslandia: (Fr) En direct des Journées Utilisateurs QGIS-fr !
Publié: 29 March 2024, 10:19am CET
Sorry, this entry is only available in French.
-
sur Mappery: Scotland’s Geology
Publié: 28 March 2024, 11:00am CET

I am not sure who pointed me to this magnificent geological map of Scotland which was shared by Europe Says who said “Geologically correct map of Scotland. 30 years of collecting!”
MapsintheWild Scotland’s Geology
-
sur Mappery: 3D Globe Jigsaw
Publié: 27 March 2024, 11:00am CET
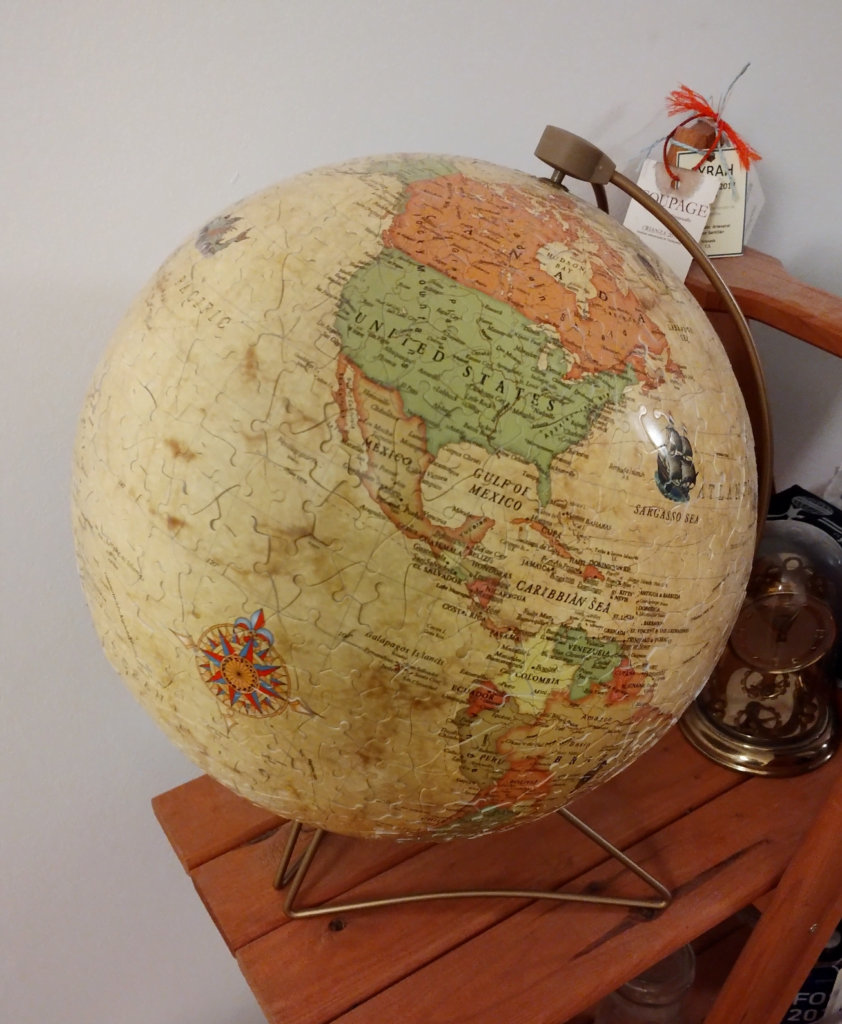
Javier Jimenez Shaw shared this beauty “3D globe jigsaw puzzle in my living room. 30 cm diameter. Unfortunately it is not produced anymore.” Amazing object, I have never seen anything like this before, have you?
It turns out that Ravensburger make a newer version of a 3D globe which you can buy here or from other online places that we can do without boosting
MapsintheWild 3D Globe Jigsaw
-
sur GeoSolutions: GeoSolutions at FedGeoDay in Washington, DC
Publié: 26 March 2024, 8:10pm CET
You must be logged into the site to view this content.
-
sur Mappery: Stone Town, Zanzibar
Publié: 26 March 2024, 11:00am CET

Stephen Mather, a good friend of Mapppery, shared this “Here’s one from Stone Town, Zanzibar, November of 2016. I think it’s up top of Emerson Spice.”
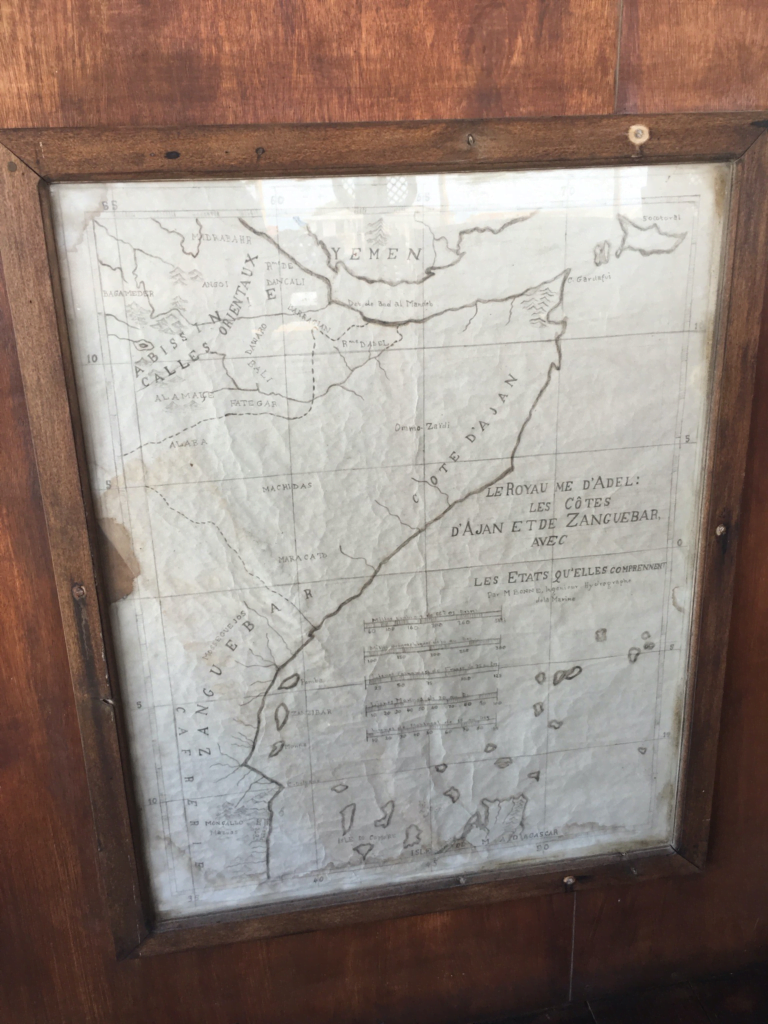
You might say “not very wild” but I love the idea of a hotel called Emerson Spice, sounds pretty wild to me.
MapsintheWild Stone Town, Zanzibar
-
sur Mappery: Birds Eye View
Publié: 25 March 2024, 11:00am CET
-
sur OTB Team: OTB works with QGis 3.36
Publié: 25 March 2024, 10:20am CET
The OTB Provider QGis plugin is now available on QGis plugin catalog. Since QGis version 3.36, the plugin previously packaged is no longer in QGis package. To use OTB with QGis 3.36 you need to install plugin from QGis plugin catalog (“Extensions menu –> Install/Manage Extensions” and type OTB in not-installed tab). Then follow plugin […] -
sur Mappery: The Meanderings of the River Ahr
Publié: 24 March 2024, 11:00am CET
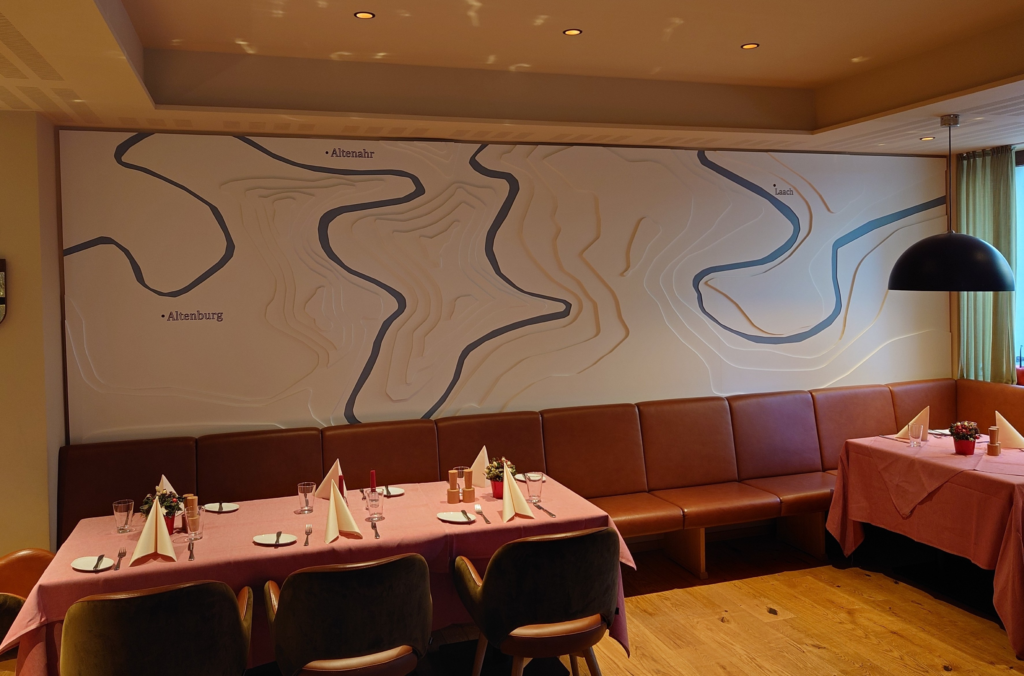
Anton van Tetering shared this “Map of the meanders of the river Ahr on the wall of restaurant Ruland in Altenahr, Germany. Just like many other buildings in the Ahr-valley, this restaurant was severely damaged in the flood catastrophe of July 2021 which killed at least 135 people in this valley alone.”
MapsintheWild The Meanderings of the River Ahr
-
sur SourcePole: FOSSGIS 2024
Publié: 24 March 2024, 1:00am CET
Sourcepole hat an der FOSSGIS 2024 in Hamburg verschiedene Themen mit Vorträgen abgedeckt:
- QGIS Web Client 2 (QWC2) - Neues aus dem Projekt
- QGIS Server Plugins
- BBOX: Kompakter OGC API Server für Features, Tiles und mehr
-
sur Mappery: Pinocchio Theme Park
Publié: 23 March 2024, 11:00am CET
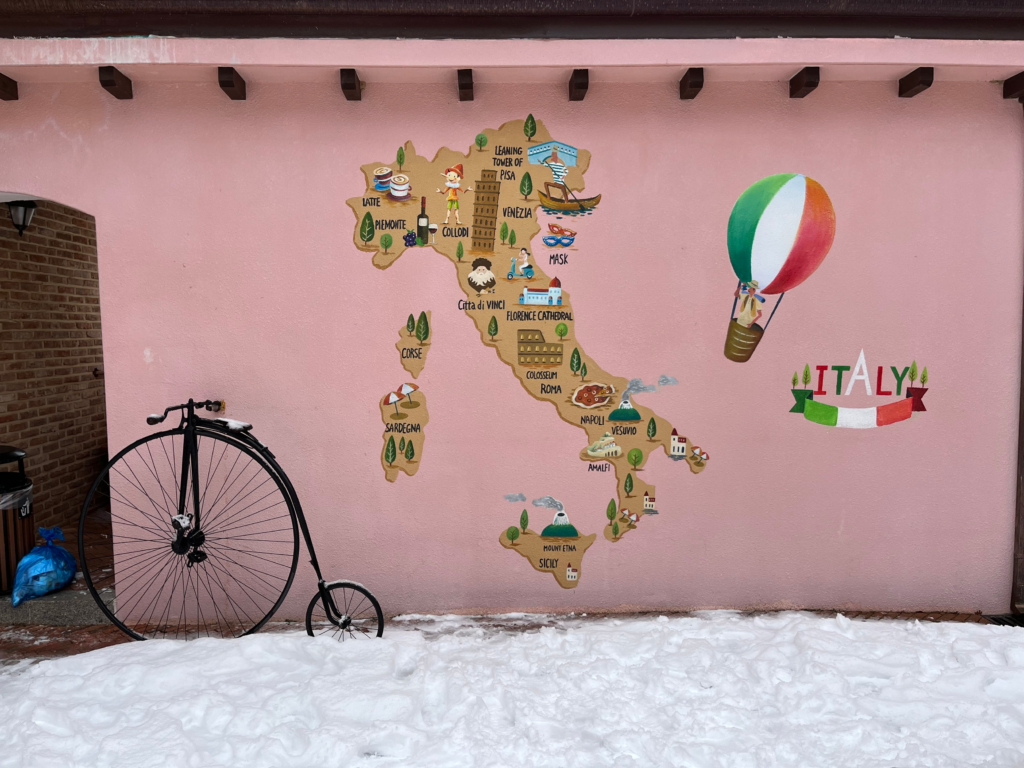
Ian Wagner shared this pic of a map of Italy in a Pinocchio themed park in South Korea. Who knew Pinocchio was a thing there?
MapsintheWild Pinocchio Theme Park
-
sur Ecodiv.earth: An addon to download the AHN data in GRASS GIS
Publié: 23 March 2024, 12:00am CET
The r.in.ahn addonIn the previous post, I introduced the ‘Actueel Hoogtebestand Nederland’. To start with a small correction, the version 4 I mentioned isn’t the latest version. Version 5 is being rolled out and is already available for the northern part of the country. But for now, let’s focus on version 4.
In the previous post, I presented some steps to download the AHN for a specific area and import it in GRASS GIS. Downloading was easy using the r.in.wcs addon. However, a few extra steps were required to ensure the imported data would align with the extent and resolution of the original AHN data.
Easy, but why not make it easier yet? So, as it was a rainy day anyway, I used the code presented earlier and wrapped it up in the addon r.in.ahn. Let’s see how to download the DTM for the Land van Cuijk again, but this time using the new addon.
©
Download the DTM for a selected areaNote that this addon only works in locations with the coordinate reference system RD New (EPSG 28992). This is that the CRS of the original data, and the addon is meant to ensure you download the data as it is. This is akin to how the
r.in.gdalimport function works. If you want to import and reproject the data on the fly (similar to ther.importfunction), you can use ther.in.wcsaddon.This example shows the steps to download the 0.5-meter resolution DTM for the Land van Cuijk. You’ll need to install the r.in.wcs and r.in.ahn addons 1 2.
Install the required addons.
First step is to import the Python libraries. Note, this will not be repeated with the next scripts.
import grass.script as gsNow, you can install the two addons using the g.extension function.
gs.run_command("g.extension", extension="r.in.wcs")
gs.run_command("g.extension", extension="r.in.ahn")
Install the two addons using the g.extension function.
g.extension extension=r.in.wcs
g.extension extension=r.in.ahn
You need the
g.extensionfunction to install addons. In the main menu, go toSettings > Addons extension > Install extension from addon. Alternatively, type ing.extensionon the command line. The example below is forr.in.wcs. Repeat this step forr.in.ahn. Figure 1: The g.extension function, started from the command line.
Figure 1: The g.extension function, started from the command line.
Figure 1: The g.extension function, started from the command line.
Now, download the administrative boundaries of the Dutch municipalities, and extract the boundaries of the “Land van Cuijk”.
Download layer with administrative boundaries of the neighborhood.
gs.run_command(
    "v.in.wfs",
    url="https://service.pdok.nl/cbs/wijkenbuurten/2022/wfs/v1_0?",
    output="municipalities",
    name="gemeenten",
)
Next, extract the boundaries of the municipality of “Land van Cuijk”
gs.run_command(
    "v.extract",
    input="municipalities",
    where="naam = 'Land van Cuijk'",
    output="LandvanCuijk",
)
Get the vector layer with the boundaries of the municipality.
v.in.wfs url="https://service.pdok.nl/cbs/wijkenbuurten/2022/wfs/v1_0?" \
    output=municipalities name=gemeenten
Next, extract the boundaries of the municipality of “Land van Cuijk”
v.extract input=municipalities where="naam = 'Land van Cuijk'" \
    output="LandvanCuijk"
Type in
v.in.wfson the command line or in the console. You can also find the function undermain menu > File > Import vector data. This opens the following screen (you need to fill in parameters in two tabs): Figure 2: Download the vector layer with the municipality boundaries. Define the base URL and the name of the output layer.
Figure 2: Download the vector layer with the municipality boundaries. Define the base URL and the name of the output layer.
Figure 2: Download the vector layer with the municipality boundaries. Define the base URL and the name of the output layer.
 Figure 3: Download the vector layer with the municipality boundaries. Fill in the name of the WFS layer to download.
Figure 3: Download the vector layer with the municipality boundaries. Fill in the name of the WFS layer to download.
Figure 3: Download the vector layer with the municipality boundaries. Fill in the name of the WFS layer to download.
 Figure 4: Extract the boundaries of the municipality of Land van Cuijk. Select the name of the vector layer with municipalities and give the name of the output layer.
Figure 4: Extract the boundaries of the municipality of Land van Cuijk. Select the name of the vector layer with municipalities and give the name of the output layer.
Figure 4: Extract the boundaries of the municipality of Land van Cuijk. Select the name of the vector layer with municipalities and give the name of the output layer.
 Figure 5: Extract the boundaries of the municipality of Land van Cuijk. Fill in the query, which defines which features you want to select and save. Tip: Use the convenient query builder.
Figure 5: Extract the boundaries of the municipality of Land van Cuijk. Fill in the query, which defines which features you want to select and save. Tip: Use the convenient query builder.
Figure 5: Extract the boundaries of the municipality of Land van Cuijk. Fill in the query, which defines which features you want to select and save. Tip: Use the convenient query builder.
Now, set the region to match the extent of the municipality. Note, you do not need to be concerned with the resolution;
r.in.ahnwill adjust the resolution and extent to make sure the imported data aligns perfectly with the original AHN data. This is done by setting the resolution to 0.5 meters and subsequently extending the region’s extent until it aligns with the original AHN data layer.Set the region to match the vector layer LandvanCuijk.
gs.run_command("g.region", vector="LandvanCuijk")Get the vector layer with the boundaries of the municipality.
g.region vector=LandvanCuijkType in
g.regionon the command line or console, or open the function’s window viamenu | Settings | Computational region | Set region. Figure 6: Set the region to match the extent of the vector layer LandvanCuijk.
Figure 6: Set the region to match the extent of the vector layer LandvanCuijk.
Figure 6: Set the region to match the extent of the vector layer LandvanCuijk.
Now, you can run the
r.in.ahnfunction to import the layer. Note that by default, the addon will change the region you just defined. It will set the resolution to 0.5 meters (this is the resolution of the AHN data you are about to download). It will furthermore expand the extent so that it aligns perfectly with the AHN data.Import the DTM using the
r.in.ahnfunction.gs.run_command("r.in.ahn", product="dtm", output="dtm_05")Get the vector layer with the boundaries of the municipality.
r.in.ahn product=dtm output=dtm_05Type in
r.in.ahnon the command line or console. A third way is shown in the image below. Open theTools taband go toAddons. The function should be available there. Figure 7: Open the r.in.ahn plugin, select the product to download (dtm or dsm) and provide the output layer name.
Download whole tiles
Figure 7: Open the r.in.ahn plugin, select the product to download (dtm or dsm) and provide the output layer name.
Figure 7: Open the r.in.ahn plugin, select the product to download (dtm or dsm) and provide the output layer name.
Download whole tiles
If you set the
-t flag, the function will import the DTM or DSM for all 6.5×5 km AHN tiles that overlap with the current region. In addition, a vector polygon layer will be created with the tile boundaries.Define the region for which you want to download the data, and import the DSM using the
r.in.ahnfunction. Set the -t flag to download the DTM for the area covered by the tiles that overlap with the region.# Set the region gs.run_command("g.region", n=412572, s=411280, w=188911, e=190085) # Import the tile(s) that include the selected region gs.run_command("r.in.ahn", product="dtm", flags="t", output="dtm_05_subset")# Set the region g.region n=412572 s=411280 w=188911 e=190085) # Import the tile(s) that include the selected region r.in.ahn -t product=dtm output=dtm_05_subset)Open the
g.regionaddon by typing g.region on the command line, in the console, or using the menu. Fill in the northern, southern, western, and eastern limits of the area for which you want to download the data. Figure 8: Set the region bounds.
Figure 8: Set the region bounds.
Figure 8: Set the region bounds.
Type in
r.in.ahnon the command line or console. Or go to theTools taband go toAddons. The function should be available there. Fill in the required fields, like in the previous examples. Next, go to theOptionaltab and selectDownload whole tiles. Figure 9: Open the r.in.ahn plugin, select the product to download (DTM or DSM) and provide the output layer name.
Figure 9: Open the r.in.ahn plugin, select the product to download (DTM or DSM) and provide the output layer name.
Figure 9: Open the r.in.ahn plugin, select the product to download (DTM or DSM) and provide the output layer name.
The extent of the imported layer covers the 6.5×5 km AHN tile. In addition to the raster layer, you’ll have a vector layer with the boundary of the downloaded tile(s). This vector layer has the same name but with the suffix *_tiles*.
You should be aware that running the function will adjust the computational region so that it aligns with the imported data. You can avoid this by setting the -g flag, as illustrated in Figure 10.
 Figure 10: A: The downloaded 6.5 x 5 km AHN tiles that intersect with the user-defined region, here indicated by the orange outline. In addition, a vector layer with the boundaries of the tiles is created. The red outline shows the adjusted region extent after running the function. The blue outlines show the boundaries of the downloaded tiles. B: The same, but with the -g flag set. With this flag set, the user-defined region (red outline) will not be altered .
Footnotes
Figure 10: A: The downloaded 6.5 x 5 km AHN tiles that intersect with the user-defined region, here indicated by the orange outline. In addition, a vector layer with the boundaries of the tiles is created. The red outline shows the adjusted region extent after running the function. The blue outlines show the boundaries of the downloaded tiles. B: The same, but with the -g flag set. With this flag set, the user-defined region (red outline) will not be altered .
Figure 10: A: The downloaded 6.5 x 5 km AHN tiles that intersect with the user-defined region, here indicated by the orange outline. In addition, a vector layer with the boundaries of the tiles is created. The red outline shows the adjusted region extent after running the function. The blue outlines show the boundaries of the downloaded tiles. B: The same, but with the -g flag set. With this flag set, the user-defined region (red outline) will not be altered .
Footnotes
You are expected to be familiar with GRASS GIS and the concept of region used in GRASS GIS. If you are new to GRASS GIS, you are warmly recommended to first check out the GRASS GIS Quickstart and the explanation about the GRASS GIS database.??
Downloading the DTM for the whole municipality will take a while. If you want to speed things up, you can work with a smaller area by using your own vector data.??
-
sur Mappery: A map lover’s birthday present
Publié: 22 March 2024, 11:00am CET
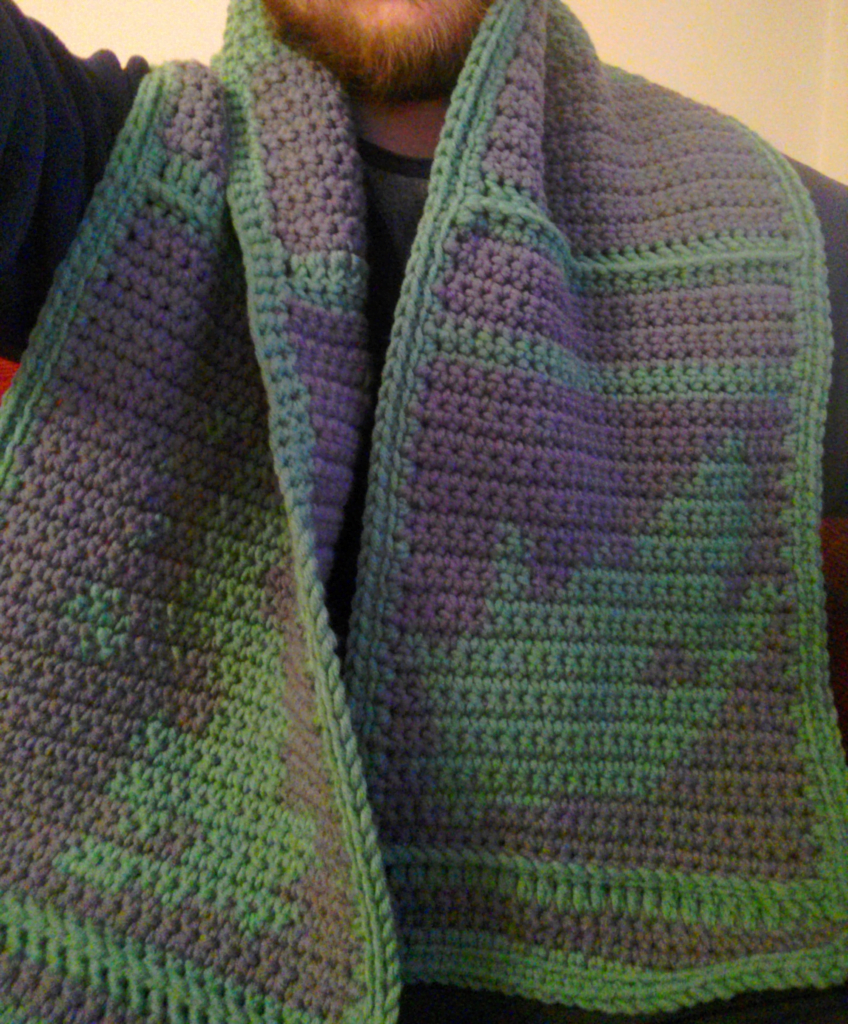
Gregory Marler said “I got a scarf for my birthday, it’s got 2 country maps on it! Would @mappery count this as a map in the wild? At the least it is being worn beside my wild/unkempt beard.”
The answer is definitely “Yes”
Who can work out the country that is not UK? (Greg can’t answer)
MapsintheWild A map lover’s birthday present
-
sur Jackie Ng: Avalonia UI Test Drive
Publié: 22 March 2024, 9:40am CET
As the title implies, this blog post is about my experience test driving Avalonia UI.
So why am I doing this?
I've been getting growing questions lately about whether MapGuide Maestro works on Linux via Mono.
Sadly I no longer emphasize anything regarding Mono compatibility because.
- WinForms support (in legacy .net Framework 4.x) on Mono is pretty much a hack.
- And since we've moved away from legacy .net Framework to .net 6.0, the combination of WinForms + .net 6.0 is probably an unsupported combination (you don't use Mono to run .net core/5.0+ applications, you use Microsoft's official SDK/runtime). I'm also not too keen to waste time and resources to test and find out.
And in terms of .net multi-platform UI frameworks, there's only one logical choice: Avalonia UI
While it is not in my immediate plans to rewrite MapGuide Maestro's UI in Avalonia, I wanted to at least explore the feasibility of building such a UI even if all the actual functionality is mocked up, just to see how easy or difficult the whole process is.
Hence the motivation for this post.

So why Avalonia?
Avalonia is effectively the "spiritual successor" to WPF, and adopts most of the same patterns and practices when building UIs for Avalonia.
I had first heard about Avalonia when it was formerly known as Perspex and at the time, from the screenshots of example Perspex applications on Windows and non-Windows platforms, it was clear at that point in time the range of possible applications one can build with Perspex was quite limited and building an application like Maestro on top of Perspex was not feasible.
Just recently, I had heard about the framework now known as Avalonia again and this time round there was a lot more positive buzz around it, so I gave it another look and was much more impressed at its capabilities and richer suite of UI controls to build applications with.
Our objectiveMy objective with this Avalonia learning exercise was to build a minimal multi-document interface skeleton application, mimicking the primary functionality (UI-wise) of MapGuide Maestro.
- Being able to present a login UI to connect to a MapGuide Server
- Present MapGuide Server resources in a tree view
- Open resources in a region of tabbed editor panels and being able to close them.
 If this kind of UI looks familiar, yes it's basically the UI for tools like:
- Visual Studio Code
- Azure Data Studio
- Azure Storage Explorer
- any many others like them!
The benefit of such a UI, is that it doesn't require an explicit VS-style window docking control like I have for the current WinForms-based MapGuide Maestro. I can already see the controls needed to build such a UI Any UI toolkit worth its salt should to able to provide these basic controls.
This is a proof-of-concept, so we won't be using the existing Maestro API to talk to actual MapGuide Servers. Instead such functionality will be mocked up for this application. The main purpose of this exercise is to see if Avalonia provides enough of the base UI elements to build a hypothetical version of MapGuide Maestro on top of.
It turns out this exercise was fraught with several challengesChallenge #1: Getting familiar with Avalonia conceptsThe first challenge was simply getting familiar with Avalonia concepts. Being someone who did .net desktop app development primarily in Windows Forms, I skipped over WPF, and its XAML-based variants/successors like Silverlight, Xamarin Forms, UWP, and MAUI, and Avalonia being a "spiritual successor" to WPF meant that I didn't have a potential conceptual head start on Avalonia that one might have if they already had experience with WPF and its XAML-based derivatives.
However, I was familiar with the MVVM pattern and data-binding, which is used heavily in Avalonia. I already had experience in knockout.js building/maintaining some of our web apps in my day job, and these concepts learned from knockout.js mostly translate cleanly 1:1 to Avalonia.
The other Avalonia concepts I'll have to figure out as we go along.
Challenge #2: WebAssembly (WASM) supportBefore I begin, I must take the MapGuide-knowledgable readers of this post back in time, way back to when MapGuide Open Source 1.0 was released.
Do you remember how this new (at the time), re-invented version of MapGuide was released, but the only authoring option at the time was to buy a license of Autodesk MapGuide Studio? Not a pretty look if you are offering a free and open source web map GIS server, but the authoring tools are not?
Some members of the MapGuide community were aware of this glaring discrepancy and created a web-based equivalent of MapGuide Studio called Web Studio built fully with HTML/JS/CSS. Unfortunately, Web Studio was really bare-bones in terms of authoring capabilities and the code being written in the pre-historic era of javascript (this was circa 2006-2007) which did not make it conductive to external contribution. React, TypeScript and friends weren't around then, so trying to enhance Web Studio with new features was extremely challenging. I once tried to add at least a generic XML text editor fallback for Web Studio so you had something to edit various resources where Web Studio did not provide a dedicated editor UI for, but alas this was just too challenging for me and I gave up on such an idea.
But eventually another user of the MapGuide community solved this problem more directly by developing and releasing a v1.0 of a windows .net desktop application that you all know as MapGuide Maestro. As an aside, I am not the original author of MapGuide Maestro in case you're wondering, I merely took over development and maintenance of Maestro from the 2.1 release onwards.
Anyways, back to the topic at hand, when I created the new Avalonia application with the provided project template, I was most surprised to see that the generated solution came with a project that compiled to WebAssembly (WASM) that was ready to run in your web browser!
This was a mind-blowing revelation for me from a conceptual standpoint. It means our hypothetical MapGuide Maestro built on Avalonia could not only exist as a regular desktop application, but the WASM build of this application could be dropped in the the wwwroot of a MapGuide Web tier installation and you would now have a modern version of Web Studio, but much more powerful and capable, because it is just MapGuide Maestro ... now in your web browser!
Since our starter project template includes a functioning WASM browser target. I now had a strong incentive to keep this target active and working, because the prospect of being able to run MapGuide Maestro in a web browser is a very tempting proposition. Therefore, the choice of libraries and APIs I use is constrained by my new requirement of being able to work in a browser/WASM environment.
For example, I originally wanted to use MVVMDialogs to simplify working with dialogs (Maestro has lots of dialogs, so I figure such a library could be useful), but I couldn't get this library to work in a WASM environment with some of my testing dialogs, so this was a no-go. Since this was just a proof-of-concept, there wasn't a need to have working dialog system, but it does mean if this were to go beyond a proof-of-concept and into an actual application where we will inevitably have to present a dialog of some sort, I'd have to come with a paradigm that can work in both desktop and browsers.
Another problem with this WASM target is that I can't seem to debug it in Visual Studio. You can launch the WASM target in the debugger and spawn a new browser window to launch your app, but any breakpoints you stick in your C# code are not being hit. I'm not sure if this a shortcoming or a broken feature, but it is somewhat concerning if we were to go full steam ahead with support WASM as a compilation/deployment target.Challenge #3: "Large scale" MVVMAlthough I already knew the MVVM pattern from knockout.js, my scope of usage was mostly limited to using knockout.js to building "islands" of interactive client-side content on primarily server-generated web pages. So I didn't really have an idea of how to apply such a pattern on a full blown Single Page Application (SPA), which is pretty much what we're trying to achieve (conceptually) in Avalonia. By the time I was building SPAs proper, I had moved on the popular stuff like React, which is how I gained the knowledge needed to build a modern replacement map viewer for MapGuide and my usage of knockout.js fell by the wayside as a result, so I never figured out the answer for how to do large scale MVVM.
The main problem was that in a large scale MVVM, how do view models communicate with each other without a tight parent-child coupling?
I deduced that for starters, we definitely need to use dependency injection. Various view models will need to access different services and if we had a root view model with explicit nested child view models (each with their own service requirements), it would be an absolute pain to have to setup these various view models. Using a DI container means we can offload this concern to it and we can focus on just asking the DI container for a particular view model and it will setup all the required services for it for us provided we register everything properly with the DI container.
For better WASM support, I wanted a dependency injection container that is not driven by reflection to make the code more friendlier to app trimming. We want to be able to app trim on publish so that we can eliminate unused code and reduce the final binary size. This is most desirable for the WASM target as app trimming means smaller binaries, which means smaller payloads to download in a web browser. StrongInject was chosen for this reason as it was a "compile-time" DI container that can verify all your dependencies are registered properly before running the application through the magic of source generators, generating all the necessary registration and validation code for you.
Finally, to be able to communicate between view models without necessary parent-child coupling, the messenger facility of the MVVM toolkit can be used. With this messenger facility, we simply:- Have select view models be recipients of certain messages
- Have our application services (that various view model commands call) send these messages.
- Relevant recipients get notified and update themselves (and their bound UIs) accordingly as a result.
The reason is because the tab content we want to show is not homogenous. One open editor tab could be for a layer, one for a map, one for a feature source, etc, etc. So we need to be able to show different tabs on the same tab control.
Avalonia documentation is pretty scant on this topic. All examples I found assume homogenous series of tab content, which is not our case.
Just for laughs, since AI has been hyped for soon taking away everyone's jobs (even us devs), I figured I'd ask huggingface chat (as a guest), how would you solve this problem?
Unfortunately, the provided code sample does not work out of the box. It clearly assumed Avalonia = WPF and gave me a WPF-based solution. The giveaway was the Avalonia TabControl does not have an ItemTemplateSelector, but the WPF TabControl does.
But Avalonia sharing many conceptual similarities with WPF meant that although the answer provided wasn't correct, parts of the answer were applicable and did lead me down to further avenues of inquiry and eventually I found the solution: It was to define a data template for every possible derived tab view model class in the same UserControl where the TabControl was specified.Final challenge: Avalonia VS designerThis wasn't so much a challenge, rather an annoyance. The Avalonia designer in Visual Studio has some teething issues- Intellisense/autocomplete is somewhat flaky when writing binding expressions and when you're doing a lot of data-binding, having the editor giving you and incomplete or outdated list of properties you can bind to becomes annoying. A full project build generally fixes this, but it is annoying having to do this every time I add new observable properties or commands to an existing view model class.
- It's also not rename-aware, so observable property or command renames will result in stale binding expressions, causing havoc with the designer and have to be manually fixed up in the XAML. Choose your observable property names wisely I suppose, because renaming them afterwards is painful.
%20-%20Microsoft%20Visual%20Studio.png)
%20-%20Microsoft%20Visual%20Studio.png)
%20-%20Microsoft%20Visual%20Studio.png)
And if these screenshots don't convince you, thanks to being able to deploy as a WASM target, I deployed a copy to GitHub pages, so you can see this app for yourself right in your WASM-enabled web browser!%20-%20Brave.png)
The source code for this app can be found here. One day this may form the basis of a new (true) multi-platform version of MapGuide Maestro, but for now this lies as a potentially useful starting point for building a tabbed-multi-document editor application with Avalonia.
So what did I think of Avalonia from this little experiment?- I like it mostly. My pre-existing experience on knockout.js helped greatly with picking up MVVM and data-binding. My initial prediction of a VSCode-style UI layout being buildable turned out to be true.
- I like the default (project template provided) choice of MVVM Toolkit for applying the MVVM pattern. I like their heavy use of source generators to make adding new observable properties and commands to a view model being a simple case of tacking [ObservableProperty] on a field or tacking [RelayCommand] to a private method and having the source generator generate all of the boilerplate code for you (and it's a lot of boilerplate!).
- The revelation that Avalonia has a WASM deployment target was both exciting and "cramping my style". It meant that certain libraries I wanted to use (eg. The MVVM dialogs library) could not be used and it wasn't clear what would work in a WASM browser environment and what wouldn't. Which leads to ...
- Documentation is lacking in some areas. What really stumped me for a while was how do a TabControl bound to a collection of polymorphic or heterogenous tab view models. Their provided examples completely failed to tell me how to do this. I suppose if I came into this with existing WPF experience, this wouldn't have been so difficult as most of the concepts and patterns seem to be mostly transferable, but I happened to have skipped WPF and its bajillion XAML-based derivatives, so I didn't have this pre-existing knowledge to fall back on. Through perseverance and looking at the source code for many existing Avalonia applications on GitHub, I was finally able to determine that data templates was the solution.
Now I better get back onto this MapGuide/FDO work. -
sur GIScussions: Your Map Inside
Publié: 21 March 2024, 5:47pm CET

A few weeks ago I recorded a Geomob Podcast with Ana Lucía González Paz about her beautiful flipbook, A Map Inside. You can read the book in a few minutes and then you can listen to the podcast
[https:]]Towards the end of each podcast, I give my guest the opportunity to go off piste and talk about a subject that they choose (in the past we have talked about digital privacy, mental health and open source sustainability to mention just a few). Ana said that she would like to ask me to describe my Map Inside and you can hear how I replied at the end of the podcast.
After we recorded the podcast, I was chatting with Ana and we thought that it would be fun to get other people to share their Map Inside. Everyone has a Map Inside connected to memories, people, special moments, would you like to share yours? Just record a short audio clip in mp3 format running for 60 to 120 seconds and mail it to me (if you don’t know my email use the Contact Form to reach me or find me at Mastodon). Assuming we get a few responses, Ana and I will put together an episode of the podcast with a selection of your Maps Inside.
Hope to hear from you with your Map Inside
-
sur Mappery: Route Map Not Available
Publié: 21 March 2024, 11:00am CET

Kaakapoo shared this “A lack of #MapsintheWild today”
I’m sure this will prompt some debate as to whether the absence of a Map qualifies as an entry here, but you know the rules (editors are always right)
MapsintheWild Route Map Not Available
-
sur Jorge Sanz: Interview at Geomob Podcast
Publié: 20 March 2024, 3:19pm CET
Pièce jointe: [télécharger]

Earlier this week an episode of the Geomob Podcast was published where Steven Feldman interviews yours truly. It was a lot of fun to chat with Steven about Elastic, my experience in the geospatial industry, and Open Source in general. I could also advocate a bit about data privacy and digital identity which is a topic that has picked my interest even more lately with all the shit that is hitting that social network we all know about.
If you want to learn a bit about Elastic and Geo this is maybe a good opportunity to get a condensed gist of why would anyone want to store and analyze geospatial data in Elasticsearch, a few compelling use cases and so on.
Cheers!
-
sur Mappery: Fushimi Inari-taisha Park
Publié: 20 March 2024, 11:00am CET

Raf shared this beautiful map from Fushimi Inari-taisha park in Kyoto.
MapsintheWild Fushimi Inari-taisha Park
-
sur Camptocamp: Camptocamp at FOSSGIS 2024
Publié: 20 March 2024, 1:00am CET
Pièce jointe: [télécharger]
Camptocamp will join other geospatial professionals at the FOSSGIS conference in Hamburg, Germany from March 20 to 23, 2024. -
sur GeoTools Team: GeoTools 31.0 released
Publié: 19 March 2024, 8:12pm CET
GeoTools 31.0 released The GeoTools team is pleased to announce the release of the latest stable version of GeoTools 31.0: geotools-31.0-bin.zip geotools-31.0-doc.zip geotools-31.0-userguide.zip geotools-31.0-project.zip This release is also available from the OSGeo Maven Repository and is made in conjunction with GeoServer 2.25.0 and -
sur Mappery: Drinking Longitude
Publié: 19 March 2024, 11:00am CET
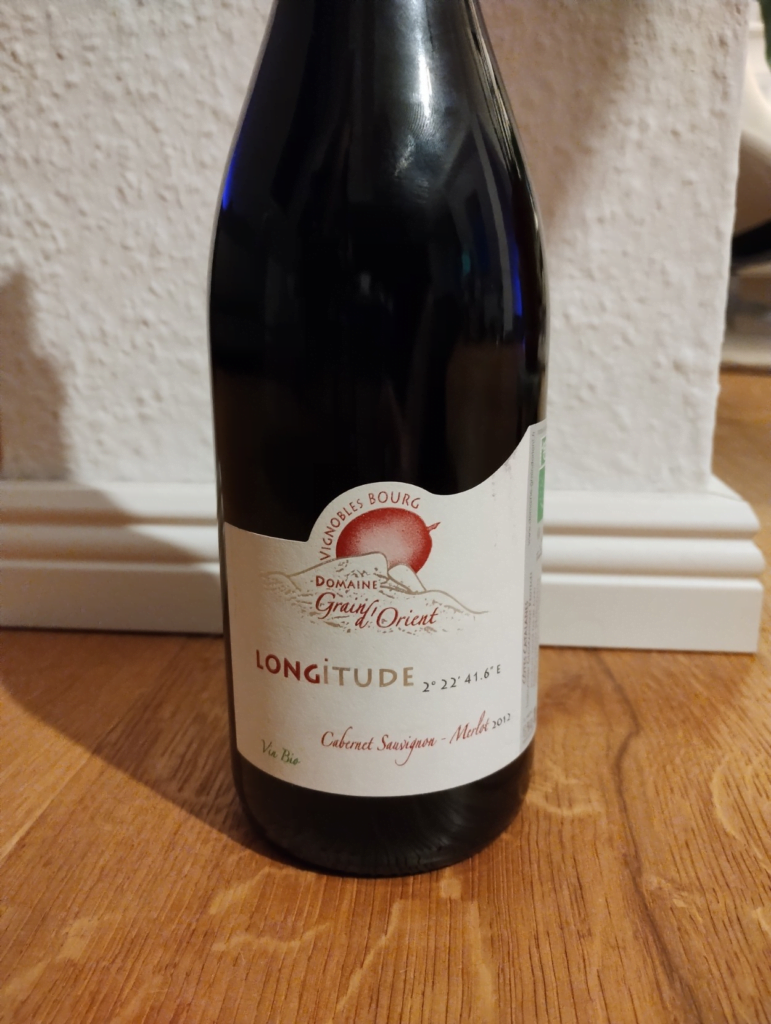
Javier asks whether this qualifies as a map in the wild? And we say “Why not?”
The blurb on the bottle should say “This wine will coordinate well with food from any latitude”
MapsintheWild Drinking Longitude
-
sur GeoServer Team: GeoServer 2.25.0 Release
Publié: 19 March 2024, 1:00am CET
GeoServer 2.25.0 release is now available with downloads (bin, war, windows), along with docs and extensions.
This is a stable release of GeoServer recommended for production use. GeoServer 2.25.0 is made in conjunction with GeoTools 31.0, and GeoWebCache 1.25.0.
Thanks to Peter Smythe for making this release. Thanks to Levy Steve, Peter Smythe, Jody Garnett, and Mark Prins for testing the 2.25.0 release.
Security ConsiderationsThis release addresses several security vulnerabilities, all of which require admin access.
- If you have updated to GeoServer 2.24.2 Release or GeoServer 2.23.5 Release you are already patched.
- If you are working with a commercial support provider that volunteers with the geoserver-security email list they are already informed.
Vulnerabilities:
- CVE-2023-51444 Arbitrary file upload vulnerability in REST Coverage Store API (High).
- CVE-2023-41877 GeoServer log file path traversal vulnerability (High).
- CVE-2024-23634 Arbitrary file renaming vulnerability in REST Coverage/Data Store API (Moderate).
- CVE-2024-23643 Stored Cross-Site Scripting (XSS) vulnerability in GWC Seed Form (Moderate).
- CVE-2024-23821 Stored Cross-Site Scripting (XSS) vulnerability in GWC Demos Page (Moderate).
- CVE-2024-23819 Stored Cross-Site Scripting (XSS) vulnerability in MapML HTML Page (Moderate).
- CVE-2024-23818 Stored Cross-Site Scripting (XSS) vulnerability in WMS OpenLayers Format (Moderate).
- CVE-2024-23642 Stored Cross-Site Scripting (XSS) vulnerability in Simple SVG Renderer (Moderate).
- CVE-2024-23640 Stored Cross-Site Scripting (XSS) vulnerability in Style Publisher (Moderate).
- CVE-2023-51445 Stored Cross-Site Scripting (XSS) vulnerability in REST Resources API (Moderate).
We would like to thank everyone who contributed to reporting, verifying and fixing the above vulnerabilities (see each CVE for appropriate credits). A special thank you to Steve Ikeoka for reporting most of the issues and doing the majority of the actual fixes.
The use of the CVE system allows the GeoServer team to reach a wider audience than blog posts. See the project security policy for more information on how security vulnerabilities are managed.
Upgrade NotesWe have a number of configuration changes when updating an existing system:
-
The longstanding
ENTITY_RESOLUTION_ALLOWLISTsetting has been recommended as a way to control the locations available for external entity resolution when parsing XML documents and requests.The default has changed from
*(allowing any location) to allowing the recommendedwww.w3.org,schemas.opengis.net,www.opengis.netlocations used for OGC Web Services, along with theinspire.ec.europa.eu/schemaslocation used by our friends in Europe. -
The FreeMarker Template HTML Auto-escaping is now enabled by default.
-
The spring security firewall is now enabled by default.
-
A new configuration setting is available to limit content served from the
geoserver/wwwfolder.If you have not met the
wwwfolder before it is used to share content, and there is a tutorial serving static files. -
We do add recommendations to production considerations over time, if you have not checked that page in a while please review.
Thanks to Steve Ikeoka and Jody Garnett for these improvements.
JTS fast polygon intersection enabled by defaultThe JTS Next Generation polygon intersection algorithm has been enabled by default, which will improve performance of a number of operations, including WPS processes and the vector tiles generation. We deem the functionality well tested enough that it should be opened to the majority of users, even if it’s still possible to turn it off by adding the
-Djts.overlay=old.
MapML Extension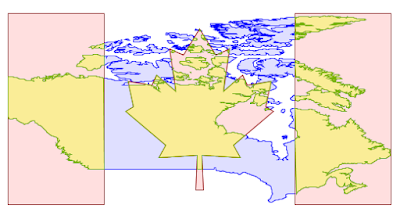
The MapML extension is receiving a number of updates and improvements, with more to come in the following months. It’s now possible to declare “Tiled CRS” as the CRS for a layer, with the implication not just of the CRS, but also of the gridset that will be used by the MapML viewer:
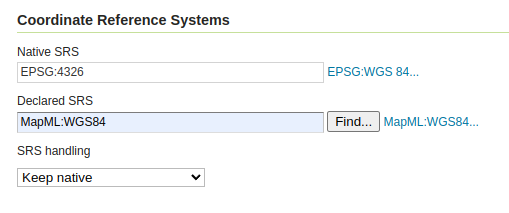
This portion builds on top of the work done months ago to support astronomical CRSs, which allows GeoServer to support multiple CRS authorities.
The MapML preview links are now using the new MapML output format, while the old dedicated REST controller has been removed. This allows for better integration of the MapML format in the GeoServer ecosystem. The MapML viewer has also been updated to the latest version:
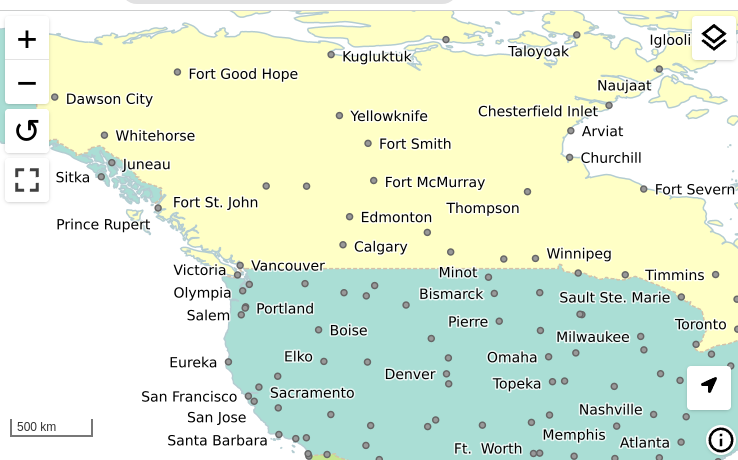
Thanks to Joseph Miller and Andrea Aime (GeoSolutions) for this work, and Natural Resources Canada for sponsoring it.
Community Module UpdatesMuch of the new activity in GeoServer starts as a community module. We’d like to remind you that these modules are not yet supported, and invite you to join the effort by participating in their development, as well as testing them and providing feedback.
Raster Attribute Table community moduleDeveloped as part of GEOS-11175, the Raster Attribute Table community module uses the GDAL Raster Attribute Table (RAT) to provide a way to associate attribute information for individual pixel values within the raster, to create styles as well as to provide a richer GetFeatureInfo output.
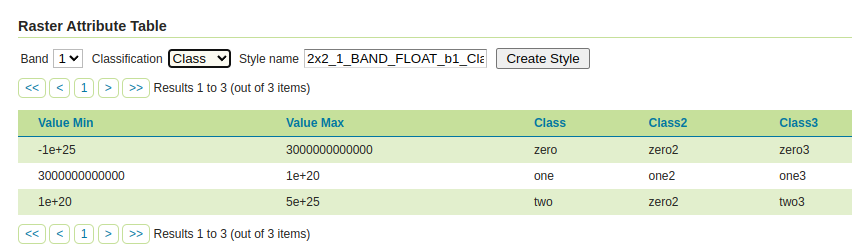
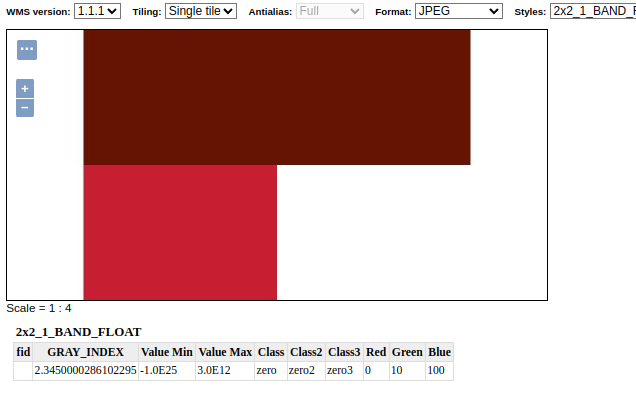
For more information see the user guide.
We’d like to thank Andrea Aime (GeoSolutions) for the development and NOAA for sponsoring.
Graticules for WMS mapsThe graticules community module, developed as part of GEOS-11216, provides a datastore generating graticules for WMS maps, along with a rendering transformation that can be used to label them. The module can be used to draw a graticule in WMS maps, as well as to download them as part of WFS (or in combination with the WPS download module).
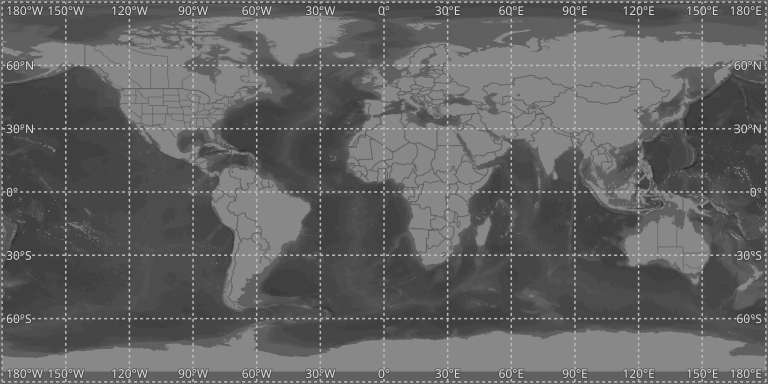
We’d like to thank Ian Turton for development and GeoSolutions for sponsoring the work.
GeoServer monitor Kafka storageThe monitoring Kafka storage module, developed as part of GEOS-11150, allows storing the requests captured by the monitoring extension into a Kafka topic.

We’d like to thank Simon Hofer for sharing his work with the community. To learn more about the module, how to install and use it, see the user-guide.
JWT HeadersThe JWT headers module has been developed as part of GEOS-11317.

The module is a new authentication filter that can read JWT Headers, as well as general JSON payloads and simple strings, to identify a user, as well as to extract their roles. The combination of Apache mod_auth_openidc with geoserver-jwt-headers-plugin provides an alternative to using the geoserver-sec-oauth2-openid-connect-plugin plugin.
We’d like to thank David Blasby (GeoCat) for this work on this module.
Developer Updates ResourceStore / Paths API ChangeDevelopers should keep in mind some important maintenance work performed by Niels Charlier on the use absolute and relative paths in the
ResourceStore. See the Developers Guide for more information.This does not affect end users.
Experimental Java 21 supportGeoServer, along with GeoTools and GeoWebCache, are now tested to build and pass tests with Java 21.
This is not yet an endorsement to run GeoServer in production with Java 21. We are looking ahead at the 2024 roadmap, and are making sure the basics are covered for the newer Java releases.
Full Release notesNew Feature:
- GEOS-11225 [AuthKey] AuthKey synchronize the user/group automatically
MapML:
- GEOS-10438 ENTITY_RESOLUTION_ALLOWLIST property not parsing empty setting
- GEOS-11207 Refactor MapML MVC controller as GetMap-based operation with standard parameter format
- GEOS-11221 mkdocs preflight rst fixes
- GEOS-11289 Enable Spring Security Stric [HttpFirewall] by default
- GEOS-11297 Escape WMS GetFeatureInfo HTML output by default
- GEOS-11300 Centralize access to static web files
Improvement:
- GEOS-11306 Java 17 does not support GetFeature lazy JDBC count(*)
- GEOS-11130 Sort parent role dropdown in Add a new role
- GEOS-11142 Add mime type mapping for yaml files
- GEOS-11148 Update response headers for the Resources REST API
- GEOS-11149 Update response headers for the Style Publisher
- GEOS-11152 Improve handling special characters in the Simple SVG Renderer
- GEOS-11153 Improve handling special characters in the WMS OpenLayers Format
- GEOS-11155 Add the X-Content-Type-Options header
- GEOS-11173 Default to using [HttpOnly] session cookies
- GEOS-11176 Add validation to file wrapper resource paths
- GEOS-11213 Improve REST external upload method unzipping
- GEOS-11222 Include Conformance Class for “Search” from OGC API - Features Part 5 proposal
- GEOS-11226 Enable JTS OverlayNG by default
- GEOS-11246 Schemaless plugin performance for WFS
- GEOS-11247 Avoid HTML annotations special status in APIBodyProcessor
- GEOS-11248 Move version header handling from APIBodyMethodProcessor to APIDispatcher
- GEOS-11260 JNDI tutorial uses outdated syntax
- GEOS-11288 Improve input validation in ClasspathPublisher
- GEOS-11289 Enable Spring Security Stric [HttpFirewall] by default
- GEOS-11298 When a Raster Attribute Table is available, expose its attributes in GetFeatureInfo
- GEOS-11327 Add warning about using embedded data directories
- GEOS-11334 Update MapML viewer to release 0.13.1
Bug:
- GEOS-11050 jdbc-store broken by changes to Paths.names
- GEOS-11051 Env parametrization does not save correctly in AuthKey extension
- GEOS-11145 The GUI “wait spinner” is not visible any longer
- GEOS-11182 Avoid legends with duplicated entries
- GEOS-11187 Configuring a raster with NaN as NODATA results in two NaN in the nodata band description
- GEOS-11190 GeoFence: align log4j2 deps
- GEOS-11203 WMS GetFeatureInfo bad WKT exception for label-geometry
- GEOS-11224 Platform independent binary doesn’t start properly with default data directory
- GEOS-11250 WFS GeoJSON encoder fails with an exception if an infinity number is used in the geometry
- GEOS-11278 metadata: only selected tab is submitted
- GEOS-11312 Used memory calculation fix on legend WMS request
- GEOS-11266 csw-iso: missing fields in summary response
- GEOS-11312 Inconsistent Memory Units in Legend Image Creation
- GEOS-11335 A layer in an authority other than EPSG may fail to reload after restart
Task:
- GEOS-11242 Remove the Xalan library
- GEOS-11315 Revert to CORS commented out
- GEOS-11318 Update postgresql to 42.7.2
- GEOS-11134 Feedback on download bundles: README, RUNNING, GPL html files
- GEOS-11141 production consideration for logging configuration hardening
- GEOS-11159 Update mapfish-print-lib 2.3.0
- GEOS-11180 Update ImageIO-EXT to 1.4.9
- GEOS-11181 Update jai-ext to 1.1.25
- GEOS-11186 Fix maven enforcer failFast
- GEOS-11220 Upgrade Hazelcast from 5.3.1 to 5.3.6
- GEOS-11245 Update OSHI from 6.2.2 to 6.4.10
- GEOS-11316 Update Spring version to 5.3.32
For the complete list see 2.25.0 release notes.
Community UpdatesCommunity module development:
- GEOS-11305 Add layer information in the models backing STAC
- GEOS-11146 Fix MBTiles output format test
- GEOS-11184 ncwms module has a compile dependency on gs-web-core test jar
- GEOS-11209 Open ID Connect Proof Key of Code Exchange (PKCE)
- GEOS-11212 OIDC accessToken verification using only JWKs URI
- GEOS-11219 Upgraded mail and activation libraries for SMTP compatibility
- GEOS-11293 Improve performance of wps-lontigudinal-profile
- GEOS-11216 Create a datastore to produce graticules for WMS maps.
Community modules are shared as source code to encourage collaboration. If a topic being explored is of interest to you, please contact the module developer to offer assistance.
About GeoServer 2.25 SeriesAdditional information on GeoServer 2.25 series:
-
sur GeoServer Team: GeoServer 2.25.0 Release
Publié: 19 March 2024, 1:00am CET
GeoServer 2.25.0 release is now available with downloads (bin, war, windows), along with docs and extensions.
This is a stable release of GeoServer recommended for production use. GeoServer 2.25.0 is made in conjunction with GeoTools 31.0, and GeoWebCache 1.25.0.
Thanks to Peter Smythe for making this release. Thanks to Levy Steve, Peter Smythe, Jody Garnett, and Mark Prins for testing the 2.25.0 release.
Security ConsiderationsThis release addresses several security vulnerabilities, all of which require admin access.
- If you have updated to GeoServer 2.24.2 Release or GeoServer 2.23.5 Release you are already patched.
- If you are working with a commercial support provider that volunteers with the geoserver-security email list they are already informed.
Vulnerabilities:
-
CVE-2023-51444 Arbitrary file upload vulnerability in REST Coverage Store API (High).
-
CVE-2023-41877 GeoServer log file path traversal vulnerability (High).
-
CVE-2024-23634 Arbitrary file renaming vulnerability in REST Coverage/Data Store API (Moderate).
-
CVE-2024-23643 Stored Cross-Site Scripting (XSS) vulnerability in GWC Seed Form (Moderate).
-
CVE-2024-23821 Stored Cross-Site Scripting (XSS) vulnerability in GWC Demos Page (Moderate).
-
CVE-2024-23819 Stored Cross-Site Scripting (XSS) vulnerability in MapML HTML Page (Moderate).
-
CVE-2024-23818 Stored Cross-Site Scripting (XSS) vulnerability in WMS OpenLayers Format (Moderate).
-
CVE-2024-23642 Stored Cross-Site Scripting (XSS) vulnerability in Simple SVG Renderer (Moderate).
-
CVE-2024-23640 Stored Cross-Site Scripting (XSS) vulnerability in Style Publisher (Moderate).
-
CVE-2023-51445 Stored Cross-Site Scripting (XSS) vulnerability in REST Resources API (Moderate).
We would like to thank everyone who contributed to reporting, verifying and fixing the above vulnerabilities (see each CVE for appropriate credits). A special thank you to Steve Ikeoka for reporting most of the issues and doing the majority of the actual fixes.
The use of the CVE system allows the GeoServer team to reach a wider audience than blog posts. See the project security policy for more information on how security vulnerabilities are managed.
Upgrade NotesWe have a number of configuration changes when updating an existing system:
-
The longstanding
ENTITY_RESOLUTION_ALLOWLISTsetting has been recommended as a way to control the locations available for external entity resolution when parsing XML documents and requests.The default has changed from
*(allowing any location) to allowing the recommendedwww.w3.org,schemas.opengis.net,www.opengis.netlocations used for OGC Web Services, along with theinspire.ec.europa.eu/schemaslocation used by our friends in Europe. -
The FreeMarker Template HTML Auto-escaping is now enabled by default.
-
The spring security firewall is now enabled by default.
-
A new configuration setting is available to limit content served from the
geoserver/wwwfolder.If you have not met the
wwwfolder before it is used to share content, and there is a tutorial serving static files. -
We do add recommendations to production considerations over time, if you have not checked that page in a while please review.
Thanks to Steve Ikeoka and Jody Garnett for these improvements.
JTS fast polygon intersection enabled by defaultThe JTS Next Generation polygon intersection algorithm has been enabled by default, which will improve performance of a number of operations, including WPS processes and the vector tiles generation. We deem the functionality well tested enough that it should be opened to the majority of users, even if it’s still possible to turn it off by adding the
-Djts.overlay=old.
MapML ExtensionThe MapML extension is receiving a number of updates and improvements, with more to come in the following months. It’s now possible to declare “Tiled CRS” as the CRS for a layer, with the implication not just of the CRS, but also of the gridset that will be used by the MapML viewer:
This portion builds on top of the work done months ago to support astronomical CRSs, which allows GeoServer to support multiple CRS authorities.
The MapML preview links are now using the new MapML output format, while the old dedicated REST controller has been removed. This allows for better integration of the MapML format in the GeoServer ecosystem. The MapML viewer has also been updated to the latest version:
Thanks to Joseph Miller and Andrea Aime (GeoSolutions) for this work, and Natural Resources Canada for sponsoring it.
Community Module UpdatesMuch of the new activity in GeoServer starts as a community module. We’d like to remind you that these modules are not yet supported, and invite you to join the effort by participating in their development, as well as testing them and providing feedback.
Raster Attribute Table community moduleDeveloped as part of GEOS-11175, the Raster Attribute Table community module uses the GDAL Raster Attribute Table (RAT) to provide a way to associate attribute information for individual pixel values within the raster, to create styles as well as to provide a richer GetFeatureInfo output.
For more information see the user guide.
We’d like to thank Andrea Aime (GeoSolutions) for the development and NOAA for sponsoring.
Graticules for WMS mapsThe graticules community module, developed as part of GEOS-11216, provides a datastore generating graticules for WMS maps, along with a rendering transformation that can be used to label them. The module can be used to draw a graticule in WMS maps, as well as to download them as part of WFS (or in combination with the WPS download module).
We’d like to thank Ian Turton for development and GeoSolutions for sponsoring the work.
GeoServer monitor Kafka storageThe monitoring Kafka storage module, developed as part of GEOS-11150, allows storing the requests captured by the monitoring extension into a Kafka topic.
We’d like to thank Simon Hofer for sharing his work with the community. To learn more about the module, how to install and use it, see the user-guide.
JWT HeadersThe JWT headers module has been developed as part of GEOS-11317.
The module is a new authentication filter that can read JWT Headers, as well as general JSON payloads and simple strings, to identify a user, as well as to extract their roles. The combination of Apache mod_auth_openidc with geoserver-jwt-headers-plugin provides an alternative to using the geoserver-sec-oauth2-openid-connect-plugin plugin.
We’d like to thank David Blasby (GeoCat) for this work on this module.
Developer Updates ResourceStore / Paths API ChangeDevelopers should keep in mind some important maintenance work performed by Niels Charlier on the use absolute and relative paths in the
ResourceStore. See the Developers Guide for more information.This does not affect end users.
Experimental Java 21 supportGeoServer, along with GeoTools and GeoWebCache, are now tested to build and pass tests with Java 21.
This is not yet an endorsement to run GeoServer in production with Java 21. We are looking ahead at the 2024 roadmap, and are making sure the basics are covered for the newer Java releases.
Full Release notesNew Feature:
- GEOS-11225 [AuthKey] AuthKey synchronize the user/group automatically
MapML:
- GEOS-10438 ENTITY_RESOLUTION_ALLOWLIST property not parsing empty setting
- GEOS-11207 Refactor MapML MVC controller as GetMap-based operation with standard parameter format
- GEOS-11221 mkdocs preflight rst fixes
- GEOS-11289 Enable Spring Security Stric [HttpFirewall] by default
- GEOS-11297 Escape WMS GetFeatureInfo HTML output by default
- GEOS-11300 Centralize access to static web files
Improvement:
- GEOS-11130 Sort parent role dropdown in Add a new role
- GEOS-11142 Add mime type mapping for yaml files
- GEOS-11148 Update response headers for the Resources REST API
- GEOS-11149 Update response headers for the Style Publisher
- GEOS-11152 Improve handling special characters in the Simple SVG Renderer
- GEOS-11153 Improve handling special characters in the WMS OpenLayers Format
- GEOS-11155 Add the X-Content-Type-Options header
- GEOS-11173 Default to using [HttpOnly] session cookies
- GEOS-11176 Add validation to file wrapper resource paths
- GEOS-11213 Improve REST external upload method unzipping
- GEOS-11222 Include Conformance Class for “Search” from OGC API - Features Part 5 proposal
- GEOS-11226 Enable JTS OverlayNG by default
- GEOS-11246 Schemaless plugin performance for WFS
- GEOS-11247 Avoid HTML annotations special status in APIBodyProcessor
- GEOS-11248 Move version header handling from APIBodyMethodProcessor to APIDispatcher
- GEOS-11260 JNDI tutorial uses outdated syntax
- GEOS-11288 Improve input validation in ClasspathPublisher
- GEOS-11289 Enable Spring Security Stric [HttpFirewall] by default
- GEOS-11298 When a Raster Attribute Table is available, expose its attributes in GetFeatureInfo
- GEOS-11327 Add warning about using embedded data directories
- GEOS-11334 Update MapML viewer to release 0.13.1
Bug:
- GEOS-11050 jdbc-store broken by changes to Paths.names
- GEOS-11051 Env parametrization does not save correctly in AuthKey extension
- GEOS-11145 The GUI “wait spinner” is not visible any longer
- GEOS-11182 Avoid legends with duplicated entries
- GEOS-11187 Configuring a raster with NaN as NODATA results in two NaN in the nodata band description
- GEOS-11190 GeoFence: align log4j2 deps
- GEOS-11203 WMS GetFeatureInfo bad WKT exception for label-geometry
- GEOS-11224 Platform independent binary doesn’t start properly with default data directory
- GEOS-11250 WFS GeoJSON encoder fails with an exception if an infinity number is used in the geometry
- GEOS-11278 metadata: only selected tab is submitted
- GEOS-11312 Used memory calculation fix on legend WMS request
- GEOS-11266 csw-iso: missing fields in summary response
- GEOS-11312 Inconsistent Memory Units in Legend Image Creation
- GEOS-11335 A layer in an authority other than EPSG may fail to reload after restart
Task:
- GEOS-11242 Remove the Xalan library
- GEOS-11315 Revert to CORS commented out
- GEOS-11318 Update postgresql to 42.7.2
- GEOS-11134 Feedback on download bundles: README, RUNNING, GPL html files
- GEOS-11141 production consideration for logging configuration hardening
- GEOS-11159 Update mapfish-print-lib 2.3.0
- GEOS-11180 Update ImageIO-EXT to 1.4.9
- GEOS-11181 Update jai-ext to 1.1.25
- GEOS-11186 Fix maven enforcer failFast
- GEOS-11220 Upgrade Hazelcast from 5.3.1 to 5.3.6
- GEOS-11245 Update OSHI from 6.2.2 to 6.4.10
- GEOS-11316 Update Spring version to 5.3.32
For the complete list see 2.25.0 release notes.
Community UpdatesCommunity module development:
- GEOS-11305 Add layer information in the models backing STAC
- GEOS-11146 Fix MBTiles output format test
- GEOS-11184 ncwms module has a compile dependency on gs-web-core test jar
- GEOS-11209 Open ID Connect Proof Key of Code Exchange (PKCE)
- GEOS-11212 OIDC accessToken verification using only JWKs URI
- GEOS-11219 Upgraded mail and activation libraries for SMTP compatibility
- GEOS-11293 Improve performance of wps-lontigudinal-profile
- GEOS-11216 Create a datastore to produce graticules for WMS maps.
Community modules are shared as source code to encourage collaboration. If a topic being explored is of interest to you, please contact the module developer to offer assistance.
About GeoServer 2.25 SeriesAdditional information on GeoServer 2.25 series:
-
sur Free and Open Source GIS Ramblings: Getting started with pygeoapi processes
Publié: 18 March 2024, 8:16pm CET
Today’s post is a quick introduction to pygeoapi, a Python server implementation of the OGC API suite of standards. OGC API provides many different standards but I’m particularly interested in OGC API – Processes which standardizes geospatial data processing functionality. pygeoapi implements this standard by providing a plugin architecture, thereby allowing developers to implement custom processing workflows in Python.
I’ll provide instructions for setting up and running pygeoapi on Windows using Powershell. The official docs show how to do this on Linux systems. The pygeoapi homepage prominently features instructions for installing the dev version. For first experiments, however, I’d recommend using a release version instead. So that’s what we’ll do here.
As a first step, lets install the latest release (0.16.1 at the time of writing) from conda-forge:
conda create -n pygeoapi python=3.10
conda activate pygeoapi
mamba install -c conda-forge pygeoapi
Next, we’ll clone the GitHub repo to get the example config and datasets:
cd C:\Users\anita\Documents\GitHub\
git clone [https:]
cd pygeoapi\
To finish the setup, we need some configurations:
cp pygeoapi-config.yml example-config.yml
# There is a known issue in pygeoapi 0.16.1: [https:]
# To fix it, edit the example-config.yml: uncomment the TinyDB option in the server settings (lines 51-54)

$Env:PYGEOAPI_CONFIG = "F:/Documents/GitHub/pygeoapi/example-config.yml"
$Env:PYGEOAPI_OPENAPI = "F:/Documents/GitHub/pygeoapi/example-openapi.yml"
pygeoapi openapi generate $Env:PYGEOAPI_CONFIG --output-file $Env:PYGEOAPI_OPENAPI
Now we can start the server:
pygeoapi serveAnd once the server is running, we can send requests, e.g. the list of processes:
curl.exe [localhost:5000]And, of course, execute the example “hello-world” process:
curl.exe --% -X POST [localhost:5000] -H "Content-Type: application/json" -d "{\"inputs\":{\"name\": \"hi there\"}}"As you can see, writing JSON content for curl is a pain. Luckily, pyopenapi comes with a nice web GUI, including Swagger UI for playing with all the functionality, including the hello-world process:

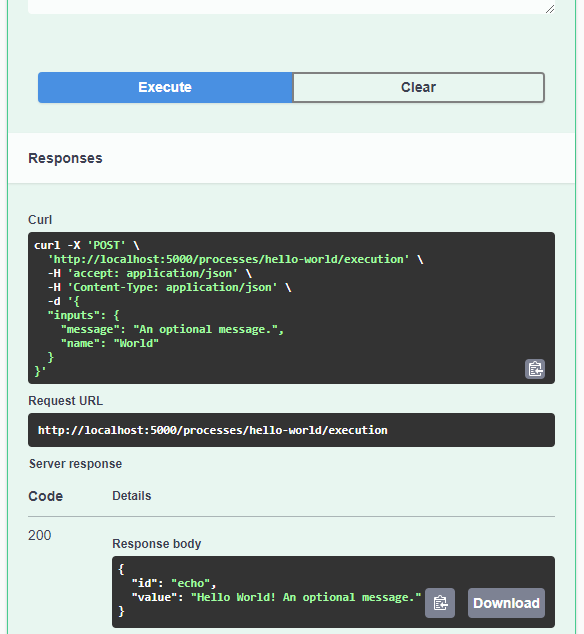
It’s not really a geospatial hello-world example, but it’s a first step.
Finally, I wan’t to leave you with a teaser since there are more interesting things going on in this space, including work on OGC API – Moving Features as shared by the pygeoapi team recently:
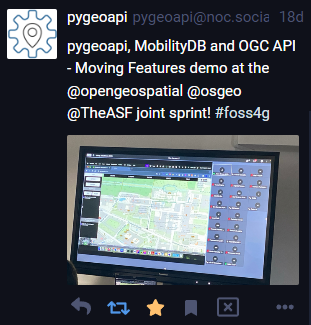
So, stay tuned.
-
sur GRASS GIS: 2024 GRASS GIS Community meeting in Prague!
Publié: 18 March 2024, 8:12pm CET
The GRASS GIS team announces the annual Community Meeting!! The GRASS GIS Community Meeting will take place from June 14 to 19, 2024, at the NC State European Center in Prague, Czech Republic. Community meetings are great opportunities to support the development of GRASS GIS! Join us Write code Write documentation Translation Website design and content Integrations with other software (QGIS, GDAL, R, etc.) Plan for the future The community meeting is a get-together where supporters, contributors, power users and developers make decisions and tackle larger problems related to the project, discuss and fix bugs, draw the project roadmap and work on new features. -
sur Fernando Quadro: Geoprocessamento no Agronegócio
Publié: 18 March 2024, 1:00pm CET
O geoprocessamento na agricultura reúne tecnologias e métodos essenciais para coletar, tratar e analisar diversos dados sobre a produção agropecuária.
Com isso o produtor pode ter acesso a imagens e mapas precisos, além de poder traçar planejamentos mais eficientes. Assim consegue aumentar a produtividade e se tornar mais competitivo.
Por isso, o investimento em tecnologias de geoprocessamento na agricultura é considerado fundamental para o produtor que quer melhorar seus resultados.
Mas, como isso pode ajudar o agricultor na prática? Vamos citar abaixo alguns benefícios:
 Acesso a informações mais detalhadas sobre cada talhão
Identificação de tendências de produtividade
Permitir o trabalho com parceiros de negócio
Identificação de pragas e doenças
Controle de plantas daninhasO uso do WebGIS vem sendo uma tendência que cresce a cada dia nesse setor. Sua possibilidade de interação e disponibilização de informações para o usuário é um elemento fundamental que faz com que este tipo de sistema de informação geográfica conectado à internet seja uma importante vertente para o futuro das geotecnologias.
-
sur Mappery: No Cigars!
Publié: 18 March 2024, 11:00am CET

Reinder sent this pic, he said “In Amsterdam, they named the Balthasar Floriszstraat after a 17th C. mapmaker. In this street I ran into a rather peculiar world map. The caption says ‘No Cigars'”
MapsintheWild No Cigars!
-
sur Camptocamp: Camptocamp Heads to FOSSGIS 2024
Publié: 18 March 2024, 1:00am CET
Pièce jointe: [télécharger]
The Camptocamp team is gearing up for another great experience at the FOSSGIS conference. -
sur Mappery: Rishikesh Hostel
Publié: 17 March 2024, 11:00am CET

Elizabeth is back in Rishikesh and sent thios pic from the lobby of her hostel
MapsintheWild Rishikesh Hostel
-
sur Ecodiv.earth: Download AHN data in GRASS GIS
Publié: 17 March 2024, 12:00am CET
The AHN
The ‘Actueel Hoogtebestand Nederland’ (AHN, version 4) is the latest digital elevation model (DEM) of the Netherlands. It includes a digital terrain model (DTM) and a digital surface model (DSM). The former represents the bare ground surface without any features such as buildings, vegetation, or other structures, while the latter includes these features.
Both layers can be downloaded at 0.5 or 5 meter resolution in tiles of 6.5 by 5 km. Downloading one tile, which is approximately 500 MB, is doable. However, if you need more tiles, the arguably easier way is to download the data using the WCS (Web Coverage Service) protocol, which allows you to choose what part of the available data to download based on spatial constraints.
Import the DTMThis example shows the steps to download the 0.5 meter resolutiom DTM for the Land van Cuijk, a municipality in which our research group Climate-robust Landscapes is carrying out several studies. The first step is to get the r.in.wcs addon. With this addon, you can use the WCS protocol to download data 1 2.
Install the r.in.wcs addon.
First step is to import the Python libraries. Note, this will not be repeated with the next scripts.
import grass.script as gsNow, you can install the
r.in.wcsaddon using the g.extension function.gs.run_command("g.extension", extension="r.in.wcs")You need the
g.extensionfunction to install addons. In the main menu, go toSettings > Addons extension > Install extension from addon. Alternatively, type ing.extensionon the command line. This will open the window shown below.
The g.extension function, started from the command line.
The r.in.wcs addon imports the raster layers using the resolution and extent of the current region. A crucial step, therefore, is to set the extent and resolution of the region so that it aligns perfectly with that of the AHN layer.
Set the extent and resolution to match those of the AHN.
gs.run_command("g.region",
    n=618750,
    s=306250,
    w=10000,
    e=280000,
    res=0.5)
Type in
g.regionon the command line or in the console. You can also find the function undermain menu > Settings > Computational region > set region. This opens the following screen:
Set the bounds
Set the resolution
With this settings, you align the region with the AHN data set.
Next, download the administrative boundaries of the Dutch municipalities, and extract the boundaries of the “Land van Cuijk”.
Download layer with administrative boundaries of the neighborhood.
gs.run_command(
    "v.in.wfs",
    url="https://service.pdok.nl/cbs/wijkenbuurten/2022/wfs/v1_0?",
    output="municipalities",
    name="gemeenten",
)
Next, extract the boundaries of the municipality of “Land van Cuijk”
gs.run_command(
    "v.extract",
    input="municipalities",
    where="naam = 'Land van Cuijk'",
    output="LandvanCuijk",
)
Type in
v.in.wfson the command line or in the console. You can also find the function undermain menu > File > Import vector data. This opens the following screen (you need to fill in parameters in two tabs):
Download the vector layer with the municipality boundaries. Define the base URL and the name of the output layer.
Download the vector layer with the municipality boundaries. Fill in the name of the WFS layer to download.
Extract the boundaries of the municipality of Land van Cuijk. Select the name of the vector layer with municipalities and give the name of the output layer.
Extract the boundaries of the municipality of Land van Cuijk. Fill in the query, which defines which features you want to select and save. Tip: Use the convenient query builder.
Now, you can set the region to match the extent of the vector layer, while taking care that the region aligns perfectly with the DTM.
Set the region to the correct extent and resolution.
First, get the north, south, east, and west coordinates of the bounding box of the vector layer and of the region’s extent.
region_tiles = gs.parse_command("g.region",
    flags="gu")
region_munic = gs.parse_command("v.info",
    flags="g",
    map="LandvanCuijk")
Now, adjust the northern boundary of the bounding box of the vector layer so that it aligns with the AHN tiles.
from math import floor

n = float(region_tiles["n"]) - floor(
    (float(region_tiles["n"]) - float(region_munic["north"]))
)
s = float(region_tiles["s"]) + floor(
    (float(region_munic["south"]) - float(region_tiles["s"]))
)
w = float(region_tiles["w"]) + floor(
    (float(region_munic["west"]) - float(region_tiles["w"]))
)
e = float(region_tiles["e"]) - floor(
    (float(region_tiles["e"]) - float(region_munic["east"]))
)
gs.run_command("g.region", n=n, s=s, e=e, w=w)
And finally, import the DTM layer. Warming, this may take some time.
Import the DTM for the defined region.
gs.run_command(
    "r.in.wcs",
    url="https://service.pdok.nl/rws/ahn/wcs/v1_0?",
    coverage="dtm_05m",
    urlparams="GetMetadata",
    output="dtm_05",
)
The maximum floating-point value (
3.4028235e+38) is not recognized as a NULL value. So use thesetnullparameter in the r.null function to specify that this value has to be set to NULL.gs.run_command("r.null", map="dtm_05", setnull=3.4028235e+38)If this does not work (it didn’t for me), you can use the r.mapcalc function to set this value to NULL.
gs.run_command("r.mapcalc",
    expression="dtm_05m = if(dtm_05m > 1000,null(),dtm_05m)",
    overwrite=True)
Fill in the WCS service URL
Get the overage name to requestTo make it a bit easier, I combined steps 2, 4, and 5 in a new addon r.in.ahn. It is a bit rough around the edges (it only works in a Location with CRS RD New), but it serves its goal. I have submitted it to the GRASS GIS addon repository, so I hope it will be available in a week or so.
FootnotesYou are expected to be familiar with GRASS GIS and the concept of region used in GRASS GIS. If you are new to GRASS GIS, you are warmly recommended to first check out the GRASS GIS Quickstart and the explanation about the GRASS GIS database.??
Downloading the DTM for the whole municipality will take a while. If you want to speed up things, you can work with a smaller area by using your own vector data.??
-
sur Mappery: Contour Insoles for Hill Climbers
Publié: 16 March 2024, 11:00am CET
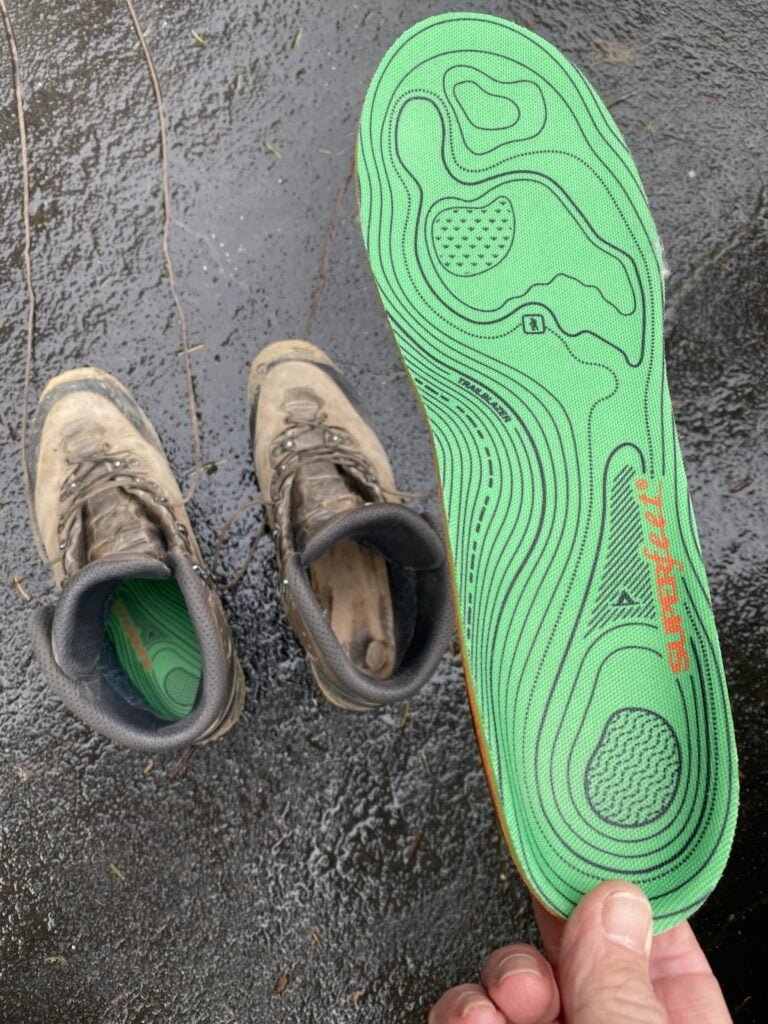
Walter Schwartz said “Every Wednesday my hiking group covers about 15 km of distance and 500 meters of elevation, almost always “in the wild.” As one of us changed into hiking shoes I spotted this insole. It’s a kind of map that has seen plenty of wild!”
I think we may have had a similar insole picture in the past but this is such a great pic even if it is a repeat.
MapsintheWild Contour Insoles for Hill Climbers
-
sur Mappery: Cape Geography Wine
Publié: 15 March 2024, 11:00am CET

Rollo was drinking this tasty South African Malbec from the Cape Geography Co and was inspired to send us a pic before he finished the bottle!
MapsintheWild Cape Geography Wine
-
sur GRASS GIS: Cite GRASS with DOI
Publié: 15 March 2024, 8:42am CET
Cite GRASS GIS and your geospatial data in scientific works - now with Digital Object Identifiers (DOI)! The GRASS GIS project celebrated its 40th birthday last year. Over the decades, GRASS GIS has spread around the globe and has enabled generations of researchers to conduct geospatial research in many fields of science. As a new feature, reflecting the current change towards data-driven science and the paradigms of Open Science (including Open Source) and the FAIR principles (Findable, Accessible, Interoperable, Reusable), GRASS GIS software can now be referenced by Digital Object Identifiers (DOI). -
sur GeoCat: GeoCat is the proud sponsor of the 128th OGC Member Meeting in Delft, the Netherlands
Publié: 14 March 2024, 3:02pm CET
GeoCat is happy to announce that we are the proud sponsor of the 128th OGC Member Meeting that takes place in Delft in the Netherlands from March 25th – March 28th, 2024.
The meeting’s theme is “GEO-BIM for the Built Environment” and there will be a GeoBIM Summit, a special session on Land Admin, a Built Environment Joint Session, a meeting of the Europe Forum, and several SWG and DWG meetings.
Join us and members of the OGC. We are looking forward to see you all in Delft.
Read more about the meeting on the OGC website.
The post GeoCat is the proud sponsor of the 128th OGC Member Meeting in Delft, the Netherlands appeared first on GeoCat bv.
-
sur Fernando Quadro: Raster no PostGIS, vale a pena?
Publié: 14 March 2024, 1:00pm CET
Você sabe quais os benefícios e as armadilhas de colocar arquivos rasters em um banco de dados relacional?
A maioria das pessoas pensa que “colocar em um banco de dados” é uma receita mágica para: desempenho mais rápido, escalabilidade infinita e gerenciamento fácil.
Se você pensar que o banco de dados está substituindo uma pilha de arquivos CSV, isso provavelmente é verdade.
Porém quando o banco de dados está substituindo uma coleção de arquivos de imagens GeoTIFF, isso provavelmente é falso. O raster no banco de dados será mais lento, ocupará mais espaço e será muito chato de gerenciar.
Então, por que fazer isso? Comece com um padrão, “não!”, e então avalie a partir daí.
Para alguns dados raster não visuais e casos de uso que envolvem o enriquecimento de vetores de fontes raster, ter o raster colocalizado com os vetores no banco de dados pode tornar o trabalho com ele mais conveniente. Porém, ainda será mais lento que o acesso direto e ainda será difícil de gerenciar, mas permite o uso de SQL como uma linguagem de consulta, o que pode oferecer muito mais flexibilidade para explorar o espaço da solução do que um script de acesso a dados criado especificamente para esse fim.
Fonte: webgis.tech
Instagram: [https:]]
LinkedIn: [https:]]Gostou desse post? Deixe seu comentário

-
sur Mappery: One World
Publié: 14 March 2024, 11:00am CET

Mark Iliffe spotted this neat t-shirt in a New York shop. You may need to enlarge the picture to appreciate it.
I want (L please).
MapsintheWild One World
-
sur Fernando Quadro: Geoprocessamento na Gestão Rodoviária
Publié: 13 March 2024, 1:00pm CET
Quando falamos de Gestão Rodoviária, muito se discute em como aumentar a segurança e na diminuição de acidentes nas rodovias em geral.
Você sabia que podemos aplicar Geoprocessamento na Gestão Rodoviária para apoio na previsão das condições das rodovias?
O projeto Vision Zero, por exemplo, é uma iniciativa que tem o objetivo de reduzir a zero as mortes no trânsito, e o SIG e a análise espacial são ferramentas utilizadas para atingir esse objetivo.
Mas onde o Geoprocessamento entra na prática, e onde ele pode realmente contribuir? Veja:
Prevenção de riscos e acidentes;
Melhorias de acesso;
Mapeamento de estradas inundáveis;
Geotecnologias de detecção remota;
Dados GPS;
Aprendizado de máquina para prever locais de acidentes.Fonte: webgis.tech
Instagram: [https:]]
LinkedIn: [https:]]Você já tinha pensado nessas possibilidades do Geoprocessamento? Conte nos comentários
-
sur Mappery: Geo-embellished Vending Machine
Publié: 13 March 2024, 11:00am CET

Maarten Pullen sent us this pic of a vending machine that he spotted in Amsterdam.
If you are puzzled by this one, Maarten explained “The shot was taken in Amsterdam, at the Amsterdam School of Real Estate. They probably want to show some of their local identity to all the business people visiting there.”
MapsintheWild Geo-embellished Vending Machine
-
sur Stefano Costa: Africa. Le collezioni dimenticate
Publié: 13 March 2024, 9:12am CET
È finita a Torino la mostra “Africa. Le collezioni dimenticate” allestita nelle sale di Palazzo Chiablese. Sono riuscito a visitare la mostra pochi giorni fa. Mi è piaciuta molto.
La mostra è stata organizzata dai Musei Reali di Torino, dalla Direzione Regionale Musei Piemonte e dal Museo di Antropologia ed Etnografia dell’Università di Torino, ed è una intensa passeggiata nel voyeurismo e collezionismo italiano durante il lungo periodo della scoperta, conquista e razzia dell’Africa, fino agli orrori della guerra in Etiopia. Il percorso si snoda sui passi di molti personaggi, tutti uomini italiani: esploratori, ingegneri al servizio dell’espansione belga nel Congo, affaristi, membri della casa reale. Tutti accomunati dall’attività coloniale nelle sue diverse fasi storiche, e tutti prontamente rimossi dalla memoria collettiva al termine della seconda guerra mondiale. Altrettanto dimenticate le collezioni di oggetti africani che questi personaggi hanno fatto confluire a vario titolo nei musei italiani e in questo caso piemontesi.
Ad accompagnare la visita le installazioni di Bekele Mekonnen, in particolare il “site specific” dal titolo “The smoking table” ma anche le clip sonore lungo il percorso.
La mostra ha agitato tantissimo i fascisti dichiarati e quelli non dichiarati perché non usa giri di parole, perché chiama il colonialismo e il razzismo con il loro nome, perché mette le voci africane sullo stesso piano di quelle italiane. Il ricco programma pubblico ha coinvolto molte persone, anche originarie dell’Africa.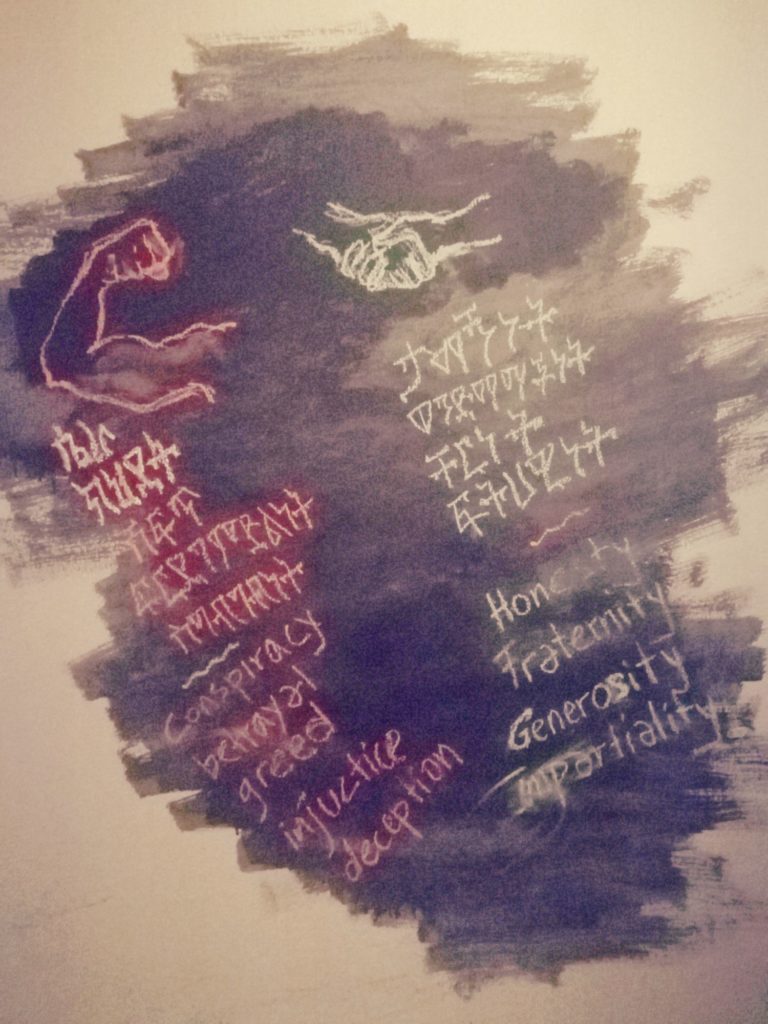 Parte dell’installazione “The smoking table” con scritte di colori diversi. In rosso sotto un braccio muscoloso: conspiracy, betrayal, greed, injustice, deception. In azzurro sotto due mani strette: honesty, fraternity, generosity, impartiality”
Le polemiche, tutte politiche e ben poco culturali, suonano come un brusio fastidioso se consideriamo il lavoro lunghissimo di preparazione della mostra, la quantità di musei con collezioni africane in tutto il Piemonte, la ricchezza del catalogo che affronta in dettaglio molte delle questioni sollevate ad arte, ad esempio il salario pagato ai lavoratori della Società Agricola Italo-Somala, veri “forzati della terra” anche nelle parole degli italiani dell’epoca.
Il paradosso sta nel fatto che questa mostra è molto blanda, se la inquadriamo nella cornice europea e occidentale bianca dei musei di antropologia e archeologia: dalla complessa operazione di continuo adattamento del Musée du Quai Branly di Parigi, al documentario Dahomey di Mati Diop che ha vinto l’Orso d’oro del Festival di Berlino pochi giorni fa, per finire al lavoro avviato nel 2016 da quello che oggi si chiama Museo delle Civiltà. È molto eloquente l’intervento del direttore Andrea Villani a un convegno di poche settimane fa, che potete rivedere su YouTube. Ho apprezzato questo passaggio:
Quello che allora aveva un senso oggi può non solo non avere un senso, ma può anche essere tossico. [..] La storia non si cambia. I musei non cambiano la storia, ma possono raccontarla per intero, accettando di mettere in crisi quello che è venuto prima
E poiché in Italia non siamo solo colonizzatori ma anche colonizzati e depredati, è bene sapere che alcuni musei degli USA sono seriamente alle prese con la provenienza delle proprie collezioni.
-
sur Fernando Quadro: Última chance para se inscrever no Curso de GeoNode: garanta a sua vaga!
Publié: 12 March 2024, 3:59pm CET
NÃO FIQUE DE FORA!

 Curso de GeoNode: Última Semana de inscrições!

Aprenda a montar a sua própria Infraestrutura de Dados Espaciais com o GeoNode, uma plataforma para gestão e publicação de dados geoespaciais que reúne projetos open-source maduros e estáveis sob uma interface consistente e fácil de usar, permitindo que os usuários, compartilhem seus dados de forma rápida e facil.
Este novo curso visa capacitar os profissionais no uso eficiente da plataforma GeoNode, e tem como objetivos:
Familiarizar os participantes com os conceitos fundamentais do Geonode e suas capacidades.
Explorar o funcionamento de servidores de mapas e seus benefícios.
Apresentar os padrões de dados do Open Geospatial Consortium (OGC), como Web Map Service (WMS) e Web Feature Service (WFS), para interoperabilidade geoespacial.
Demonstrar a publicação eficiente de dados no Geonode usando views de bancos de dados geográficos.
Ensinar a integração do Geonode com o QGIS através de plugins. Quer saber mais?
O Curso é oferecido na modalidade EAD Ao Vivo, com uma carga horária de 18 horas divididos em 6 encontros. Porém, essas aulas são gravadas e ficam disponíveis ao aluno por 12 meses em nosso portal do aluno.
Então, se por acaso você não puder comparecer em alguma das aulas ao vivo, não se preocupe, você poderá rever a aula gravada a qualquer momento.
Ficou interessado? -
sur Markus Neteler: GRASS GIS 8.3.2 released
Publié: 12 March 2024, 11:32am CET
The GRASS GIS 8.3.2 maintenance release contains more than 30 changes compared to 8.3.1. This new patch release includes important fixes and improvements to the GRASS GIS modules and the graphical user interface (GUI), making it even more stable for daily work.
The post GRASS GIS 8.3.2 released appeared first on Markus Neteler Consulting.
-
sur Mappery: Occular Cartographic Study
Publié: 12 March 2024, 11:00am CET

Eric Lund said “Came across this eye-catching map at my eye doctor’s office this week and had to share it with you.” Well I am glad he did share it, what a cracking map in the wild! Here’s a bit more detail.

This piece was designed by Tad Bradley, the accompanying description says
‘Snellen’ and “Tumbling E’ eye charts: Ocular Cartographic Study
Although trained and currently practicing architecture at SMA Architecture + Design, Tad Bradley remains an artist and educator. He is continually fascinated with nature and the human body. The complexities within and between these are continually inspirational to investigate through art.
The scale of the eye charts is inspired by the art movement of hyperrealism. In reproducing the eye charts at such a large scale, they begin to hold a greater weight within space, possibly reminding us the value of our eyesight and the incredible value this sense and these organs bring to our lives.
The maps and text you see were originally printed in 1906. The series of oversized manuscripts, which focused on separate geographic regions, were titled ‘Geologic Atlas of the United States’, edited by S.J. Kubel. The maps here, in the waiting area, have been scanned and reprinted on metal panels in order to protect them from UV degradation from solar exposure.
Eye charts have been the tool opticians have used for many years to assist in initially analyzing visual acuity. Exploring a tool within art invites a different awareness of not only the object but the process of how it is used. These eye charts were created for specific groups of people. The Tumbling E chart is used for those unable to read or never learned the Latin alphabet. The shapes and their direction are universal to all. The Snellen eye chart contains eleven rows of diminishing Latin letters to assess vision.
Each 11? x 11? plywood panel has two layers of hand-cut paper [1906] to create visual contrast for viewers.
“I chose the text pages from the Atlas to expose the Tumbling E chart. I was interested in exploring the contrast of the text-heavy pages and their visual relationship to the simplified ‘E’ shapes. The maps, on the other hand, are filled with high-contrast colors and patterns, more easily revealing the letters of the Snellen eye chart.
One of my goals in creating this work was to analyze how we as humans experience the world, interact with one another, and stand alone as individuals. I hope that my work creates curiosity, questions and conversation”.MapsintheWild Occular Cartographic Study
-
sur Fernando Quadro: Por que usar o PostGIS?
Publié: 11 March 2024, 1:00pm CET
Talvez você já tenha escutado algumas vezes a frase: “PostGIS é uma extensão espacial do PostgreSQL”.
Isso não significava que você tivesse ou tenha alguma ideia do que isso significa, e que você sabia o que é o PostgreSQL, quiçá o PostGIS.
Mas não se preocupe, você não sairá desse post sem saber o que é cada um deles.
PostGIS é um extensor de banco de dados espacial de código aberto e disponível gratuitamente para o PostgreSQL Database Management System (também conhecido como DBMS). Portanto, PostgreSQL (também conhecido como Postgres) é o banco de dados e PostGIS é como um complemento desse banco de dados.
Resumidamente, o PostGIS adiciona funções espaciais, como distância, área, união, interseção e tipos de dados de geometria ao PostgreSQL. Os bancos de dados espaciais armazenam e manipulam objetos espaciais como qualquer outro objeto no banco de dados.
 E qual a vantagem de utilizá-lo?
Na prática temos algumas vantagens em utilizá-los, mas a principal é a possibilidade de trabalhar com grandes conjuntos de dados. Não é apenas mais fácil, mas às vezes é quase impossível trabalhar em conjuntos de dados maiores sem um banco de dados.
Você já tentou abrir um arquivo CSV de 2 GB?
Ou tentou fazer algum geoprocessamento para um GeoJSON de 800 mb?
Você sabia que os Shapefiles têm um limite de tamanho?É claro que você pode resolver alguns desses problemas usando o Geopackage ou alguns outros formatos de arquivo, mas em geral o PostGIS é a ferramenta ideal para lidar com grandes volumes de dados (geoespaciais).
Fonte: webgis.tech
Instagram: [https:]]
LinkedIn: [https:]]E você, já conhecia o PostGIS? Conta nos comentários
-
sur Mappery: Indigenous Australia
Publié: 11 March 2024, 11:00am CET

Tony Rabin spotted this map of the indigenous peoples of Australia near the Qantas bording gate at LAX
MapsintheWild Indigenous Australia
-
sur Stefano Costa: In…segnami il silenzio
Publié: 10 March 2024, 7:08pm CET
Ieri sera siamo andati al Teatro Gustavo Modena, qui vicino a casa, per uno spettacolo della stagione dedicata all’infanzia. Eravamo con altre famiglie, ci siamo persino fatti un aperitivo casalingo prima di andare, visto che iniziava alle sette e mezza.
Lo spettacolo si intitola “In…segnami il silenzio” e ha come protagonisti Marcello e Maria. Marcello ci racconta dell’arrivo di Maria nella sua classe, lei non parla e non sente, perché ha le “orecchie rotte”. Maria però sa ascoltare con gli occhi e sa parlare con la danza delle mani, con il viso, con tutto il corpo. Il rapporto tra Marcello e Maria è molto profondo, lui si lascia trasportare e insegnare. In cambio le fa vedere la musica che lei non può sentire, in particolare sulle note di una travolgente “Ça plane pour moi”.
Lo spettacolo è rivolto ai bambini anche se non è facilissimo, ma tratta in modo fiabesco, senza filtri e un po’ scanzonato il tema della disabilità, che non è solo la sordità di Maria ma anche la “distrazione” di Marcello che la maestra gli rimprovera.
Ci è piaciuto molto.
Alla fine un appello della regista Elena Dragonetti per il cessate il fuoco a Gaza è stato accolto da un lungo applauso.
Locandina dello spettacolo sul sito del Teatro nazionale di Genova
-
sur Mappery: Mappery Featured in The New York Times
Publié: 10 March 2024, 12:48pm CET

A few weeks ago I did an interview with Eve Kahn for a piece she was writing for The NewYork Times about what she calls “Cartifacts” which are a subset of Maps in the Wild. Mappery gets a very nice write up of course and I recommend the whole piece to my map loving friends.
MapsintheWild Mappery Featured in The New York Times
-
sur Mappery: Archer Field
Publié: 10 March 2024, 11:00am CET

Marianne Pietersen sent us these pics from her visit to Archer Field.
“Last year I went to a lecture at Archer Field, Brisbane, about the history of the Dutch military camp there,
during WW2. In a side room of the airport building was a small amount of photos from those days, including the attached 3 maps of the Field. The exhibition is permanent (for now at least.) ?”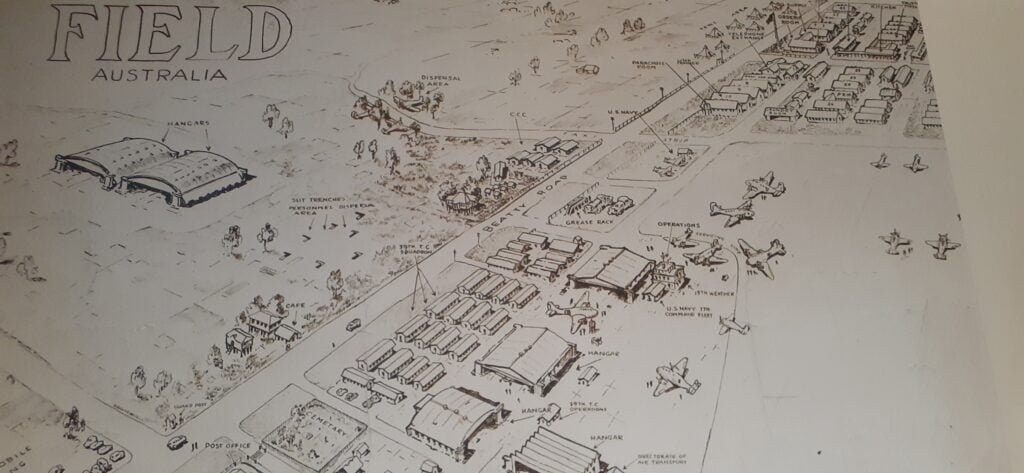
Today the spelling has been concatenated to Archerfield but the title pane of the map makes clear that in the past it was Archer Field.

More info on the history of Archer Field airport
MapsintheWild Archer Field
-
sur Mappery: Switzerland in 3D Magnificence
Publié: 9 March 2024, 11:00am CET

This stunning relief map was sent to us by Scott Simmons who spotted it at the Swiss National Museum in Zurich.
MapsintheWild Switzerland in 3D Magnificence
-
sur Fernando Quadro: Você conhece o MobilityDB?
Publié: 8 March 2024, 1:00pm CET
Dispositivos de rastreamento de localização, como GPS, são hoje amplamente utilizados em smartphones e veículos. Como resultado, os dados de trajetória geoespacial estão atualmente sendo coletados e usados ??em muitos domínios de aplicação. O MobilityDB fornece o suporte de banco de dados necessário para armazenar e consultar esses dados de trajetória geoespacial.
MobilityDB é implementado como uma extensão do PostgreSQL e PostGIS. Ele implementa tipos de banco de dados persistentes e operações de consultas para gerenciar trajetórias geoespaciais e suas propriedades que variam no tempo.
Uma trajetória geoespacial é geralmente coletada como uma sequência de pontos de localização e informações de data e hora. Na realidade, porém, o movimento é contínuo. Portanto, o MobilityDB interpola a trilha de movimento entre as informações de entrada. Como tal, a localização e as propriedades do objeto em movimento podem ser consultadas, efetivamente aproximadas, a qualquer momento.
Embora esta interpolação restaure a continuidade do movimento, ela não corresponde a um aumento no tamanho do armazenamento. Pelo contrário, permite descobrir informações redundantes e removê-las. Assim, apenas as informações onde ocorre uma mudança significativa na velocidade/direção são retidas. Esse processo é chamado de normalização e geralmente resulta em uma redução significativa no tamanho do armazenamento em comparação com os pontos de entrada.
Mas na prática, como funciona esse gerenciamento realizado pela extensão?Pense em obter a velocidade média de um trem em movimento, sem nenhum código SQL longo, usando uma função e pronto.
Ou em armazenar dados GPS de forma muito compacta em uma única linha/coluna e ser capaz de fazer consultas complexas com muito pouco SQL.É essa praticidade que o MobilityDB vai te proporcionar.
Você já tinha ouvido falar dessa extensão do PostgreSQL/PostGIS? Conte nos comentários
-
sur Mappery: Mosaic map of Delft
Publié: 8 March 2024, 11:00am CET
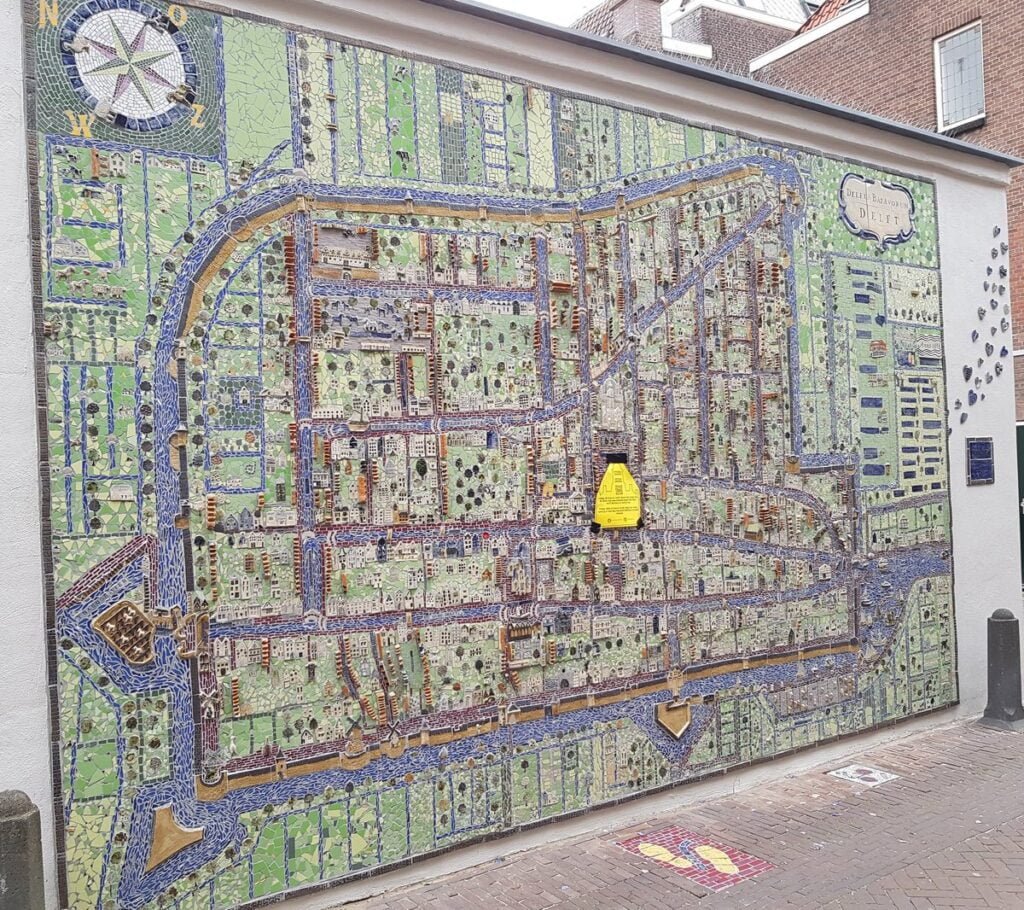
Impressive mosiac map of Delft, posted by Hans van der Kwast @hansakwast@fosstodon.org
MapsintheWild Mosaic map of Delft
-
sur GeoServer Team: How to Publish a GeoTIFF file in GeoServer
Publié: 8 March 2024, 1:00am CET
GeoSpatial Techno is a startup focused on geospatial information that is providing e-learning courses to enhance the knowledge of geospatial information users, students, and other startups. The main approach of this startup is providing quality, valid specialized training in the field of geospatial information.
( YouTube | LinkedIn | Facebook | Reddit | X )
Publishing a GeoTIFF file in GeoServerIn this session, we want to talk about “How to Publish a GeoTIFF file in GeoServer” comprehensively. If you want to access the complete tutorial, simply click on the link.
Introduction
The GeoTIFF is a widely used geospatial raster data format, it is composed of a single file containing both the data and the georeferencing information. By default, GeoTIFF will be an option in the Raster Data Sources list when creating a new data store.
Note. In this blog post, we used GeoServer version 2.20.0.
Add a GeoTIFF dataTo add a GeoTIFF data in GeoServer, follow these steps:
- Navigate to Data > Stores page, then click on the Add new Store link.
- Select the desired workspace from the drop-down menu.
- Enter the Data Source Name, make sure the Enabled option is checked. If checked, it enables the store. If unchecked (disabled), no data in the GeoTIFF will be served from GeoServer.
- In the URL under the Connection Parameters, browse to the location of the GeoTIFF file then press the Save button.
- Now you will be redirected to the New Layer page automatically and to add a layer for an available resource click on the Publish link.
- Check the Name, Coordinate Reference Systems and the Bounding Boxes fields are properly set and press the Save button.
In Geoserver, a layer group serves as a convenient container for organizing layers and other layer groups in a structured hierarchy. By assigning a single layer to a layer group in WMS requests, the process of making requests is simplified as instead of specifying multiple individual layers, only one layer needs to be indicated. Furthermore, a layer group establishes a set order for the layers within it and enables the specification of alternative styles for the layers, distinct from their default settings.
Add a Layer Group-
To create a Layer Groups, navigate to Data > Stores page. Click on Add a new layer group link. The initial fields allow you to configure the name, title, abstract and workspace of the layer group. Enter the
Data Source NameandTitle. -
The Enabled checkbox, if disabled, will cause the layer group to just show up at configuration time, while the Advertised checkbox, if unchecked, will make it to not be available in GetCapabilities request and in the layer preview. The behaviour of layer group regarding both checkboxes will not affect the behaviour of any of the layers being grouped, which will follow respectively that specified in the corresponding edit page.
Note. In the layer group section, Workspace selection is optional.
-
The Bound section contain the data BoundingBox of this layer group in the native coordinate reference system. The input can be done manually or automatically with the help of Generate Bounds.
Note. By default, a layer group is queryable when at least a child layer is queryable. Uncheck Queryable box if you want to explicitly indicate that it is not queryable independently of how the child layers are configured.
-
To add more layers to the Layer Group list, you can press the Add Layer… button at the top of the table. From the popup window, select the layer to be added by clicking the layer name.
-
A layer group can be added by pressing the Add Layer Group… button at the top of the table. From the list of layer groups, select the appropriate layer group’s name.
-
A style group is a style that has one or more Named Layers which reference layers that exist in the catalog. Style groups can be added to Layer Groups as an alternative way of defining a collection of styled layers. To add it, press the Add Style Group… button at the top of the table and from the popup window, select the style group to be added by clicking its name.
-
Press the generate bounds button to have geoserver compute the group bounds from the layers inside of it.
Note. A layer group can contain layers with dissimilar bounds and projections. GeoServer automatically reprojects all layers to the projection of the layer group.
-
When a layer group is processed, the layers are rendered in the order provided, so the publishable elements at the bottom of list will be rendered last and will show on top of the others. A publishable element can be positioned higher or lower on this list by pressing the green up or down arrows, respectively, or can be simply dragged in the target position.
-
Metadata links allows linking to external documents that describe the data of layer group. Keywords make possible to associate a layer group with some keywords that will be used to assist catalog searching.
-
Press Save button to create the new layer group.
So in order to preview the created layer, navigate to the Data > Layer Preview page and enter the name of your layer group in the search box, then press Enter button. Click on the OpenLayers link for a given layer and the view will display. An OpenLayers map loads in a new page and displays the group layer with the default styles. You can use the Preview Map to zoom and pan around the dataset, as well as display the attributes of features by click on each feature.
Using WMS layers in QGISTo display a WMS layer in QGIS software, follow these steps:
- Open GQIS and navigate to Layer > Add Layer > Add WMS/WMTS Layer.
- To create a new service connection, from the Layers tab, press New button.
- Name your connection from the Connection Details. Next, from the
URLtextbox, you need to access a WMS layer as HTTP address of Web Map Server. In this case, name the connection asMy Projectand the URL ashttp://localhost:8080/geoserver/project/wmsand press OK. Note that the “project” refers to the workspace defined in Geoserver. - Press the Connect button to fetch the list of layers available, then press Add button and Close.
- Now, you will see the layer loaded in the QGIS canvas. You can zoom/pan around just like any other layer. The way WMS service works is that every time you zoom/pan, it sends your viewport coordinates to the server and the server creates an image for that viewport and return it to the client. So there will be some delay before you see the image for the area after you have zoomed in. Also, since the data you see is an image, there is no way to query for attributes like in a regular vector/imagery layer.
-
sur Camptocamp: OSGeo - OGC - ASF Code Sprint in Évora, Portugal
Publié: 8 March 2024, 1:00am CET
Pièce jointe: [télécharger]
This unique gathering brought together key players in the field, including Camptocamp, a prominent contributor to the OsGeo community and a leading player in the steering committees of many of the association's projects. -
sur Fernando Quadro: Comparando GeoNode e ArcGIS Online: Qual é o certo para você?
Publié: 7 March 2024, 1:00pm CET
GeoNode e ArcGIS Online são plataformas de software GIS (Geographic Information System) que permitem a criação e o compartilhamento de mapas e aplicativos web. No entanto, existem diferenças importantes entre as duas plataformas que podem influenciar na escolha da solução mais adequada para suas necessidades. Este artigo tem como objetivo fornecer uma comparação entre essas plataformas, com foco em recursos, funcionalidades e sua adequação para instituições governamentais, empresariais e acadêmicas.
FuncionalidadesO Geonode é uma plataforma open-source com foco na catalogação, visualização e compartilhamento de dados geoespaciais, que apresenta facilidade de uso, gerenciamento e integração com diversas ferramentas e serviços web OGC (Open Geospatial Consortium).
O ArcGIS Online é uma plataforma robusta para criação de mapas e aplicativos WebGIS que possui uma ampla gama de funcionalidades para análise espacial, geoprocessamento e gerenciamento de dados, além da integração com outras plataformas ArcGIS e ferramentas da Esri.
Curva de aprendizadoO Geonode possui uma interface amigável e intuitiva, facilitando o aprendizado para iniciantes por meio de uma documentação completa e uma comunidade ativa que oferece suporte e ajuda aos usuários. Além disso, o Geonode possui uma curva de aprendizado mais suave para usuários com pouca ou nenhuma experiência em GIS.
O ArcGIS Online é uma plataforma mais complexa, com uma curva de aprendizado mais acentuada, o que requer conhecimentos técnicos em GIS para configuração, administração e desenvolvimento de aplicações. Essa plataforma possui documentação extensa e abrangente, com diversos recursos de aprendizado.
DocumentaçãoA documentação do Geonode é recomendada para usuários iniciantes em GIS que buscam uma documentação mais simples e direta e para usuários que desejam configurar e usar a plataforma rapidamente.
O ArcGIS Online é recomendado para usuários experientes em GIS que buscam uma documentação completa e abrangente e para usuários que desejam explorar todos os recursos da plataforma.
Taxas de licenciamento e custos de assinaturaGeoNode: Sendo de código aberto, o GeoNode é totalmente gratuito para baixar, usar e modificar. Não há taxas de licenciamento ou custos de assinatura associados ao uso da plataforma.
ArcGIS Online: O ArcGIS Online exige uma taxa de licenciamento, que pode ser substancial, especialmente para organizações maiores ou com necessidades complexas de GIS. Além disso, poderão ser incorridos custos contínuos de assinatura para acesso a atualizações e suporte.
Personalização e DesenvolvimentoO GeoNode: A natureza de código aberto do GeoNode permite ampla personalização e desenvolvimento. As organizações podem adaptar a plataforma às suas necessidades específicas sem incorrer em custos adicionais com ferramentas de desenvolvimento proprietárias.
ArcGIS Online: A personalização no ArcGIS Online pode exigir o uso de ferramentas e APIs proprietárias, potencialmente levando a taxas de licenciamento ou custos de desenvolvimento
adicionais. Escalabilidade e flexibilidadeGeoNode: A escalabilidade do GeoNode não está vinculada a níveis de licenciamento ou níveis de assinatura. As organizações podem dimensionar a implantação do GeoNode conforme necessário, sem incorrer em custos adicionais de licenciamento.
ArcGIS Online: O dimensionamento do ArcGIS Online pode exigir a compra de licenças adicionais ou níveis de assinatura, o que pode se tornar caro à medida que as necessidades de GIS de uma organização aumentam.
Mas enfim, quando devo usar cada uma das ferramentas?Use o GeoNode se fizer parte de uma pequena, média ou grande organização com necessidades essenciais de mapeamento e compartilhamento de dados geoespaciais e que, além disso, busque uma solução open-source, fácil de usar e sem custos de licenças.
Use o ArcGIS Online se fizer parte de uma grande organização com recursos que possua necessidades complexas de GIS e que busquem uma plataforma robusta e com ampla gama de funcionalidades para usuários que já estão familiarizados com outras plataformas ArcGIS e ferramentas da Esri.
Ficou interessado? -
sur Fernando Quadro: Os 5 benefícios da Infraestrutura de Dados Espaciais
Publié: 6 March 2024, 1:00pm CET
A Infraestrutura de Dados Espaciais (IDE) é uma ferramenta essencial no Geoprocessamento, oferecendo uma série de benefícios. Com a utilização da IDE, é possível organizar, armazenar e compartilhar dados espaciais de forma eficiente, facilitando o acesso e a análise dessas informações.
Princípios como a padronização e a interoperabilidade são fundamentais para o bom funcionamento da IDE, garantindo a qualidade e a integridade dos dados. Além disso, fatores históricos, como o avanço da tecnologia e a democratização do acesso à informação, contribuíram para o desenvolvimento e a popularização da Infraestrutura de Dados Espaciais.
Os benefícios: Melhor organização e gestão dos dados
Maior eficiência na análise espacial
Facilidade no compartilhamento de informações
Melhor tomada de decisões
Estímulo à inovação e desenvolvimento tecnológicoAs aplicações da IDE são diversas, abrangendo áreas como planejamento urbano, gestão ambiental, agricultura, transporte e muitas outras. Através da utilização de mapas e análises espaciais, é possível obter informações valiosas para a tomada de decisões, contribuindo para o desenvolvimento sustentável e a melhoria da qualidade de vida.
E onde o GeoNode se encaixa nisso?O GeoNode é uma plataforma para gestão e publicação de dados geoespaciais que reúne projetos open source maduros e estáveis sob uma interface consistente e fácil de usar. Com ele você consegue implantar sua IDE de forma fácil e prática.
Quer saber mais?O Curso é oferecido na modalidade EAD Ao Vivo, com uma carga horária de 18 horas divididas em 6 encontros. Porém, essas aulas são gravadas e ficam disponíveis ao aluno por 12 meses em nosso portal do aluno.
Então, se por acaso você não puder comparecer em alguma das aulas ao vivo, não se preocupe, você poderá rever a aula gravada a qualquer momento.
Em comemoração ao aniversário de 12 anos da Geocursos, estamos disponibilizando pra você R$ 100 de desconto, basta utilizar o cupom GEOCURSOS12ANOS
Ficou interessado? -
sur OPENGIS.ch: INTERLIS Crashkurs Webinar
Publié: 6 March 2024, 8:19am CET
Der Crashkurs dauert 2.5 Stunden via Google Meet (kein Google Konto erforderlich) und kostet 90 CHF pro Person.
BeschreibungZiel dieses Crashkurses ist es, “blutigen Anfänger:innen” INTERLIS näher zu bringen. Nach dem Crashkurs werden sie wissen, was INTERLIS ist, wie es angewendet wird und wie ein Modell gelesen wird und man sich darin zurechtfindet. Weiter werden sie fähig sein, ein einfaches Beispielmodell selbst zu modellieren.
VorkenntnisseKeine.
SoftwareKeine. Das Webinar ist primär frontal und es muss keine Software vorinstalliert werden.
Um gleich ein bisschen mitzumachen, können aber optional folgende Tools installiert werden, im Idealfall auf einem separaten Bildschirm:
- Aktuelle QGIS LTR Version für Windows, macOS oder Linux https://download.qgis.org.
- VS Code Texteditor
-
sur Adam Steer: Image transects for ecological assessment
Publié: 6 March 2024, 4:38am CET
Sometimes we don’t need to create full blown orthophotos and 3D models to understand things. Just seeing an image in a location context is enough. With this in mind, I was recenly tasked by Taungurung Land and Waters Council to collect a set of baseline images along preset transects for ecological assessment. The transects were… Read More »Image transects for ecological assessment -
sur GeoSolutions: GeoSolutions at CalGIS in Visalia, California – March 18-20, 2024
Publié: 5 March 2024, 5:29pm CET
You must be logged into the site to view this content.
-
sur Fernando Quadro: O que é um WebGIS
Publié: 5 March 2024, 1:00pm CET
WebGIS é uma tecnologia usada para exibir e analisar dados espaciais na Internet. Ele combina as vantagens da Internet e do GIS oferecendo um novo meio de acessar informações espaciais sem a necessidade de você possuir ou instalar um software GIS.
A necessidade de divulgação de dados geoespaciais têm estimulado cada vez mais o uso de ferramentas WebGIS para apresentações interativas de mapas e de informações relacionadas por meio da internet.
As soluções adotadas na apresentação destes mapas devem apresentar um equilíbrio entre facilidade de uso, riqueza de recursos para visualização e navegação entre os dados, e funcionalidades geoespaciais para pós-processamento, características que devem ser adequadas para cada perfil de usuário que acessará o WebGIS.
-
sur gvSIG Team: Coordinación CArtográfica en el Sistema de Administración del Territorio (CCASAT)
Publié: 5 March 2024, 9:47am CET

Compartimos información sobre CCASAT un grupo de trabajo de expertos en administración del territorio del cual la Asociación gvSIG formamos parte.
Coordinación CArtográfica en el Sistema de Administración del Territorio (CCASAT) es un grupo con sede en la Universitat Politécnica de València, España; en el Departamento de Ingeniería Cartográfica, Geodesia y Fotogrametría (DICGF) y en la Escuela Técnica Superior de Ingeniería Geodésica, Cartográfica y Topográfica (ETSIGCT), cuyos objetivos principales son:
Apoyo, colaboración e investigación en todos aquellos ámbitos relacionados con la información cartográfica que permita una administración efectiva del territorio (como la información catastral, y/o la información registral, o similar), y fundamentalmente en aspectos que sirvan de apoyo para conseguir seguridad en la tenencia de la tierra, y valoración con efecto administrativo. Fomentando la difusión, transferencia de conocimientos, investigación, coordinación, consultoría y optimización de recursos.
CCASAT está enfocado principalmente a España y Latinoamérica, siendo el idioma principal el español.
-
sur GeoTools Team: GeoTools 31-RC Release Candidate
Publié: 4 March 2024, 1:00pm CET
The GeoTools team is pleased share a release candidate GeoTools 31-RC: geotools-31-RC-bin.zip geotools-31-RC-doc.zip geotools-31-RC-userguide.zip geotools-31-RC-project.zip This release candidate is also available from the OSGeo Maven Repository and is made in conjunction with GeoServer 2.25-RC. The release was made by Jody Garnett (GeoCat).Testing -
sur Stefano Costa: ènostra e la transizione energetica dal basso a Savona
Publié: 4 March 2024, 10:47am CET
Venerdì 1 marzo ero a Savona per parlare di transizione energetica dal basso alla Società di Mutuo Soccorso Fornaci, insieme al gruppo territoriale di ènostra. Ci avevano invitati il comitato No rigassificatore e il comitato Fermiamo il mostro per una serata insieme a due associazioni genovesi con cui collaboriamo spesso, Cittadini sostenibili e CER Sole.
Savona e Vado Ligure non assistono passivamente alle scelte assurde dei politici regionali e locali di accogliere un rigassificatore che inquina il mare, deturpa il territorio con tutto il gasdotto necessario a terra, contribuisce a inquinare l’aria rimanendo ancorati alle fonti fossili e arricchendo le grandi multinazionali. C’è stato un risveglio che ha portato a una lunga catena umana lungo la costa, tante mobilitazioni e molti resistono all’idea di avere dei benefici “compensativi”.
La serata è stata lunga e la partecipazione grande, nonostante la pioggia. Si è parlato dei danni che derivano dalle fonti fossili per il clima e per la salute, delle false notizie sulle rinnovabili, delle comunità energetiche. E io ho presentato le attività di ènostra. Ero piuttosto stanco ma con l’aiuto degli altri soci del gruppo territoriale ho spiegato cosa fa la cooperativa, che principi la guidano e l’importanza della partecipazione alle scelte energetiche al di là del cambio di fornitura. Non tutta l’energia rinnovabile è uguale e quella fatta dal basso, attenta agli impatti sociali e ambientali è quella che preferiamo.
L’accoglienza del comitato è stata molto generosa e sono contento che sia nato questo legame.
Cos’è una cooperativa energetica e cosa fa in concreto (video Youtube)


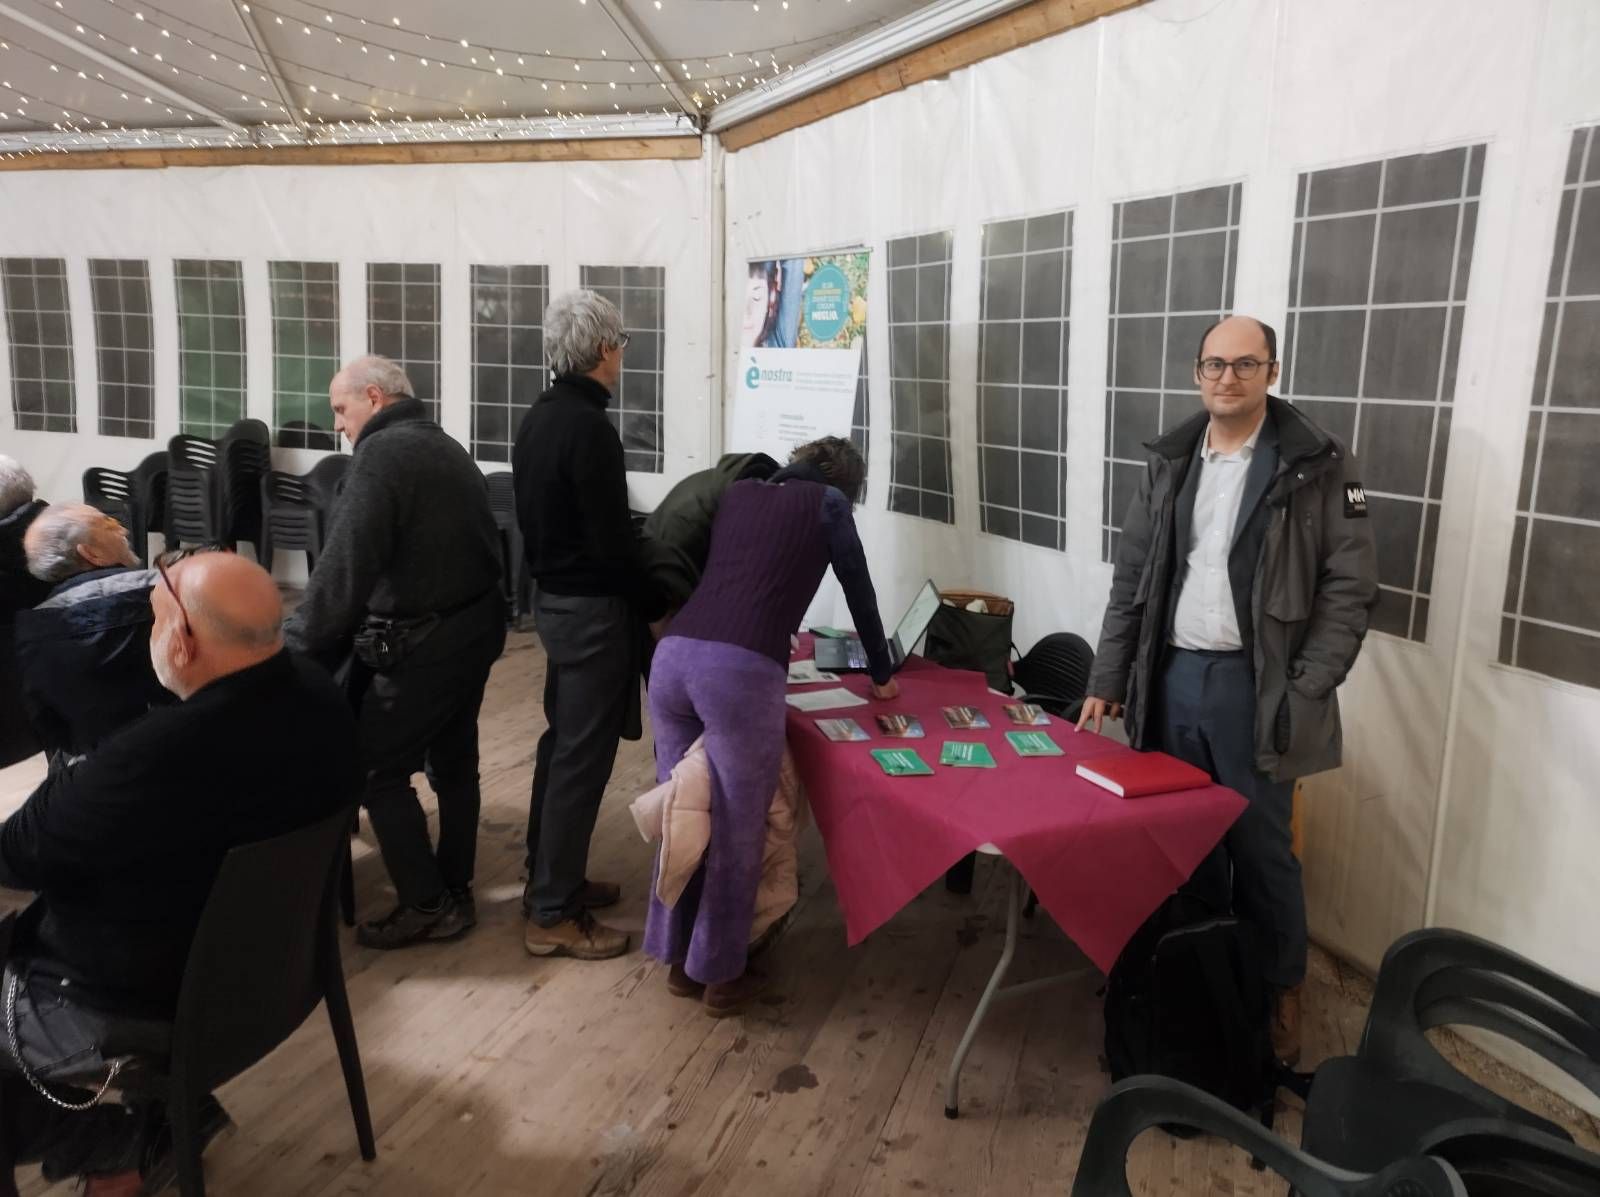
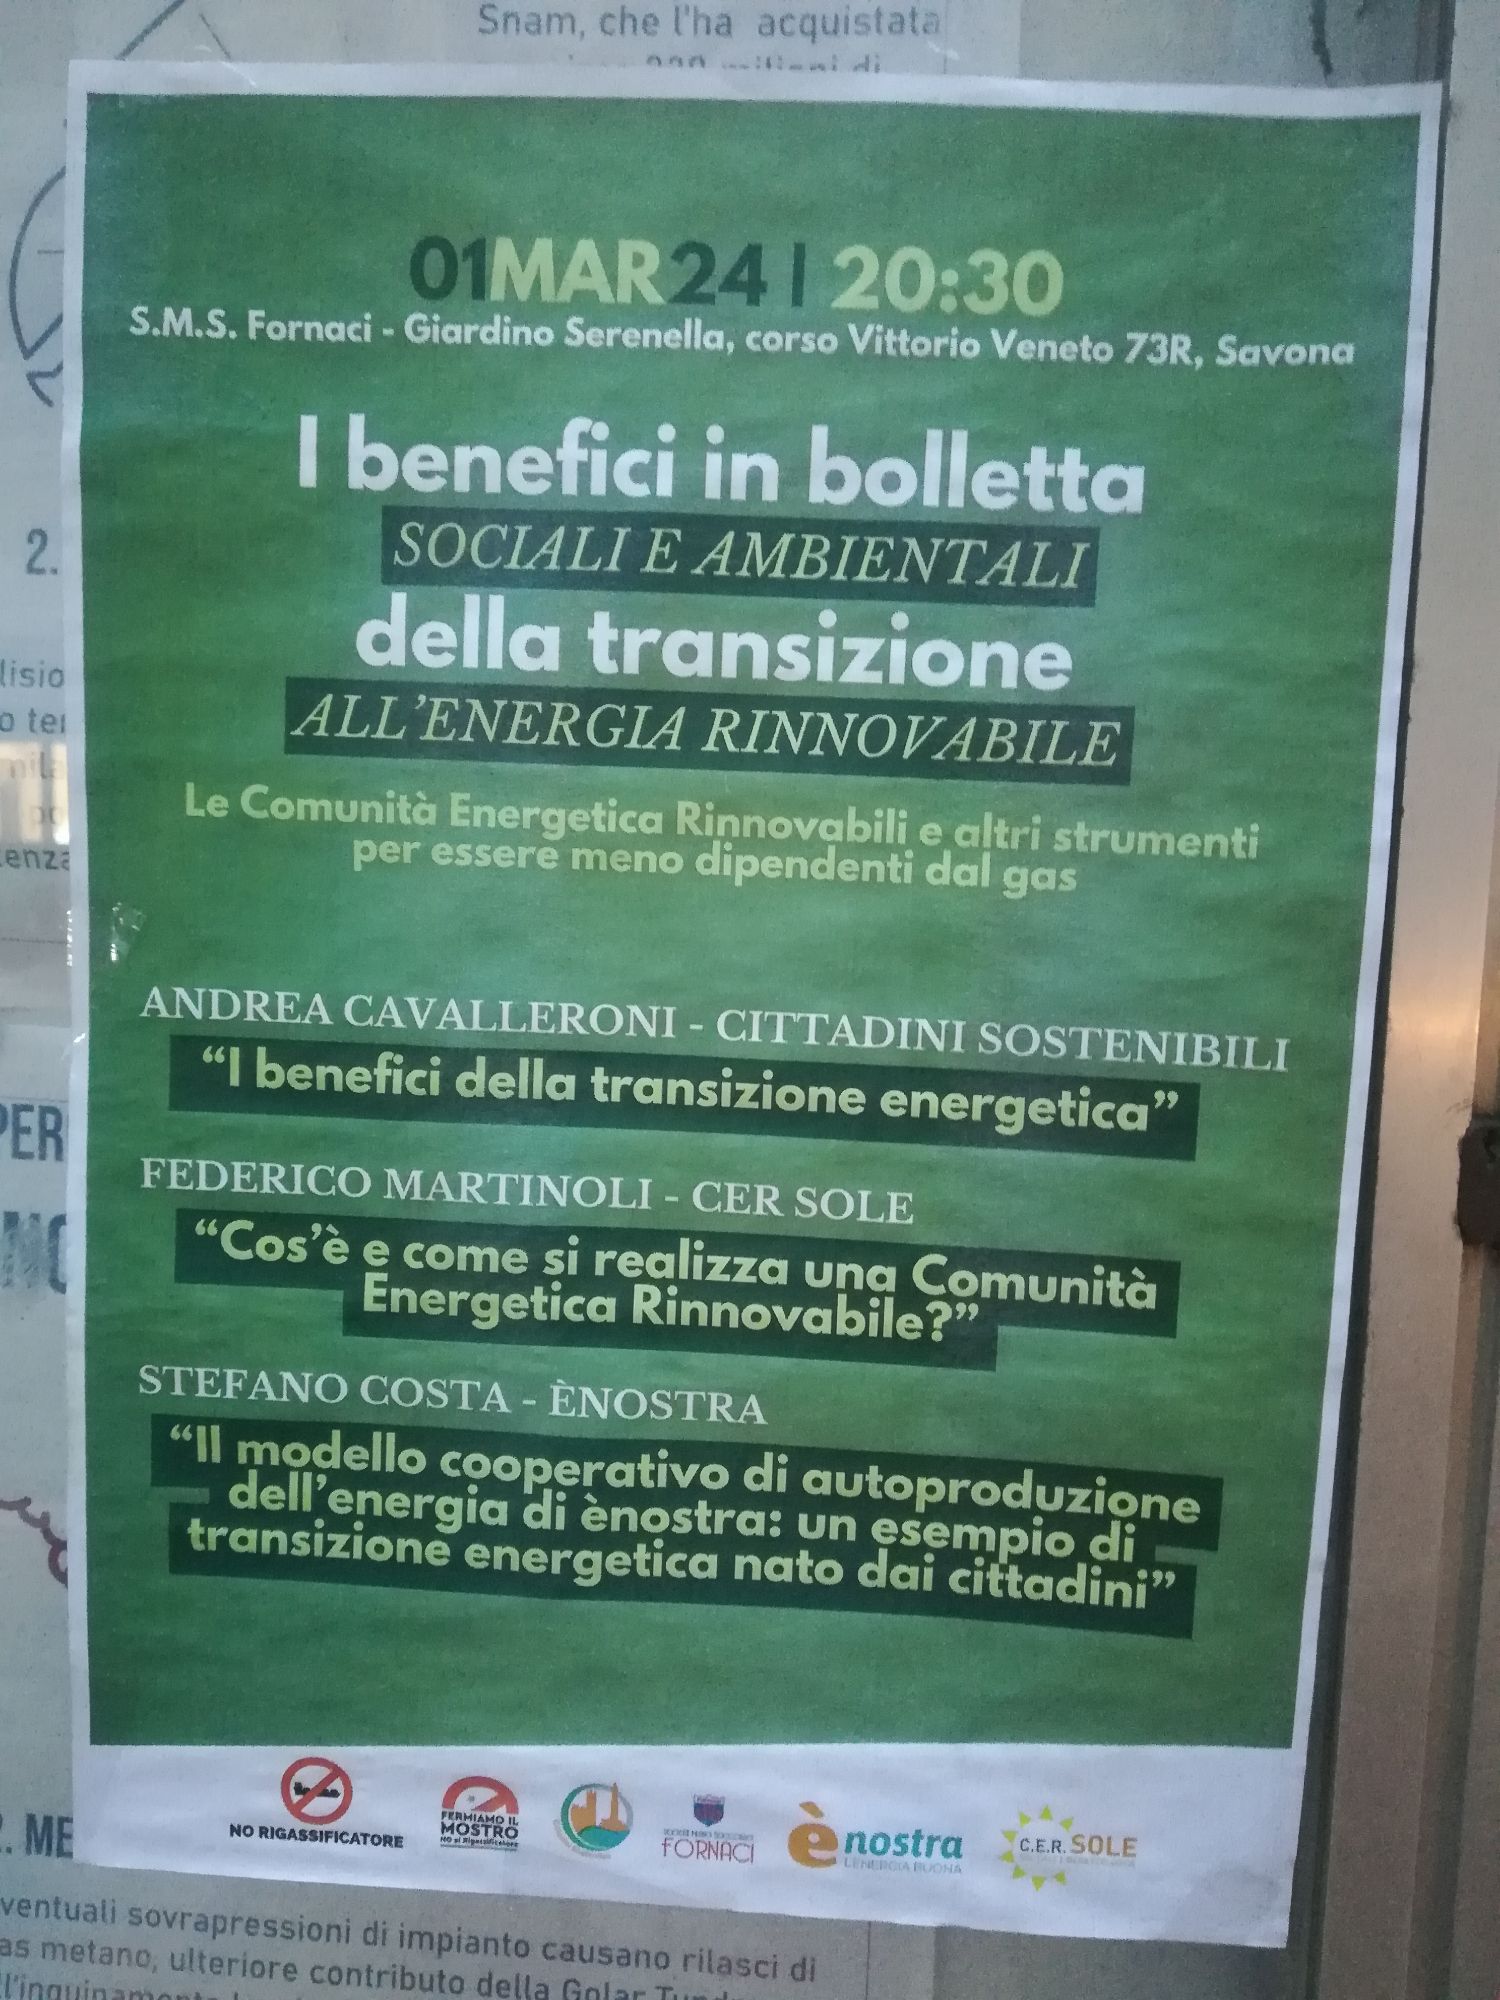
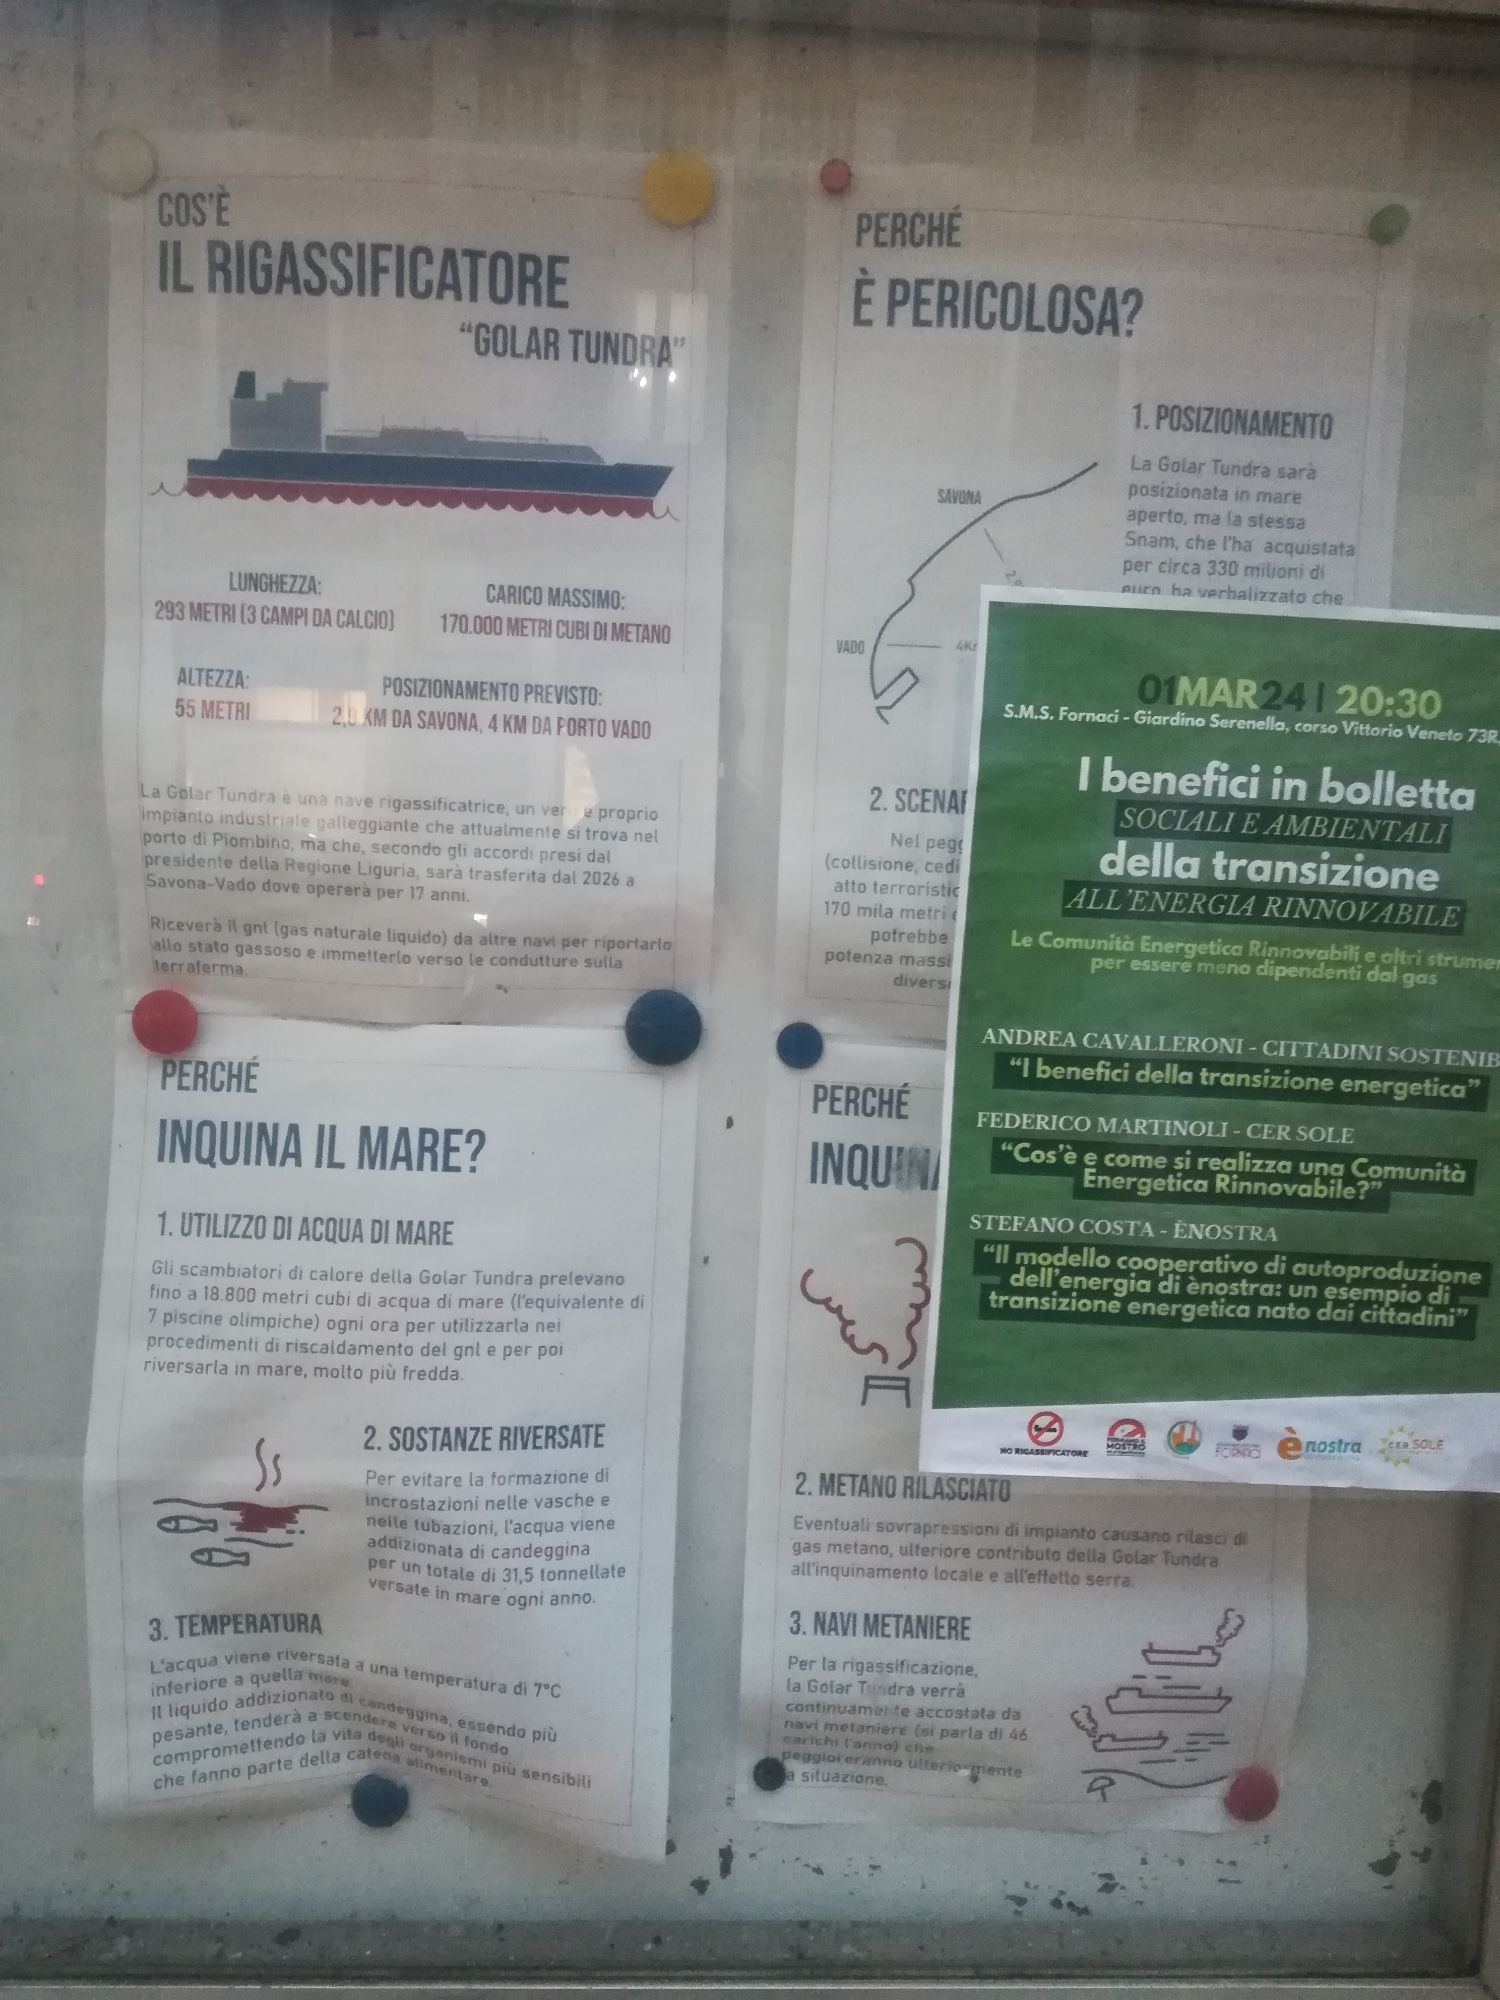
-
sur GeoServer Team: GeoServer 2.25-RC Release
Publié: 4 March 2024, 1:00am CET
GeoServer 2.25-RC release is now available with downloads (bin, war, windows), along with docs and extensions.
This is a release candidate intended for public review and feedback. GeoServer 2.25-RC is made in conjunction with GeoTools 31-RC, and GeoWebCache 1.25-RC.
Thanks to Jody Garnett (GeoCat) for making this release.
Why share a release candidate?A sensible question to ask is why a “release candidate” is being produced at all - when we do not recommend running such a thing in production.
GeoServer also follows a “release early, release often” approach which is where the project shares releases so you can test and provide feedback.
This results in a lovely balance:
-
The GeoServer developer has already tested on the data and data sources they got handy.
-
The users of GeoServer have access to a much greater variety in data and and use cases to test with.
Please try out this release candidate and let us know how it works for you.
-
Bonus: By testing with your data directory you are assured that the next GeoServer will work well for you and your team.
This balance of a community sharing and each doing what they can they can do easily, is a nice thing about the open-source approach: the result is software we can trust and works well.
Thank you for being part of the GeoServer community. Testing and feedback is welcome by email and bug reports.
Upgrade NotesWe have a number of configuration changes when updating an existing system:
-
The longstanding
ENTITY_RESOLUTION_ALLOWLISTsetting has been recommended as a way to control the locations available for external entity resolution when parsing XML documents and requests.The default has changed from
*(allowing any location) to allowing the recommendedwww.w3.org,schemas.opengis.net,www.opengis.netlocations used for OGC Web Services, along with theinspire.ec.europa.eu/schemaslocation used by our friends in Europe. -
The FreeMarker Template HTML Auto-escaping is now enabled by default.
-
The spring security firewall is now enabled by default.
-
A new configuration setting is available to limit content served from the
geoserver/wwwfolder.If you have not met the
wwwfolder before it is used to share content, and there is a tutorial serving static files. -
We do add recommendations to production considerations over time, if you have not checked that page in a while please review.
Thanks to Steve Ikeoka and Jody Garnett for these improvements.
Security ConsiderationsThis a reminder to update to GeoServer 2.24.2 Release (or GeoServer 2.35.5 Release).
Alongside the upcoming GeoServer 2.25.0 release we will “publicly disclose” a list of Common Vulnerabilities and Exposures that have been addressed previously.
- If you are working with a commercial support provider that volunteers with the geoserver-security email list they are already informed.
- If you have updated to GeoServer 2.24.2 Release (or GeoServer 2.23.5 Release) you are already patched.
I hope you enjoy our team’s effort to improve communication. The use of the CVE system allows us to reach a wider audience than reads these blog posts.
See the project security policy for more information on how security vulnerabilities are managed.
Experimental Java 21 supportGeoServer, along with GeoTools and GeoWebCache, are now tested to build and pass tests with Java 21.
This is not yet an endorsement to run GeoServer in production with Java 21. We are looking ahead at the 2024 roadmap, and are making sure the basics are covered for the newer Java releases.
JTS fast polygon intersection enabled by defaultThe JTS Next Generation polygon intersection algorithm has been enabled by default, which will improve performance of a number of operations, including WPS processes and the vector tiles generation. We deem the functionality well tested enough that it should be opened to the majority of users, even if it’s still possible to turn it off by adding the
-Djts.overlay=old.
MapML ExtensionThe MapML extension is receiving a number of updates and improvements, with more to come in the following months. It’s now possible to declare “Tiled CRS” as the CRS for a layer, with the implication not just of the CRS, but also of the gridset that will be used by the MapML viewer:
This portion builds on top of the work done months ago to support astronomical CRSs, which allows GeoServer to support multiple CRS authorities.
The MapML preview links are now using the new MapML output format, while the old dedicated REST controller has been removed. This allows for better integration of the MapML format in the GeoServer ecosystem. The MapML viewer has also been updated to the latest version:
Thanks to Joseph Miller and Andrea Aime (GeoSolutions) for this work, and Natural Resources Canada for sponsoring it.
Community Module UpdatesMuch of the new activity in GeoServer starts as a community module. We’d like to remind you that these modules are not yet supported, and invite you to join the effort by participating in their development, as well as testing them and providing feedback.
Raster attribute Table community moduleDeveloped as part of GEOS-11175, the Raster Attribute Table community module uses the GDAL Raster Attribute Table (RAT) to provide a way to associate attribute information for individual pixel values within the raster, to create styles as well as to provide a richer GetFeatureInfo output.
For more information see the user guide.
We’d like to thank Andrea Aime (GeoSolutions) for the development and NOAA for sponsoring.
Graticules for WMS mapsThe graticules community module, developed as part of GEOS-11216, provides a datastore generating graticules for WMS maps, along with a rendering transformation that can be used to label them. The module can be used to draw a graticule in WMS maps, as well as to download them as part of WFS (or in combination with the WPS download module).
We’d like to thank Ian Turton for development and GeoSolutions for sponsoring the work.
GeoServer monitor Kafka storageThe monitoring Kafka storage module, developed as part of GEOS-11150, allows storing the requests captured by the monitoring extension into a Kafka topic.
We’d like to thank Simon Hofer for sharing his work with the community. To learn more about the module, how to install and use it, see the user-guide.
JWT HeadersThe JWT headers module has been developed as part of GEOS-11317.
The module is a new authentication filter that can read JWT Headers, as well as general JSON payloads and simple strings, to identify a user, as well as to extract their roles. The combination of Apache mod_auth_openidc with geoserver-jwt-headers-plugin provides an alternative to using the geoserver-sec-oauth2-openid-connect-plugin plugin.
We’d like to thank David Blasby (GeoCat) for this work on this module.
Full Release notesNew Feature:
- GEOS-11225 [AuthKey] AuthKey synchronize the user/group automatically
MapML:
- GEOS-10438 ENTITY_RESOLUTION_ALLOWLIST property not parsing empty setting
- GEOS-11207 Refactor MapML MVC controller as GetMap-based operation with standard parameter format
- GEOS-11221 mkdocs preflight rst fixes
- GEOS-11289 Enable Spring Security Stric [HttpFirewall] by default
- GEOS-11297 Escape WMS GetFeatureInfo HTML output by default
- GEOS-11300 Centralize access to static web files
Improvement:
- GEOS-11130 Sort parent role dropdown in Add a new role
- GEOS-11142 Add mime type mapping for yaml files
- GEOS-11148 Update response headers for the Resources REST API
- GEOS-11149 Update response headers for the Style Publisher
- GEOS-11152 Improve handling special characters in the Simple SVG Renderer
- GEOS-11153 Improve handling special characters in the WMS OpenLayers Format
- GEOS-11155 Add the X-Content-Type-Options header
- GEOS-11173 Default to using [HttpOnly] session cookies
- GEOS-11176 Add validation to file wrapper resource paths
- GEOS-11213 Improve REST external upload method unzipping
- GEOS-11222 Include Conformance Class for “Search” from OGC API - Features Part 5 proposal
- GEOS-11226 Enable JTS OverlayNG by default
- GEOS-11246 Schemaless plugin performance for WFS
- GEOS-11247 Avoid HTML annotations special status in APIBodyProcessor
- GEOS-11248 Move version header handling from APIBodyMethodProcessor to APIDispatcher
- GEOS-11260 JNDI tutorial uses outdated syntax
- GEOS-11288 Improve input validation in ClasspathPublisher
- GEOS-11289 Enable Spring Security Stric [HttpFirewall] by default
- GEOS-11298 When a Raster Attribute Table is available, expose its attributes in GetFeatureInfo
Bug:
- GEOS-11050 jdbc-store broken by changes to Paths.names
- GEOS-11051 Env parametrization does not save correctly in AuthKey extension
- GEOS-11145 The GUI “wait spinner” is not visible any longer
- GEOS-11182 Avoid legends with duplicated entries
- GEOS-11187 Configuring a raster with NaN as NODATA results in two NaN in the nodata band description
- GEOS-11190 GeoFence: align log4j2 deps
- GEOS-11203 WMS GetFeatureInfo bad WKT exception for label-geometry
- GEOS-11224 Platform independent binary doesn’t start properly with default data directory
- GEOS-11250 WFS GeoJSON encoder fails with an exception if an infinity number is used in the geometry
- GEOS-11278 metadata: only selected tab is submitted
- GEOS-11312 Used memory calculation fix on legend WMS request
Task:
- GEOS-11242 Remove the Xalan library
- GEOS-11315 Revert to CORS commented out
- GEOS-11318 Update postgresql to 42.7.2
- GEOS-11134 Feedback on download bundles: README, RUNNING, GPL html files
- GEOS-11141 production consideration for logging configuration hardening
- GEOS-11159 Update mapfish-print-lib 2.3.0
- GEOS-11180 Update ImageIO-EXT to 1.4.9
- GEOS-11181 Update jai-ext to 1.1.25
- GEOS-11186 Fix maven enforcer failFast
- GEOS-11220 Upgrade Hazelcast from 5.3.1 to 5.3.6
- GEOS-11245 Update OSHI from 6.2.2 to 6.4.10
- GEOS-11316 Update Spring version to 5.3.32
Community module development:
- GEOS-11305 Add layer information in the models backing STAC
- GEOS-11146 Fix MBTiles output format test
- GEOS-11184 ncwms module has a compile dependency on gs-web-core test jar
- GEOS-11209 Open ID Connect Proof Key of Code Exchange (PKCE)
- GEOS-11212 OIDC accessToken verification using only JWKs URI
- GEOS-11219 Upgraded mail and activation libraries for SMTP compatibility
- GEOS-11293 Improve performance of wps-lontigudinal-profile
Additional information on GeoServer 2.25 series:
Release notes: ( 2.25-RC )
-
-
sur Stefano Costa: Install iosacal with conda
Publié: 2 March 2024, 5:35pm CET
Starting today, you can install iosacal with conda. This adds to the existing installation procedure with pip. Conda is a good fit for complex projects and has better tooling for reproducibility.
Installing iosacal can be achieved by adding conda-forge to your channels with:
conda config --add channels conda-forge conda config --set channel_priority strictOnce the conda-forge channel has been enabled, iosacal can be installed with conda:
conda install iosacalor with mamba:
mamba install iosacal -
sur Fernando Quadro: Curso de GeoNode com inscrições abertas!
Publié: 1 March 2024, 8:39pm CET
Aprenda a montar a sua própria Infraestrutura de Dados Espaciais com o GeoNode, uma plataforma para gestão e publicação de dados geoespaciais que reúne projetos open-source maduros e estáveis sob uma interface consistente e fácil de usar, permitindo que os usuários, compartilhem seus dados de forma rápida e facil.
Este novo curso visa capacitar os profissionais no uso eficiente da plataforma GeoNode, e tem como objetivos:
Familiarizar os participantes com os conceitos fundamentais do Geonode e suas capacidades.
Explorar o funcionamento de servidores de mapas e seus benefícios.
Apresentar os padrões de dados do Open Geospatial Consortium (OGC), como Web Map Service (WMS) e Web Feature Service (WFS), para interoperabilidade geoespacial.
Demonstrar a publicação eficiente de dados no Geonode usando views de bancos de dados geográficos.
Ensinar a integração do Geonode com o QGIS através de plugins. Quer saber mais?O Curso é oferecido na modalidade EAD Ao Vivo, com uma carga horária de 18 horas divididos em 6 encontros. Porém, essas aulas são gravadas e ficam disponíveis ao aluno por 12 meses em nosso portal do aluno.
Então, se por acaso você não puder comparecer em alguma das aulas ao vivo, não se preocupe, você poderá rever a aula gravada a qualquer momento.
Em comemoração ao aniversário de 12 anos da Geocursos, estamos disponibilizando pra você R$ 100 de desconto, basta utilizar o cupom GEOCURSOS12ANOS
Ficou interessado? -
sur Stefano Costa: IOSACal in Google Colab
Publié: 1 March 2024, 5:27pm CET
Google Colab is a popular notebook service that you can run directly from your browser. Python is natively supported and it’s fairly easy to run a Jupyter notebook, even with custom dependencies like Numpy and Matplotlib.
You can run IOSACal in Google Colab! I have added a new short how-to guide in the official documentation. Find the how-to at [https:]] .
This takes advantage of a demo notebook that was contributed by Jelmer Wind.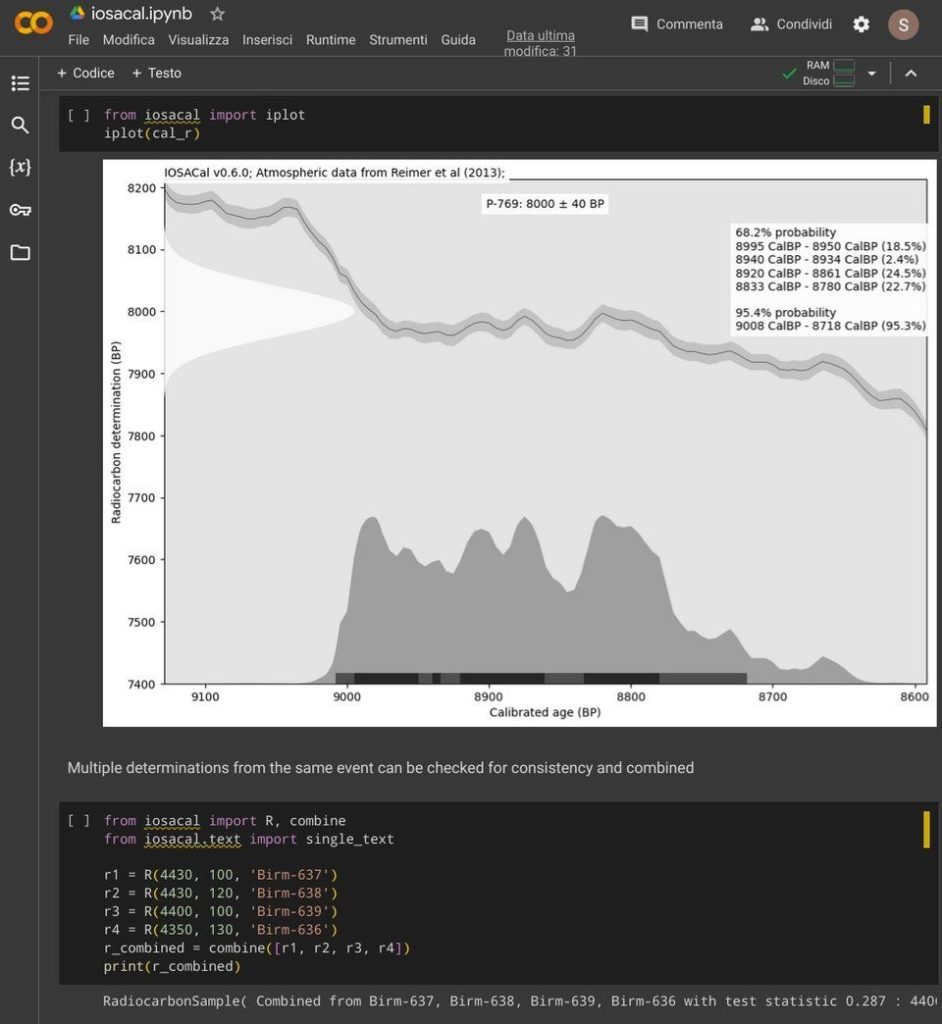 A screenshot of the demo notebook running IOSACal in Google Colab. Even with a plot!
-
sur OTB Team: OTB Release 9.0.0
Publié: 28 February 2024, 6:00pm CET
Dear OTB community, We are happy to announce that OTB version 9.0.0 has been released! Ready to use binary packages are available on the package page of the website: The Docker image is available :docker pull orfeotoolbox/otb:9.0.0 It is also possible to checkout the branch with git: git clone [https:] OTB -b release-9.0 The documentation […] -
sur Free and Open Source GIS Ramblings: Trajectools 2.0 released ?
Publié: 24 February 2024, 8:26pm CET
It’s my pleasure to share with you that Trajectools 2.0 just landed in the official QGIS Plugin Repository.
This is the first version without the “experimental” flag. If you look at the plugin release history, you will see that the previous release was from 2020. That’s quite a while ago and a lot has happened since, including the development of MovingPandas.
Let’s have a look what’s new!
The old “Trajectories from point layer”, “Add heading to points”, and “Add speed (m/s) to points” algorithms have been superseded by the new “Create trajectories” algorithm which automatically computes speeds and headings when creating the trajectory outputs.
“Day trajectories from point layer” is covered by the new “Split trajectories at time intervals” which supports splitting by hour, day, month, and year.
“Clip trajectories by extent” still exists but, additionally, we can now also “Clip trajectories by polygon layer”
There are two new event extraction algorithms to “Extract OD points” and “Extract OD points”, as well as the related “Split trajectories at stops”. Additionally, we can also “Split trajectories at observation gaps”.
Trajectory outputs, by default, come as a pair of a point layer and a line layer. Depending on your use case, you can use both or pick just one of them. By default, the line layer is styled with a gradient line that makes it easy to see the movement direction:

while the default point layer style shows the movement speed:
 How to use Trajectools
Trajectools 2.0 is powered by MovingPandas. You will need to install MovingPandas in your QGIS Python environment. I recommend installing both QGIS and MovingPandas from conda-forge:
(base) conda create -n qgis -c conda-forge python=3.9
(base) conda activate qgis
(qgis) mamba install -c conda-forge qgis movingpandas
The plugin download includes small trajectory sample datasets so you can get started immediately.
OutlookThere is still some work to do to reach feature parity with MovingPandas. Stay tuned for more trajectory algorithms, including but not limited to down-sampling, smoothing, and outlier cleaning.
I’m also reviewing other existing QGIS plugins to see how they can complement each other. If you know a plugin I should look into, please leave a note in the comments.
-
sur geomatico: Desarrollo de un gemelo digital para la gestión del agua
Publié: 23 February 2024, 2:17pm CET
La escasez de agua en la agricultura, agravada por el cambio climático, amenaza la seguridad alimentaria. Los sistemas de riego eficientes son clave para mitigar estos desafíos, optimizando el uso del agua y fortaleciendo la resiliencia agrícola.
Entre 2022 y 2023 hemos desarrollado un gemelo digital de gestión del agua en agricultura junto al IRTA (Instituto de Investigación y Tecnología Agroalimentaria). En la aplicación web se pueden monitorizar y analizar casi 300 mil parcelas simbolizadas semanalmente por 17 indicadores (unos 250 millones de registros por año) que permiten optimizar la irrigación.
-
sur QGIS España: Publicación del libro Introducción a los Sistemas de Información Geográfica con QGIS
Publié: 22 February 2024, 9:00pm CET
Publicada la Segunda Edición del Libro “Introducción a los Sistemas de Información Geográfica con QGIS” de Federico GazabaUna pregunta recurrente en redes sociales es ¿Dónde puedo encontrar un manual para aprender a usar QGIS? o ¿Cómo puedo iniciarme en el uso de los Sistemas de Información Geográfica (SIG)? Hace aproximadamente 3 años Federico Gazaba publicaba la pimera versión de su libro “Introducción a los Sistemas de Información Geográfica con QGIS” un manual que en su momento fue de referencia obligada para las personas usuarias de QGIS en habla hispana pero que con el paso del tiempo había quedado desactualizado debido a la aparición de nuevas versiones de QGIS.
Recientemente el autor nos comentaba que se estaba preparando una actualización de libro y no nos ha hecho esperar mucho, el 22 de Febrero nos anunciaba en el canal de Telegram de QGIS en español que la versión 2.0 había sido publicada: _“Hola amigos #geoinquietos !. Lo prometido es deuda, les traigo la versión 2.0 de mi libro libre “Introducción a los Sistemas de Información Geográfica con QGIS”. Esta versión actualiza los contenidos de la versión anterior a QGIS 3.34 Prizren.".
El libro ha sido publicado bajo la licencia CC BY-SA 4.0 lo que permite que sea compartido o modificado, para cualquier proposito, con libertad mientras se respete la atribución al autor y se comparta con la misma licencia. Se puede descargar aquí o aquí el repositorio del libro se puede encontrar en GitHub
Este libro es otro ejemplo que demuestra que los proyectos de software libre y open source permiten compartir y colaborar en este tipo de iniciativas donde podemos participar de forma activa y generar grandes sinergias en sus aplicaciones y desarrollos en beneficio, tanto de las comunidades que las desarrollan como las que las usan.
Federico Gazaba es profesor de Matemáticas y Técnico Maestro Mayor de Obras y actualmente es docente en el Instituto de Formación Docente y Técnica 122 “Presidente Illia” de Pergamino (Provincia de Buenos Aires, Argentina) y Director de Sistemas de Información Georreferenciada de la Municipalidad de Pergamino. Desde el año de 2013 es usuario de QGIS y es un entusiasta del las tecnologías libres y de los datos espaciales abiertos. La creación del manual nace de la necesidad de impartir cursos de QGIS a sus colegas de municipalidad y es el resultado de la sistematización de esas enseñanzas. Desde 2016, de forma ininterrumpida, imparte cursos introductorios a los SIG para diferentes instituciones.
Puedes seguir a Federico en la siguientes redes sociales:

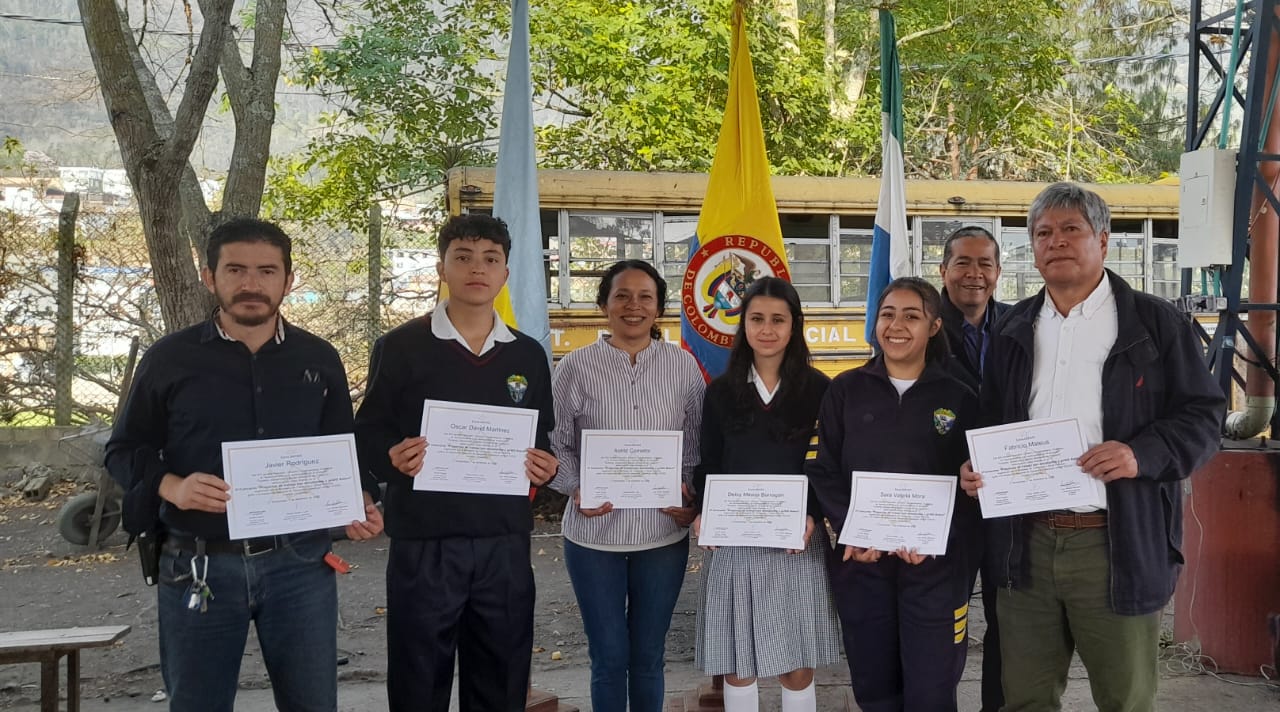
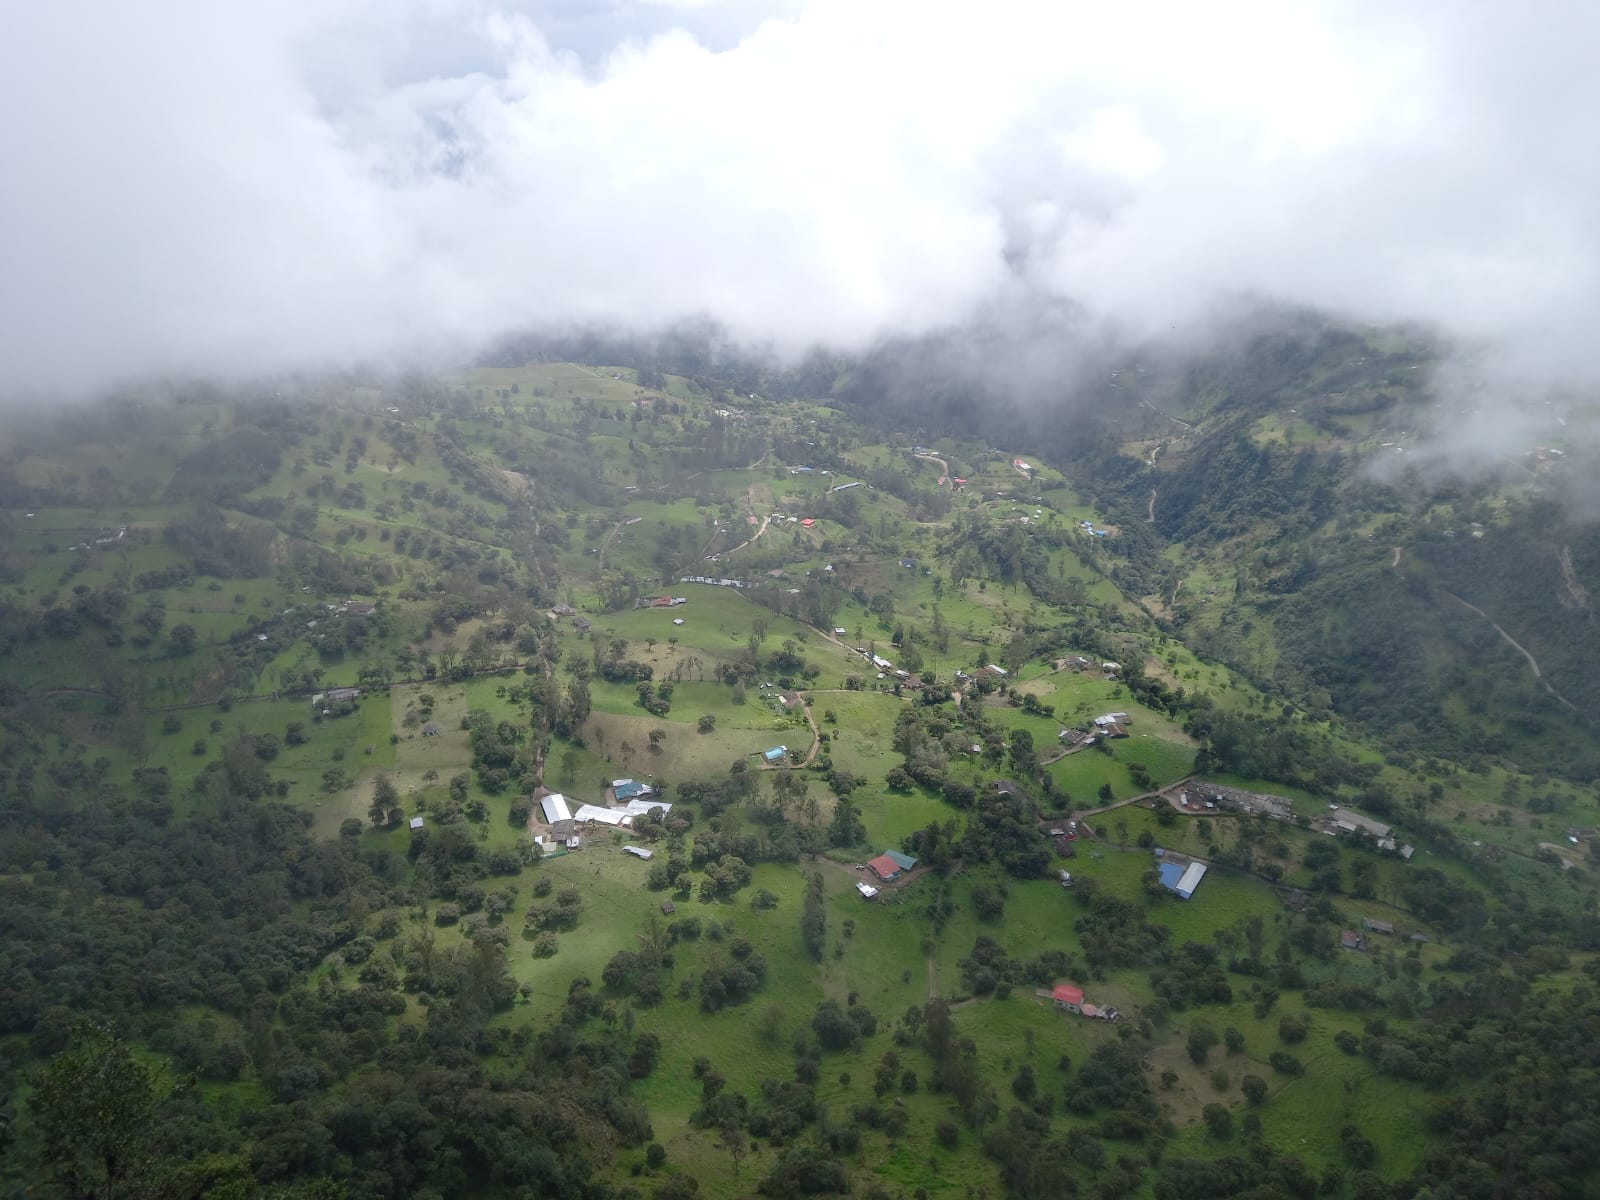
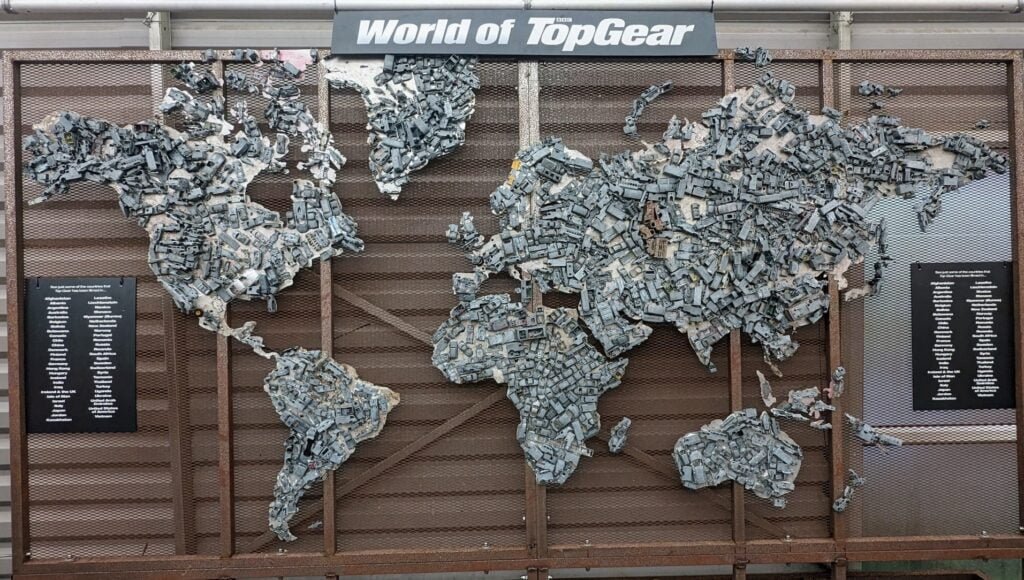
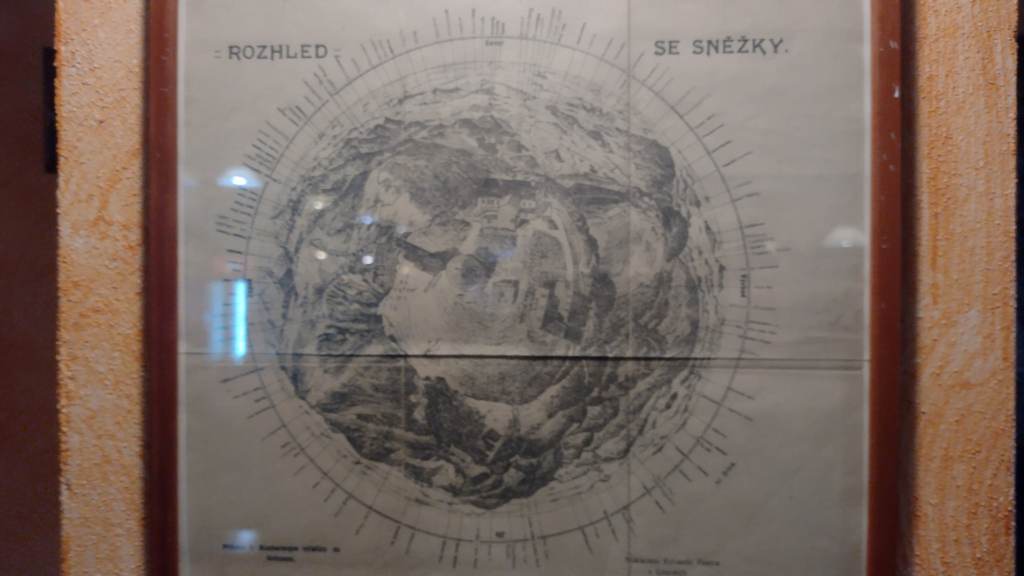


%20-%20Microsoft%20Visual%20Studio.png)
%20-%20Microsoft%20Visual%20Studio.png)
%20-%20Microsoft%20Visual%20Studio.png)
%20-%20Brave.png)


