Colors and MapInfo

    Jacques Paris

April 2002

jacques@paris-pc-gis.com


We are addressing these notes primarily to the MI users. The MB programmers can find some interesting hints and incidental remarks, but it was not our intention to write a full “programming the colors” chapter.


Table of Contents


1- How MI uses colors 

          1-1 Contexts of use

          1-2 Color codification

          1-3 Storing color information

          1-4 Limitation on the number of colors


2 - Using colors in MI

          2-1 Choosing color for an object

          2-2 MI palette of predefined colors

          2-3 Redefining colors temporarily

          2-4 Using different permanent palettes


3 - Working with existing colors

          3-1 Recycling colors

          3-2 Getting information of a color


4 - Viewing color palette and schemes

          4-1 Utilities for palette color printing

          4-2 Testing new color schemes


5 - Color auto-spread in thematic maps

6 - Color limitation and "unlimited" use


7 - Browser safe colors


8 - Color names


9 - Utilities for color management

          9-1 RGB_HSV color viewer

          9-2 RGB Editor

          9-3 "What Color"

          9-4 ColorMap


Appendix: Color Models for Mapinfo (separate html page) 


1 - How MI uses colors

1-1 Contexts of use

MapInfo uses colors in different contexts, the most obvious being as an attribute of a graphical object. One or two colors can be attached to an object depending on its type. There are two colors when a background and a foreground planes can be defined; it is the case of text objects in some circumstances (framing text in a box, using halo effect), of true type symbols in the same circumstances, and of fill patterns other than flat color (the “black” pattern design is the foreground color, the “white” interstitial spaces, the background).

 MI uses also colors for displaying maps without using the colors of the objects; colors are then attached to types of objects with the “Display Style Override” option, or to groups of objects in thematic mapping. Continuous maps, such as those produced by interpolation models (GRID maps) are special cases that color the space without reference to any object.

Finally, colors are also used in the production of graphs.

The day might also arrive (version 6.5+???) when MI will also deal with colors in the perspective of preparing documents for the printer.

back to TOC

1-2 Color codification

Whatever the circumstances in which a color is used, MI handles that attribute in the same manner as it is used by the computer to build the display, i.e. as a RGB definition (see RGB Model) expressed as a single integer code. This code is obtained from and can be converted to its basic R, G and B components (see R, G, B <> RGB). It is always under the form of that code that colors are stored as object attributes, in statements such as Shade when they are saved in a workspace WOR, or as color definitions in the Palette.

There are however two separate circumstances in which a different color model is used in the definition of objects or for mapping, when defining a color that is not in the palette (custom color requester or color requester of a style definition) or when “auto-spread” is used in a thematic definition with that option. It is the Hue, Saturation, Value or HSV model

In the first case, the user can enter the H, S, V component values instead of the R, G, B values, but as one can see when doing it, the translation is immediately done from one to the other system and MI will store the RGB code and not the equivalent HSV. (see RGB <> HSV).

In the second context, the HSV concept is simply used to calculate colors for the “cutting points” or categories, but the resulting colors will be stored as RGB codes in a shade statement or in Brush variable. (see Color auto-spread in thematic maps).

We can finally speculate on the potential use of another color model in the perspective of commercial printing. As the aim will be to create files for printing, these files must be color separated to prepare films for color transfer. Color separation is obtained by using the CMYK model but the MI user will probably see nothing more that that option as a possible output format. CMYK is a rather complex model that is generally machine controlled without any input by the user, even in some conditions partial translation is possible between models (see RGB <>

back to TOC

1-3 Storing color information

Colors are attached to objects and, in that respect, are stored independently from the palette colors offered by MI (see below details on that palette). Objects can have colors not defined in the palette and still be properly displayed. Therefore, a map prepared with a given palette can be displayed in its original colors on any MapInfo installation, whatever its color palette.

back to TOC

1-4 Limitation on the number of colors

As the colors “exist” within a table, any limit will apply to the contents of that table. If someone writes a program to generate more than 256 objects each with a different color, MapInfo will force on the extra objects colors different from the programmed ones on the basis of the “closest” color found in the set of the first 256. But this limitation is not due to the programming, it is imposed by the structure of the .MAP file itself, the file that contains all the (geo)graphic information of the objects.

The number of 256 applies to the number of colors in a table and not of differently colored objects as we wrote originally for reason of simplicity. The number of objects can indeed be well below that value, given the fact that regions can used up to 3 colors each, one for the border (by default it is always Black, counting for one color but possibly common to several objects), another for foreground and the last for background.

This constraint does not apply to the viewing of maps; a mapper can display several tables each with 256 “colors” all different as a whole without alteration of the colors as long as the computer installation allows that number. There was a time when monitors could not display more than 256 colors, and that is probably why in its early days MI adopted that limit.

Examples of color “reduction” and of working around that limitation can be found in Color limitation and unlimited use


2 - Using colors in MI

2-1 Choosing color for an object

Assigning a color to an object is done via specialized requesters that do not require handling RGB codes or component values if the user limits his choices to the palette of predefined colors that MI offers. But the user is not limited to these specific colors if he remains within the limits on the number of colors for the table he is using, because he can redefine some of the predefined colors temporarily for up to 15 new colors. He can also adopt more drastic measures and change the color palette to an entirely different one.


back to TOC

2-2 MI palette of predefined colors

MapInfo offers a set of 256 predefined colors. They are contained in the MAPINFOW.CLR file located in the same directory as the program file itself.

This number is totally independent from any hardware restriction, be it the maximum number that can be displayed at any time on the monitor, or the number of different shades a printer is able to produce. It is neither a limit to number of different shades that a map, or a mapper window, can contain.

The contents can be displayed as a color palette under two slightly different formats

1 - via Menu Options > Custom Colors
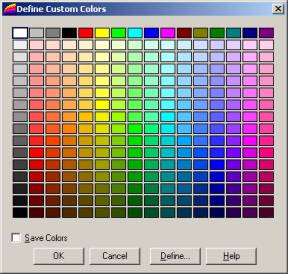
 2 - by clicking on the color bar of a style requester opened by a style button (Draw Tool bar) or a menu command (Options > ... style). The example is for Symbol.
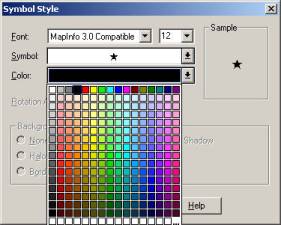
 

One can notice in this format that an additional row of 15 empty cells plus a space marked by ... at the right corner has been added at the bottom. The use of these cells are explained below.


back to TOC

2-3 Redefining colors temporarily

Redefining palette colors temporarily can be done in two different ways: with the “Options | Custom Colors” menu item that opens a requester of the first style above, or with a Style requester. The effects are different; with Custom Colors, the selected colored among the 256 original palette colors is modified and all 256 can be altered; with the Style requester a new color is added to the palette and only 15 can be added. With both, the changes are valid only for the on-going MI session, but if the option “Save colors” is ticked before closing the Custom Colors requester, the palette is permanently altered. (see Using different palettes)

No object selected

a/ open the palette of a style requester (button or menu command),

            b1/ if a color is used as a basis to modify

-          select the color that could be used as a base for the new one. The palette will close.

-          reopen the palette by clicking on the color bar

-          click on the bottom right corner cell (with the ...)

            b2/ if the color to modify is the “current” color

-          open the palette by clicking on the color bar

-          click on the bottom right corner cell (with the ...)

b3/ if no color is used as a basis

-          click on one of the empty cells, if any is empty

c/ redefine the color (RGB or HSV)

An object is selected

The layer containing the object for must be editable; the color of that object will be altered.

a/ double clicking on the object opens the “object” window, then clicking on the style button opens the requester

b/ clicking on the color bar opens the palette

c/ click on the bottom right corner cell (with the ...)

d/ redefine the color (RGB or HSV) of the selected object

In both cases, the new color is added to the bottom row in the first empty cell from the left. It will remain available through the rest of the session as any of the 256 predefined, offering the possibility to use the same "new" color for other objects. However, this bottom row of "on the fly" colors is erased when MapInfo is closed, but during one session, the colors can be "passed" between different layers or mappers without any restriction.

Changes made that way to colors apply to all types of objects, to all parts of styles. New fill color is also new pen color, new font foreground and background color. There is only one palette for all the styles.

If one redefines more than 15 colors, the next (16th) will replace the first of the bottom row, and so on in a loop.

One cannot clear an extra cell by redefining it “white”; it exists already. Generally speaking, if the redefined color exists already in the palette (the 256 original colors and the “new extras” if any), it is not considered as a new color and is not added to the bottom row.

back to TOC

2-4 Using different permanent palettes

The first question is generating different palettes. As far as I know “today”, MI does not offer another way but to go through the process of redefining colors one by one with the “Custom Colors” requester and saving the new palette.

The format of the MapInfoW.clr is a simple list of the colors R,G,B components. I have written a prototype program Make_Pal.mbx (offered initially for Beta testing -  in col_pal_mkr.zip downloadable from here) that could be of help for building new files in the CLR format.

The second question is managing the palette. There is only one CLR file possible hat can be recognized by MI and it is read in when MI is launched. One must first adopt some “proper” naming for these files.

It is important to make first of all a copy of the original file, because any change made to it will wipe out the original definitions. Make thus a copy and name it CL0 and when the changes are made and registered, make a copy of the CLR as CL1, and so on. The CL0, CL1,... will be all your different palettes, the CLR the one in use.

Then switching palettes requires closing MI, changing palette and reopening MI. With the technique I am proposing, changing palettes is done in three steps:

-          deleting mapinfow.CLR

-          making a copy of mapinfow.CL? (the palette to use)

-          renaming the copy mapinfow.CLR

I will just mention here the question of the localization of these files; I cannot offer a general solution, I just want to open the subject. Until version 6.5, the mapinfow.CLR file was located in the Windows directory or the Program directory. Starting with 6.5, that “appdata” file can be “installed in a ‘per user location’ and look for in other areas as well”. For network installations, a clear policy of where CLR files should be located must be formulated in order to define clearly the network domains affected by eventual palette changes and the authorization required for such changes.

back to TOC

3 - Working with existing colors

3-1 Recycling colors

To use a color existing in a file displayed in a mapper, make its layer editable, and double click on an object, select the style button and open the color bar: the color of the object, if not present in the palette, will be added to the bottom row, as if it were a newly created color.

Only those colors that are identified with that procedure will be added to the palette bottom row; there is no automatic procedure for finding all the not-on-the-palette colors and adding them.

back to TOC

3-2 Getting information on a color

 If one wants to know the precise color definition of an object, several ways are open to him. It is easier to obtain the full code of the color than the detailed R, G, B components

Full code

1- The following is a very secure but clumsy way of obtaining the numerical code of an object

a/ select the object

b/ export selection (Menu  Table > Export > choose Selection then MapInfo Interchange)

c/ read in the .MIF file just created

Excerpt from a MIF file, one symbol exported

.......

Point 169835.63 254853.83

    Symbol (32,8224125,8)

RGB code for the symbol = 8224125            

2 - A more elaborate and probably faster way to get numerical code uses the MapBasic window.

a/ open the MapBasic window

b/ select the object

c/ type in the following line and run it

print styleattr(objectinfo(selection.obj,2),2)

d/ the result (the RGB code) is displayed in the message window

Warning : The two digits have to be adapted to the type of object selected and the information desired as follows :

2  2      symbol color  (example above)

2  4      font foreground color

2  5      font background color

2  4      pen color

3  2      brush foreground color

3  3      brush background color

 3 - To get the RGB code of the current style, using the MapBasic window, type and run the following line that will display all the elements defining a style,

print currentbrush()

or currentfont() or currentpen() or currentsymbol(). The position of the code to be extracted is different for almost each style:

pen, symbol                             position 2
brush               foreground       position 2

                        background     position 3

font                  foreground       one before last position

                        background     last position

This technique can be used to find the style of any object: select the object, open the style requester of the corresponding type, run the above appropriate command.

R, G, B components

The mathematics for translating between code and components are explained in RGB<>R, G, B. There is no MI command that will do specifically the conversion code to components. Two avenues are however possible:

1 – This procedure is very similar to the one shown for changing the color of an object.

a/ the layer containing the object for which the color must be "read" is made editable

b/ double clicking on the object opens the window making the style button accessible

c/ clicking on the color bar opens the palette

d/ click on the bottom right corner cell (the one with ... )

e/ read the RGB components from the Pick Color requester

2 – The MapBasic window is used to send instructions

            write and run once

                        dim rgbcode as integer

                        dim compr as integer

                        dim compg as integer

select the object (the numerical arguments must be adjusted for the type object as explained above). Write and run once

                        rgbcode= styleattr(objectinfo(selection.obj,2),2)

            compr = rgbcode \ 65536

            print "R = " +str$(compr)

            compg=(rgbcode – compr*65536)\256

            print "G = " +str$(compg)

            print "B = " +str$(rgbcode-compr*65536-compg*256)

3 – Use one of the available utilities for the conversion, such as RGB2R_G_B.mbx (in Nu_ColorFun.zip, downloadable from here)

back to TOC


4 - Viewing color palette and schemes

Having a palette, original or modified, or imagining some color scheme does not mean that they can be viewed automatically. There are utilities to print MapInfo palette and to simulate schemes; let us investigate some of them.


4-1 Utilities for palette color printing

There are several free utilities available from various sources that are helpful for testing palette colors. We refer here to two simple ones that give us some openings for expanding their potential domain of application.

COLOR is a MapInfo table created by Jeff Schroeder (jschroed@macomb.lib.mi.us url not operational early April 2002) as a grid representing all the colors in the MapInfo default color palette. Presenting it in black and white is of no interest. It is a simple square cell grid with no other information.

PRNTTEST.zip contains a variety of tables and workspaces created by David Berrian (http://www.directionsmag.com/tools/ ) that test how the MapInfo color and pattern palettes applied to fonts, lines and regions and actually appear on screen and in print. The most useful for our present purpose is FILTESTS.WOR  (Region fills with a solid color pattern). The workspace opens to a layout showing a 16 by 16 array of boxes respecting color-wise the same relative positions as in the 16 by 16 color palette.

To build these two utilities, the colors from the original MapInfo palette have been assigned manually to each corresponding cell. Changes made to the palette via Custom Colors or colors from an alternative palette are not recognized by these tables. MapInfo does not offer a way to link color assignation and palette positions; it was pointed out earlier that the independence between map colors and palette colors is a great advantage for portability. It reveals here a certain disadvantage.

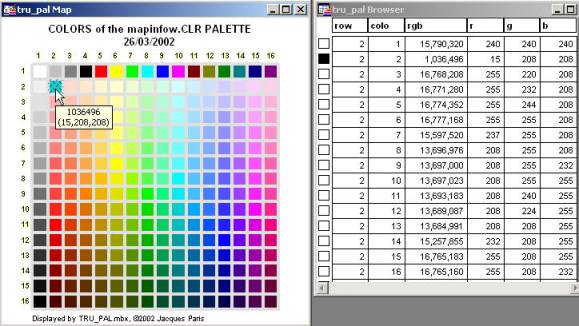
To answer that need, I developed TRU_PAL.MBX  (in Nu_ColorFun.zip, downloadable from here) that creates a table similar to the one above but with the actual colors from the MapInfow.CLR used by the program. The only input required from the user is localization of that file, a requirement for simplifying programming given the fact that various locations are possible depending on version and installation. The browser lists rgb code and components; the tool tip (label) also gives that information over the mapper. The selected cell (position 2,2) shows that this mapinfow.clr is not the original provided my MI, and that TRU_PAL reflects indeed permanent changes to the palette.


Complete information on the colors contained in any type of color tables could be displayed by adding labels if they are already defined. If numeric codes were sufficient, the labeling expression could simply be :

styleattr(objectinfo(obj,3),2)

If RGB components were required, it would be faster to follow a two step procedure. First create an integer column (fill, for example) and update it with the above formula. Then the labeling expression for RGB code and its components, written on two lines, should be

fill+Chr$(10)+ fill\65536+", "+((fill-(fill\65536)*65536)\256)+", "+

(fill-(fill\65536)*65536-(fill-(fill\65536)*65536)\256)*256)

One could think about saving the step of creation and updating of the column “fill”. One would wish to have an automatic label update after any color change in the table (not in the palette, which is not possible as already mentioned). That would require a direct reading of the object style characteristics by replacing the word "fill" by the previous expression "style....." 8 times in the labelling expression. It would be a delicate piece of work, but it would not have to be redone every time because it could be saved in a workspace. However, the full formula is too big and goes over some limit in the size of the expression; MapInfo cannot deal with it, even if it is entered directly in a workspace.

There is however a work-around to fill our needs. Remembering that labels are special objects floating on top of all the layers and not attached to their original layers, as it is for a thematic map, we simply add the same table in the mapper displaying the color grid. We define then the labels for each layer, assigning them functions that cover each about half the formula and using for anchor point the above and the below centre options in the different layers. Both layers being set for automatic labels, we have our automatically adjusted color information.

For the R and B components (top layer, label anchor point placed above object centre)

Int(StyleAttr(ObjectInfo(Object, 3), 2)/65536) + Chr$(10) +

Int((StyleAttr(ObjectInfo(Object, 3), 2) -

Int(StyleAttr(ObjectInfo(Object, 3), 2)/65536)*65536)/256)

For the G component and the RBG code (bottom layer, label anchor point placed below object centre)

(StyleAttr(ObjectInfo(Object,3),2) - Int(StyleAttr(ObjectInfo(Object,3),2)/65536)*65536

- Int(StyleAttr(ObjectInfo(Object,3),2)/65536)*65536)/256)*256)

+ Chr$(10) + StyleAttr(ObjectInfo(Object,3),2)


back to TOC

4-2 Testing new color schemes

It could be easy to use the preceding set-up to test colors individually or in combinations. Once satisfied, the user can record the RGB components and update its palette with them. This last operation is of course completely manual. But if one wants to generate automatically complete sets of colors, he could use other applications.

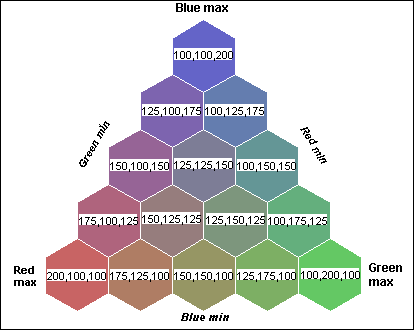
The most fascinating utility for generation and visualization of new colors is most probably HEXCELL (Bill Thoen, http://www.directionsmag.com/tools/) that generates an equilateral assemblage of hexagonal cells. Each summit of the triangle is assigned a base color (Red bottom left, Blue top, Green bottom right); the user can choose the range of variation of each base color (maximum at its assigned summit, minimum on the triangle side opposite to the assigned summit, or no variation at all) and the number of steps to cover that range (i.e. the number of hexcells along a side). All the possible combinations are then generated, can be labeled (rgb components only) and printed.

The following graph is set for Red Min = Green Min = Blue Min = 100 and Red Max = Green Max = Blue Max = 200 and for 4 steps (=5 color levels), all distant of 25 points on the r,b,g scale.

This MapBasic application provides also some more information on color setting, particularly with the first mention of the CMYK color specification system. The formula used for the translation is a standard application of general equations and as it is not able to calculate the level of black used in combination with colors, it sets it equal to zero (an extension of the formula when R=G=B not implemented in Hexcell version 2.00 is to set C=M=Y=0 and calculate K with the general formula and using any color component). For more details about “partial” models, see CMYK model.

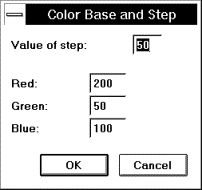
If someone is interested in seeing the impact of smaller variations around a given color, he could use the COLVAR01.MBX utility  (in colvar.zip part of Nu_ColorFun.zip, downloadable from here). With r, g, b levels defined by the user as well as a value named step, the program generates the 27 combinations of rgb values for the original levels and these levels plus or minus the step value. The real color variations are not very perceptible when rendered in grey printing. The r,g,b components can be displayed as a label. The scheme for attributing values is displayed by adding a new table COLVARTX distributed with the program.

back to TOC

5 - Color auto-spread in thematic maps

Colors in a thematic map can be defined using the auto-spread option. The principle is simple: when chosen, the program will generate colors for the intermediary classes once the extremes have been chosen. A secondary option exists then, defining the spread by using RGB or HSV. To appreciate this potential, we can look at the colors generated under different circumstances: knowing that it is impossible to query directly “thematic” objects, there are two ways to proceed; one, by saving workspaces and looking at the color definitions, the other, by using the style requester in the thematic definition window, selecting one class, opening the palette by clicking on the color bar and clicking on the bottom right corner [...]. There are many instances where the generated colors do not exist in the palette, another proof of the independence between object and palette colors.

Following are 3 schemes with the same starting (gray) and ending (red) class colors, and a RGB auto-spread. One can begin to imagine how the program proceeds: the total color spread is split in what seems to be equal (or near equal) parts. Note that splitting a RGB code range in equal parts, or doing it to the RGB component ranges yields the same colors.

Xcode = m * R + n * G + B

Xcode/4 = (m * R + n * G + B) /4  = m * R/4 + n * G/4 + B/4


HSV RGB         HSV RGB

Check Color to make auto-spread

Select RGB or HSV

The right part of the window is opened by clicking on the Options>> button and closed by the same Options << button

The small graphics below the main image are attempts to show the differences in the intermediate colors if one chooses HSV (left) or RGB (right) for 4 and 6 levels. HSV-obtained colors are slight lighter.

Thematic RGB codes

Them. R

Them. G

Them. B

Equal steps on RGB codes

Equal steps on R

Equal steps on G

Equal steps on B

Regenerated from equal steps


4 levels


12632256

192

192

192

12632256

192

192

192

12632256

13664384

208

128

128

13992064

213

128

128

13992064

15745088

240

64

64

15351872

234

64

64

15351872

16711680

255

0

0

16711680

255

0

0

16711680


5 levels


12632256

192

192

192

12632256

192

192

192

12632256

13668496

208

144

144

13652112

208

144

144

13668496

14704736

224

96

96

14671968

224

96

96

14704736

15740976

240

48

48

15691824

239

48

48

15675440

16711680

255

0

0

16711680

255

0

0

16711680


6 levels


12632256

192

192

192

12632256

192

192

192

12632256

13672608

208

160

160

13448140,8

205

154

154

13474458

14708848

224

112

112

14264025,6

217

115

115

14250867

14700624

224

80

80

15079910,4

230

77

77

15093069

15740976

240

48

48

15895795,2

242

38

38

15869478

16711680

255

0

0

16711680

255

0

0

16711680

The RGB codes regenerated are those calculated with the equal step components that must be rounded up sometimes; they may be different from the RGB codes obtained by direct splitting. Looking more in detail reveals that the equal part split is far from being respected; there must be more behind the scene to that auto-spread function.

The next example uses the HSV auto-spread. The generated colors are different from those obtained with the RGB option (see above); the HSV components derived from an equal step calculation are an approximation.

          Auto-spread generated  colors


Equal step scheme

RGBcodes

R

G

B

H

S

V

H

S

V


12632256

192

192

192

0

0

180

0

0

180


13672608

208

160

160

0

55

195

0

60

195


14708848

224

112

112

0

120

210

0

120

210


15745088

240

64

64

0

176

225

0

180

225


16711680

255

0

0

0

240

240

0

240

240


back to TOC

6 - Color limitation and “unlimited” use

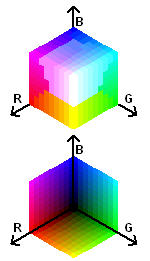
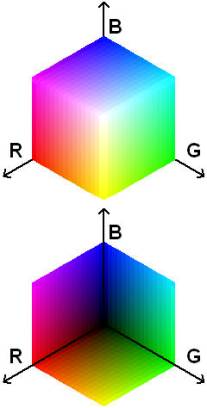
With 9 levels, the color cube quality begins to fall very visibly. The program generates the bottom part first and uses 244 colors for it (including black). The top part shows a huge degradation around the “white” pole.


A way to increase the number of colors that can be displayed is to fragment a table in several parts, each holding less that 256 different colors. The limit would come then from the computer display and not from MI. One could wonder how important displaying so many colors could be in the area of mapping when the human eye is so limited in distinguishing between shades. I guess that knowing there are limits is the best incentive to find ways to push them back and find new uses for the enlarged domain.


The color cube above could be built from several parts.Using a table for each cube face, we could maximize the number of colors to 16 levels (256 colors a face) which gives a pretty striking image for a not-a-paint progam.


The next snapshot from a mapper contains 512 colors, from 8 different tables; all colors differ by at least 255/8 points in one of the rgb components.

blocks = red levels, lines = green levels, columns = blue levels


These blocks represent in fact slices through the color cube in planes parallel to the BG plane. The top left square is the outside face of the cube (to the left in the upper part of the cube) and the bottom right is the “inner” side (to the right of the bottom part). They are arranged 1 on top row, 2 on bottom, 3 on top...The squares must be rotated clockwise by 90 degrees to coincide with the cube.


back to TOC

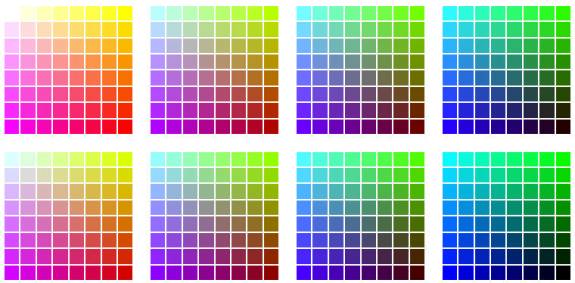
7 - Browser safe colors

We can certainly benefit from the work of Lynda Weinman (http://www.lynda.com/hex.html) in the area of use of colors on the web. One of her recommendations is to always use “browser safe” colors not to be badly surprised by the quality of an image on the web. I do not know if that would apply also to maps directly produced on the web or presented as images, but why not playing it safe.

It would mean that one should work with a palette using only colors that are recognized by practically all kinds of platforms. That reduces the set to 216 colors common to all, PC as well as Mac; they are defined by a simple mathematical rule of using all possible combinations of the 3 primaries with 6 levels of intensity (0, 51, 102,153, 204 et 255 or i hex code 00, 33, 66, 99, CC, FF).

Organizing colors in a palette is not an easy task and there is probably no optimal solution. Lynda offers two images based on different principles, by Hue or by Value. I have created the template for a palette containing those colors, without any pretence at using the available 16*16 space intelligently (see Making your own palette for Mapinfo)


back to TOC

8 - Color names

There have always been some attempts at referring to colors by name, and more recently at associating numerical codes to those names.  The simplest list is certainly the 16 colors from the VGA standards. One can also identify the X11 color set. These 140 or so colors are from a source unknown to me but are said to be usable in HTML for NetScape and IE. Beyond these “names”, there are also families of colors (blue exists also as blue1, blue2, blue3 and blue4; very often, the unnumbered name is the same as the first numbered name; here blue and blue1 are identical). Finally there are 40 color names in the palette introduced by MS in Microsoft Office 97.

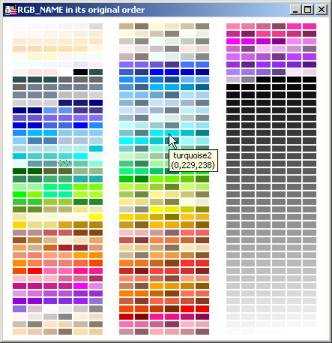
I suspect that the compilation of those three sources are at the origin of the largest list of color names I have found and already used in my original file ColorFun.zip inside the ColNames.zip archive. The tables of this zip file are a visualization of the colors described in the compilation made by Alistair Duncan and available in the rgb_name.zip archive (http://www.directionsmag.com/tools/).

As the number of different names exceeds 255, the file has been truncated in three tables with 246 colors each. A mapper is made of 3 tables (colnama1, colnama2 and colnama3) in the same order as the original file. The other mapper contains also 3 tables  (colnamb1, colnamb2 and colnamb3) in the R(G(B)) decreasing order. Both are displayed with the COLNAME.WOR.  (in color_names.zip part of Nu_ColorFun.zip, downloadable from here)

One could notice that the original list contains many "synchromous" brushes, i.e. different names with the same color definition. As this list is in 3 parts, searches for color names or components should be carried out on the original one, not on the partial ones used for these displays. This is most probably the list used (after elimination of synchromous entries) by Trey Patillo in his ColorMap application.


back to TOC

9 - Utilities for color management

9-1 RGB_HSV color viewer

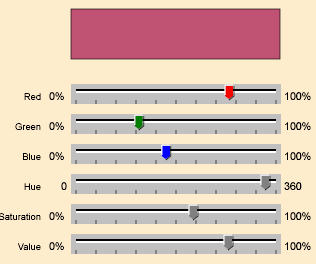
As part of a demo program of SVG application, Robert Edwards is offering a tool using 6 sliders (R, B, G, H, S, V) working instantaneously on those of the other system and on the display of the color. As could be noticed, the sliders are scaled from o to 100% which means that this tool could be used as a converter in the MI context. It has however the interest of showing the effects of changes in one system component over the components of the other system.

http://home.earthlink.net/~edwardsrg/Adobe/rgbhsv.html

The Adobe SVG plug-in is required to run this example. That Plug-in can be obtained at the Adobe SVG site:

http://www.adobe.com/svg/viewer/install/main.html


back to TOC

9-2 RGB Editor

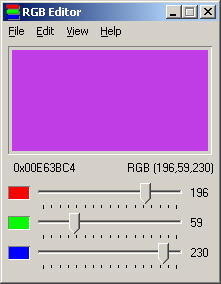
One of many tools written by Gregory Braun for Software by Design (http://www.gregorybraun.com/), RGB Editor opens up as a small window with 3 sliders (R, G, B) the resulting color, the values of the components (scaled 0 – 255) and the hexadecimal color code

Using the Edit | Edit color menu command opens up a second window of which the right part is the most interesting for our purpose. The interactive part of color selection is made by using the HSL model (a variant of the HSV, and all that will be said here applies to it and to HSB, another variant) and “displaying” it in two parts:

-          a square window with x coordinates corresponding to the Hue and y coordinates to the Saturation (a similar presentation to the color circle corresponding to a plane view of the color volume for a given value along its axis, with x being the radius and y the angle from Red)

-          -a vertical “slider” showing the range of color that can be obtained for the selected HS position (a parallel to the vertical axis of the color volume at that precise point).

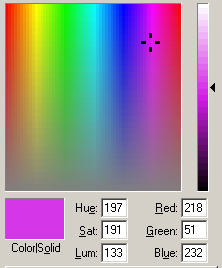
The ranges of variation for the RGB and HSL three components are all from 0 to 240 The chosen color is displayed in the small window with its HSL and RGB components alongside. Notice that only the RGB components are passed to the main window: the HSL model and its 3D representation is only used to select the color, a very good example of how the HSL model is easier to control from a user point of view; its behavior is much more similar to the intuitive way of “creating” colors, first with Hue (dominance), then with purity (Saturation) finally with brightness (Value, Saturation or Brightness).

Most “paint” programs use that form of HSx model presentation for interactive color selection, with of course variations. Lview pro is such an example; the color spread is typically HSx, probably a HSL given the fact that the “purest” colors are in the center. The components values can be retrieved in RGB or HSL, in this case.


back to TOC

9-3 “What color”

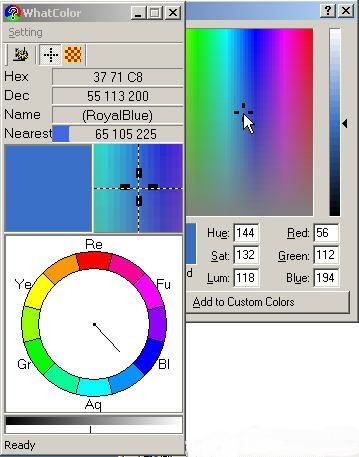
That interesting program written by Hikaru Nakahara @1997-2000 (http://homepage1.nifty.com/pec/03713/e/) comes with three screen layouts, the “largest” giving by far the most information. The two central windows show cursor location (context and detail). Above them the literal results, below another representation of the HSx model (no indication what variant): the color wheel is a simplified “painting” but the “radius” show the angle for the Hue and its length is proportionate to the Saturation. A small marker at the bottom indicates the “value” on the 3rd dimension from dark to bright.

The snap shot of the screen is taken over the edit screen of RGB Editor. One can notices a small difference between the two results: 55,113,200 in What Color, 56,112,194 for what appears to be the same point in RGB Editor, but is it really the same point? These interactive color selectors lack generally some fine precision in color pointing.

One interesting feature of that application is the use of color name taken from one of 3 lists or from the combination of these 3 lists. If the detected color is right on a defined color, the name will be shown in plain format. If not, a name between parentheses will refer to the “closest” color. A swatch of that color and its r,g,b components are always displayed.

Two slight drawbacks to that tool, the fact that the color definitions is not as open as it could be to modify its contents and a personal reservation concerning the procedure to find the closest color. This procedure is the standard one used in so many mathematical applications, i.e. using the minimum of the sum of squared distances (as confirmed to me by the author). I do not think that it is the most appropriate criterion when working with color models, particularly with those of the HSx family, but as my arguments are just feelings rather than facts, I would not push that issue further.


back to TOC

9-4 ColorMap

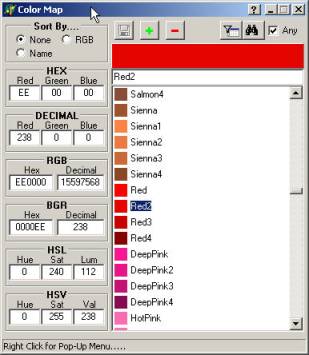
Trey Patillo (www.wap3.com) has conceived that tool as a color code converter combined with a color name dictionary.

Selecting an existing color will update all the value boxes. Values can also be entered directly in any of the text boxes and update to the other boxes is immediate on a <return>. The corresponding color is displayed and if the RGB code falls exactly on one in the list, the color name is displayed below the color swatch.

Some remarks about the codes part. BGR is simply RGB inverted; this sequence is used in some platforms or O.S.  Notice the hex format. If one wants to write a color in that code, the order of the components is inverted. The direct equivalence of (196,59,230) would be (C4 3B E6) but the real hex value, as it would be written in MapBasic should be (&H00E63BC4). The first null byte is required to fill up a 4-byte integer variable. Such a binary variable read as an integer yields the actual rgb code 12860390. The ranges for HSL, HSV are specific to this tool (check the help message in the status bar).

The color list is an open file (color.def; not in the MapBasic def format); it can be switched to another or edited from the program itself. The about 510 names in the original file are those found in: http://www.roundrockisd.org/rrweb/distresc/taskforc/strips/shades_Black.htm but with some name deletion because of duplicate code definitions (on the image DeepPink1 is not listed because it has the same RGB code as DeepPink).

A small drawback in this version is the absence of a “closest color” function.

back to TOC