
Vous pouvez lire le billet sur le blog La Minute pour plus d'informations sur les RSS !
Canaux
2732 éléments (56 non lus) dans 55 canaux
 Dans la presse
(21 non lus)
Dans la presse
(21 non lus)
-
 Décryptagéo, l'information géographique
-
Cybergeo
(10 non lus)
-
Revue Internationale de Géomatique (RIG)
-
SIGMAG & SIGTV.FR - Un autre regard sur la géomatique
(1 non lus)
-
Mappemonde
(10 non lus)
Du côté des éditeurs
(2 non lus)
-
Imagerie Géospatiale
-
Toute l’actualité des Geoservices de l'IGN
(2 non lus)
-
arcOrama, un blog sur les SIG, ceux d ESRI en particulier
-
arcOpole - Actualités du Programme
-
Géoclip, le générateur d'observatoires cartographiques
-
Blog GEOCONCEPT FR
Toile géomatique francophone
(23 non lus)
-
Géoblogs (GeoRezo.net)
-
Conseil national de l'information géolocalisée
-
 Geotribu
-
Les cafés géographiques
(2 non lus)
-
UrbaLine (le blog d'Aline sur l'urba, la géomatique, et l'habitat)
-
Icem7
-
Séries temporelles (CESBIO)
(2 non lus)
-
Datafoncier, données pour les territoires (Cerema)
-
Cartes et figures du monde
(2 non lus)
-
SIGEA: actualités des SIG pour l'enseignement agricole
-
Data and GIS tips
-
Neogeo Technologies
-
ReLucBlog
-
L'Atelier de Cartographie
-
My Geomatic
-
archeomatic (le blog d'un archéologue à l’INRAP)
-
Cartographies numériques
(9 non lus)
-
Veille cartographie
-
Makina Corpus (3 non lus)
-
Oslandia
(5 non lus)
-
Camptocamp
-
Carnet (neo)cartographique
-
Le blog de Geomatys
-
GEOMATIQUE
-
Geomatick
-
CartONG (actualités)

Planet OSGeo
-
sur Sean Gillies: Bear 100 retro
Publié: 20 November 2023, 3:50am CET
After the race I needed some time to deal with my disappointment about rolling my ankle and dropping out at mile 61. Then I got busy looking for a new job. Writing up a retrospective that I could use in the future was delayed. Here it is, at last. I hope it's interesting and useful to others. This kind of retrospective is something I've learned to use at work. It's roughly organized around what went well, what could be better, lessons learned, in the areas of preparation and training, planning, and execution.
First of all, the race itself was great! Other runners I know said it was, and they were right. It was very well run. The aid stations were well stocked and operated smoothly. The course was beautiful and well marked. I felt constantly challenged, safe, and encouraged. I won't forget the super runnable single track down into Leatham Hollow, the springy soil made of pine needles, the ferns, and the view of the cliffs on the sunny slope. I lived just a few miles away for 10 years, but I'd never been on that trail before. The shady side of the canyon was super lush and green, almost Pacific Northwestern compared to Colorado's Front Range foothills. My memory of arriving at the Upper Richards Hollow aid station is another favorite. After a tough climb out of a wooded canyon, we were greeted on the flat bench above by an aid station volunteer holding a tray of cool, moist towels! They invited us to freshen up and enjoy a fancy brunch at clothed tables served by volunteers in tuxedo t-shirts. More than one of us expressed the feeling that it was way too early to be having hallucinations.
Much went according to plan, or better. My summer training volume was adequate and I did plenty of hiking and running on similar terrain at a similar, or higher, elevation. 4.5 weeks of fine tuning and tapering suited me well. I started the race feeling fresh. Flying to Salt Lake City and driving to Logan worked well for me. I was able to close my eyes and snooze while others transported me from Fort Collins to SLC. After landing, I had a sentimental and tasty lunch at Red Iguana, one of my favorite restaurants. In Logan, I enjoyed an entire day of hanging out with my aunt and her dog before race day.
My simple race plan was fine. I started out aiming to leave aid stations at the times that previous 36 hour finishers have, and did that. I aimed to slow down less than the typical 36 hour finisher after 40 miles, and achieved that, too. It was a good pacing plan for finishing in less than 36 hours. At each aid station I knew how many 100 calorie portions of food I should be picking up, and how many drink bottles to fill, and this was a fine fueling and hydration plan. I didn't bonk, cramp, or run out of drinks at any point, thanks to the water drop above Temple Fork.
We had exceptionally good weather on race day and night, so flaws in my equipment choices didn't surface like they might have. Tony Grove was, in fact, a good place to have a change of clothes, pants, and a sweater. Temple Fork would have been too early for warm layers. Franklin Basin would have been too late.
My feet suffered less in 60 miles of the Bear than in any of my previous 100K runs. I lubed them well before the start and changed socks at 28 and 50 miles. I had no blisters and no hot spots. I started the race in a pair of newish HOKA Mafate Speed 4 and they were fine. In the weeks before the race I had some persistent soreness on the top of my right foot and was concerned about a stress injury, but this didn't get any worse during the Bear.
I had no crew at the race, but found good company on the trail multiple times. Sometimes with other people making their own first 100 mile attempt. Sometimes with people going for their third or fourth Bear finish. I heard hilarious stories about the extreme hallucinations you can experience after 48 hours without sleep. I met a guy who graduated from Cache Valley's other high school a year after I graduated from Logan High. I ran with a woman who lost her colon to cancer a year ago. I spent four hours on the trail before Tony Grove with a guy from Boulder who runs a molecular biology center at CU. We run many of the same routes in Rocky Mountain National Park.
Now for the things that didn't go as well. Some flaws in my training and overall fitness were exposed by the Bear's long and rough downhills. I should lose at least 10 pounds. 15 might be better. I can feel the extra weight in my knees and the sensation compounded over 20+ hours. Also, I feel like I've lost foot speed and spatial sense over the last year or so. Three years ago my favorite fitness trainer went out of business and exercises like skaters and box jumps fell out of my repertoire. I believe that I can improve my proprioception by bringing these kinds of exercises back. If I can, I should be better able to dodge impacts instead of absorbing them.
My stomach was fine at the Bear, but I struggled with lower intestinal trouble from miles 20-40. I had to make a lot of stops in the trees, used up my supply of toilet paper, and had to resort to various leaves. Burdock is my friend in this situation. It wasn't the end of the world, but was a distraction. I don't know what the cause was. In the interest of keeping things simple, I had decided to go with the race's drinks instead of bringing, and mixing, my own, but I didn't train with them beforehand. Gnarly Fuel2O treated me well enough at Kettle Moraine, so I felt safe at the Bear. I started the race with 3 bottles of GU Roctane because I spaced packing some Tailwind mix for my initial bottles. I've never tried this stuff before. It has more ingredients than Taillwind or VFuel, my staples, including taurine. Maybe that was the culprit? I can only speculate. As I said, this was not a problem that would have prevented me from finishing.
Long descents in the dark made my brain and eyes tired. I was not fully prepared for this. I had a 350 lumen light on my belt and 500 lumens on my head. This was fine for 9 hours at Kettle Moraine in June, but not great for 12 hours at the Bear. I'll bring more light next time. Why spend energy trying to figure out mysteries on the trail that could be solved by better illumination?
Without a crew, my stop at Tony Grove to change clothes and get set for seven more hours of night running was overly long. I wonder if I'd left 20-30 minutes earlier I might have reached Franklin Basin without incident? At the very least, I'd have reached Franklin Basin that much sooner. A crew wouldn't have helped earlier, but would have helped at 50 miles when I was trying to change clothes, stay warm, and get fed simultaneously. It was mentally tiring at a moment where I was already mentally tired.
I've mentioned before that I left Tony Grove alone at 11 pm and had a sprained ankle at 1 pm. I was out there by myself and am not sure what happened. I could have fallen asleep on my feet; this has been known to happen. Having a pacer could have helped get me to Franklin Basin and beyond in good shape. Being able to follow someone with fresh eyes and a fresh mind would have helped with the issues I mentioned two paragraphs above. It's always easier to follow than to break trail. Even without a pacer, if I'd been in a small group I could have done some leading and some following. This would have been good. And I think getting out of Tony Grove earlier would have made it more likely to join such a group.
In hindsight, I should have had some plan for resting or napping. At 20 hours, I was more groggy than I expected, perhaps because I was alone with nothing but my breath, footsteps, and sleepy thoughts. Recently, a friend of mine shared his tactic of laying down on the trail for short naps, to be woken by the next runner 5-10 minutes behind. This issue is very connected to the previous ones. With less exertion, there is less need to nap. Even if I solve other problems, I bet I'll still run into the need to shut my eyes at 3 or 4 am. I'm going to think about this for next year.
Lastly on the could-have-gone-better front, how about my reaction to my ankle injury? My fuzzy recollection is that I came to full consciousness with a painful and unstable ankle in the dark at 1 am, a mile from the Franklin Basin aid station. I was concerned and went gingerly over that mile, and my plan was to try 15-20 minutes of elevation and compression before deciding whether to continue. I wasn't otherwise physically tired, hungry, or thirsty. My ankle became more swollen and painful while I was off my feet, and after 30 minutes I concluded that I could could not continue.
What if I had not stopped and just grabbed some hot food and kept going? The worst case scenario would have been hiking some small way toward the next aid station and having to return to Franklin Basin, with some damage done to my ankle. What if I had been able to hobble 8 miles to the Logan River aid station and continue slowly from there? I've run through mild sprains several times this year, and have endured worse grade 2 sprains than this one, yes, but not this year. Being alone out there make it harder to push on. If I was pacing myself, I may have been able to convince myself to take a shot at continuing. I think dropping out was 99% the right decision overall. My chance of making it another 8 miles to Logan River was maybe 50%, though? It's hard to say.
I learned two lessons. The TSA says no hiking poles allowed in carry on luggage! I had to leave mine behind at DEN and get new poles at the Farmington REI after leaving SLC. I won't make this mistake again.
While I was mentally prepared for the possibility of dropping out of the race, I did not have any plan for getting back to town after I did so! After two hours of sitting by the campfire at Franklin Basin I did finally meet someone who was heading directly back down the canyon to Logan.
As I said earlier, things mostly went my way. Except for some bad luck and a misstep I believe I would have finished. Registration for the 2024 edition of the Bear opens on December 1. I'm going to try again with more or less the same simple plan, stronger ankles, more light, and fewer distractions.
-
sur Sean Gillies: Status update
Publié: 20 November 2023, 1:41am CET
Finally, I have a professional update. I started work at TileDB on Wednesday. I'll be working from Fort Collins alongside colleagues around the world. I know a slice of TileDB's market, dense multi-dimensional arrays like earth observation data, well, but have a lot to learn about genetic data, embeddings, and storing graphs in adjacency matrices. I expect this to be both challenging and fun. I'll post more about it once I'm settled in.
I'll be resuming work on open source projects, which I've paused while job hunting, soon!
-
sur PostGIS Development: PostGIS Patch Releases
Publié: 20 November 2023, 1:00am CET
The PostGIS development team is pleased to provide bug fix and performance enhancements 3.4.1, 3.3.5, 3.2.6, 3.1.10, 3.0.10 for the 3.4, 3.3, 3.2, 3.1, 3.0 stable branches.
-
sur Free and Open Source GIS Ramblings: Adding basemaps to PyQGIS maps
Publié: 17 November 2023, 1:00pm CET
In the previous post, we investigated how to bring QGIS maps into Jupyter notebooks.
Today, we’ll take the next step and add basemaps to our maps. This is trickier than I would have expected. In particular, I was fighting with “invalid” OSM tile layers until I realized that my QGIS application instance somehow lacked the “WMS” provider.
In addition, getting basemaps to work also means that we have to take care of layer and project CRSes and on-the-fly reprojections. So let’s get to work:
from IPython.display import Image
from PyQt5.QtGui import QColor
from PyQt5.QtWidgets import QApplication
from qgis.core import QgsApplication, QgsVectorLayer, QgsProject, QgsRasterLayer, \
    QgsCoordinateReferenceSystem, QgsProviderRegistry, QgsSimpleMarkerSymbolLayerBase
from qgis.gui import QgsMapCanvas

app = QApplication([])
qgs = QgsApplication([], False)
qgs.setPrefixPath(r"C:\temp", True)  # setting a prefix path should enable the WMS provider
qgs.initQgis()
canvas = QgsMapCanvas()
project = QgsProject.instance()
map_crs = QgsCoordinateReferenceSystem('EPSG:3857')
canvas.setDestinationCrs(map_crs)

print("providers: ", QgsProviderRegistry.instance().providerList())
To add an OSM basemap, we use the xyz tiles option of the WMS provider:
urlWithParams = 'type=xyz&url=https://tile.openstreetmap.org/{z}/{x}/{y}.png&zmax=19&zmin=0&crs=EPSG3857'
rlayer = QgsRasterLayer(urlWithParams, 'OpenStreetMap', 'wms')
print(rlayer.crs())
if rlayer.isValid():
    project.addMapLayer(rlayer)
else:
    print('invalid layer')
    print(rlayer.error().summary())
If there are issues with the WMS provider,
rlayer.error().summary()should point them out.
With both the vector layer and the basemap ready, we can finally plot the map:
canvas.setExtent(rlayer.extent())
plot_layers([vlayer,rlayer])

Of course, we can get more creative and style our vector layers:
vlayer.renderer().symbol().setColor(QColor("yellow"))
vlayer.renderer().symbol().symbolLayer(0).setShape(QgsSimpleMarkerSymbolLayerBase.Star)
vlayer.renderer().symbol().symbolLayer(0).setSize(10)
plot_layers([vlayer,rlayer])
And to switch to other basemaps, we just need to update the URL accordingly, for example, to load Carto tiles instead:
urlWithParams = 'type=xyz&url=http://basemaps.cartocdn.com/dark_all/{z}/{x}/{y}.png&zmax=19&zmin=0&crs=EPSG3857'
rlayer2 = QgsRasterLayer(urlWithParams, 'Carto', 'wms')
print(rlayer2.crs())
if rlayer2.isValid():
    project.addMapLayer(rlayer2)
else:
    print('invalid layer')
    print(rlayer2.error().summary())

plot_layers([vlayer,rlayer2])
You can find the whole notebook at: [https:]]
-
sur Lutra consulting: 3D Tiles in QGIS
Publié: 16 November 2023, 9:00am CET
Earlier this year, in collaboration with North Road we were awarded a grant from Cesium to introduce 3D tiles support in QGIS. The feature was developed successfully and shipped with QGIS 3.34.
In this blog post, you can read more about how to work with this feature, where to get data and how to display your maps in 2D and 3D. For a video demo of this feature, you can watch Nyall Dawson’s presentation on Youtube.
What are 3D tiles?3D tiles are a specification for streaming and rendering large-scale 3D geospatial datasets. They use a hierarchical structure to efficiently manage and display 3D content, optimising performance by dynamically loading appropriate levels of detail. This technology is widely used in urban planning, architecture, simulation, gaming, and virtual reality, providing a standardised and interoperable solution for visualising complex geographical data.
Examples of 3D tiles:
Data from Swisstopo [https:]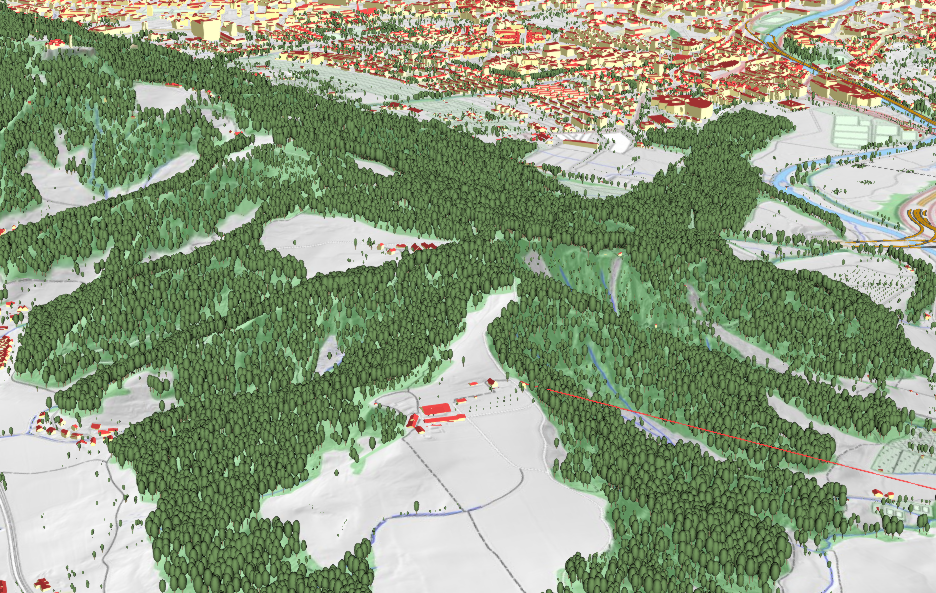
Washington - 3D Surface Model (Vricon, Cesium) 3D tiles in QGIS
To be able to use 3D tiles in QGIS, you need to have QGIS 3.34 or later. You can add a new connection to a 3D tile service from within the Data Source Manager under Scene:
Adding a new 3D tile service from Data Source Manager in QGIS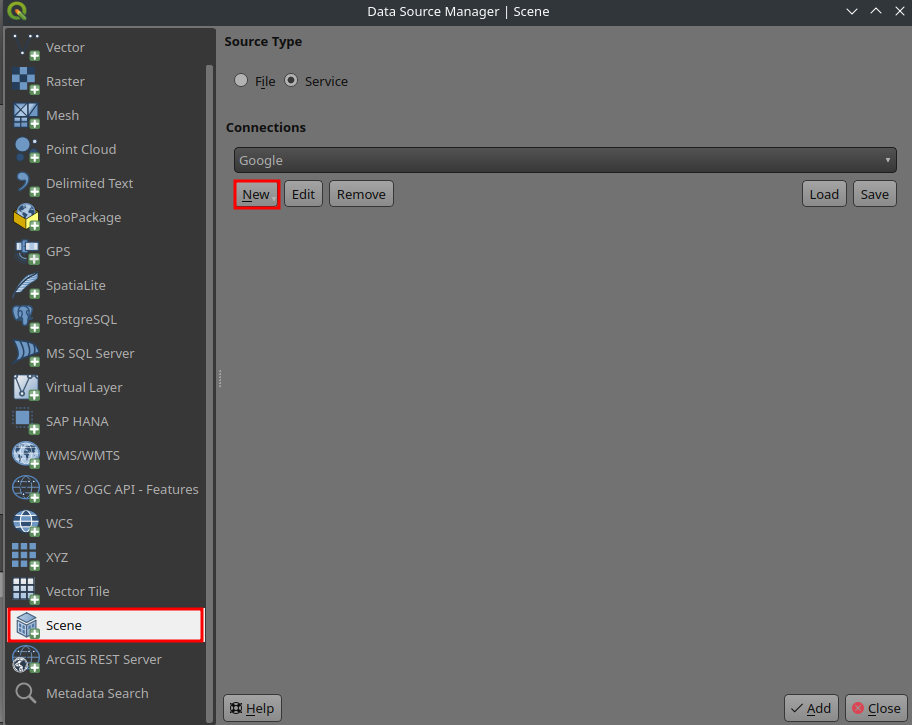
Alternatively, you can add the service from your Browser Panel:
3D tiles data provider in the Browser panel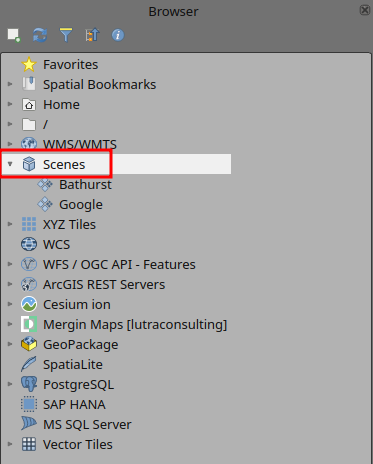
To test the feature, you can use the following 3D tiles service:
Name: Bathurst
URL: [https:]
Creating a new connection to a 3D tiles service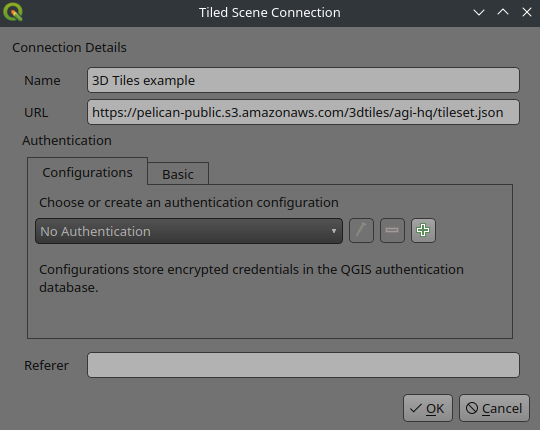
You can then add the map from the newly generated connection to QGIS:
Adding a new 3D tiles to QGIS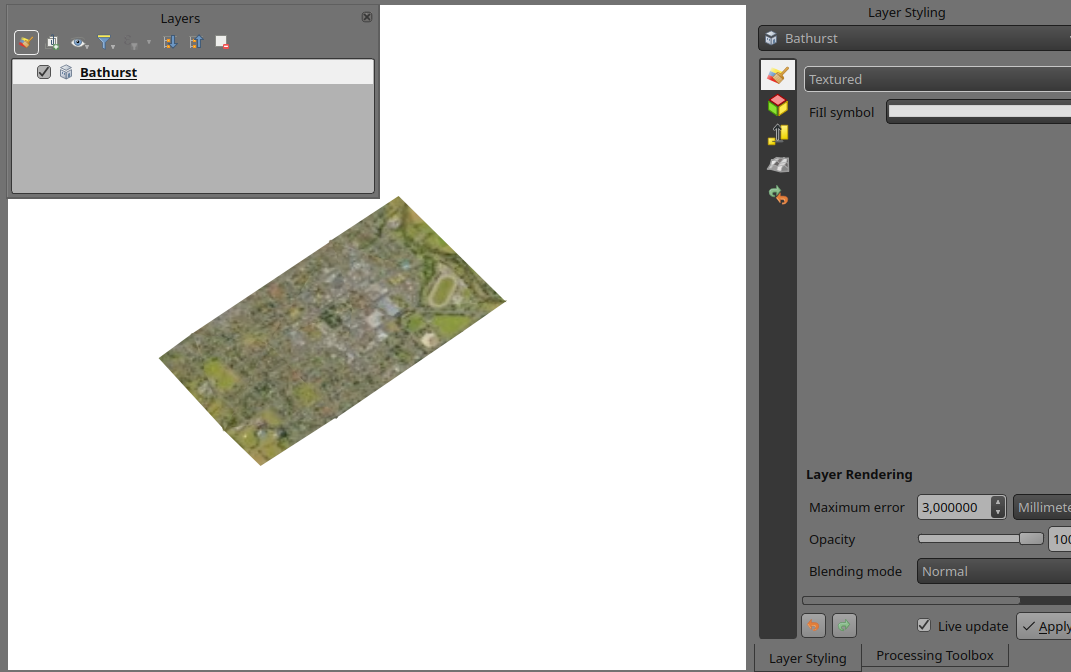
By default, the layer is styled using texture, but you can change it to see the wireframe mesh behind the scene:
3D tiles’ mesh wireframe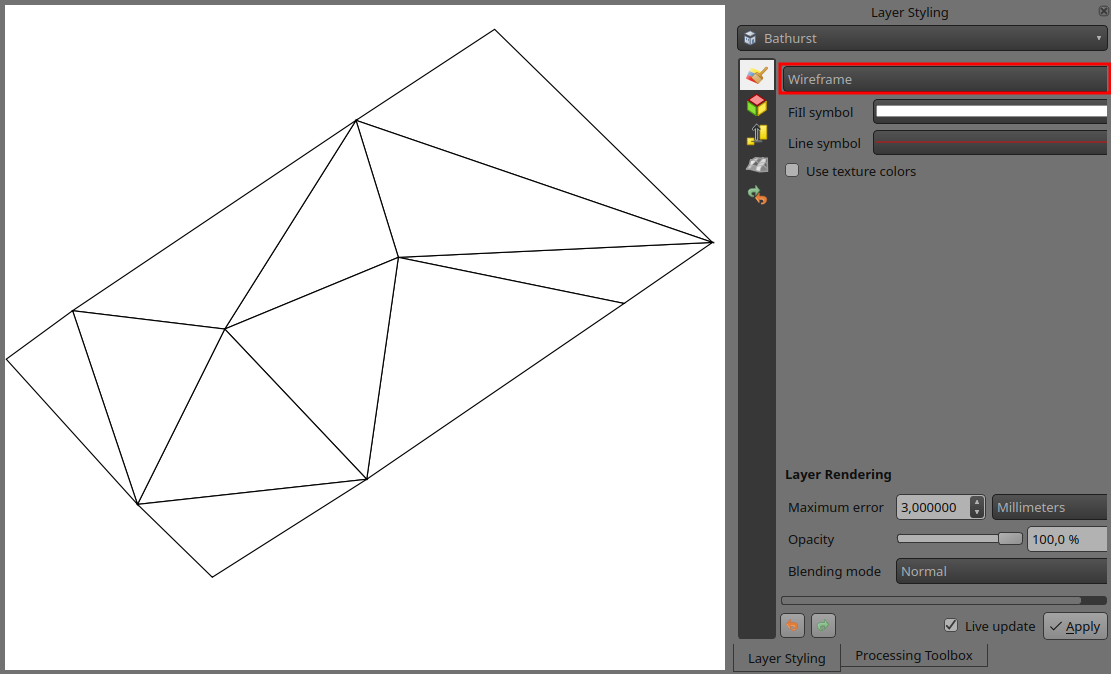
You can change the mesh fill and line symbols similar to the vector polygons. Alternatively, you can use texture colors. This will render each mesh element with the average value of the full texture. This is ideal when dealing with a large dataset and want to get a quick overview of the data:
3D tiles with texture color for meshes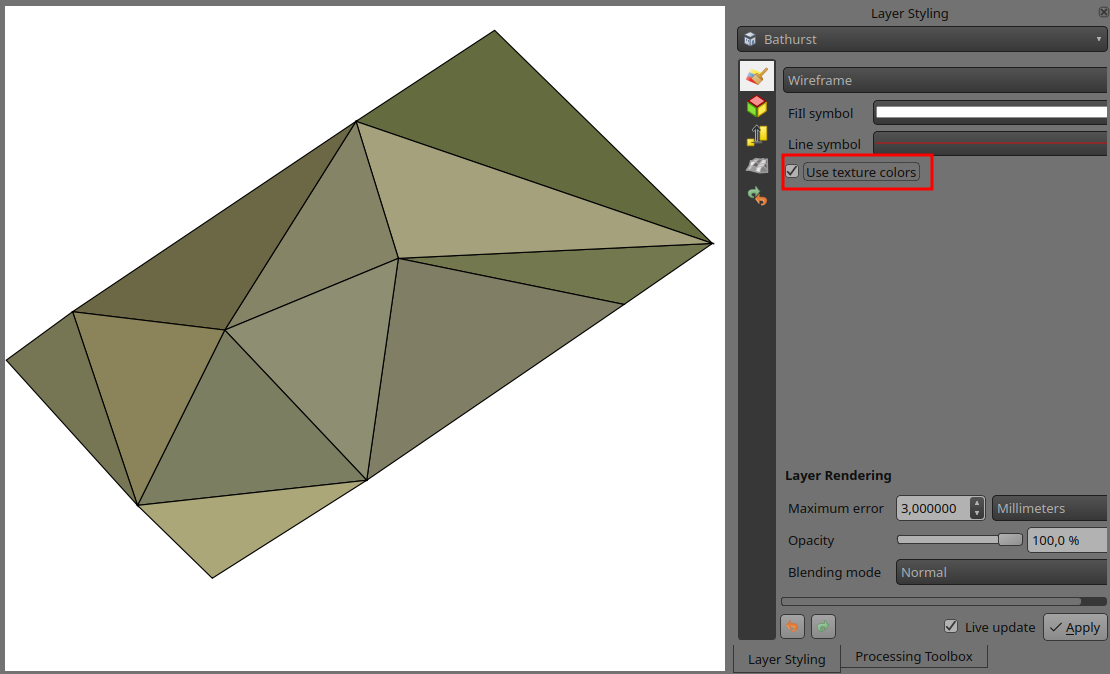
To view the data in 3D, you can open a new 3D map. Similar to 2D map, by zooming in/out, finer resolution tiles will be fetched and displayed:
Using data from Cesium ionCesium ion is a cloud-based platform for managing and streaming 3D geospatial data. It simplifies data management, visualisation, and sharing.
To add 3D tiles from Cesium ion, you need to first sign up to their service here: [https:]
Under Asset Depot, you will see a catalogue of publicly available datasets. You can also upload your own 3D models (such as OBJ or PLY), georeference them and get them converted to 3D tiles.
You can also add one of the existing tile service under [https:]] and select the tile service and then click on Add to my assets:
Adding an existing dataset to your Cesium ion assets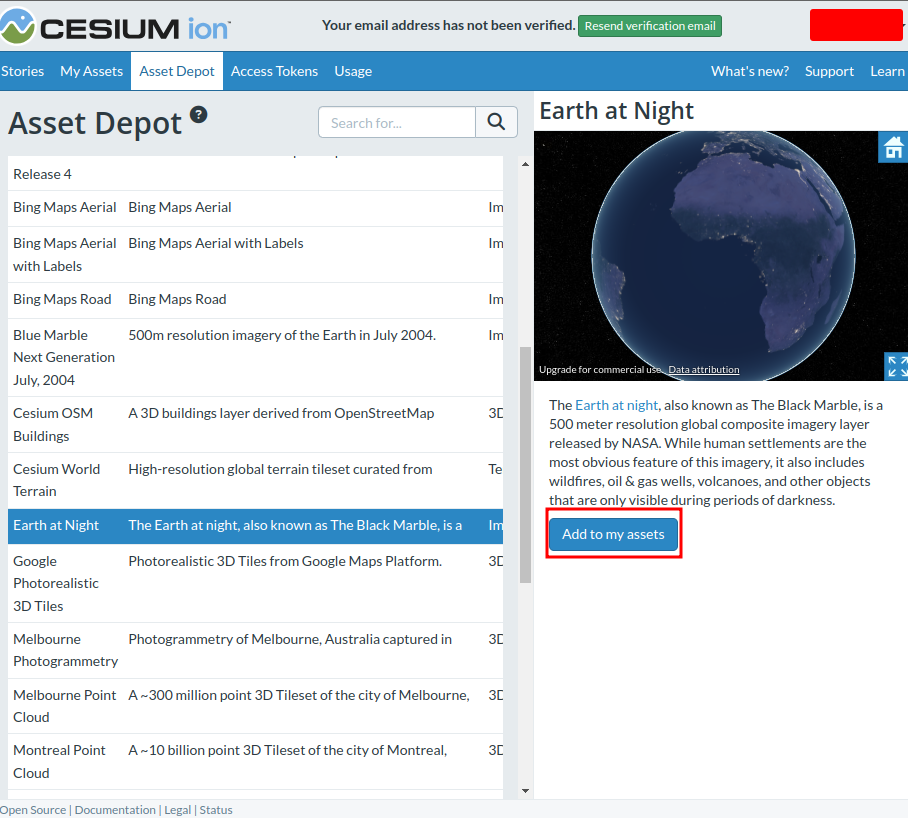
You can use the excellent Cesium ion plugin by North Road from the QGIS repository to add the data to QGIS:
Adding Cesium ion assets to QGIS Working with Google 3D data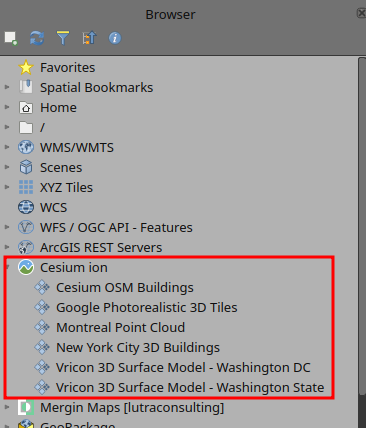
In addition to accessing Google Photorealistic 3D tiles from Cesium ion, you can also add the tiles directly in QGIS. First you will need to follow the instructions below and obtain API keys for 3D tiles: [https:]]
During the registration process, you will be asked to add your credit card details. Currently (November 2023), they do not charge you for using the service.
Once you have obtained the API key, you can add Google tiles using the following connection details:
Adding Google Photorealistic tiles in QGIS Notes and remarks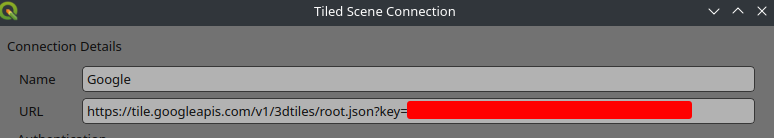
- Adjusting map extents for large scenes
When dealing with large scenes, map extents should be set to a smaller area to be able to view it in 3D. This is the current limitation of QGIS 3D maps as it cannot handle scenes larger than 500 x 500 km.
To change the map extent, you can open Project Properties and under View Settings change the extent. In the example below, the map extent has been limited only to a part of London, so we can view Google Photorealistic tiles in the 3D map without rendering issues.
Limiting project extent in QGIS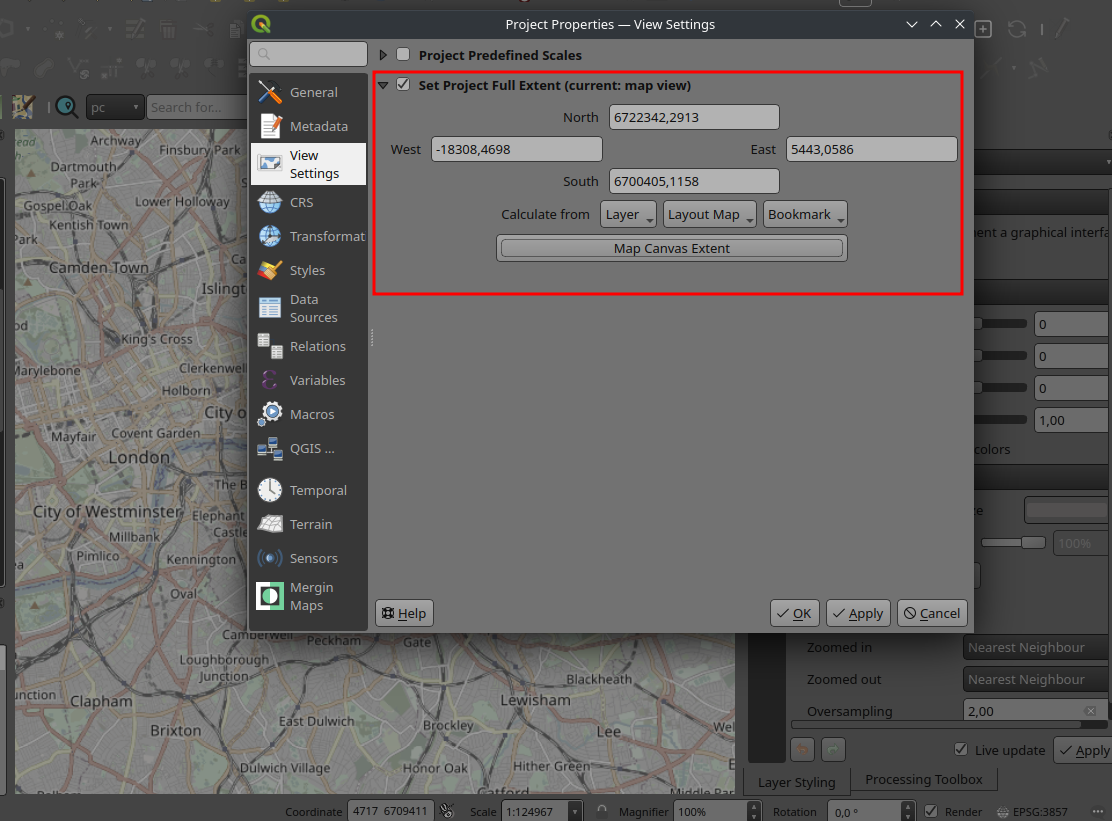
3D tiles from Google in QGIS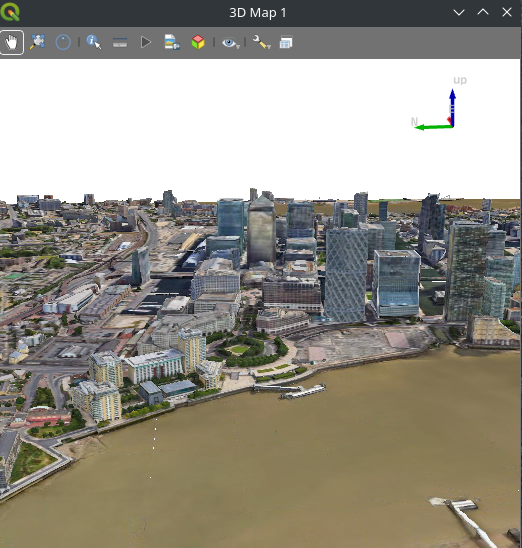
- Network cache size
If you are handling a large dataset, it is recommended to increase network cache size to 1 GB or more. The default value in QGIS is much lower and it results in slower rendering of the data.
Increasing Cache size in QGIS for faster rendering
- Overlaying other 3D data
When you try to overlay other data sets on top of a global 3D tiles, the vertical datum might not match and hence you will see the data in the wrong place in a 3D map. To fix the issue, you may need to use elevation offsetting to shift the data along the Z axis under Layer Properties:
Offsetting elevation of a layer in QGIS Future works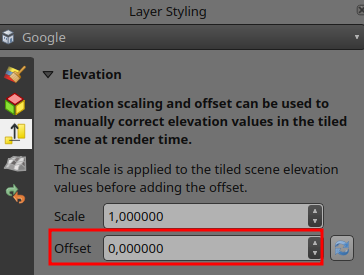
This is the first implementation of the 3D tiles in QGIS. For the future, we would like to add more features for handling and creation of the 3D tiles. Our wishlist in no particular order is:
- Globe view: QGIS 3D cannot handle large scenes or unprojected views.
- More advanced styling of meshes: as an example, users will be able to create their own style.
- 3D In-door navigation: as an example users will be able to navigate inside buildings and potentially it will bring BIM data closer to QGIS
- Generation of 3D tiles inside QGIS: adding a processing tool in QGIS to generate 3D Tiles from your map data.
Styling of 3D tiles (image from [https:]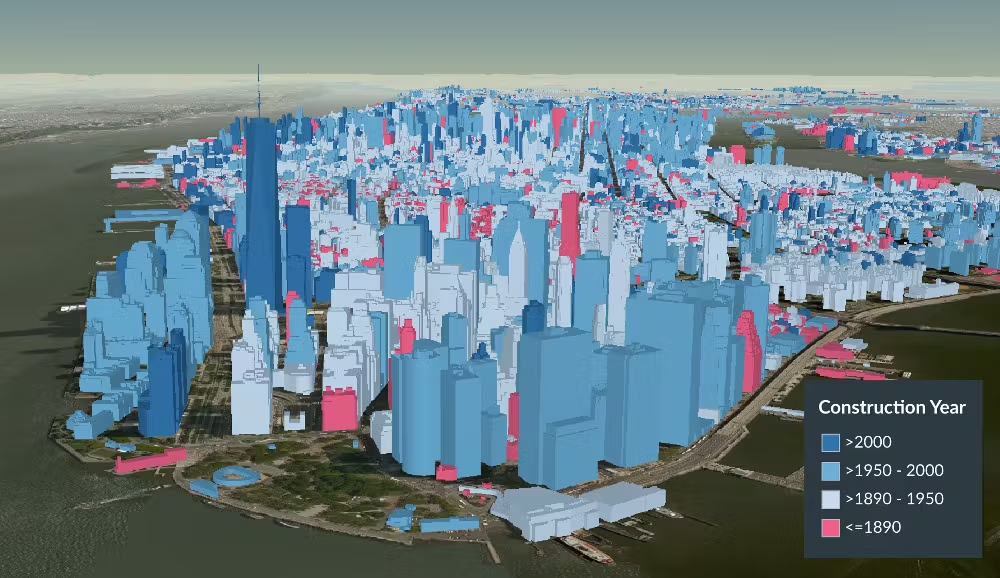
If you would like to see those features in QGIS and want to fund the efforts, do not hesitate to contact us.
-
sur Free and Open Source GIS Ramblings: MovingPandas v0.17 released!
Publié: 15 November 2023, 7:16pm CET

Over the last couple of months, I have not been posting release announcements here, so there is quite a bit to catch up.
The latest v0.17.2 release is now available from conda-forge.
New features (since 0.14):
- Improved MovingFeatures MF-JSON support
- New OutlierCleaner #334
- Faster stop detection #316
- New arrow markers to indicate trajectory direction in plots fb1174b
- Distance, speed, and acceleration unit handling #295
- New aggregation parameter (agg) for to_traj_gdf() 5745068
- New get_segments_between() for TrajectoryCollection #287
Behind the scenes:
- We now have a dedicated Github organization: [https:]] that houses all related repositories
- And we finally added [https] support to the website
As always, all tutorials are available from the movingpandas-examples repository and on MyBinder:

If you have questions about using MovingPandas or just want to discuss new ideas, you’re welcome to join our discussion forum.
-
sur Markus Neteler: Translating Open Source Software with Weblate: A GRASS GIS Case Study
Publié: 14 November 2023, 4:27pm CET
Open source software projects thrive on the contributions of the community, not only for the code, but also for making the software accessible to a global audience. One of the critical aspects of this accessibility is the localization or translation of the software’s messages and interfaces. In this context, Weblate (https://weblate.org/) has proven to be a powerful tool for managing these translations, especially for projects such as GRASS GIS, which is part of OSGeo (Open Source Geospatial Foundation).
What is Weblate?

Weblate is an open source translation management system designed to simplify the translation process of software projects. It provides an intuitive web interface that allows translators to work without deep technical knowledge. This ease of use combined with robust integration capabilities makes Weblate a popular choice for open source projects.
GRASS GIS and LocalizationGRASS GIS ( [https:]] ), a software suite for managing and analyzing geospatial data, is used worldwide and therefore needs to be available in many languages. The project uses Weblate, hosted by OSGeo, to manage and facilitate its translation work (see OSGeo-Weblate portal).
Marking messages for translationBefore translation work can begin, the messages to be translated must be marked for translation in the GRASS GIS source code. This is done with the gettext macro _(“…”). GNU gettext is a GNU library for the internationalization of software. Here is a simplified overview of the process:
- Identify the strings to be translated: The developers identify the strings in the source code that need to be translated. These are usually user messages, while debug messages are not marked for translation.
- Use the gettext macro: The identified strings are packed into a gettext macro. For example, a string “Welcome to GRASS GIS” in the source code would be changed to _(“Welcome to GRASS GIS”). This change indicates that the string should be used for translation.
- Extraction and template generation: Tools such as xgettext are used to extract these marked strings from the source code and create a POT (Portable Object Template) file. This file is used as a template for all translations. In the GRASS GIS project the template language is English.
There are three template files in the GRASS GIS project: one with the graphical user interface (GUI) messages, one with the library functions (libs) and one with the modules (mods).
Connecting the software project to WeblateWhile the POT files could be transferred to Weblate manually, we chose the automated option. The OSGeo Weblate instance is directly connected to the GRASS GIS project via git (GitHub) using the Weblate version control integration.
How it works in practice:
- Developer makes a commit to the GRASS GIS repo on GitHub
- A GitHub webhook makes a call to weblate.osgeo.org – note that it has it’s own local git repo for GRASS GIS, as it does for other OSGeo projects, with translations being managed in this Weblate instance. This local git repo is updated when the webhook is fired.
- As messages are translated in OSGeo-Weblate, they are eventually pushed to the Weblate Github fork of GRASS GIS (the push frequency is set to 24 hours by default, i.e., new translations are collected over a day), and Weblate then triggers a pull request to the main GRASS GIS repo on GitHub.
For technical background on the OSGeo Weblate installation, see the related OSGeo-SAC Weblate page.
Translation process in WeblateHere is how the typical translation process looks like:
- Translator registration: Registration (via OSGeo-ID) and login to the Weblate instance.
- Language selection: Select the language to be translated. If a language does not exist yet, it can be added with the approval of the project managers.
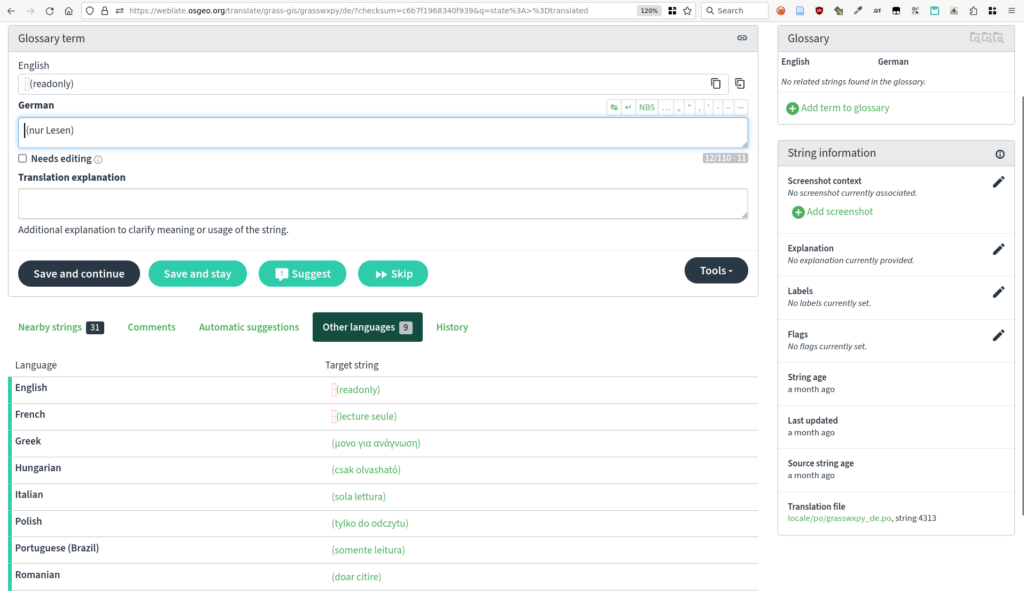
- Translation interface: Weblate provides an easy-to-use web interface where translators can view the original texts and enter their translations. If activated, machine translation can also be used here (DeepL, Google Translate, etc.). The Weblate translation memory helps to quickly translate identical and similar sentences.
GRASS GIS messages in Weblate
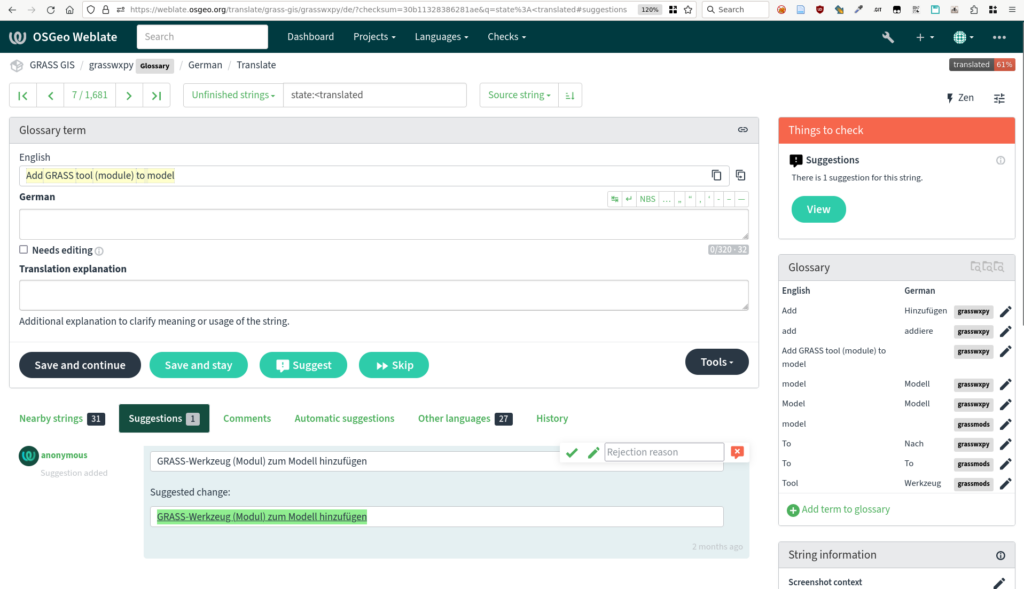
- Together we are better: translators can discuss translations, resolve conflicts and suggest improvements. Weblate also offers quality checks to ensure consistency and accuracy. Translations in different languages can be compared in tabular form.
Message translation comparison in Weblate (GRASS GIS project example)
- Integration with source code: Once translations are completed and checked, they are written back into the GRASS GIS source code (see above). Weblate supports automatic synchronization with source code repositories.
- Continuous updates: As the source code evolves, new strings can be marked for translation and Weblate is automatically updated to reflect these changes.

Pull request with new translations opened by Weblate in GRASS GIS Github repository
Benefits for the GRASS GIS projectBy using Weblate, GRASS GIS benefits from the following advantages:
- Streamlined translation workflow: The process from tagging strings to integrating translations is efficient and manageable.
- Community engagement: Weblate’s ease of use encourages more community members to participate in the translation process.
- Quality and Consistency: Weblate ensures high quality translations through integrated quality checks and collaboration tools.
- Up-to-date localization: Continuous synchronization with the source code repository ensures that translations are always up-to-date.
The integration of Weblate into the GRASS GIS development workflow underlines the importance of localization in open source software. By using tools such as gettext for message tagging and Weblate for translation management, GRASS GIS ensures that it remains accessible and usable for a global community, embodying the true spirit of open source software.
ThanksThanks to Regina Obe from OSGeo-SAC for her support in setting up and maintaining the OSGeo-Weblate instance and for her explanations of how things work in terms of Weblate/GitHub server communication.
The post Translating Open Source Software with Weblate: A GRASS GIS Case Study appeared first on Markus Neteler | Geospatial Analysis | Remote sensing | GRASS GIS.
-
sur Sean Gillies: Wellsville fall colors
Publié: 13 November 2023, 3:01am CET
After crashing out of the Bear, I picked myself up by going for a short hike in the Wellsville Mountains. This range frames Cache Valley on the west side and is covered with bigtooth maple.
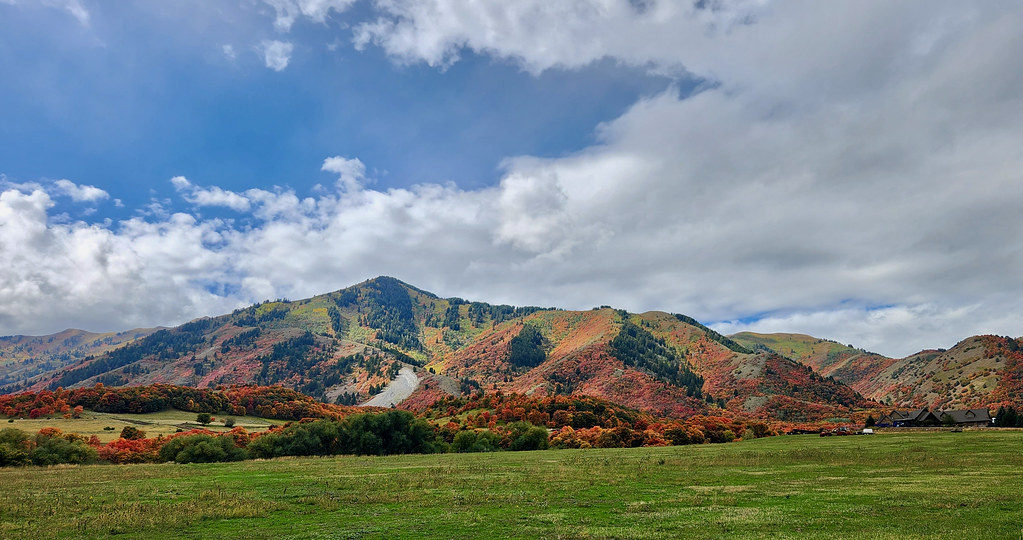
The Wellsville Range draped in red maples.
The colors made my jaw drop. I lived in Cache Valley for 10 years and don't remember a better show.
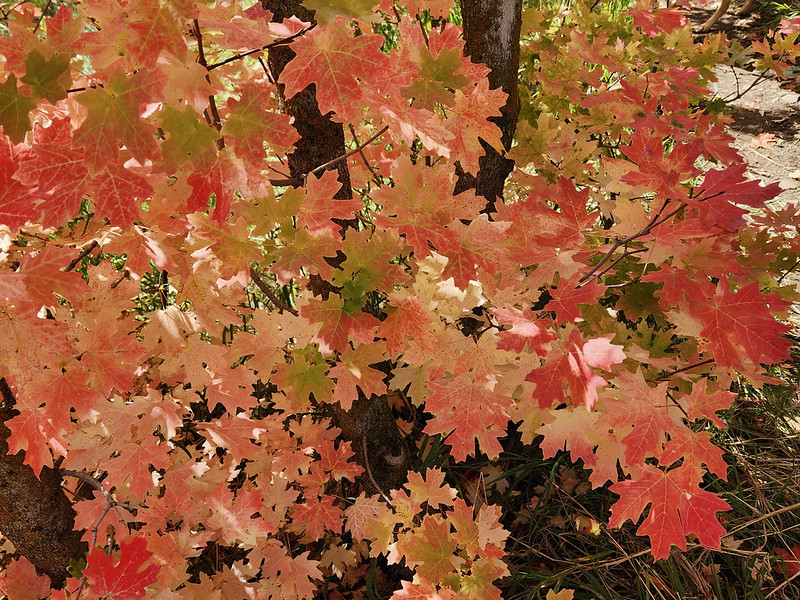
Closeup on pink and red maple leaves.
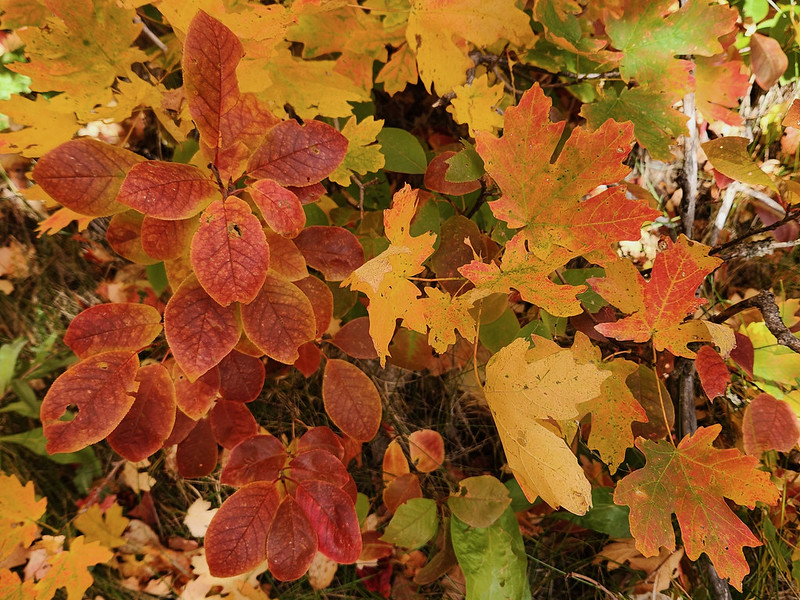
Dark red chokecherry leaves.
Hobbling through this landscape and seeing the color change as the sunlight fluctuated improved my mood by several hundred percent.

View across a sunlit pasture to red maple covered slopes under a partly stormy sky.
-
sur Ian Turton's Blog: Is GeoJSON a spatial data format?
Publié: 11 November 2023, 1:00am CET
Is GeoJSON a good spatial data format?A few days ago on Mastodon Eli Pousson asked:
Can anyone suggest examples of files that can contain location info but aren’t often considered spatial data file formats?
He suggested EXIF, Iván Sánchez Ortega followed up with spreadsheets, and being devilish I said GeoJSON.
This led to more discussion, with people asking why I thought that, so I instead of being flippant I thought about it. This blog post is the result of those thoughts which I thought were kind of obvious but from things people have said since may be aren’t that obvious.
I’ve mostly been a developer for most of my career so my main interest in a spatial data format is that:
- it stores my spatial data as I want it to,
- it’s fast to read and to a lesser extent, write.
- It’s easy to manage.
One, seems to be obvious, if I store a point then ask for it back I want to get that point back (to the limit of the precision of the processor’s floating point). If a format can’t manage that then please don’t use it. This is not common but Excel comes to mind as a program that takes good data and trashes it. If it isn’t changing gene names into dates then it’s reordering the dbf file to destroy your shapefile. GeoJSON also can fail at this as the standard says that I must store the data in WGS:84 (lon/lat), which is fine if that is the format that I store my data in already, but suppose I have some high quality OSGB data that is carefully surveyed to fractions of a millimetre and the underlying code does a conversion to WGS:84 in the background and further the developer wanted to save space and limited the number of decimal places to say 6 (OK, that was me) when it gets converted back to OSGB I’m looking at centimetres (or worse) but given the vagaries of floating point representation I may not be able to tell.
Two, comes from being a GeoServer developer, a largish chunk of the time taken to draw a web map (or stream out a WFS file) is taken up by reading the data from the disk. Much of the rest of the time is converting the data into a form that we can draw. Ideally, we only want to read in the features needed for the map the user has requested (actually, ideally we want to not read in most of the data by having it already be in the cache, but that is hard to do). So we like indexed datasets both spatial indexes and attribute indexes can help substantially speed up map drawing. As the size of spatial datasets increases the time taken to fetch the next feature from the store becomes more and more important. An index allows the program to skip to the correct place in the file for either a specific feature or for features that are in a specific place or contain a certain attribute with the requested value. This is a great time saver, imagine trying to look something up in a big book by using the index compared to paging through it reading each page in turn.
After one or more indexes the main thing I look for in a format is a binary format that is easy to read (and write). GeoJSON (and GML) are both problematic here as they are text formats (which is great in a transfer format) and so for every coordinate of every spatial object the computer has to read in a series of digits (and punctuation) and convert that into an actual binary number that it can understand. This is a slow operation (by computer speeds anyway) and if I have a couple of million points in my coastline file then I don’t want to do 4 million slow operations before I even think of drawing something.
Three, I have to interact with users on a fairly regular basis and in a lot of cases these are not spatial data experts. If a format comes with up to a dozen similarly named files (that are all important) that a GIS will refuse to process unless you guess which is the important one then it is more of a pain than a help. And yes shapefile I’m looking at you. If your process still makes use of Shapefiles please, please stop doing that to your users (and the support team) and switch over to GeoPackages which can store hundreds of data sets inside a single file, All good GIS products can process them by now, they have been an OGC standard for nearly 10 years. If you don’t think that shapefiles are confusing go and ask your support team how often they have been sent just the
.shpfile (or 11 files but not the.sbn) or how often they have seen people who have deleted all the none.shpfiles to save disk space.My other objection to GeoJSON is that I don’t know what the structure (or schema) of the data set is until I have read the entire file. That last record could add several bonus attributes, in fact any (or all) of the records could do that, from a parsers view it is a nightmare. At least GML provides me with a fixed schema and enforces it through out the file.
When I’m storing data (as opposed to transferring it) I use PostGIS, it’s fast and accurate, can store my data in whatever projection I chose and is capable of interfacing with any GIS program I am likely to use, and if I’m writing new code then it provides good, well tested libraries in all the languages I care about so I don’t have to get into the weeds of parsing binary formats. If I fetch a feature from PostGIS it will have exactly the attributes I was expecting no more or less. It has good indexes and a nifty DSL (SQL) that I can use to express my queries that get dealt with by a cool query optimiser that knows way more than I do about how to access data in the database.
If for some reason I need to access my data while I’m travelling or share it with a colleague then I will use a GeoPackage which is a neat little database all packaged up in a single file. It’s not a quick as PostGIS so I wouldn’t use it for millions of records but for most day to day GIS data sets it’s great. You can even store you QGIS styles and project in it to make it a single file project transfer format.
One final point, I sometimes see people preaching that we should go cloud native (and often serverless) by embracing “modern” standards like GeoJSON and COGs. GeoJSON should never be used as a cloud native storage option (unless it’s so small you can read it once and cache it in memory in which case why are you using the cloud) as it is large (yes, I know it compresses well) and slow to parse (and slower still if you compressed it first) and can’t be indexed. So that means you have to copy the whole file from a disk on the far side of a slow internet connection. I don’t care if you have fibre to the door it is still slow compared to the disk in your machine!
-
sur KAN T&IT Blog: Simplificá tu Análisis Geoespacial con KICa, el Innovador Plugin de QGIS para acceder a catálogos de Imágenes
Publié: 10 November 2023, 9:04pm CET
Pièce jointe: [télécharger]
KICa, «Kan Imagery Catalog», es un plugin para QGIS. Esta herramienta innovadora simplifica el acceso a catálogos de imágenes satelitales, en un principio, utilizando metodología estándar como es STAC (sigla en inglés de Catálogos de Recursos Espacio- Temporales) el cual es un lenguaje único para el acceso a catálogos de imágenes satelitales de una manera estándar y uniforme. Esto nos permite tener un objetivo agnóstico basado en la posibilidad de centrarnos en la necesidad de resolver nuestro análisis geoespacial sobre una zona y no tener que estar buscando cada uno de los proveedores por separado.
En un principio se incorporan proveedores de imágenes satelitales (gratuitas y comerciales), pero está previsto, en las siguientes versiones, incorporar imágenes de drones, vuelos entre otros recursos que faciliten el análisis geoespacial. Hoy podrán observar que están disponible los proveedores como UP42 o Sentinel Hub, dentro de una región geográfica definida por el usuario.
Con este potente plugin, los usuarios tienen la capacidad de explorar de manera eficiente los catálogos disponibles, así como consultar pisadas (footprints) y vistas rápidas (quicklooks) de las imágenes que se encuentran en su área de interés para estimar su uso sin la necesidad de ser descargada la imagen completa para su análisis.
Así, este plugin se convierte en una herramienta esencial para todos aquellos que trabajan con datos geoespaciales, ya que les proporciona un acceso rápido y sencillo a imágenes satelitales, facilitando tanto el análisis como la visualización de datos. No importa si sos un profesional en el campo de la geoinformación, un científico de datos o un entusiasta de la cartografía; «KICa» enriquecerá tu flujo de trabajo y mejorará tus capacidades de exploración y utilización de imágenes satelitales.
Nuestra solución es de código abierto y colaborativa, por lo que te invitamos a visitar nuestro repositorio donde podrás ver más documentación, reportar bugs y nuevas mejoras, y también contribuir en el código con tus “push request”.
¡Optimizá tus proyectos geoespaciales con esta valiosa herramienta!
#satellite #QGIS #SentinelHub #Copernicus #Sentinel -
sur Free and Open Source GIS Ramblings: Bringing QGIS maps into Jupyter notebooks
Publié: 10 November 2023, 7:03pm CET
Earlier this year, we explored how to use PyQGIS in Juypter notebooks to run QGIS Processing tools from a notebook and visualize the Processing results using GeoPandas plots.
Today, we’ll go a step further and replace the GeoPandas plots with maps rendered by QGIS.
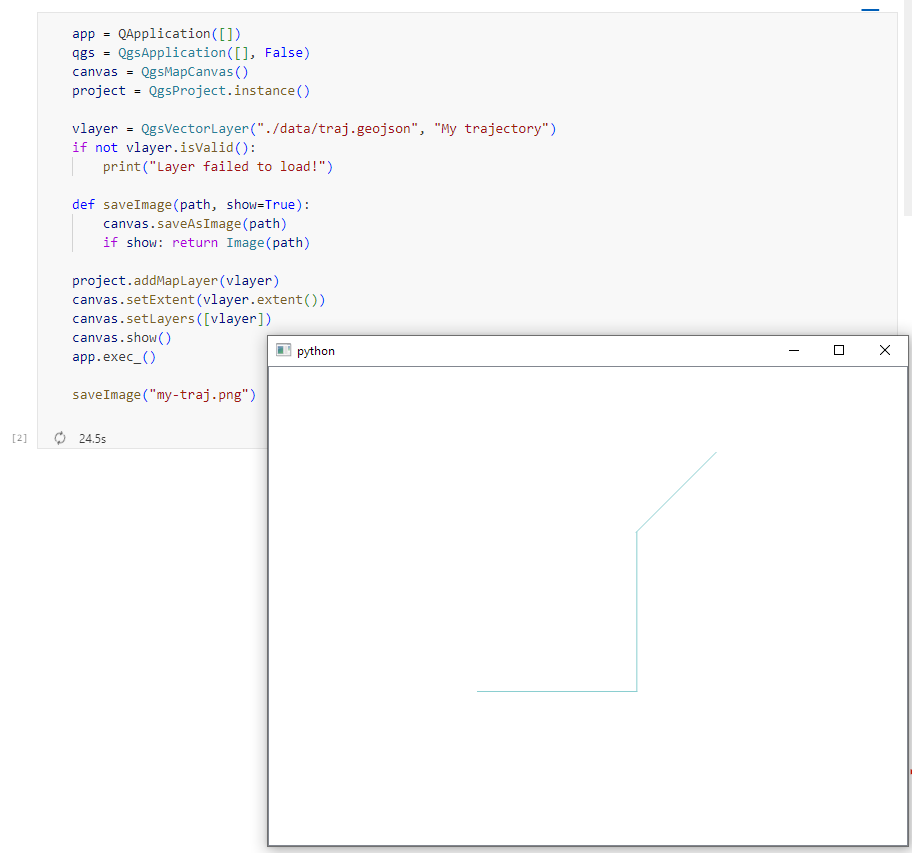
The following script presents a minimum solution to this challenge: initializing a QGIS application, canvas, and project; then loading a GeoJSON and displaying it:
from IPython.display import Image

from PyQt5.QtGui import QColor
from PyQt5.QtWidgets import QApplication

from qgis.core import QgsApplication, QgsVectorLayer, QgsProject, QgsSymbol, \
    QgsRendererRange, QgsGraduatedSymbolRenderer, \
    QgsArrowSymbolLayer, QgsLineSymbol, QgsSingleSymbolRenderer, \
    QgsSymbolLayer, QgsProperty
from qgis.gui import QgsMapCanvas

app = QApplication([])
qgs = QgsApplication([], False)
canvas = QgsMapCanvas()
project = QgsProject.instance()

vlayer = QgsVectorLayer("./data/traj.geojson", "My trajectory")
if not vlayer.isValid():
    print("Layer failed to load!")

def saveImage(path, show=True):
    canvas.saveAsImage(path)
    if show: return Image(path)

project.addMapLayer(vlayer)
canvas.setExtent(vlayer.extent())
canvas.setLayers([vlayer])
canvas.show()
app.exec_()

saveImage("my-traj.png")
When this code is executed, it opens a separate window that displays the map canvas. And in this window, we can even pan and zoom to adjust the map. The line color, however, is assigned randomly (like when we open a new layer in QGIS):
To specify a specific color, we can use:
vlayer.renderer().symbol().setColor(QColor("red"))

vlayer.triggerRepaint()
canvas.show()
app.exec_()
saveImage("my-traj.png")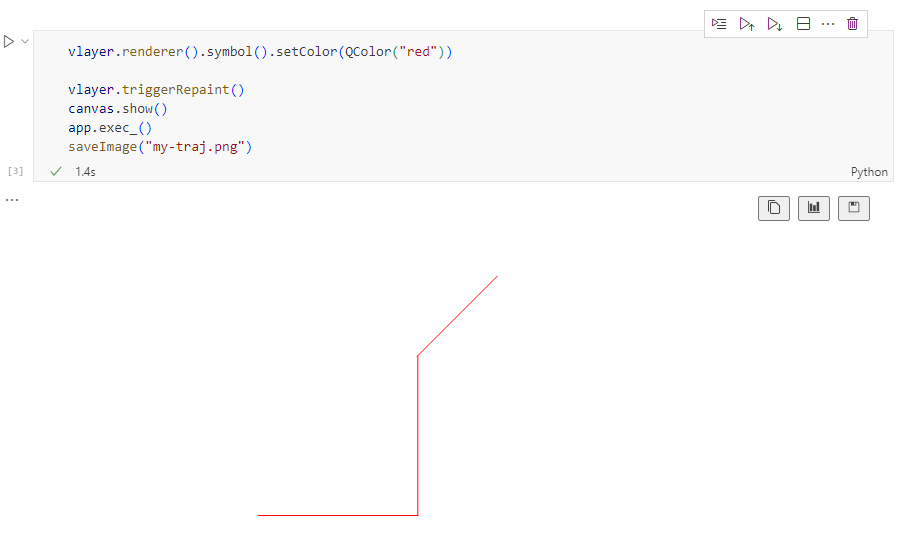
But regular lines are boring. We could easily create those with GeoPandas plots.
Things get way more interesting when we use QGIS’ custom symbols and renderers. For example, to draw arrows using a QgsArrowSymbolLayer, we can write:
vlayer.renderer().symbol().appendSymbolLayer(QgsArrowSymbolLayer())

vlayer.triggerRepaint()
canvas.show()
app.exec_()
saveImage("my-traj.png")
We can also create a QgsGraduatedSymbolRenderer:
geom_type = vlayer.geometryType()
myRangeList = []

symbol = QgsSymbol.defaultSymbol(geom_type)
symbol.setColor(QColor("#3333ff"))
myRange = QgsRendererRange(0, 1, symbol, 'Group 1')
myRangeList.append(myRange)

symbol = QgsSymbol.defaultSymbol(geom_type)
symbol.setColor(QColor("#33ff33"))
myRange = QgsRendererRange(1, 3, symbol, 'Group 2')
myRangeList.append(myRange)

myRenderer = QgsGraduatedSymbolRenderer('speed', myRangeList)
vlayer.setRenderer(myRenderer)

vlayer.triggerRepaint()
canvas.show()
app.exec_()
saveImage("my-traj.png")
And we can combine both QgsGraduatedSymbolRenderer and QgsArrowSymbolLayer:
geom_type = vlayer.geometryType()
myRangeList = []

symbol = QgsSymbol.defaultSymbol(geom_type)
symbol.appendSymbolLayer(QgsArrowSymbolLayer())
symbol.setColor(QColor("#3333ff"))
myRange = QgsRendererRange(0, 1, symbol, 'Group 1')
myRangeList.append(myRange)

symbol = QgsSymbol.defaultSymbol(geom_type)
symbol.appendSymbolLayer(QgsArrowSymbolLayer())
symbol.setColor(QColor("#33ff33"))
myRange = QgsRendererRange(1, 3, symbol, 'Group 2')
myRangeList.append(myRange)

myRenderer = QgsGraduatedSymbolRenderer('speed', myRangeList)
vlayer.setRenderer(myRenderer)

vlayer.triggerRepaint()
canvas.show()
app.exec_()
saveImage("my-traj.png")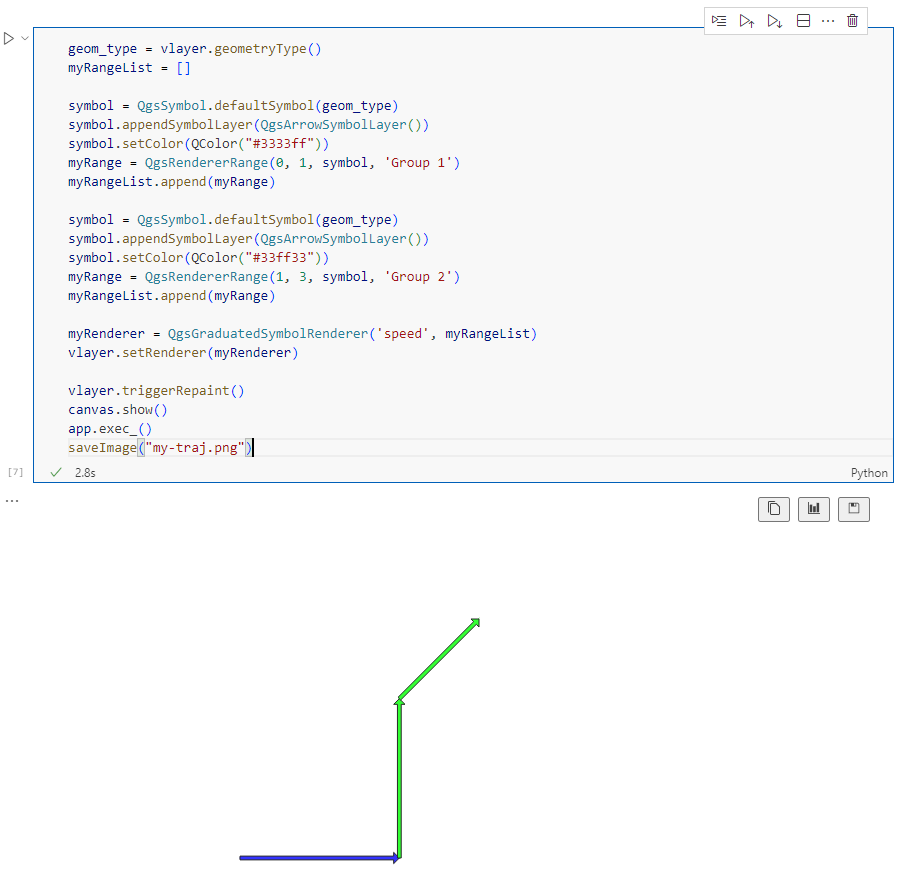
Maybe the most powerful option is to use data-defined symbology. For example, to control line width and color:
renderer = QgsSingleSymbolRenderer(QgsSymbol.defaultSymbol(geom_type))

exp_width = 'scale_linear("speed", 0, 3, 0, 7)'
exp_color = "coalesce(ramp_color('Viridis',scale_linear(\"speed\", 0, 3, 0, 1)), '#000000')"

# [https:] renderer.symbol().symbolLayer(0).setDataDefinedProperty(
    QgsSymbolLayer.PropertyStrokeWidth, QgsProperty.fromExpression(exp_width))
renderer.symbol().symbolLayer(0).setDataDefinedProperty(
    QgsSymbolLayer.PropertyStrokeColor, QgsProperty.fromExpression(exp_color))
renderer.symbol().symbolLayer(0).setDataDefinedProperty(
    QgsSymbolLayer.PropertyCapStyle, QgsProperty.fromExpression("'round'"))

vlayer.setRenderer(renderer)

vlayer.triggerRepaint()
canvas.show()
app.exec_()
saveImage("my-traj.png")
Find the full notebook at: [https:]]
-
sur Georg Heiler: Introduction to Geostatistics
Publié: 10 November 2023, 1:00am CET
Georg Heiler: Introduction to Geostatistics -
sur GRASS GIS: Apply Now for Student Grants
Publié: 9 November 2023, 9:12am CET
We would like to announce a unique paid opportunity for students to contribute to GRASS GIS! GRASS GIS will offer a number of student grants for projects that include development of GRASS documentation, tests, new features or geospatial tools and bug fixing. Check the suggested topics on the Student Grant wiki. Why to apply? Experience: Gain hands-on experience in a thriving open-source community. Mentorship: Work alongside experienced developers who will guide you throughout your journey. -
sur SIG Libre Uruguay: web gratuito «Asociación con EOS Data Analytics: Ventajas de su red de socios y soporte».
Publié: 7 November 2023, 5:14pm CET

Todo tipo de empresas y organizaciones orientadas a la agricultura están invitadas a asistir al seminario web, así como periodistas, activistas, y ecologistas interesados en la agricultura de precisión. Cuándo: 21 de noviembre Hora: 9 AM CST / 4 PM CET Los ponentes del seminario web serán: Dmytro Svyrydenko, Ejecutivo de cuentas, EOSD?
Pablo Ezequiel Escudero, Socio gerente, Agro Gestión
Esteban Moschin, Consultor de Negocios Independiente, Agro Gestión
Pablo Astudillo, Gerente General, BM Monitoring
Daniel Marulanda, Director General de Tecnología, GeoSatLos ponentes debatirán sobre los siguientes temas: Beneficios del Programa de socios y soporte de EOSDA.
Transformación de la agricultura en Argentina en los últimos 10 años. Cómo cambió en este tiempo el servicio de consultoría agrícola.
La agricultura de precisión en España. Gestores y asesores agrícolas y su rol en la transformación de la agricultura en el país.
El rol de los consultores y asesores agrícolas en Chile. Requisitos principales de los clientes para cubrir todas sus necesidades.
Solución de marca blanca, qué ventajas tiene y proyecto con la FAO. Recomendaciones para los clientes que quieren pasarse a marca blanca.Para obtener más información, presione aquí. Idioma: Español Duración: 1,5 horas. -
sur SIG Libre Uruguay: Tercera edición del curso online gratuito del BID: Cartografía y Geografía Estadística
Publié: 6 November 2023, 6:41pm CET
El curso está dirigido al personal y/o profesionales del mundo de la estadística y de la geografía que estén interesados en conocer cómo se utilizan los mapas para las investigaciones de campo y cuál es el papel que juega la cartografía y las ciencias geográficas como apoyo a la ciencia estadística. No es necesario que se cuente con conocimientos previos muy especializados en manejo de herramientas de Sistemas de Información Geográfica (SIG). Click en la imagen para más información.
-Este curso es auto-regulado y no cuenta con clases o sesiones sincrónicas-
-Este curso no tiene el acompañamiento de un tutor/a-
-
sur Free and Open Source GIS Ramblings: Exploring a hierarchical graph-based model for mobility data representation and analysis
Publié: 5 November 2023, 10:17pm CET
Today’s post is a first quick dive into Neo4J (really just getting my toes wet). It’s based on a publicly available Neo4J dump containing mobility data, ship trajectories to be specific. You can find this data and the setup instructions at:
Maryam Maslek ELayam, Cyril Ray, & Christophe Claramunt. (2022). A hierarchical graph-based model for mobility data representation and analysis [Data set]. Zenodo. [https:]
I was made aware of this work since they cited MovingPandas in their paper in Data & Knowledge Engineering: “The implementation combines several open source tools such as Python, MovingPandas library, Uber H3 index, Neo4j graph database management system”
Once set up, this gives us a database with three hierarchical levels:

Neo4j comes with a nice graphical browser that lets us explore the data. We can switch between levels and click on individual node labels to get a quick preview:


Level 2 is a generalization / aggregation of level 1. Expanding the graph of one of the level 2 nodes shows its connection to level 1. For example, the level 2 port node “Audierne” actually refers to two level 1 nodes:
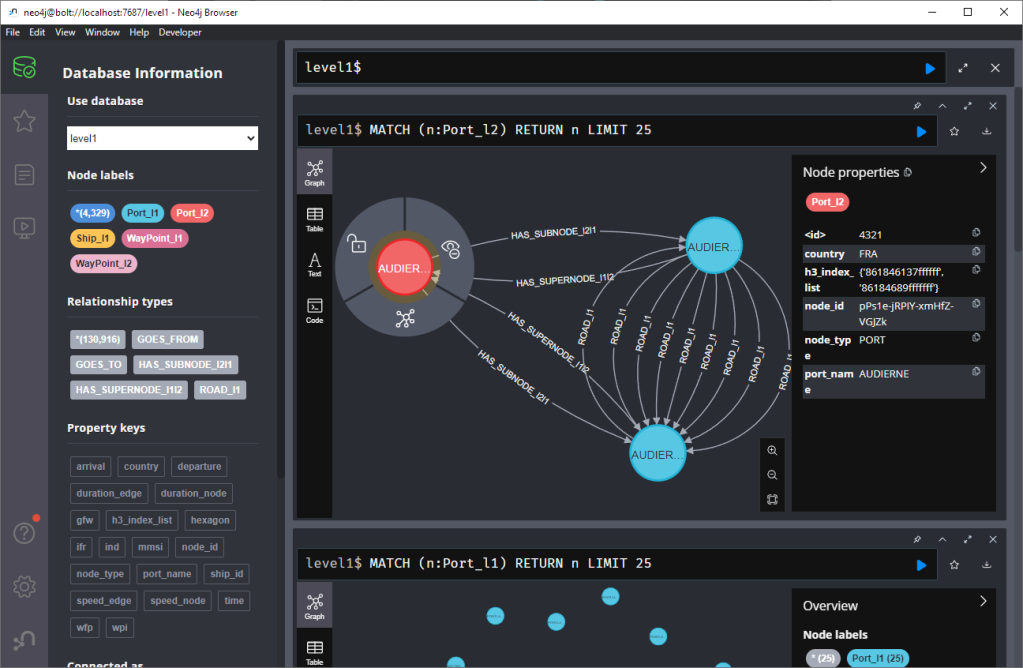
Every “road” level 1 relationship between ports provide information about the ship, its arrival, departure, travel time, and speed. We can see that this two level 1 ports must be pretty close since travel times are only 5 minutes:

Further expanding one of the port level 1 nodes shows its connection to waypoints of level1:

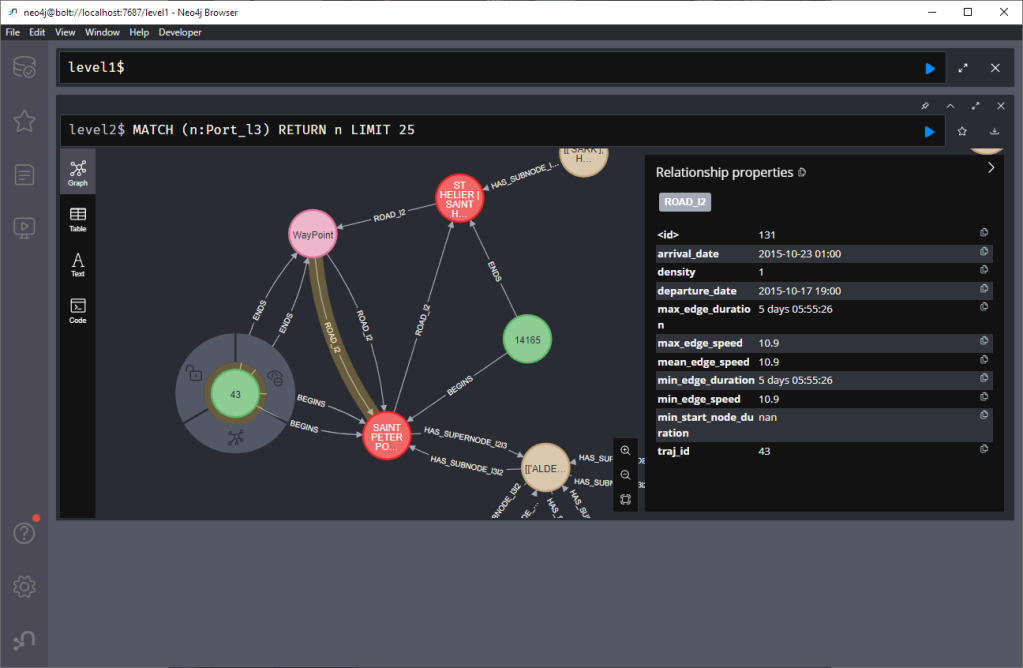
Switching to level 2, we gain access to nodes of type Traj(ectory). Additionally, the road level 2 relationships represent aggregations of the trajectories, for example, here’s a relationship with only one associated trajectory:

There are also some odd relationships, for example, trajectory 43 has two ends and begins relationships and there are also two road relationships referencing this trajectory (with identical information, only differing in their automatic <id>). I’m not yet sure if that is a feature or a bug:
On level 1, we also have access to ship nodes. They are connected to ports and waypoints. However, exploring them visually is challenging. Things look fine at first:
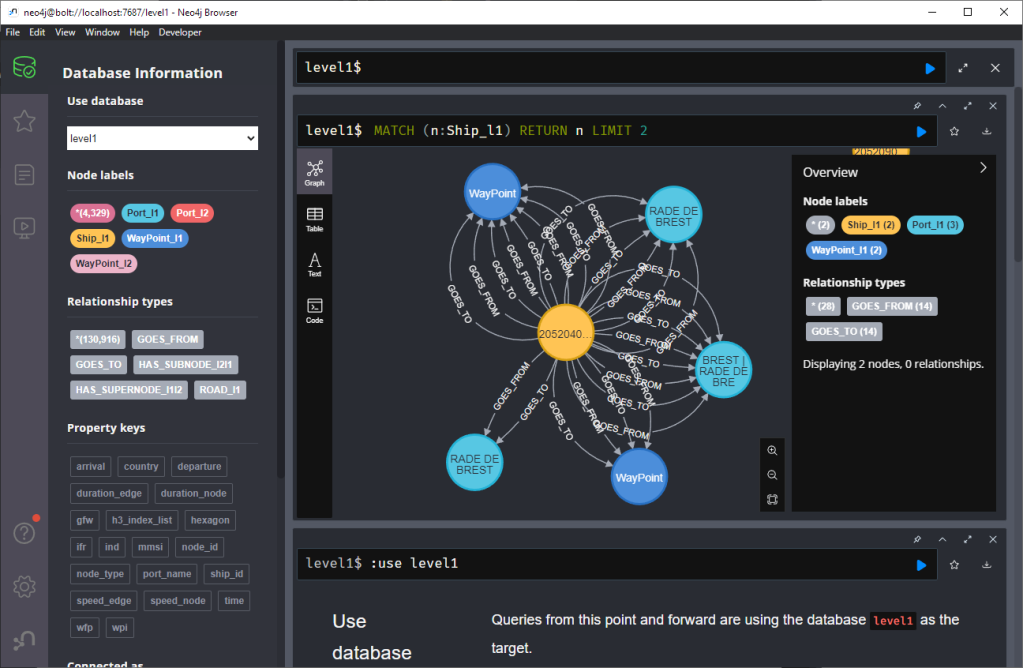
But after a while, once all relationships have loaded, we have it: the MIGHTY BALL OF YARN ™:

I guess this is the point where it becomes necessary to get accustomed to the query language. And no, it’s not SQL, it is Cypher. For example, selecting a specific trajectory with id 0, looks like this:
MATCH (t1 {traj_id: 0}) RETURN t1
But more on this another time.
This post is part of a series. Read more about movement data in GIS.
-
sur From GIS to Remote Sensing: Downloading free satellite images using the Semi-Automatic Classification Plugin: the Download product tab
Publié: 5 November 2023, 4:10pm CET
This is part of a series of video tutorials focused on the tools of the Semi-Automatic Classification Plugin (SCP).In this tutorial, the Download products tab is illustrated, which allows for downloading free satellite images such as Landsat and Sentinel-2.You can find more information in the user manual at this link.
Following the video tutorial.
For any comment or question, join the Facebook group or GitHub discussions about the Semi-Automatic Classification Plugin.
-
sur QGIS Blog: QGIS 3.34 Prizren is released!
Publié: 5 November 2023, 10:07am CET
We are pleased to announce the release of QGIS 3.34 Prizren!
Installers for Windows and Linux are already out. QGIS 3.34 comes with tons of new features, as you can see in our visual changelog. QGIS 3.34 Prizren is named after this year’s FOSS4G host city.
We would like to thank the developers, documenters, testers and all the many folks out there who volunteer their time and effort (or fund people to do so). From the QGIS community we hope you enjoy this release! If you wish to donate time, money or otherwise get involved in making QGIS more awesome, please wander along to qgis.org and lend a hand!
QGIS is supported by donors and sustaining members. A current list of donors who have made financial contributions large and small to the project can be seen on our donors list. If you would like to become a sustaining member, please visit our page for sustaining members for details. Your support helps us fund our six monthly developer meetings, maintain project infrastructure and fund bug fixing efforts.
QGIS is Free software and you are under no obligation to pay anything to use it – in fact we want to encourage people far and wide to use it regardless of what your financial or social status is – we believe empowering people with spatial decision making tools will result in a better society for all of humanity.
-
sur SIG Libre Uruguay: Premios Osor: gvSIG seleccionado entre los 6 mejores proyectos Open Source de la Comisión Europea
Publié: 3 November 2023, 6:20pm CET
-
sur SIG Libre Uruguay: XIII Jornada Educativa en Teledetección en el Ámbito del Mercosur
Publié: 3 November 2023, 6:15pm CET
Recibimos y publicamos: XIII Jornada de Educação em Sensoriamento Remoto no Âmbito do Mercosul
(click en la imagen para más información)

-
sur gvSIG Batoví: GIS DAY EN FACULTAD DE CIENCIAS FORESTALES (UNIVERSIDAD NACIONAL DE MISIONES)
Publié: 3 November 2023, 4:50pm CET

Con mucho gusto y honor Felipe Sodré Barros (Mgtr. Ecología y Biodiversidad) les hace la invitación a las actividades por el día SIG (GIS Day) organizado por sus alumnos de la Tecnicatura en SIG y Teledetección.

En una de ellas, tendremos la participación de Antoni Pérez Navarro, a quien agradecemos por la participación!

Existe un formulario de inscripción para facilitar la comunicación por si se necesita hacer algún cambio
-
sur SIG Libre Uruguay: GIS Day en Facultad de Ciencias Forestales (Universidad Nacional de Misiones)
Publié: 3 November 2023, 4:38pm CET

Con mucho gusto y honor Felipe Sodré Barros (Mgtr. Ecología y Biodiversidad) les hace la invitación a las actividades por el día SIG (GIS Day) organizado por sus alumnos de la Tecnicatura en SIG y Teledetección.

En una de ellas, tendremos la participación de Antoni Pérez Navarro, a quien agradecemos por la participación!

Existe un formulario de inscripción para facilitar la comunicación por si se necesita hacer algún cambio
-
sur GeoTools Team: GeoTools 29.3 released
Publié: 31 October 2023, 10:01am CET
The GeoTools team is pleased to announce the release of the latest maintenance version of GeoTools 29.3: geotools-29.3-bin.zip geotools-29.3-doc.zip geotools-29.3-userguide.zip geotools-29.3-project.zip This release is also available from the OSGeo Maven Repository and is made in conjunction with GeoServer 2.23.3 and GeoWebCache 1.23.2. We are -
sur Markus Neteler: GRASS GIS 8.3.1 released
Publié: 30 October 2023, 1:47pm CET
What’s new in a nutshellThe GRASS GIS 8.3.1 maintenance release provides more than 60 changes compared to 8.3.0. This new patch release brings in important fixes and improvements in GRASS GIS modules and the graphical user interface (GUI) which stabilizes the new single window layout active by default.
Some of the most relevant changes include: fixes for
r.watershedwhich got partially broken in the 8.3.0 release; and a fix for installing addons on MS Windows withg.extension.Translations continue in Weblate, which automatically creates pull requests with the translated chunks. We’d like to thank the translators of all languages for their ongoing support!
Full list of changes and contributors
For all 60+ changes, see our detailed announcement with the full list of features and bugs fixed at GitHub / Releases / 8.3.1.
Thanks to all contributors!
Software downloads Binaries/Installers download- Windows
- macOS
- Linux
Further binary packages for other platforms and distributions will follow shortly, please check at software downloads.
Source code downloadFirst time users may explore the first steps tutorial after installation.
About GRASS GIS
The Geographic Resources Analysis Support System ( [https:]] ), commonly referred to as GRASS GIS, is an Open Source Geographic Information System providing powerful raster, vector and geospatial processing capabilities. It can be used either as a stand-alone application, as backend for other software packages such as QGIS and R, or in the cloud. It is distributed freely under the terms of the GNU General Public License (GPL). GRASS GIS is a founding member of the Open Source Geospatial Foundation (OSGeo).
The GRASS Dev Team
The post GRASS GIS 8.3.1 released appeared first on Markus Neteler | Geospatial Analysis | Remote sensing | GRASS GIS.
-
sur Oslandia: QField 3.0 release : field mapping app, based on QGIS
Publié: 30 October 2023, 1:03pm CET
We are very happy and enthusiasts at Oslandia to forward the QField 3.0 release announcement, the new major update of this mobile GIS application based on QGIS.
Oslandia is a strategic partner of OPENGIS.ch, the company at the heart of QField development, as well as the QFieldCloud associated SaaS offering. We join OPENGIS.ch to announce all the new features of QField 3.0.
Shipped with many new features and built with the latest generation of Qt’s cross-platform framework, this new chapter marks an important milestone for the most powerful open-source field GIS solution.
Main highlightsUpon launching this new version of QField, users will be greeted by a revamped recent projects list featuring shiny map canvas thumbnails. While this is one of the most obvious UI improvements, countless interface tweaks and harmonization have occurred. From the refreshed dark theme to the further polishing of countless widgets, QField has never looked and felt better.
The top search bar has a new functionality that allows users to look for features within the currently active vector layer by matching any of its attributes against a given search term. Users can also refine their searches by specifying a specific attribute. The new functionality can be triggered by typing the ‘f’ prefix in the search bar followed by a string or number to retrieve a list of matching features. When expanding it, a new list of functionalities appears to help users discover all of the tools available within the search bar.
QField’s tracking has also received some love. A new erroneous distance safeguard setting has been added, which, when enabled, will dictate the tracker not to add a new vertex if the distance between it and the previously added vertex is greater than a user-specified value. This aims at preventing “spikes” of poor position readings during a tracking session. QField is now also capable of resuming a tracking session after being stopped. When resuming, tracking will reuse the last feature used when first starting, allowing sessions interrupted by battery loss or momentary pause to be continued on a single line or polygon geometry.
On the feature form front, QField has gained support for feature form text widgets, a new read-only type introduced in QGIS 3.30, which allows users to create expression-based text labels within complex feature form configurations. In addition, relationship-related form widgets now allow for zooming to children/parent features within the form itself.
To enhance digitizing work in the field, QField now makes it possible to turn snapping on and off through a new snapping button on top of the map canvas when in digitizing mode. When a project has enabled advanced snapping, the dashboard’s legend item now showcases snapping badges, allowing users to toggle snapping for individual vector layers.
In addition, digitizing lines and polygons by using the volume up/down hardware keys on devices such as smartphones is now possible. This can come in handy when digitizing data in harsh conditions where gloves can make it harder to use a touch screen.
While we had to play favorites in describing some of the new functionalities in QField, we’ve barely touched the surface of this feature-packed release. Other major additions include support for Near-Field Communication (NFC) text tag reading and a new geometry editor’s eraser tool to delete part of lines and polygons as you would with a pencil sketch using an eraser.
Thanks to Deutsches Archäologisches Institut, Groupements forestiers Québec, Amsa, and Kanton Luzern for sponsoring these enhancements.
Quality of life improvementsStarting with this new version, the scale bar overlay will now respect projects’ distance measurement units, allowing for scale bars in imperial and nautical units.
QField now offers a rendering quality setting which, at the cost of a slightly reduced visual quality, results in faster rendering speeds and lower memory usage. This can be a lifesaver for older devices having difficulty handling large projects and helps save battery life.
Vector tile layer support has been improved with the automated download of missing fonts and the possibility of toggling label visibility. This pair of changes makes this resolution-independent layer type much more appealing.
On iOS, layouts are now printed by QField as PDF documents instead of images. While this was the case for other platforms, it only became possible on iOS recently after work done by one of our ninjas in QGIS itself.
Many thanks to DB Fahrwgdienste for sponsoring stabilization efforts and fixes during this development cycle.
Qt 6, the latest generation of the cross-platform framework powering QFieldLast but not least, QField 3.0 is now built against Qt 6. This is a significant technological milestone for the project as this means we can fully leverage the latest technological innovations into this cross-platform framework that has been powering QField since day one.
On top of the new possibilities, QField benefited from years of fixes and improvements, including better integration with Android and iOS platforms. In addition, the positioning framework in Qt 6 has been improved with awareness of the newer GNSS constellations that have emerged over the last decade.
Forest-themed release namesForests are critical in climate regulation, biodiversity preservation, and economic sustainability. Beginning with QField 3.0 “Amazonia” and throughout the 3.X’s life cycle, we will choose forest names to underscore the importance of and advocate for global forest conservation.
Software with service
OPENGIS.ch and Oslandia provides the full range of services around QField and QGIS : training, consulting, adaptation, specific development and core development, maintenance and assistance. Do not hesitate to contact us and detail your needs, we will be happy to collaborate : infos+qfield@oslandia.com
As always, we hope you enjoy this new release. Happy field mapping!
-
sur gvSIG Team: 19th International gvSIG Conference: Communication proposals submission is open
Publié: 30 October 2023, 12:59pm CET

The 19th International gvSIG Conference “Connected solutions” will be held on November 29th and 30th, 2023. Within the in-person and online alternation, this year the conferences will be held as online event, which facilitates participation both in terms of presentations/workshops and attendance.
The communication proposals submission is now open, which can be sent to the email address conference-contact@gvsig.com, following the information indicated in the Communications section of the conference website.
As always, registration for the conference will be free of charge, and will be able to be done once the program has been published.
We encourage you to participate!
-
sur gvSIG Team: 19as Jornadas Internacionales de gvSIG: abierto el periodo de envío de propuestas de comunicación
Publié: 30 October 2023, 10:20am CET

Los días 29 y 30 de noviembre de 2023 tendrán lugar las 19as Jornadas Internacionales de gvSIG “Soluciones conectadas”. Dentro de la alternancia presencial-online, este año se realizan las jornadas en modalidad online, lo que facilita la participación tanto a nivel de ponencias/talleres como de asistencia.
Ya está abierto el periodo de envío de propuestas de comunicación, que pueden enviarse a la dirección de correo electrónico conference-contact@gvsig.com, siguiendo la información indicada en el apartado «Comunicaciones» de la web de las jornadas.
Como siempre, la inscripción a las jornadas será gratuita, y podrá realizarse una vez publicado el programa de las mismas.
¡Os animamos a participar!
-
sur GeoServer Team: GeoServer 2.23.3 Release
Publié: 30 October 2023, 1:00am CET
GeoServer 2.23.3 release is now available with downloads (bin, war, windows), along with docs and extensions.
This is a maintenance release of GeoServer providing existing installations with minor updates and bug fixes. GeoServer 2.23.3 is made in conjunction with GeoTools 29.3, and GeoWebCache 1.23.2.
Thanks to Peter Smythe (AfriGIS) for making this release.
Security PatchesThis release includes security patches from projects that GeoServer depends on and is considered a recommended upgrade for production systems.
- GEOS-11030 Update jetty-server to 9.4.51.v20230217
See project security policy for more information on how security vulnerabilities are managed.
Also, another reminder of the URL check security setting that was introduced to series 2.22.x and 2.23.x (but turned off by default) and is now enabled by default for series 2.24.x. If you are not yet in a position to upgrade to 2.24.0 you may wish to enable the recommended setting already.
Release notesNew Feature:
- GEOS-11000 WPS process to provide elevation profile for a linestring
Improvement:
- GEOS-10856 geoserver monitor plugin - scaling troubles
- GEOS-11081 Add option to disable GetFeatureInfo transforming raster layers
- GEOS-11087 Fix IsolatedCatalogFacade unnecessary performance overhead
- GEOS-11089 Performance penalty adding namespaces while loading catalog
- GEOS-11090 Use Catalog streaming API in WorkspacePage
- GEOS-11099 ElasticSearch DataStore Documentation Update for RESPONSE_BUFFER_LIMIT
- GEOS-11100 Add opacity parameter to the layer definitions in WPS-Download download maps
- GEOS-11102 Allow configuration of the CSV date format
- GEOS-11114 Improve extensibility in Pre-Authentication scenarios
- GEOS-11116 GetMap/GetFeatureInfo with groups and view params can with mismatched layers/params
- GEOS-11120 Create aggregates filterFunction in OSEO to support STAC Datacube extension implementation
- GEOS-11130 Sort parent role dropdown in Add a new role
- GEOS-11142 Add mime type mapping for yaml files
- GEOS-11148 Update response headers for the Resources REST API
- GEOS-11149 Update response headers for the Style Publisher
- GEOS-11153 Improve handling special characters in the WMS OpenLayers Format
- GEOS-11155 Add the X-Content-Type-Options header
Bug:
- GEOS-10452 Use of Active Directory authorisation seems broken since 2.15.2 (LDAP still works)
- GEOS-11032 Unlucky init order with GeoWebCacheExtension gwcFacade before DiskQuotaMonitor
- GEOS-11138 Jetty unable to start cvc-elt.1.a / org.xml.sax.SAXParseException
- GEOS-11140 WPS download can leak image references in the RasterCleaner
- GEOS-11145 The GUI “wait spinner” is not visible any longer
- GEOS-11166 OGC API Maps HTML representation fail without datetime parameter
Task:
- GEOS-10248 WPSInitializer NPE failure during GeoServer reload
- GEOS-11030 Update jetty-server to 9.4.51.v20230217
- GEOS-11084 Update text field css styling to look visually distinct
- GEOS-11091 Upgrade spring-security to 5.7.10
- GEOS-11092 acme-ldap.jar is compiled with Java 8
- GEOS-11094 Bump org.hsqldb:hsqldb:2.7.1 to 2.7.2
- GEOS-11124 Update json dependency to 20230227 in geowebcache-rest
- GEOS-11141 production consideration for logging configuration hardening
For the complete list see 2.23.3 release notes.
About GeoServer 2.23 SeriesAdditional information on GeoServer 2.23 series:
- GeoServer 2.23 User Manual
- Drop Java 8
- GUI CSS Cleanup
- Add the possibility to use fixed values in Capabilities for Dimension metadata
- State of GeoServer 2.23
- GeoServer Feature Frenzy 2023
- GeoServer used in fun and interesting ways
- GeoServer Orientation
Release notes: ( 2.23.3 | 2.23.2 | 2.23.1 | 2.23.0 | 2.23-RC1 )
-
sur GeoCat: Cyber Resilience Act
Publié: 26 October 2023, 4:16pm CEST
As a small and medium business operating in Europe GeoCat BV is clearly affected by the forthcoming European Cyber Resilience Act (CRA). We are a proud open source company and are concerned about our friends and partners caught up in the uncertainty around this proposed legislation.
We applaud the goals of the CRA as security is a responsibility GeoCat handles with care on behalf of our customers and products.
GeoCat is proud of the products we offer our customers: GeoCat Live, GeoNetwork Enterprise and GeoServer Enterprise. Each of these products are offered with a clear vendor relationship, an aspect of which is the handling and communication of security vulnerabilities.
Part of the magic of free and open-source is the rich collaborations formed across industry, academia, and government working alongside non-governmental organizations and enthusiasts. We are concerned that the CRA as proposed places undue hardships on these relationships. These relationships form a network of trust, and cannot be reduced to a product relationship.
We encourage regulators to seek expert input at this time. With so much of technology based in free and open-source technology we encourage regulators to look at ways to support security priorities with a deeper understanding.
Dutch regulators are encouraged to read:
- Cyber Resilience Act
- Vrijschrift To Dutch Parliament: Eu Cyber Resilience Act Will Harm Competitiveness (Dutch)
The post Cyber Resilience Act appeared first on GeoCat B.V..
-
sur From GIS to Remote Sensing: Semi-Automatic Classification Plugin update: version 8.1
Publié: 26 October 2023, 2:26pm CEST
The Semi-Automatic Classification Plugin (SCP) has been updated to version 8.1 which solves a few bugs and in particular ease the installation of required dependencies.
This update automatically tries to install the required library Remotior Sensus in the plugin directory, if it is not already installed in the QGIS environment, which allows for using the main functions of SCP.However, it is still recommended to follow the installation instructions to download the required dependencies.
Moreover, an alternative Windows installation using the OSGeo4W network installer has been added to the user manual [https:]]
Also, the user manual describes the installation in macOS [https:]]
and Linux [https:]]
With this update the installation should work in most cases.
For any comment or question, join the Facebook group or GitHub discussions about the Semi-Automatic Classification Plugin.
-
sur gvSIG Team: Osor Awards: gvSIG selected among the top 6 open-source projects by the European Commission
Publié: 26 October 2023, 11:24am CEST

We have reason to celebrate. The gvSIG project, submitted by the Generalitat Valenciana and the gvSIG Association, has been chosen by the Osor Awards jury as one of the top 6 open-source projects. Undoubtedly, this is a recognition of the highest caliber for the work carried out by these institutions and the entire gvSIG community around the project.
About Osor Awards
The European Commission’s Open Source Observatory (OSOR) has organised the EU Public Services Open Source Achievement Awards to honour and showcase the best open source solutions and initiatives created by or for the public administrations in Europe.
As the title of the Awards indicates, the Jury focused on achievements of open source solutions and initiatives: the ambitious goals, determination in overcoming challenges, contribution towards furthering democracy, transparency and active participation of citizens in creating digital infrastructures serving constituents, the impact on their communities, and effective usage of public resources and exceptional response to solving problems.
Award ceremony
The representatives of the top 6 entries and the winner of the OSOR Community Award will be invited to Brussels for the event celebrating 15 years of our Observatory – OSOR Turns 15: From Pioneering to Mainstreaming Open Technologies in Public Services on 21 November 2023.
… We’re going to Brussels!
-
sur GRASS GIS: GRASS GIS 8.3.1 released
Publié: 25 October 2023, 5:42pm CEST
What’s new in a nutshell The GRASS GIS 8.3.1 maintenance release provides more than 60 changes compared to 8.3.0. This new patch release brings in important fixes and improvements in GRASS GIS modules and the graphical user interface (GUI) which stabilizes the new single window layout active by default. Some of the most relevant changes include: fixes for r.watershed which got partially broken in the 8.3.0 release; and a fix for installing addons on MS Windows with g. -
sur XYCarto: GRASS GIS, Docker, Makefile
Publié: 25 October 2023, 12:47am CEST
Small example of using Docker and Makefile to implement GRASS GIS. This blog is written to be complimentary to the Github repository found here. Included in this post is a more verbose explanation of what is happening in the Github repository. Users can explore the scripts to see the underlying bits that make it each step. The intention is to help simplify the GRASS set-up and execution of processes using GRASS operations.
TL;DR
GitHub repository is here with the method and documents.
Summary
This is a basic example of setting up scripted GRASS process through a Docker image and using a
makefileto launch the process. The goal is remove the need to install GRASS on your machine and to fully containerize the process within Docker.It is assumed that users have a familiarity with Docker, Make, and GRASS.
In short, the repo is built to launch a GRASS environment and call a script with the users GRASS commands. Ideally, users should be able to clone the Github repository, build the Docker locally (or pull it), and run a simple
makecommand calling the primary script to perform the GRASS operations.Methods in the repository have been tested using Ubuntu and MacOS operating systems.
Important
This method is developed for scripting purposes and not intended for saving data in your GRASS environment. Using this method, each time the script is run the initial operation checks to see if a GRASS environment exists. If so, that environment is destroyed and a new environment is built.
Requirements
make
docker
Methods
If you prefer try out the commands given below, you will need to clone the Git repo:
git clone git@github.com:xycarto/grass-docker-make.git
These are the two primary commands to set-up the GRASS, Docker, Make operations. Users will first need to build a Docker containing the GRASS installation. Inside the
makefileare all the necessary components to find the Dockerfile and build the image. I’ve tagged this build with “xycarto” (see the top of the makefile); however, you can name this whatever you choose.Build GRASS Docker
make docker-local
Run GRASS Script
With the Docker image in place, you can test if the method is working by checking the GRASS version. This
makecommand uses two scripts. First, a script is called to construct the GRASS environment and then, call the script with all your GRASS operations. The second script is launched using:grass grass/GRASS_ENV/PERMANENT --exec bash grass-script.sh
The
—execindicates the script is run within the GRASS environment giving users access to all the GRASS capabilities.GRASS needs to run within a designated projection. Included in the
makecommand is a variable to set this. Users can implement any projection here using the EPSG value. The following is building a GRASS environment in New Zealand Transverse Mercator (NZTM), EPSG:2193:make grass-project proj="2193"
This should output the GRASS version installed in the Docker.
Modifications
Users can implement any GRASS commands and methods in the
run-grass.shscript, simply by modifying the file.How this can be used
File variables can be given to the GRASS process back in the
makecommand and passing this through therun-grass.shscript. For example, say you have a example.tif file you’d like to process in GRASS. Users can add a variable to the make file calledtif. It might look like this in the makefile:grass-project: $(RUN) bash run-grass.sh $(proj) $(tif)
The call of the command looks like:
make grass-project proj=“2193" tif=example.tif
Now with the makefile modified, you need to pass the variable through to the GRASS processing. First you need to modify the
run-grass.shscript to accept the new variable frommake. This can be done by adding the following line at the top:tif=$2
Where
$2means the second argument in the command given. Therun-grass.shscript now has the tif path variable. With this, you can now pass the path to the actual GRASS script by modifying the last line like so:grass grass/GRASS_ENV/PERMANENT --exec bash grass-script.sh $tif
The
grass-script.shcan now be modified to accept thetifvariable by adding the following line at the top:tif=$1
Once you get this all set up an running, the real power comes now in a scripted method run a large collection of tifs through a GRASS process.
Let’s say you have 1000 tifs that need to run. You can list these tifs and simply develop a method like the the following:
cat list-of-tifs.txt | xargs -P 1 -t -I % make grass-project proj=“2193" tif=%
This method would sequentially process the tif list through your GRASS process.
Having a hard time following? Please feel free to contact me and I’ll see if I can help.
-
sur Marco Bernasocchi: QField 3.0 “Amazonia” is here – Feature-packed and super slick.
Publié: 24 October 2023, 3:20pm CEST
Pièce jointe: [télécharger]
We’re so excited and proud of this latest QField version that we’ve opted for a major 3.0 version update.
Get it nowShipped with many new features and built with the latest generation of Qt’s cross-platform framework, this new chapter marks an important milestone for the most powerful open-source field GIS solution.
Main highlights
Upon launching this new version of QField, users will be greeted by a revamped recent projects list featuring shiny map canvas thumbnails. While this is one of the most obvious UI improvements, countless interface tweaks and harmonization have occurred. From the refreshed dark theme to the further polishing of countless widgets, QField has never looked and felt better.
The top search bar has a new functionality that allows users to look for features within the currently active vector layer by matching any of its attributes against a given search term. Users can also refine their searches by specifying a specific attribute. The new functionality can be triggered by typing the ‘f’ prefix in the search bar followed by a string or number to retrieve a list of matching features. When expanding it, a new list of functionalities appears to help users discover all of the tools available within the search bar.
QField’s tracking has also received some love. A new erroneous distance safeguard setting has been added, which, when enabled, will dictate the tracker not to add a new vertex if the distance between it and the previously added vertex is greater than a user-specified value. This aims at preventing “spikes” of poor position readings during a tracking session. QField is now also capable of resuming a tracking session after being stopped. When resuming, tracking will reuse the last feature used when first starting, allowing sessions interrupted by battery loss or momentary pause to be continued on a single line or polygon geometry.
On the feature form front, QField has gained support for feature form text widgets, a new read-only type introduced in QGIS 3.30, which allows users to create expression-based text labels within complex feature form configurations. In addition, relationship-related form widgets now allow for zooming to children/parent features within the form itself.
To enhance digitizing work in the field, QField now makes it possible to turn snapping on and off through a new snapping button on top of the map canvas when in digitizing mode. When a project has enabled advanced snapping, the dashboard’s legend item now showcases snapping badges, allowing users to toggle snapping for individual vector layers.
In addition, digitising lines and polygons by using the volume up/down hardware keys on devices such as smartphones is now possible. This can come in handy when digitizing data in harsh conditions where gloves can make it harder to use a touch screen.
While we had to play favourites in describing some of the new functionalities in QField, we’ve barely touched the surface of this feature-packed release. Other major additions include support for Near-Field Communication (NFC) text tag reading and a new geometry editor’s eraser tool to delete part of lines and polygons as you would with a pencil sketch using an eraser.
Thanks to Deutsches Archäologisches Institut, Groupements forestiers Québec, Amsa, and Kanton Luzern for sponsoring these enhancements.
Quality of life improvementsStarting with this new version, the scale bar overlay will now respect projects’ distance measurement units, allowing for scale bars in imperial and nautical units.
QField now offers a rendering quality setting which, at the cost of a slightly reduced visual quality, results in faster rendering speeds and lower memory usage. This can be a lifesaver for older devices having difficulty handling large projects and helps save battery life.
Vector tile layer support has been improved with the automated download of missing fonts and the possibility of toggling label visibility. This pair of changes makes this resolution-independent layer type much more appealing.
On iOS, layouts are now printed by QField as PDF documents instead of images. While this was the case for other platforms, it only became possible on iOS recently after work done by one of our ninjas in QGIS itself.
Many thanks to DB Fahrwgdienste for sponsoring stabilization efforts and fixes during this development cycle.
Qt 6, the latest generation of the cross-platform framework powering QFieldLast but not least, QField 3.0 is now built against Qt 6. This is a significant technological milestone for the project as this means we can fully leverage the latest technological innovations into this cross-platform framework that has been powering QField since day one.
On top of the new possibilities, QField benefited from years of fixes and improvements, including better integration with Android and iOS platforms. In addition, the positioning framework in Qt 6 has been improved with awareness of the newer GNSS constellations that have emerged over the last decade.
Forest-themed release names
Forests are critical in climate regulation, biodiversity preservation, and economic sustainability. Beginning with QField 3.0 “Amazonia” and throughout the 3.X’s life cycle, we will choose forest names to underscore the importance of and advocate for global forest conservation.
As always, we hope you enjoy this new release. Happy field mapping!
-
sur KAN T&IT Blog: Trabajo en conjunto con el INEC de Costa Rica
Publié: 23 October 2023, 9:51pm CEST
Estamos felices de anunciarles que desde Kan vamos a trabajar codo a codo con el Instituto Nacional de Estadística y Censos de Costa Rica (inec.cr).
Con la adopción del Marco Geoespacial y Estadístico Global (GSGF) propuesto por la ONU en América Latina y el Caribe a través de la Comisión Económica para América Latina y el Caribe (CEPAL), pondremos en marcha un conjunto de componentes tecnológicos específicos, incluyendo un gestor estadístico, un gestor de datos geoespaciales, APIs con posibilidad de consumir información de diferentes aplicaciones y un geoportal para visualizar, navegar y comparar la información estadística de este país.Al mismo tiempo, implementaremos componentes ya existentes en la comunidad como Kobo Toolbox, GeoNode, Airflow, MapLibre, Nominatim y Metabase para ofrecer una solución integral que abarque desde la recopilación de datos en terreno hasta la publicación de la información.

Esta plataforma será una valiosa herramienta tanto para gobiernos, investigadores, empresas como para cualquier persona interesada en obtener información actualizada y confiable sobre la región.
A medida de que vayamos avanzando, les contaremos más sobre este proyecto que nos tiene muy entusiasmados.
-
sur Stefano Costa: Research papers and case studies using iosacal
Publié: 23 October 2023, 6:30pm CEST
I have updated the documentation of iosacal with a new page that lists all research papers and case studies where the software gets a mention for being used.
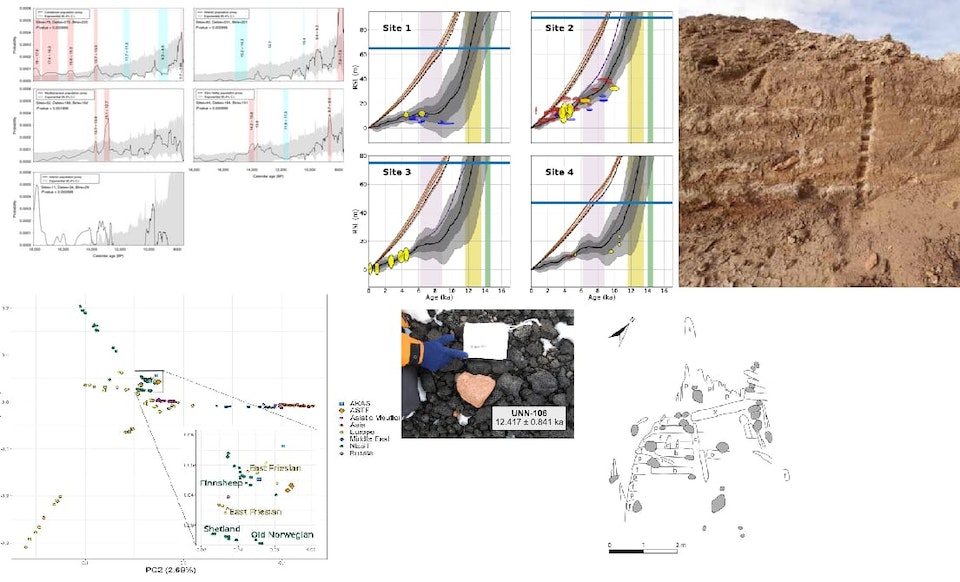 A collage of figures from the papers using iosacal
The list is at [https:]] and it’s longer than I thought, with 6 papers ranging from Norway to Antarctica, from the Last Glacial Maximum to the European Middle Ages.
It’s humbling to see this small piece of software find its way in so many research projects and I’m learning a lot by studying these publications.
Some authors contributed to iosacal with new features and bug fixes, and that is the most accurate metric of a healthy project that I can think of.
I’m going to add more useful content to the documentation as the main focus of the 0.7 release. In the meantime, you can continue using iosacal 0.6 in your research projects.
-
sur EOX' blog: VirES for (not only) Swarm - 2023 update
Publié: 23 October 2023, 2:00am CEST
It has been a while since the last blog post about VirES for Swarm, but don't let that make you think the level of activity has dropped. The service has moved from strength to strength and enjoys a continually growing number of users, a steady addition of features and datasets, and excitement about ... -
sur From GIS to Remote Sensing: Managing input bands using the Semi-Automatic Classification Plugin: the Band set tab
Publié: 22 October 2023, 11:46pm CEST
This is the first of a series of video tutorials focused on the tools of the Semi-Automatic Classification Plugin (SCP).In this tutorial, the Band set tab is illustrated, which allows for managing input bands.You can find more information in the user manual at this link.
Following the video tutorial.
For any comment or question, join the Facebook group or GitHub discussions about the Semi-Automatic Classification Plugin.
-
sur GeoServer Team: Introducing GeoSpatial Techno with a Video Tutorial
Publié: 20 October 2023, 2:00am CEST
This is a community blog post introducing Geospatial Techno, along with a sample of one of their GeoServer training videos.
GeoSpatial Techno is a startup focused on geospatial information that is providing e-learning courses to enhance the knowledge of geospatial information users, students, and other startups. The main approach of this startup is providing quality, valid specialized training in the field of geospatial information.
( YouTube | LinkedIn | Reddit | Facebook | X )
Getting to know OGC web services and GeoServer softwareThe course guides you in using GeoServer software to create geospatial web services, styles and publish them step by step simply and practically. Now, before delving into OGC web services, it is important to familiarize yourself with the various types of services.
In this session, we introduced you to the basics of the OGC web services and GeoServer software. If you want to access the complete tutorial, simply click on the link.
I would highly appreciate it if you could subscribe to my channel and share it with your friends to help spread this tutorial. By subscribing, you will gain complete access to the training video, which will enable you to enhance your skills. Moreover, sharing it with your friends guarantees that they can also benefit from this valuable resource. Thank you for your support.
What is Service?A collection of operations, accessible through an interface, that allows a user to invoke a behavior of value to the user.
What are Web Services?Web services are internet-based applications that can perform a wide range of functions, from simple tasks to complex business processes.
What are GeoSpatial Web Services?GeoSpatial web services are online platforms that offer access to and analyze geographical information. They aim to overcome the lack of compatibility between different geospatial systems.
Why do you need standard web services?Standard web services provide a common platform for communication between modern-day business applications that use different programming languages. This enables convenient interaction regardless of development language.
What is OGC?The Open Geospatial Consortium (OGC) is an international organization that promotes the use of open standards to make geospatial information and services to be “FAIR”, which stands for Findable, Accessible, Interoperable, and Reusable. This goal applies to various areas such as data sharing, data processing, sensor web, and the Internet of Things.
What are OGC Web Services?OGC Web Services (OWS) are a set of standards that allow for seamless integration of various online geoprocessing and location services. With OWS, users can access and utilize services such as the Web Map Service (WMS), Web Feature Service (WFS), Web Coverage Service (WCS), and Web Map Tile Service (WMTS).
WMS enables users to retrieve and obtain detailed information on maps of geospatial data. WFS allows for data manipulation operations on geographic features, including querying, creating, modifying, and deleting features. WCS provides access to raster datasets like elevation models and remote sensing imagery. WMTS serves pre-rendered or computed map tiles over the internet.
These services provide an interoperable framework for accessing, integrating, analyzing, and visualizing online geodata sources, sensor-derived information, and geoprocessing capabilities.
What is GeoServer?GeoServer is a Java-based server that allows users to view and edit geospatial data. Using open standards set forth by the Open Geospatial Consortium (OGC), GeoServer allows for great flexibility in map creation and data sharing.
Open and Share Your Spatial DataGeoServer is a powerful open-source tool for displaying spatial information through maps in various formats. The tool integrates OpenLayers, a free mapping library, for easy and quick map generation. Moreover, It supports standards like WMS, WFS, WCS, and WMTS, enabling data sharing, editing, and easy integration with web and mobile applications. With modular functionality and extensions, GeoServer offers extensive processing options. For example, the Web Processing Service (WPS) extension provides a wide range of processing options, and users can even create their extensions.
Use Free and Open Source SoftwareGeoServer is a free and open-source software that brings down the financial barrier to using GIS products. It is released every six months with new features, bug fixes, and improvements, providing a quick turnaround time. This transparent process often leads to faster advancements compared to closed software solutions. By using GeoServer, organizations can avoid software lock-in and save money on support contracts in the future.
Integrate With Mapping APIsGeoServer is a versatile software that can integrate with popular mapping applications like Google Maps and Microsoft Bing Maps. It can also connect with traditional GIS architectures such as ESRI ArcGIS. OpenLayers and Leaflet are recommended as complementary tools to GeoServer for web mapping needs.
Join the CommunityGeoServer has an active global community of users and developers, offering support through email lists. The software has a fixed release cycle and public issue tracker, ensuring transparency and regular updates. Commercial support is also available. Overall, using GeoServer means being part of a supportive community.
-
sur EOX' blog: Sentinel-2 cloudless 2022
Publié: 18 October 2023, 2:00am CEST
Introducing the latest marvel in Earth observation: Sentinel-2 Cloudless, the pinnacle of usability clarity in satellite imagery. This newest version takes your visual exploration to unprecedented heights, delivering pristine, cloud-free views of our planet with breathtaking detail and accuracy. Ev ... -
sur Markus Neteler: GRASS GIS 8.3.0 released
Publié: 17 October 2023, 6:58pm CEST
What’s new in a nutshellThe GRASS GIS 8.3.0 release provides more than 360 changes compared to the 8.2 branch. This new minor release brings in many fixes and improvements in GRASS GIS modules and the graphical user interface (GUI) which now has the single window layout by default. Some of the most relevant changes include: support for parallelization in three raster modules, new options added to several temporal modules, and substantial clean-up of
g.extension, the module that allows the installation of add-ons. The GUI also received a lot of attention with many fixes and items reorganised. We have also adopted the Clang format and indented most of the C code accordingly. A lot of effort was put into cleaning up the C/C++ code to fix almost all compiler warnings.Translations have been moved from Transifex to Weblate, which automatically creates pull requests with the translated chunks. We’d like to thank the translators of all languages for their long term support!
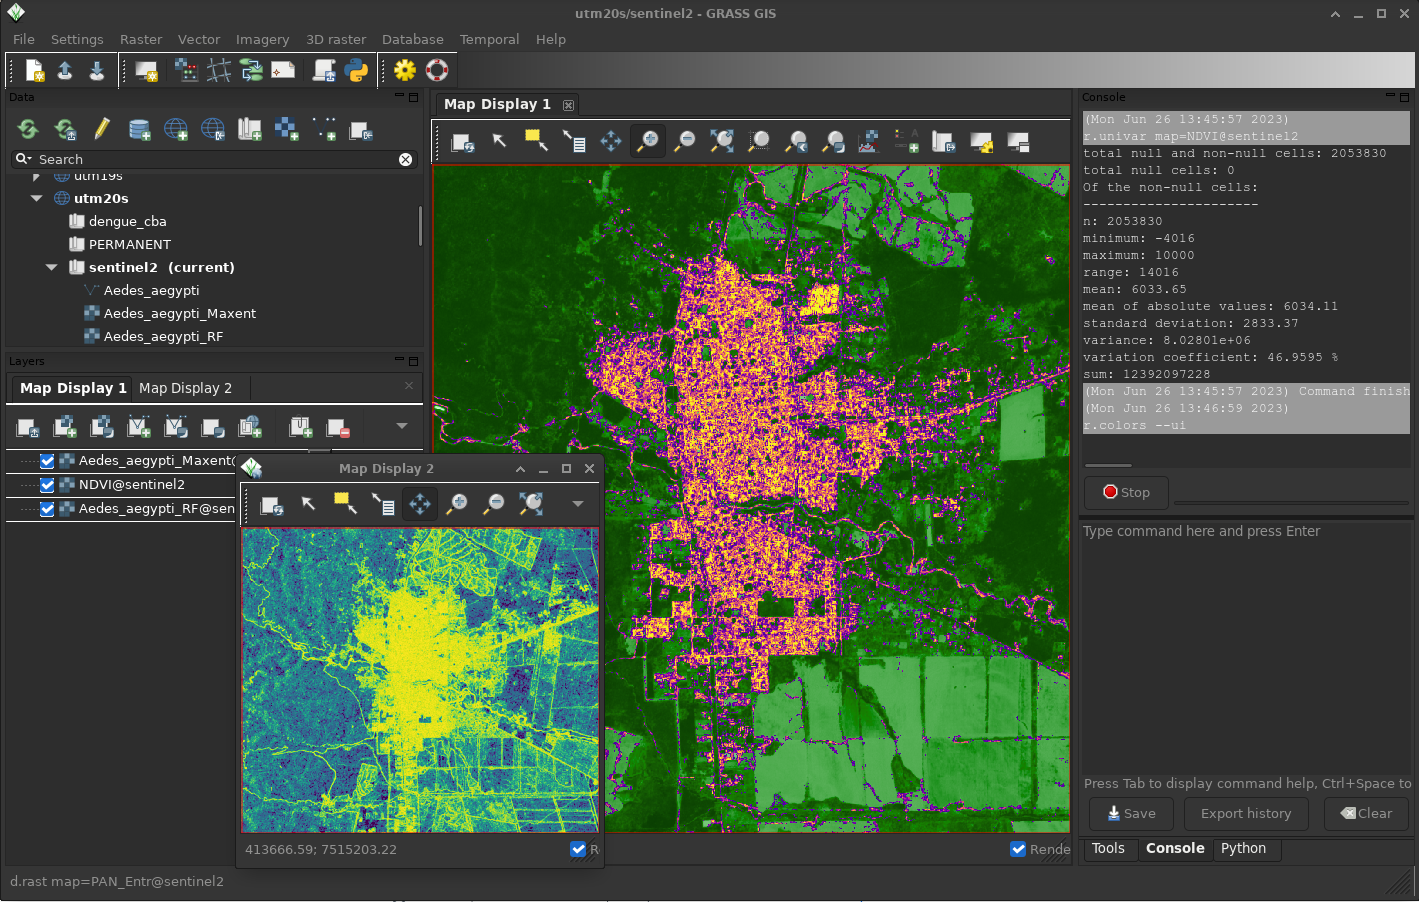
Also, docker images have been updated and moved from the mundialis to the OSGeo organization at https://hub.docker.com/r/osgeo/grass-gis/.
We have carried out quite some work in the GitHub Actions: we added support for “pre-commit” in order to reduce unnecessary runs of the automated checks, there were notable improvements in the code checking section and we have activated renovatebot to automatically maintain GitHub Actions.
Last but not least, we have significantly improved the automated release creation to reduce maintainer workload and we have gained nine new contributors! Welcome all!!
Full list of changes and contributorsFor all 360+ changes, see our detailed announcement with the full list of features and bugs fixed at GitHub / Releases / 8.3.0.
Thank you all contributors!!
Download and test! Binaries/Installers download- Windows
- macOS
- Linux
Further binary packages for other platforms and distributions will follow shortly, please check at software downloads.
Source code downloadFirst time users may explore the first steps tutorial after installation.
About GRASS GIS
The Geographic Resources Analysis Support System ( [https:]] ), commonly referred to as GRASS GIS, is an Open Source Geographic Information System providing powerful raster, vector and geospatial processing capabilities. It can be used either as a stand-alone application, as backend for other software packages such as QGIS and R, or in the cloud. It is distributed freely under the terms of the GNU General Public License (GPL). GRASS GIS is a founding member of the Open Source Geospatial Foundation (OSGeo).
The GRASS Dev Team
The post GRASS GIS 8.3.0 released appeared first on Markus Neteler | Geospatial Analysis | Remote sensing | GRASS GIS.
-
sur GeoTools Team: GeoTools 30.0 released
Publié: 15 October 2023, 11:13pm CEST
The GeoTools team is pleased to announce the release of the latest stable version of GeoTools 30.0: geotools-30.0-bin.zip geotools-30.0-doc.zip geotools-30.0-userguide.zip geotools-30.0-project.zip This release is also available from the OSGeo Maven Repository and is made in conjunction with GeoServer 2.24.0, GeoWebCache 1.24.0 and MapFish Print v2 -
sur GeoServer Team: GeoServer 2.24.0 Release
Publié: 15 October 2023, 2:00am CEST
GeoServer 2.24.0 release is now available with downloads (bin, war, windows), along with docs and extensions.
This is a stable release of GeoServer recommended for production use. GeoServer 2.24.0 is made in conjunction with GeoTools 30.0, mapfish-print-v2 2.3.0 and GeoWebCache 1.24.0.
Thanks to Peter Smythe (AfriGIS) and Jody Garnett (GeoCat) for making this release.
Thanks to everyone who helped test the release candidate: JP Motaung & Nicolas Kemp, Georg Weickelt, Peter Smythe, Tobia Di Pisa, and Giovanni Allegri.
We would like to thank our 2023 sponsors North River Geographic Systems Inc and How 2 Map for their financial assistance.
Keeping GeoServer sustainable requires a long term community commitment. If you were unable to contribute time testing the release candidate, sponsorship options are available via OSGeo.
Upgrade NotesGeoServer strives to maintain backwards compatibility allowing for a smooth upgrade experience.
We have one minor change to share in this release:
-
URL Checks: The url check security setting is now enabled by default.
In GeoServer 2.22.5 and 2.23.2 this setting was available for use, but was turned off by default. If you are not yet in a position to upgrade to 2.24.0 you may wish to enable the recommended setting.
This release addresses security vulnerabilities and is considered an essential upgrade for production systems.
- CVE-2023-43795 WPS Server Side Request Forgery
- CVE-2023-41339 Unsecured WMS dynamic styling sld=url parameter affords blind unauthenticated SSRF
See project security policy for more information on how security vulnerabilities are managed.
IAU authority support and EPSG assumption removalThe new gs-iau extension module provides support for planetary CRSs, sourced from the International Astronomical Union. This allows users to manage GIS data over the Moon, Mars, or even the Sun, with well known, officially supported codes.
In addition to that, many bug fixes occurred in the management of CRSs and their text representations (plain codes, URL, URIs) so that the EPSG authority is no longer assumed to be the only possibility, in a variety of places, such as, for example, GML output. The code base has seen this assumption for twenty long years already, and while we made a good effort to eliminate the assumption, it could be still lurking in some places. Please test and let us know.
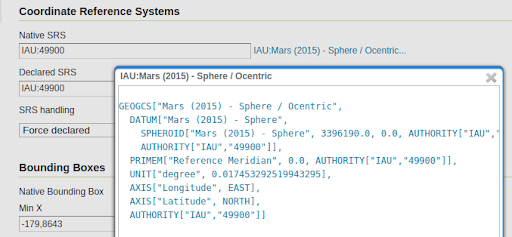
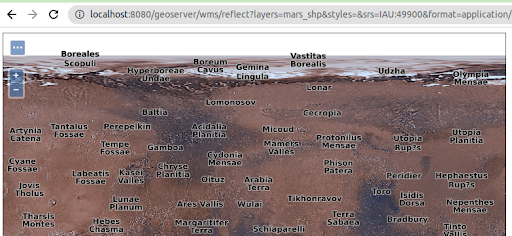
To learn more about this extension please visit the user-guide documentation. Thanks to Andrea Aime (GeoSolutions) for working on this activity.
- GSIP-219 - Multiple CRS authority support, planetary CRS
- GEOS-11075 IAU authority : planetary CRS support
- GEOS-11001 Support other CRS authorities in WFS
- GEOS-11002 Support other CRS authorities in WMS
- GEOS-11056 Support other CRS authorities in WCS
- GEOS-11064 Support other CRS authorities in WPS
- GEOS-11066 Support other CRS authorities in importer
- GEOS-11076 SRSList should show authorities other than EPSG, if available
- GEOS-10970 CatalogBuilder cannot handle CRS in authorities other than EPSG
- GEOS-10971 XStreamPersister cannot save CRS references using authorities other than EPSG
- GEOS-10972 Resource page CRS editors would not work with authorities other than EPSG
The printing extension has seen big changes - with a host of new functionality developed by GeoSolutions over the years. With this update the printing module can now be used out-of-the-box by GeoNode and MapStore (no more customization required).
This update covers the release of MapFish Print 2.3.0 (and restores website user-guide).
GeoServer documentation has been updated with configuration options covering the new functionality.
- Max number of columns configuration for multi column legends
- Simple colored box icon in legends
- Explicit support of GeoServer CQL_FILTER parameter (also with layers merge support): wiki
- Legend fitting
- Don’t break legend items
- Reorder legends block in columns
- Images content
- Dynamic images page
- Multipage legends
- Custom intervals in ScalebarBlock
- Clustering Support wiki
- HTML rendering in text blocks
- Extra Pages
- Group Rendering in attribute blocks
- Skip rendering of pages
- Automatic X-Forwarded-For
- Parsing of Base64 encoded images
Thanks to GeoSolutions for adding functionality to mapfish-print for the GeoNode project. Shout out to Tobia Di Pisa and Giovanni Allegra for integration testing. Jody Garnett (GeoCat) was responsible for updating the mapfish print-lib for Java 11 and gathering up the functionality from different branches and forks. And integrating the updated configuration instructions with the GeoServer User Guide.
- GEOS-11159 Update mapfish-print-lib 2.3.0
The previous 2.23 series added a new Check URL facility under the Security menu, but it was turned off by default, for backwards compatibility reasons. This functionality allows administrators to manage OGC Service use of external resources.
This has been included in GeoServer 2.22.x and 2.23.x series for backwards compatibility.
Backwards compatibility note:: This functionality is turned ON by default from GeoServer 2.24.0 onwards.
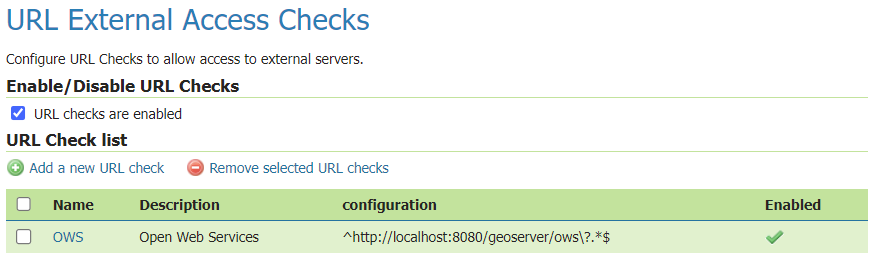
For information and examples on how to use the URL Check page, visit user guide documentation.
- GSIP 218 - Control remote HTTP requests sent by GeoTools \ GeoServer
- GEOS-10949 Control remote resources accessed by GeoServer
- GEOS-11048 Improve URL checking
This release follows a revised security policy. Our existing “responsible disclosure policy” has been renamed, the practice is now called “coordinated vulnerability disclosure.” Last year we enabled GitHub private vulnerability reporting, we will now use these facilities to issue CVE numbers.
Coordinated vulnerability disclosure
Disclosure policy:
- The reported vulnerability has been verified by working with the geoserver-security list
- GitHub security advisory is used to reserve a CVE number
- A fix or documentation clarification is accepted and backported to both the “stable” and “maintenance” branches
- A fix is included for the “stable” and “maintenance” downloads (released as scheduled, or issued via emergency update)
- The CVE vulnerability is published with mitigation and patch instructions
This represents a balance between transparency and participation that does not overwhelm participants. Those seeking greater visibility are encouraged to volunteer with the geoserver-security list; or work with one of the commercial support providers who participate on behalf of their customers.
This change has already resulted in improved interaction with security researchers.
Thanks to Jody Garnett (GeoCat) for this proposal on behalf of GeoCat Live customers.
Developer updates Internal refactor to remove “org.opengis” package usageThe GeoTools project moved away from using the
org.opengispackage after complaints from OGC GeoAPI working group representatives, using the same package name. Interfaces have been moved to theorg.geotool.apipackage, along with some general clean up.While this does not affect GeoServer users directly, it’s of consequence for those that have installations with custom, home grown plugins that might have to be migrated as a consequence. For those, the GeoTools project offers a migration guide, along with a refactoring script that might perform the migration for you, or else, get you close to a working point. GeoServer itself has been migrated using these scripts, with minimal manual intervention.
For more details, and access to the migration script, please see the GeoTools 30 upgrade guide.
Thanks to Jody Garnett (GeoCat), Andrea Aime (GeoSolutions), and Ian Turton (ASTUN Technologies) for all the hard work on this activity. We would also like to thank the Open Source Geospatial Foundation for setting up a cross-project activity and financial support to address this requested change.
- GEOS-11070 Upgrading to GeoTools 30.x series, refactor to
org.geotools.apiinterfaces
While not strictly part of this release, it’s interesting to know about some community module advances that can be found only in the the 2.24.x series.
Two extensions are no longer actively supported and are now available as community modules:
- GEOS-10960 Downgrade imagemap module to community
- GEOS-10961 Downgrade xslt extension to community
The following community modules have been removed (due to lack of interest):
- GEOS-10962 Remove wms-eo community module
- GEOS-10963 Remove SAML community module
- GEOS-10966 Remove importer-fgdb community module
- GEOS-10967 Remove teradata community module
- GEOS-10977 Remove wmts-styles community module
- GEOS-10978 Remove nsg-wmts community module
- GEOS-10984 Remove ows-simulate community module
The OGC API community module keeps improving. In particular, thanks to the GeoNovum sponsorship, GeoSolutions made the OGC API Features module pass the OGC CITE compliance tests, for the “core” and “CRS by reference” conformance classes. Along with this work, other significant changes occurred:
- Made the API version number appear in the service path, easing future upgrades
- Support for configurable links, required to get INSPIRE download service compliance.
In addition to that, the new “search” experimental conformance class allows to POST complex searches against collections, as a JSON document, in a way similar to the STAC API.
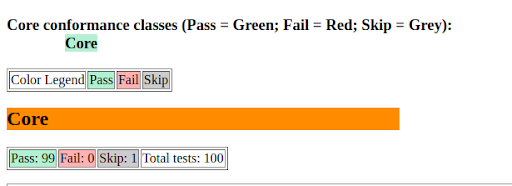
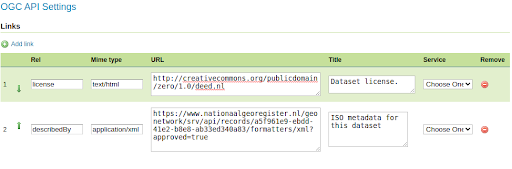
Those interested in this work are encouraged to contact Andrea Aime (GeoSolutions).
- GEOS-10924 Support JSON-FG draft encoding in OGC API - Features
- GEOS-11045 Implement proposal “OGC API - Features - Part n: Query by IDs”
- GEOS-10882 Add an option to remove trailing slash match in OGC APIs
- GEOS-10887 Add angle brackets to OGC API CRS Header
- GEOS-10892 Allow configuring custom links for OGC API “collections” and single collection resources
- GEOS-10895 Make OGC API CITE compliant even if the trailing slash is disabled: landing page exception
- GEOS-11058 Support other CRS authorities in OGC APIs
- GEOS-10909 Don’t link from OGC API Features to WFS 2.0 DescribeFeatureType output, if WFS is disabled
- GEOS-10954 Split ogcapi community module package into single functionality packages
For folks working with very large catalogues some improvement from cloud native geoserver are now available to reduce startup time.
Thanks to Gabriel Roldan for folding this improvement into a community module for the rest of the GeoServer community to enjoy.
- GEOS-11049 Community module “datadir catalog loader”
The GeoServer Access Control List project is an independent application service that manages access rules, and a GeoServer plugin that requests authorization limits on a per-request basis.
Gabriel Roldan is the contact point for anyone interested in this work.
The vector mosaic and FlatGeoBuf modules sport significant performance improvementsFlatGeoBuf is a “performant binary encoding for geographic data”, a single file format that also manages to be cloud native and include a spatial index. GeoServer provides access to this format thought the WFS FlatGeobuf output format, which not only can write the format, but also read it as a standard data store.
The Vector Mosaic datastore supports creation of mosaics made of single file vector data, useful in situations where the access to data is targeted to sub-pages of a larger data set (e.g., data for a single time, or a single customer, or a single data collect, out of a very large uniform set of vectors) and the database storage for it has become either too slow, or too expensive.
These two modules make a great combo for those in need to handle very large vector datasets, by storing the FlatGeoBuf on cheap storage.
In particular, the FlatGeoBuf module saw speed improvements that made it the new “fastest vector format” for cases where one needs to display a large data set, all at once, on screen (PostGIS remains the king of the hill for anything that needs sophisticated filtering instead).
For reference, we have timed rendering 4 million tiny polygons out of a precision farming collect, using a 7 classes quantile based SLDs. Here is a tiny excerpt of the map:
And here are the timings to render the full set of polygons, putting them all on screen, at the same time, with a single GetMap request:
- PostGIS, 113 seconds
- Shapefile, 41 seconds
- Flatgeobuf, 36 seconds
The tuning is not complete, more optimizations are possible. Interested? Andrea Aime is the contact point for this work.
Release notes(Including the changes made in 2.24-RC, the release candidate)
Improvement:
- GEOS-11114 Improve extensibility in Pre-Authentication scenarios
- GEOS-11130 Sort parent role dropdown in Add a new role
- GEOS-11142 Add mime type mapping for yaml files
- GEOS-11148 Update response headers for the Resources REST API
- GEOS-11149 Update response headers for the Style Publisher
- GEOS-10926 Community Module Proxy-Base-Ext
- GEOS-10934 CSW does not show title/abstract on welcome page
- GEOS-10973 DWITHIN delegation to mongoDB
- GEOS-10999 Make GeoServer KML module rely on HSQLDB instead of H2
- GEOS-11005 Make sure H2 dependencies are included in the packages of optional modules that still need it
- GEOS-11059 Map preview should not assume EPSG authority
- GEOS-11081 Add option to disable GetFeatureInfo transforming raster layers
- GEOS-11087 Fix IsolatedCatalogFacade unnecessary performance overhead
- GEOS-11090 Use Catalog streaming API in WorkspacePage
- GEOS-11099 ElasticSearch DataStore Documentation Update for RESPONSE_BUFFER_LIMIT
- GEOS-11100 Add opacity parameter to the layer definitions in WPS-Download download maps
- GEOS-11102 Allow configuration of the CSV date format
- GEOS-11116 GetMap/GetFeatureInfo with groups and view params can with mismatched layers/params
Bug:
- GEOS-11138 Jetty unable to start cvc-elt.1.a / org.xml.sax.SAXParseException
- GEOS-11140 WPS download can leak image references in the RasterCleaner
- GEOS-11145 The GUI “wait spinner” is not visible any longer
- GEOS-8162 CSV Data store does not support relative store paths
- GEOS-10452 Use of Active Directory authorisation seems broken since 2.15.2 (LDAP still works)
- GEOS-10874 Log4J: Windows binary zip release file with log4j-1.2.14.jar
- GEOS-10875 Disk Quota JDBC password shown in plaintext
- GEOS-10899 Features template escapes twice HTML produced outputs
- GEOS-10903 WMS filtering with Filter 2.0 fails
- GEOS-10921 Double escaping of HTML with enabled features-templating
- GEOS-10922 Features templating exception on text/plain format
- GEOS-10928 Draft JSON-FG Implementation for OGC API - Features
- GEOS-10936 YSLD and OGC API modules are incompatible
- GEOS-10937 JSON-FG reprojected output should respect authority axis order
- GEOS-10958 Update Spotbugs to 4.7.3
- GEOS-10981 Slow CSW GetRecords requests with JDBC Configuration
- GEOS-10985 Backup Restore of GeoServer catalog is broken with GeoServer 2.23.0 and StAXSource
- GEOS-10993 Disabled resources can cause incorrect CSW GetRecords response
- GEOS-11015 geopackage wfs output builds up tmp files over time
- GEOS-11016 Docker nightly builds use outdated GeoServer war
- GEOS-11033 WCS DescribeCoverage ReferencedEnvelope with null crs
- GEOS-11060 charts and mssql extension zips are missing the extension
Task:
- GEOS-11134 Feedback on download bundles: README, RUNNING, GPL html files
- GEOS-11141 production consideration for logging configuration hardening
- GEOS-11091 Upgrade spring-security to 5.7.10
- GEOS-11094 Bump org.hsqldb:hsqldb:2.7.1 to 2.7.2
- GEOS-11103 Upgrade Hazelcast version to 5.3.x
- GEOS-10248 WPSInitializer NPE failure during GeoServer reload
- GEOS-10904 Bump jettison from 1.5.3 to 1.5.4
- GEOS-10907 Update spring.version from 5.3.25 to 5.3.26
- GEOS-10941 Update ErrorProne to 2.18
- GEOS-10987 Bump xalan:xalan and xalan:serializer from 2.7.2 to 2.7.3
- GEOS-10988 Update spring.version from 5.3.26 to 5.3.27 and spring-integration.version from 5.5.17 to 5.5.18
- GEOS-11010 Upgrade guava from 30.1 to 32.0.0
- GEOS-11011 Upgrade postgresql from 42.4.3 to 42.6.0
- GEOS-11012 Upgrade commons-collections4 from 4.2 to 4.4
- GEOS-11018 Upgrade commons-lang3 from 3.8.1 to 3.12.0
- GEOS-11019 Upgrade commons-io from 2.8.0 to 2.12.0
- GEOS-11020 Add test scope to mockito-core dependency
- GEOS-11062 Upgrade [httpclient] from 4.5.13 to 4.5.14
- GEOS-11063 Upgrade [httpcore] from 4.4.10 to 4.4.16
- GEOS-11067 Upgrade wiremock to 2.35.0
- GEOS-11080 Remove ASCII grid output format from WCS
- GEOS-11084 Update text field css styling to look visually distinct
- GEOS-11092 acme-ldap.jar is compiled with Java 8
For the complete list see 2.24.0 release notes.
About GeoServer 2.24 SeriesAdditional information on GeoServer 2.24 series:
-
-
sur From GIS to Remote Sensing: Basic Land Cover Classification Using the Semi-Automatic Classification Plugin
Publié: 14 October 2023, 6:18pm CEST
This is the first tutorial of the new Semi-Automatic Classification Plugin version 8. This tutorial describes the essential steps for the classification of a multispectral image (i.e., a modified Copernicus Sentinel-2 image):- Define the Band set and create the Training Input File
- Create the ROIs
- Create a Classification Preview
- Create the Classification Output
Following the video of this tutorial.
The detailed steps of this tutorial are described in the user manual, at the following link [https:]]
I am going to write other tutorials to describe the available classification algorithms, and the other tools of the Semi-Automatic Classification Plugin.
For any comment or question, join the Facebook group or GitHub discussions about the Semi-Automatic Classification Plugin.
-
sur GRASS GIS: Apply Now for New Mentoring Program
Publié: 11 October 2023, 10:12am CEST
The GRASS GIS project is launching a new mentoring program to help students, researchers, and software developers integrate GRASS GIS into their projects. Mentoring will be provided free of charge by experienced GRASS developers in a one-on-one setting allowing for remote and asynchronous communication. Mentors will work with participants to select the most appropriate and efficient tools and techniques to run and integrate GRASS tools into the participants’ workflow and provide advice and feedback during the implementation. -
sur EOX' blog: Data Gravity, the Source Cooperative and hopeful thoughts...
Publié: 9 October 2023, 2:00am CEST
TL;DR understand the cost drivers in your "open data" strategy, long-term don't neglect the ecosystem gravitating around the actual data you can outsource data promotion but not data governance allow a neutral cooperative to track uptake and share analytics The term data gravity describes the observ ... -
sur Camptocamp: Camptocamp at GéoDataDays 2023
Publié: 9 October 2023, 2:00am CEST
Pièce jointe: [télécharger]
Held in Reims, France, GéoDataDays 2023 was a major event in the world of geomatics and digital mapping. -
sur From GIS to Remote Sensing: Semi-Automatic Classification Plugin version 8 officially released
Publié: 8 October 2023, 12:45am CEST
I am glad to announce the release of the new version 8 (codename "Infinity") of the Semi-Automatic Classification Plugin (SCP) for QGIS.
This new version is based on a completely new Python processing framework that is Remotior Sensus, which expands the processing capabilities of SCP, also allowing for the creation of Python scripts.
The following video provides an introduction to the SCP tools.
Read more » -
sur Sean Gillies: Bear 100 recap
Publié: 7 October 2023, 1:35am CEST
A week ago I started the Bear 100 Endurance Run. I did not finish. This was my first DNF. I'm still trying to figure out what went wrong and evaluate how I responded.
To recap: I rolled into the sixth aid station, Tony Grove, mile 51, at 9:59 p.m. I made a head to toe gear change. Underwear, pants, hat, socks, and shoes. Diaper ointment lube on my feet and privates. Ate potatoes and chicken noodle soup and refilled my bottles. I spent too much time there, but this was going to be my main stop before dawn, and I wanted to get properly set up for 8 hours of plugging through the night. I left at 10:43 p.m.
Somewhere around mile 59, descending into Franklin Basin, my left ankle stopped working, and I limped into the Franklin Basin aid station (mile 62). After 15 minutes of triage, I decided to quit. I had no flexibility or stability in my left foot, and continuing seemed pointless.
What happened? I couldn't remember a single major incident. I'd had a number of little wobbles earlier in the day and the descent from Tony Grove was pretty rough. I certainly picked up a little damage along the way. And I'd sprained this ankle four weeks ago. Maybe it wasn't strong enough to go 100 miles. It's possible that I fell asleep on my feet at 1:30 a.m. and rolled it. I was certainly sleepy enough at some points. Either the accumulation of stress was too much for my ankle, or an acute injury happened while I was checked out. Or both. I don't know for sure.
I'm disappointed. Otherwise, things were going well. My gear choices were solid. I was eating and drinking well enough. Other than one toenail lost to kicking a rock, my feet were fine, no hotspots or blisters. My ankle was swollen for several days, but I didn't go far enough to wreck my quads or hips. Sigh.
I will try this again.
More about the race, photos, stories, etc, soon.
-
sur SIG Libre Uruguay: IV Convención Científica Internacional UCLV 2023
Publié: 4 October 2023, 7:29pm CEST

La Universidad Central “Marta Abreu” de Las Villas, Institución de Excelencia de la Educación Superior en Cuba, convoca a la IV Convención Científica Internacional de Ciencia, Tecnología y Sociedad UCLV 2023, bajo el lema “Ciencia e Innovación para el Desarrollo Sostenible.”
Podrán participar investigadores, académicos, docentes, directivos, empresarios, decisores de políticas de gobierno, estudiantes y otros actores sociales, implicados en la actividad de ciencia e innovación y protección del medio ambiente, además, contaremos con la presentación de conferencias magistrales de expertos de reconocido prestigio internacional y nacional, así como se desarrollarán otras actividades científicas desde una perspectiva multidisciplinar e intersectorial.
Se contará tambien con la modalidad de participación virtual, facilitando a través de la plataforma la transmisión en vivo de actividades que se especificarán en el programa del evento.
El encuentro se desarrollará del 13 al 17 de noviembre de 2023, en el destino turístico Cayos de Villa Clara: Santa María, Cuba.

Destacamos especialmente el II Simposio Internacional sobre «Generación y Transferencia de Conocimiento para la Transformación Digital» SITIC2023, donde se desarrollarán un número importante de actividades: conferencias, curso, talleres. A continuación, la agenda
-
sur QGIS Blog: Call for Proposals: QGIS Website Overhaul 2023/2024
Publié: 3 October 2023, 6:45pm CEST
 Background
Our web site ( [https:]] ) dates back to 2013, it is time for a revision!
As well as modernizing the look and feel of the site, we want the content to be updated to represent changes in the maturity of the project.
We want to appeal to new audiences, especially business and NGO decision makers (in particular the experience for the front pages), whilst still maintaining appeal to grass roots users (especially the lower level pages which contain many technical details and community collaboration notes).
We want to enhance our fund raising efforts through a site that encourages people to contribute to, as well as take from, the project.
 Existing effort
First some key links:
- Current web site: [https:]
- Design for new web site landing page: [https:]]
- Design for new web site (figma): [https:]]
- Code for new web site (what we have built so far): [https:]]
- Plugins web site: [https:]]
- QGIS Documentation Site: [https:]]
- QGIS User Manual: [https:]]
- QGIS Server Manual: [https:]]
- Gentle Introduction to GIS: [https:]]
- QGIS Python Cookbook: [https:]]
- QGIS C++ API Documentation: [https:]]
- QGIS Python API Documentation: [https:]]
- QGIS Certification and Changelog: [https:]]
The above websites were created with a mix of technologies:
- Sphinx (rst)
- Doxygen
- Custom Django Apps
It will not be possible to unify the technology used for all of the above sites, but we want all of the web sites to have a cohesive appearance and the navigation flow between them to be seamless. For the main website at [https:]] and its child pages, we want to re-implement the site to provide a new experience – according to the design we have laid out in our figma board. Note that we want to follow this design. Some small tweaks will be fine but we are not looking for a ‘from scratch’ re-implementation of our design.
This will be our website for the next 10 years – you need to hand it over to us in a way that we can continue working on it and maintaining it without your intervention.
We are calling for proposals to help us with this migration as per the phases described below.
Phase 1?: Project planning Timeline
 Proposed site structure
- What content will be kept
- What will be removed
- What is new to be added
- Keep front page as starting point
- Suggest tweaks if needed
- Establish a clear vocabulary of page types
- Second and third level page design
- Special pages such as
- Download
- Release countdown
- Donation / sustaining members
- Gallery
- and any other you identify as non-standard second/third level
- Guidance and standards for producing visuals like screenshots etc. For example, how we present QGIS screenshots in a flattering way.
- Establish a plan for auxiliary sites:
- Plugins.qgis.org
- Api.qgis.org
- Docs.qgis.org
- etc. (see intro for more exhaustive list)
- Iterative review and feedback from the QGIS web team should be incorporated from biweekly check in calls.
Phase 2?: Content migration of the main site Outcome: We have a clear roadmap and design guide for migrating all of our websites to a consistent unified experience.
 During this phase the contractor will focus on migrating the content of the main site to the new platform.
There will be an iterative review and feedback from the QGIS web team should be incorporated from biweekly check-in calls.
Phase 3?: Auxiliary sites migrations Outcome: [https:]] new site goes live! (Target date end of February 2024)This is out of scope of the current call for proposals but should be part of the overall planning process:
This would be a collaborative process involving a QGIS funded web developer and the consultant.
Iterative review and feedback from the QGIS web team should be incorporated from biweekly check in calls.
Outcome: Auxiliary sites goes live with a cohesive look and feel to match the main site. What we will provide
- Maps and screenshots, videos, animations (with inputs from design team)
- Inputs in terms of content review
 Qualification criteria
 Must have an established track record of website design and content creation. Individuals or companies equally welcome to apply. Any potential conflict of interest should be declared in your application. Discussions will happen in English, with live discussions as well as written communication via issues or Pull request. Being reasonably fluent in English and understand the soft skills required to interact in a community project will be more than appreciated
 Payment milestones
10 % Kick off
40 % Phase 1 Completion
50 % Phase 2 Completion
 Indicative budget
We would like to point you to the QGIS Annual Budget so that you have a sense of our broad financial means (i.e. we will not be able to afford proposals in excess of €25,000 for phase 1+2).
 Technology choices and IP:
- Must be wholly based on Open Source tooling (e.g. javascript, css, web frameworks)
- Needs to be ideally implemented in Hugo (or Sphinx)
- Must produce a static web site (except for existing django based sites)
- Publication and development workflow will follow standard pull request / review process via our GitHub repositories
- Mobile friendly
- Site will be english only – any auto-translation tooling that can be added so that users can trivially see an auto-translated version of the site will be considered favourably.
 Proposal submission
Your proposal should consist of no more than 5 pages (include links to relevant annexes if needed) covering the following:
- Overview of yourself / your organization
- Delivery timeline
- Team composition
- Budget for each phase
- Examples of prior work
- Bonus things to mention if relevant: GIS experience & working with Open Source projects
Please send your proposal to finance@qgis.org by October 29nd 2023 midnight, anywhere on earth.
-
sur GeoTools Team: GeoTools 30-RC released
Publié: 2 October 2023, 12:49am CEST
The GeoTools team is pleased to share the availability GeoTools 30-RC :geotools-30-RC-bin.zip geotools-30-RC-doc.zip geotools-30-RC-userguide.zip geotools-30-RC-project.zip org.opengis package removalThe main novelty in this release is the renaming of all "org.opengis" packages into "org.geotools.api" ones, to satisfy a request coming from OGC members that manage the "GeoAPI" project, using the -
sur From GIS to Remote Sensing: Semi-Automatic Classification Plugin version 8 release date and dependency installation
Publié: 1 October 2023, 7:53pm CEST
This post is to announce that the new version 8 (codename "Infinity") of the Semi-Automatic Classification Plugin (SCP) for QGIS will be released the 8th of October 2023.This new version is based on a completely new Python processing framework that is Remotior Sensus, which will expand the processing capabilities of SCP, also allowing for the creation of Python scripts.
The SCP requires Remotior Sensus, GDAL, NumPy and SciPy for most functionalities. Optionally, scikit-learn and PyTorch are required for machine learning. GDAL, NumPy and SciPy should already be installed along with QGIS.It might be useful to illustrate the installation steps of these dependencies before SCP is released.Read more » -
sur Fernando Quadro: Verificações de URL no GeoServer
Publié: 28 September 2023, 3:58pm CEST
A versão 2.24.x do GeoServer traz entre suas novidades as verificações de acesso externo de URL que permite controlar as verificações executadas em URLs fornecidas pelo usuário que o GeoServer usará para acessar recursos remotos.
Atualmente, as verificações são realizadas nas seguintes funcionalidades:
- Solicitações WMS GetMap, GetFeatureInfo e GetLegendGraphic com folhas de estilo SLD remotas (parâmetro SLD)
- Ícones remotos referenciados por estilos (o acesso aos ícones no diretório de dados é sempre permitido)
- Solicitações WMS GetMap e GetFeatureInfo no modo de representação de recursos (parâmetros REMOTE_OWS e REMOTE_OWS_TYPE)
- Entradas remotas WPS, como solicitações GET ou POST
Para criar as regras de verificação, o GeoServer utiliza expressões regulares. Na internet existem sites disponíveis que irão te ajudar a definir um padrão de expressão regular Java (linguagem que o GeoServer é desenvolvido) válido. Essas ferramentas podem ser usadas para interpretar, explicar e testar expressões regulares. Por exemplo:
– [https:]] (habilitar o tipo Java 8)
1. Configuração de verificações de URL
Navegue até a página Dados > Verificações de URL para gerenciar e configurar verificações de URL.
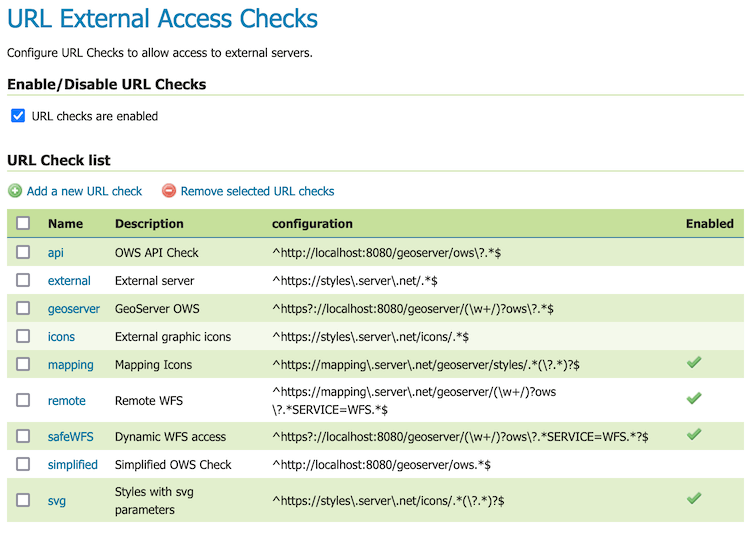
Tabela de verificações de URL
Use as opções Ativar/Desativar para habilitar este recurso de segurança:
- Quando a caixa de seleção de verificações de URL está habilitada, as verificações de URL são realizadas para limitar o acesso do GeoServer a recursos remotos, conforme descrito acima. A ativação de verificações de URL é recomendada para limitar a interação normal dos protocolos Open Web Service usados ??para ataques de Cross Site Scripting.
- Quando a caixa de seleção está desabilitada, as verificações de URL NÃO são habilitadas, o GeoServer recebe acesso irrestrito a recursos remotos. Desativar verificações de URL não é uma configuração segura ou recomendada.
2. Adicionando uma verificação baseada em expressão regular
Os botões para adicionar e remover verificações de URL podem ser encontrados na parte superior da lista de verificação de URL.
Para adicionar uma verificação de URL, pressione o botão Adicionar nova verificação. Você será solicitado a inserir os detalhes da verificação de URL (conforme descrito abaixo em Editando uma verificação).
3. Removendo uma verificação
Para remover uma verificação de URL, marque a caixa de seleção ao lado de uma ou mais linhas na lista de verificação de URL. Pressione o botão Remover verificações de URL selecionadas para remover. Você será solicitado a confirmar ou cancelar a remoção. Pressionar OK para remover as verificações de URL selecionadas.
4. Editando uma verificação
As verificações de URL podem ser configuradas, com os seguintes parâmetros para cada verificação:
- Nome: Nome da verificação, utilizado para identificá-lo na lista.
- Descrição: Descrição da verificação, para referência posterior.
- Expressão regular: Expressão regular usada para corresponder aos URLs permitidos
- Habilitado: Caixa de seleção para ativar ou desativar a verificação
Veja abaixo como é a tela de configuração:
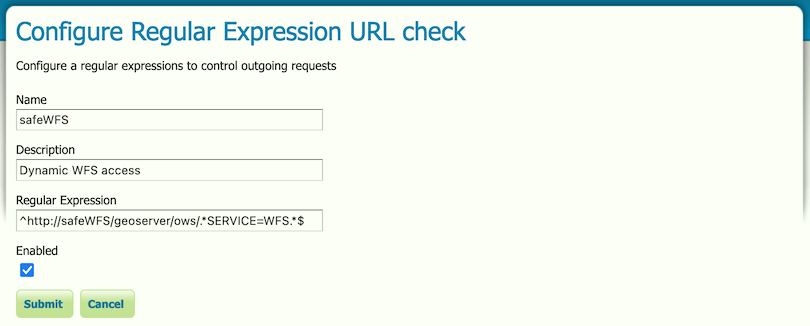
Tela de configuração de verificação de URL
5. Testando verificações
O formulário Testar verificações permite que uma URL seja verificada, informando se o acesso é permitido ou não.
Pressione o botão Testar URL para realizar as suas verificações. Se pelo menos uma verificação corresponder ao URL, ele será permitido e o teste indicará a verificação que permite o acesso. Caso contrário, será rejeitado e o teste indicará que nenhuma verificação de URL foi correspondente.
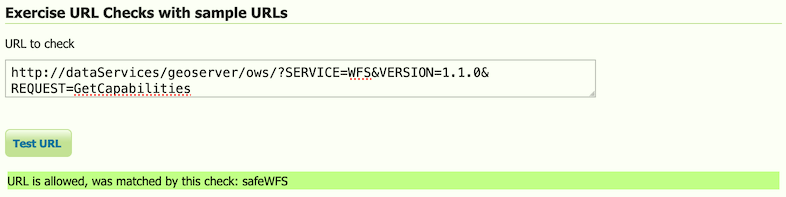
Tela de teste de verificações de URL
Fonte: GeoServer Documentation
-
sur Fernando Quadro: GeoServer ACL
Publié: 27 September 2023, 9:20pm CEST
A versão 2.24.x do GeoServer traz entre suas novidades o GeoServer ACL (Access Control List), um sistema de autorização avançado.
Ele consiste em um serviço independente que gerencia regras de acesso e um plugin do GeoServer que solicita limites de autorização por solicitação.
Como administrador, você usará o GeoServer ACL para definir regras que concedem ou negam acesso a recursos publicados com base nas propriedades da solicitação de serviço, como credenciais do usuário, o tipo de serviço OWS (OGC Web Services) e as camadas solicitadas.
Essas regras podem ser tão abertas quanto conceder ou negar acesso a espaços de trabalho inteiros do GeoServer, ou tão granulares quanto especificar quais áreas geográficas e atributos de camada permitir que um usuário ou grupo de usuários específico veja.
Como usuário, você executará solicitações ao GeoServer, como WMS GetMap ou WFS GetFeatures, e o mecanismo de autorização baseado no ACL limitará a visibilidade dos recursos e conteúdos das respostas àqueles que correspondem às regras que se aplicam às propriedades da solicitação e as credenciais do usuário autenticado.
GeoServer ACL não é um provedor de autenticação. É um gerenciador de autorização que usará as credenciais do usuário autenticado, sejam elas provenientes de HTTP básico, OAuth2/OpenID Connect ou qualquer mecanismo de autenticação que o GeoServer esteja usando, para resolver as regras de acesso que se aplicam a cada solicitação específica.
GeoServer ACL é Open Source, nascido como um fork do GeoFence. Como tal, segue a mesma lógica para definir regras de acesso a dados e acesso administrativo. Portanto, se você estiver familiarizado com o GeoFence, será fácil raciocinar como o GeoServer ACL funciona.
Fonte: GeoServer ACL Project
-
sur KAN T&IT Blog: Análisis de calidad de información geoespacial. BID Perú.
Publié: 25 September 2023, 9:21pm CEST
En el marco del convenio con el Banco Interamericano de Desarrollo sede Perú (BID Perú), se llevó a cabo el proyecto de análisis de calidad de información geoespacial generados en el contexto del programa “Apoyo a la Plataforma Nacional de Ciudades Sostenibles y Cambio Climático en Lima” para el Ministerio de Ambiente de la República de Perú (MINAM). Este proyecto consistió en realizar el control de calidad de más de 400 capas de información geoespacial en función de los requerimientos establecidos en la familia de normas ISO 19100 que apuntan a regular y a normalizar la generación de información geoespacial con el objetivo de garantizar su interoperabilidad. El objetivo final de este trabajo fue aportar al proceso de mejora de la calidad e interoperabilidad de los datos al Plan Nacional de Adaptación al Cambio Climático (NAP, por sus siglas en inglés) en Perú.
El NAP consiste en un exhaustivo documento en donde se plasman los principales lineamientos para planificar la implementación de medidas diseñadas específicamente para reducir los riesgos derivados del impacto del cambio climático. A su vez, este documento pretende ser una fuente de información disponible para la toma de decisiones a nivel gubernamental en torno a ésta problemática. En este sentido, entre los objetivos que persigue el NAP, se presentan los siguientes:
1: Integrar y articular diversos instrumentos de gestión: Estrategia Regional de Cambio Climático, NDC y Planes Locales de Adaptación al Cambio Climático.
2: Desarrollar un análisis de riesgos climáticos a nivel nacional y regional para 5 áreas temáticas: Agua, Bosques, Agricultura, Pesca y Acuicultura y Salud; y para 4 amenazas clave: movimientos en masa, inundaciones, cambio en las condiciones de aridez y retroceso glaciar.
3: Actualizar las medidas de adaptación establecidas en cada uno de los instrumentos de gestión, de acuerdo con las necesidades de las poblaciones y los ecosistemas.
Para llevar a cabo el proceso de revisión y control de calidad de la información generada en este contexto, se trabajó en conjunto con las empresas productoras de la información geoespacial y en constante comunicación con representantes del BID Perú. Estas empresas habían sido convocadas por el Ministerio de Ambiente de Perú en convenio con BID y la organización World Wide Fund for Nature (WWF) con el objetivo de analizar y generar información para: el “Plan de Adaptación Costera para el Área Metropolitana de Lima (AML)”, los “Estudios base sobre riesgo de desastres por riesgos naturales y crecimiento urbano en el AML” y los “Estudios de análisis urbanístico, prefactibilidad y diseños constructivos para acciones estratégicas de accesibilidad, multimodalidad y desarrollo orientado al transporte en el Sistema Integrado de Transporte (SIT) de Lima y Callao”. Toda la información geoespacial generada en el marco de estos tres productos fue el objeto de análisis de la consultoría realizada por Kan.
La premisa que guió el desarrollo de este proyecto fue alcanzar un nivel de calidad del dato óptimo que permitiera a los organismos disponibilizar la información producida garantizando el libre acceso, la interoperabilidad, la confiabilidad y la calidad.
En primera instancia se presentaron requisitos para la presentación de la información para asegurar el libre acceso. En este sentido, se solicitó que la información pudiera ser consultada a través de software libres, para que pudieran ser consumidos sin necesidad de pagar una licencia para hacerlo, siendo el formato “geopackage” el indicado para cumplir esta condición.
El análisis de la información se basó en una metodología específica desarrollada por el equipo SIG de Kan, fundamentada en las normas 19115-3, 19139, 19110 y 19157 que hacen referencia a los formatos e implementación de metadatos, a la catalogación de objetos geográficos y a la calidad del dato, respectivamente. Todo el contenido de estas normas se plasmaron en matrices analíticas que luego fueron aplicadas a cada una de las capas de información. Estas matrices permitieron relevar el estado de la información en relación a: la completud de sus metadatos, formatos de interoperabilidad de la información, calidad del dato, referencias sobre su linaje, uso y propósito, su consistencia lógica y topológica, el análisis de sus atributos, entre otros puntos. En total, se establecieron seis categorías de análisis:
A: Compatibilidad del conjunto de datos
B: Interoperabilidad del conjunto de datos
C: Interoperabilidad conjunto de metadatos
D: Interoperabilidad – Metadatos de la capa
E: Compatibilidad de la capa
F: Calidad del dato
Para cada categoría se definieron una serie de elementos de análisis que en total suman 47 ítems. El objetivo final de esta revisión fue cuantificar la usabilidad de la información geográfica producida, estableciendo un rango de usabilidad. Este rango va entre -1 y 1, siendo los valores cercanos a -1 aquellos que incumplen en más de un 50% los elementos establecidos para el análisis y los valores cercanos a 1 aquellos que cumplen en más de un 50% los elementos. De esta forma se obtuvo un resultado parcial de usabilidad por capa y un resultado global de usabilidad para el conjunto de datos. Luego de haber realizado el análisis, se confrontaron los resultados obtenidos con lo establecido por las normas, de esta manera se creó un documento de recomendaciones y sugerencias para la mejora de la calidad e interoperabilidad del dato.
Este proyecto permitió conocer la calidad de la información generada en el proyecto e identificar aquellos aspectos posibles de mejorar para garantizar la interoperabilidad de la información. Luego de este proceso de análisis, las empresas aplicaron las recomendaciones y sugerencias realizadas por el equipo SIG de Kan con el que alcanzaron un nivel óptimo de calidad del dato.

-
sur GeoServer Team: GeoServer 2.24-RC Release
Publié: 25 September 2023, 2:00am CEST
GeoServer 2.24-RC release is now available with downloads (bin, war, windows), along with docs and extensions.
This is a release candidate intended for public review and feedback, made in conjunction with GeoTools 30-RC, GeoWebCache 1.24-RC, mapfish-print-v2 2.3-RC and geofence-3.7-RC.
Thanks to Andrea Aime (GeoSolutions) and Jody Garnett (GeoCat) for working on making this release candidate.
Release candidate public testing and feedbackTesting and providing feedback on releases is part of the open-source social contract. The development team (and their employers and customers) are responsible for sharing this great technology with you.
The collaborative part of open-source happens now - we ask you to test this release candidate in your environment and with your data. Try out the new features, double check if the documentation makes sense, and most importantly let us know!
If you spot something that is incorrect or not working do not assume it is obvious and we will notice. We request and depend on your email and bug reports at this time. If you are working with commercial support your provider is expected to participate on your behalf.
Keeping GeoServer sustainable requires a long term community commitment. If you are unable to contribute time, sponsorship options are available via OSGeo.
IAU authority support and EPSG assumption removalThe new gs-iau extension module provides support for planetary CRSs, sourced from the International Astronomical Union. This allows to manage GIS data over the Moon, Mars, or even the Sun, with well known, officially supported codes.
In addition to that, many bug fixes occurred in the management of CRSs and their text representations (plain codes, URL, URIs) so that the EPSG authority is no longer assumed to be the only possibility, in a variety of places, such as, for example, GML output. The code base has seen this assumption for twenty years long, and while we made a good effort to eliminate the assumption, it could be still lurking in some places. Please test and let us know.
To learn more about this extension please visit the user-guide documentation. Thanks to Andrea Aime (GeoSolutions) for working on this activity.
- GSIP-219 - Multiple CRS authority support, planetary CRS
- GEOS-11075 IAU authority : planetary CRS support
- GEOS-11001 Support other CRS authories in WFS
- GEOS-11002 Support other CRS authorities in WMS
- GEOS-11056 Support other CRS authorities in WCS
- GEOS-11064 Support other CRS authorities in WPS
- GEOS-11066 Support other CRS authorities in importer
- GEOS-11076 SRSList should show authorities other than EPSG, if available
- GEOS-10970 CatalogBuilder cannot handle CRS in authorities other than EPSG
- GEOS-10971 XStreamPersister cannot save CRS references using authorities other than EPSG
- GEOS-10972 Resource page CRS editors would not work with authorities other than EPSG
The printing extension has seen big changes - with a host of new functionality developed by GeoSolutions over the years. With this update the printing module can now be used out-of-the-box by GeoNode and MapStore (no more customization required).
- Max number of columns configuration for multi column legends
- Simple colored box icon in legends
- Explicit support of Geoserver CQL_FILTER parameter (also with layers merge support)
- Legend fitting
- Don’t break legend items
- Reorder legends block in columns
- Images content
- Dynamic images page
- Multipage legends
- Custom intervals in ScalebarBlock
- Clustering Support
- HTML rendering in text blocks
- Extra Pages
- Group Rendering in attribute blocks
- Skip rendering of pages
- Automatic X-Forwarded-For
- Parsing of Base64 encoded images
Thanks to GeoSolutions for adding functionality to mapfish-print for the GeoNode project. Jody Garnett (GeoCat) was responsible for updating the mapfish print-lib for Java 11 and gathering up the functionality from different branches and forks.
- GEOS-11132 mapfish-print-v2 2.3-RC
This release adds a new Check URL facility under the Security menu. This allows administrators to manage OGC Service use of external resources.
For information and examples on how to use the URL Check page, visit user guide documentation.
- GSIP 218 - Control remote HTTP requests sent by GeoTools \ GeoServer
- GEOS-10949 Control remote resources accessed by GeoServer
- GEOS-11048 Improve URL checking
The GeoTools project moved away from using the “org.opengis” package after complaints from OGC GeoAPI working group representatives, using the same package name. Interfaces have been moved to the “org.geotool.api” package, along with some general clean up.
While this does not affect GeoServer users directly, it’s of consequence for those that have installation with custom, home grown plugins that might have to be migrated as a consequence. For those, the GeoTools project offers a migration guide, along with a refactoring script that might perform the migration for you, or else, get you close to a working point. GeoServer itself has been migrated using these scripts, with minimal manual intervention.
For more details, and access to the migration script, please see the GeoTools 30 upgrade guide.
Thanks to Jody Garnett (GeoCat), Andrea Aime (GeoSolutions), and Ian Turton (ASTUN Technologies) for all the hard work on this activity. We would also like to thank the Open Source Geospatial Foundation for setting up a cross-project activity and financial support to address this requested change.
- GEOS-11070 Upgrading to GeoTools 30.x series, refactor to org.geotools.api interfaces
While not strictly part of this release, it’s interesting to know about some community module advances that can be found only in the the 2.24.x series.
Two extensions are no longer actively supported and are now available as community modules:
- GEOS-10960 Downgrade imagemap module to community
- GEOS-10961 Downgrade xslt extension to community
The following community modules have been removed (due to lack of interest):
- GEOS-10962 Remove wms-eo community module
- GEOS-10963 Remove SAML community module
- GEOS-10966 Remove importer-fgdb community module
- GEOS-10967 Remove teradata community module
- GEOS-10977 Remove wmts-styles community module
- GEOS-10978 Remove nsg-wmts community module
- GEOS-10984 Remove ows-simulate community module
The OGC API community module keeps improving. In particular, thanks to the GeoNovum sponsorship, GeoSolutions made the OGC API Features module pass the OGC CITE compliance tests, for the “core” and “CRS by reference” conformance classes. Along with this work, other significant changes occurred:
- Made the API version number appear in the service path, easing future upgrades
- Support for configurable links, required to get INSPIRE download service compliance.
In addition to that, the new “search” experimental conformance class allows to POST complex searches against collections, as a JSON document, in a way similar to the STAC API.
Those interested in this work are encouraged to contact Andrea Aime (GeoSolutions).
- GEOS-10924 Support JSON-FG draft encoding in OGC API - Features
- GEOS-11045 Implement proposal “OGC API - Features - Part n: Query by IDs”
- GEOS-10882 Add an option to remove trailing slash match in OGC APIs
- GEOS-10887 Add angle brackets to OGC API CRS Header
- GEOS-10892 Allow configuring custom links for OGC API “collections” and single collection resources
- GEOS-10895 Make OGC API CITE compliant even if the trailing slash is disabled: landing page exception
- GEOS-11058 Support other CRS authorities in OGC APIs
- GEOS-10909 Don’t link from OGC API Features to WFS 2.0 DescribeFeatureType output, if WFS is disabled
- GEOS-10954 Split ogcapi community module package into single functionality packages
For folks working with very large catalogues some improvement from cloud native geoserver are now available to reduce startup time.
Thanks to Gabriel Roldan for folding this improvement into a community module for the rest of the GeoServer community to enjoy.
- GEOS-11049 Community module “datadir catalog loader”
The GeoServer Access Control List project is an independent application service that manages access rules, and a GeoServer plugin that requests authorization limits on a per-request basis.
Gabriel Roldan is the contact point for anyone interested in this work.
The vector mosaic and FlatGeoBuf modules sport significant performance improvementsFlatGeoBuf is a “A performant binary encoding for geographic data”, a single file format that also manages to be cloud native and include a spatial index. GeoServer provides access to this format thought the WFS FlatGeobuf output format, which not only can write the format, but also read it as a standard data store.
The Vector Mosaic datastore supports creation of mosaics made of single file vector data, useful in situations where the access to data is targeted to sub-pages of a larger data set (e.g., data for a single time, or a single customer, or a single data collect, out of a very large uniform set of vectors) and the database storage for it is become either too slow, or too expensive.
These two modules make a great combo for those in need to handle very large vector datasets, by storing the FlatGeoBuf on cheap storage.
In particular, the FlatGeoBuf module saw speed improvements that made it the new “fastest vector format” for cases where one needs to display a large data set, all at once, on screen (PostGIS remains the king of the hill for anything that needs sophisticated filtering instead).
For reference, we have timed rendering 4 million tiny polygons out of a precision farming collect, using a 7 classes quantile based SLDs. Here is a tiny excerpt of the map:
And here are the timings to render the full set of polygons, putting them all on screen, at the same time, with a single GetMap request:
- PostGIS, 113 seconds
- Shapefile, 41 seconds
- Flatgeobuf, 36 seconds
The tuning is not complete, more optimizations are possible. Interested? Andrea Aime is the contact point for this work.
Release notesNew Feature:
- GEOS-10992 Make GWC UI for disk quota expose HSQLDB, remove H2, automatically update existing installations
- GEOS-11000 WPS process to provide elevation profile for a linestring
Improvement:
- GEOS-10926 Community Module Proxy-Base-Ext
- GEOS-10934 CSW does not show title/abstract on welcome page
- GEOS-10973 DWITHIN delegation to mongoDB
- GEOS-10999 Make GeoServer KML module rely on HSQLDB instead of H2
- GEOS-11005 Make sure H2 dependencies are included in the packages of optional modules that still need it
- GEOS-11059 Map preview should not assume EPSG authority
- GEOS-11081 Add option to disable GetFeatureInfo transforming raster layers
- GEOS-11087 Fix IsolatedCatalogFacade unnecessary performance overhead
- GEOS-11090 Use Catalog streaming API in WorkspacePage
- GEOS-11099 ElasticSearch DataStore Documentation Update for RESPONSE_BUFFER_LIMIT
- GEOS-11100 Add opacity parameter to the layer definitions in WPS-Download download maps
- GEOS-11102 Allow configuration of the CSV date format
- GEOS-11116 GetMap/GetFeatureInfo with groups and view params can with mismatched layers/params
Bug:
- GEOS-8162 CSV Data store does not support relative store paths
- GEOS-10452 Use of Active Directory authorisation seems broken since 2.15.2 (LDAP still works)
- GEOS-10874 Log4J: Windows binary zip release file with log4j-1.2.14.jar
- GEOS-10875 Disk Quota JDBC password shown in plaintext
- GEOS-10899 Features template escapes twice HTML produced outputs
- GEOS-10903 WMS filtering with Filter 2.0 fails
- GEOS-10921 Double escaping of HTML with enabled features-templating
- GEOS-10922 Features templating exception on text/plain format
- GEOS-10928 Draft JSON-FG Implementation for OGC API - Features
- GEOS-10936 YSLD and OGC API modules are incompatible
- GEOS-10937 JSON-FG reprojected output should respect authority axis order
- GEOS-10958 Update Spotbugs to 4.7.3
- GEOS-10981 Slow CSW GetRecords requests with JDBC Configuration
- GEOS-10985 Backup Restore of GeoServer catalog is broken with GeoServer 2.23.0 and StAXSource
- GEOS-10993 Disabled resources can cause incorrect CSW GetRecords response
- GEOS-11015 geopackage wfs output builds up tmp files over time
- GEOS-11016 Docker nightly builds use outdated GeoServer war
- GEOS-11033 WCS DescribeCoverage ReferencedEnvelope with null crs
- GEOS-11060 charts and mssql extension zips are missing the extension
Task:
- GEOS-11091 Upgrade spring-security to 5.7.10
- GEOS-11094 Bump org.hsqldb:hsqldb:2.7.1 to 2.7.2
- GEOS-11103 Upgrade Hazelcast version to 5.3.x
- GEOS-10248 WPSInitializer NPE failure during GeoServer reload
- GEOS-10904 Bump jettison from 1.5.3 to 1.5.4
- GEOS-10907 Update spring.version from 5.3.25 to 5.3.26
- GEOS-10941 Update ErrorProne to 2.18
- GEOS-10987 Bump xalan:xalan and xalan:serializer from 2.7.2 to 2.7.3
- GEOS-10988 Update spring.version from 5.3.26 to 5.3.27 and spring-integration.version from 5.5.17 to 5.5.18
- GEOS-11010 Upgrade guava from 30.1 to 32.0.0
- GEOS-11011 Upgrade postgresql from 42.4.3 to 42.6.0
- GEOS-11012 Upgrade commons-collections4 from 4.2 to 4.4
- GEOS-11018 Upgrade commons-lang3 from 3.8.1 to 3.12.0
- GEOS-11019 Upgrade commons-io from 2.8.0 to 2.12.0
- GEOS-11020 Add test scope to mockito-core dependency
- GEOS-11062 Upgrade [httpclient] from 4.5.13 to 4.5.14
- GEOS-11063 Upgrade [httpcore] from 4.4.10 to 4.4.16
- GEOS-11067 Upgrade wiremock to 2.35.0
- GEOS-11080 Remove ASCII grid output format from WCS
- GEOS-11084 Update text field css styling to look visually distinct
- GEOS-11092 acme-ldap.jar is compiled with Java 8
For the complete list see 2.24-RC release notes.
About GeoServer 2.24 SeriesAdditional information on GeoServer 2.24 series:
- Control remote HTTP requests sent by GeoTools/GeoServer
- Multiple CRS authority support, planetary CRS
Release notes: ( 2.24-RC )
-
sur Sean Gillies: Bear 100 race week
Publié: 24 September 2023, 11:06pm CEST
This is it, race week. Wednesday I'm flying to Salt Lake City and driving to Logan. Friday before dawn I'm headed up the trail to Bear Lake.
Week ~5 was a rest week at the end of a big training block. I biked and ran for less than 4 hours. Week ~4 I ran for 12 hours, 53 miles, and 8,500 feet of elevation gain. Much of that was above 10,000 feet in Rocky Mountain National Park, my go-to for accessible high country. I ran up to Granite Pass, 12,100 feet, just below the Longs Peak boulder field, and test drove the gels that will be served at the Bear 100. Spring Energy's Awesome Sauce is good! I could eat them all day. Spring's Speednut product is a bit harder for me to stomach. One of those every few hours might be all I can take.
At the end of week ~4 I did some volunteering at the Black Squirrel Trail Half-Marathon, a race I've run several times. I helped park cars in the pre-race darkness and get first-timers pointed toward registration and the starting line. I saw the Milky Way in the clear, dark early morning sky. I caught up with the race directors, Nick and Brad, and saw other friends in the first mile of the course. Volunteering at events is always needed and fun. I recommend it.
In week ~3, I ran for 9.5 hours, 42 miles, and 5,700 feet. In the interest of fine tuning, I went out in the heat of the day and took my poles. In week ~2, last week, I got the new COVID vaccination and did less running and more yoga and body-weight strength and mobility exercise. Split squats with dumbbells made me sore, but I am over it now.
Where am I at now, in week ~1? I think I have enough experience and adequate training this year to finish. Three events of 40 miles, including one overnight, and one at very high elevation. The heart palpitations that were troubling me last year almost never occur now. I'm well over my most recent sinus infection. I've got all the gear I need and am physically and psychologically prepared for hot weather, cold weather, and rain or snow. The race will have more food than I can eat along the way and will deliver my five drop bags to aid stations and the finish line. I don't have a crew or pacer for the run, but think I'll be fine without. Reality is that it's harder to have these as you get older. Your family is busy and your friends are busy with their own families. I'm shy, but not shy about forming small ad-hoc teams on the trail, so I expect to be fine on that front.
The Bear 100 Endurance Run starts with 5,000 feet of climbing in the first 10 miles. I can do this. At least it's at the beginning and not the end. That leaves only 17,000 feet for the last 90 miles. I'm joking about this to keep my spirits up. This will be super hard, a big bump up from my hardest week of training, and I'll need to go even deeper into the unknown than I've done at the Never Summer 100K. I'm ready to see what happens out there.
The one thing that's concerning me is that I have a persistent ache in my right foot. Yesterday I went out for an hour in my Nike Terra Kiger's to see if I might want to bring them along as a shoe option. The answer is no: they don't have enough padding for my foot in its current condition. I feel worse today than yesterday. There's at least a small chance that I have a bone stress problem. The pain and swelling is right on the "N-spot". I'm not going to let this stop me from starting and will see how it goes on Friday. I've got a pretty high pain threshold and will be stashing some ibuprofen in my later drop bags. Cold rain and cold, numb feet, if the forecast holds, might help, too. How is that for positive thinking?
If you want to follow along on Friday and Saturday, the live tracking should be at [https:]] . My bib number is 314. That website currently shows last year's race. I expect that this year's progress will be shown on Friday morning.
-
sur Sean Gillies: Status update
Publié: 24 September 2023, 6:10pm CEST
I'm pausing my job search and open source work to focus on next weekend's adventure. Forgive me if I don't respond before October 5-6. After I'm back I'll be prioritizing the job search over open source. Not for long, I hope!
-
sur QGIS Blog: QGIS Grant Programme 2023 Update
Publié: 20 September 2023, 8:29pm CEST
Thanks to our generous donors and sustaining members, we are in the wonderful position to be able to further extend our 2023 Grant Programme and to fund two additional projects that came in very close 5th and 6th in the voting results:
- QEP#261 Cachable provider metadata API — or how to
 the QGIS loading times
 - QEP#236 Unification of all geometric and topological verification methods
On behalf of the QGIS.ORG project, I would like to thank everyone who helped with the fund raising and everyone who stepped up and joined our donor and sustaining membership programme.

- QEP#261 Cachable provider metadata API — or how to
-
sur GeoSolutions: FREE Webinar: MapStore for Local Governments – Cleveland Metroparks Case Study
Publié: 20 September 2023, 5:39pm CEST
You must be logged into the site to view this content.
-
sur GeoSolutions: GeoSolutions USA at National States Geographic Information Council (NSGIC) 25-28 SEP
Publié: 18 September 2023, 3:51pm CEST
You must be logged into the site to view this content.
-
sur Free and Open Source GIS Ramblings: Data engineering for Mobility Data Science (with Python and DVC)
Publié: 16 September 2023, 5:28pm CEST
This summer, I had the honor to — once again — speak at the OpenGeoHub Summer School. This time, I wanted to challenge the students and myself by not just doing MovingPandas but by introducing both MovingPandas and DVC for Mobility Data Science.
I’ve previously written about DVC and how it may be used to track geoprocessing workflows with QGIS & DVC. In my summer school session, we go into details on how to use DVC to keep track of MovingPandas movement data analytics workflow.
Here is the recording of the session live stream and you can find the materials at [https:]]
-
sur Marco Bernasocchi: OPENGIS.ch and Oslandia: A Strategic Partnership to Advance QField and QFieldCloud
Publié: 15 September 2023, 7:00am CEST

We are extremely happy to announce that we have partnered strategically with Oslandia to push the leading #fieldwork app #QField even further.
In the world of fieldwork, accuracy and efficiency are paramount. As GIS specialists, we understand the importance of reliable tools that streamline data collection and analysis processes. That’s why we are thrilled to join forces with Oslandia, a company that shares our passion for open-source development and innovation.
Embracing Open Source DevelopmentAt OPENGIS.ch, we have always been committed to the principles of true open-source development. We firmly believe collaboration and shared knowledge drive progress in the GIS community. With Oslandia, we have found a partner who shares our values and cares as much as we do about the QGIS ecosystem.
QGIS, the world’s most popular open-source geographic information system software, has already significantly impacted the GIS industry, providing users with versatile mapping tools and capabilities and is the base upon which QField is built. As main contributors to #QGIS, both OPENGIS.ch and Oslandia are dedicated to driving its growth and ensuring its availability to all.
Advancing QField and QFieldCloud Together
QField, with almost 1 million downloads, is the leading app for fieldwork tasks. It empowers professionals in various sectors, such as environmental research, agriculture, urban planning, and disaster management, to efficiently collect data and conduct analyses in the field. With our strategic partnership with Oslandia, we are committed to pushing the boundaries of QField even further.
Our joint efforts will ensure that QField will keep setting trends in the industry, surpassing the evolving needs of GIS specialists and empowering them to excel in their fieldwork tasks.
A Synergy of ExpertiseThe collaboration between OPENGIS.ch and Oslandia represents a true synergy of expertise. Our combined capabilities will enable us to tackle complex challenges quickly and deliver cutting-edge solutions that address the unique requirements for seamless #fielwork.
ConclusionAt OPENGIS.ch, we are excited about the opportunities our partnership with Oslandia brings. Together, we will continue championing open-source development, empowering GIS specialists in each sector to perform their fieldwork tasks more effectively and efficiently.
With QField as our flagship app, we are confident that this strategic collaboration will result in even greater advancements, benefiting our target audience of surveying professionals, fieldwork experts, and GIS specialists, as well as casual users who need a user-friendly solution for their projects.
Join us in celebrating this exciting new chapter as we embark on a shared journey towards innovation and excellence in fieldwork applications.

-
sur Oslandia: Strategic partnership agreement between Oslandia and OpenGIS.ch on QField
Publié: 14 September 2023, 7:30pm CEST
Who are we? For those unfamiliar with Oslandia, OpenGIS.ch, or even QGIS, let’s refresh your memory:
 Oslandia is a French company specializing in open-source Geographic Information Systems (GIS). Since our establishment in 2009, we have been providing consulting, development, and training services in GIS, with reknown expertise. Oslandia is a dedicated open-source player and the largest contributor to the QGIS solution in France.
 As for OPENGIS.ch, they are a Swiss company specializing in the development of open-source GIS software. Founded in 2011, OPENGIS.ch is the largest Swiss contributor to QGIS. OPENGIS.ch is the creator of QField, the most widely used open-source mobile GIS solution for geomatics professionals.
OPENGIS.ch also offers QFieldCloud as a SaaS or on-premise solution for collaborative field project management.
 Some may still be unfamiliar with #QGIS ?
It is a free and open-source Geographic Information System that allows creating, editing, visualizing, analyzing, and publicating geospatial data. QGIS is a cross-platform software that can be used on desktops, servers, as a web application, or as a development library.

QGIS is open-source software developed by multiple contributors worldwide. It is an official project of the OpenSource Geospatial Foundation (OSGeo) and is supported by the QGIS.org association. See [https:]]
A Partnership? Today, we are delighted to announce our strategic partnership aimed at strengthening and promoting QField, the mobile application companion of QGIS Desktop.
 This partnership between Oslandia and OPENGIS.ch is a significant step for QField and open-source mobile GIS solutions. It will consolidate the platform, providing users worldwide with simplified access to effective tools for collecting, managing, and analyzing geospatial data in the field.
 QField, developed by OPENGIS.ch, is an advanced open-source mobile application that enables GIS professionals to work efficiently in the field, using interactive maps, collecting real-time data, and managing complex geospatial projects on Android, iOS, or Windows mobile devices.
 QField is cross-platform, based on the QGIS engine, facilitating seamless project sharing between desktop, mobile, and web applications.
Reactions QFieldCloud ( [https:]] ), the collaborative web platform for QField project management, will also benefit from this partnership and will be enhanced to complement the range of tools within the QGIS platform.
 At Oslandia, we are thrilled to collaborate with OPENGIS.ch on QGIS technologies. Oslandia shares with OPENGIS.ch a common vision of open-source software development: a strong involvement in development communities, work in respect with the ecosystem, an highly skilled expertise, and a commitment to industrial-quality, robust, and sustainable software development.
 With this partnership, we aim to offer our clients the highest expertise across all software components of the QGIS platform, from data capture to dissemination.
 On the OpenGIS.ch side, Marco Bernasocchi adds:
Commitment to open sourceThe partnership with Oslandia represents a crucial step in our mission to provide leading mobile GIS tools with a genuine OpenSource credo. The complementarity of our skills will accelerate the development of QField and QFieldCloud and meet the growing needs of our users.
Ready for field mapping ? Both companies are committed to continue supporting and improving QField and QFieldCloud as open-source projects, ensuring universal access to this high-quality mobile GIS solution without vendor dependencies.
 And now, are you ready for the field?
So, download QField ( [https:]] ), create projects in QGIS, and share them on QFieldCloud!
 If you need training, support, maintenance, deployment, or specific feature development on these platforms, don’t hesitate to contact us. You will have access to the best experts available: infos+mobile@oslandia.com.
 -
sur geomatico: HOT-OSM para el seísmo de Marruecos
Publié: 14 September 2023, 11:18am CEST
Geomatico dedica un día al mes a colaborar en aquellos proyectos que más nos llaman la atención tecnológica o socialmente. Es lo que llamamos el día del imasdé (I+D), que empieza con todos los trabajadores votando a qué dedicaremos las siguientes horas de trabajo.
 Votaciones poco tecnológicas para decidir el día del I+D
Como no podía ser de otra manera, esta jornada del 13 de septiembre la dedicamos al precioso proyecto HOT-OSM (Humanitarian OpenStreetMap Team) que había hecho un llamamiento urgente para ayudar a mapear las zonas afectadas por el dramático terremoto del sur de Marruecos.
Primero hicimos una pequeña introducción a OpenStreetMap (OSM) para profanos para aquella parte del equipo que no tenía experiencia anterior con el proyecto. Vimos los diferentes editores, iD, JOSM y estudiamos un poco las primitivas geométricas que caracterizan el proyecto y por supuesto las Map Features. Ya en HOT, decidimos en que proyecto íbamos a colaborar y nos pusimos a ello.
 Seleccionando zona de trabajo en HOT-OSM
Había que que cartografiar los edificios dentro de las rejillas que seleccionábamos. En el mismo proyecto de HOT, se explicaba claramente como realizar la tarea a partir de JOSM. Así, mediante el plugin de crear edificios, pudimos aportar nuestro granito de arena a la zona.
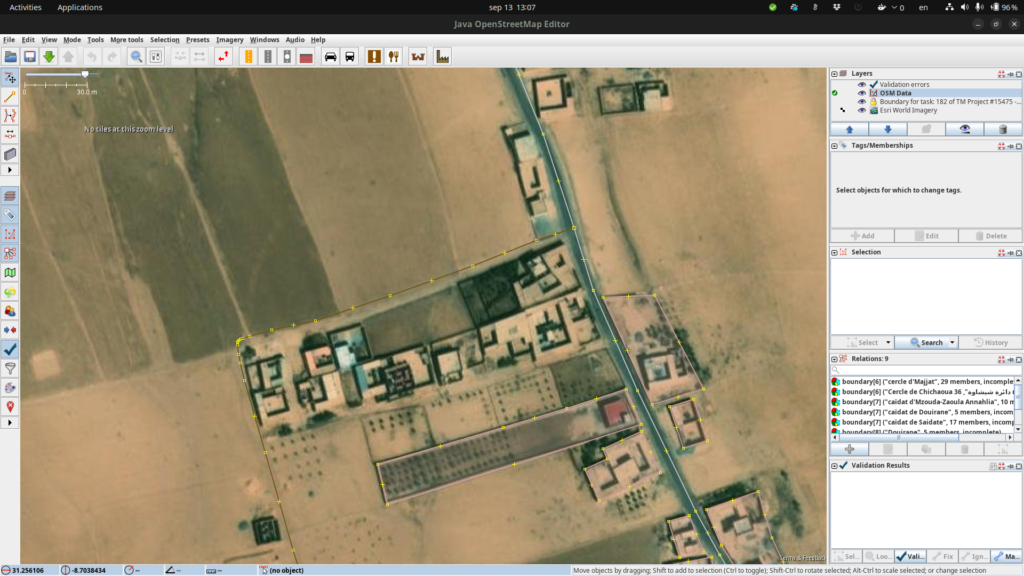 Puede ser complejo definir distinguir exactamente los contornos de los edificios en Marruecos
Fue muy gratificante, tanto por la tarea, como por la dinámica del trabajo, el compartir una jornada completa con las compañeras realizando un trabajo “sencillo“ en el que a la vez podíamos estar comentando otros aspectos de nuestro día a día. ¡Viva el día del imasdé y HOT-OSM!
 Micho, Marta y Alex trabajando en HOT-OSM pero posando disimuladamente para la foto
 -
sur BostonGIS: Why People care about PostGIS and Postgres and FOSS4GNA
Publié: 10 September 2023, 5:22am CEST
Paul Ramsey and I recently had a Fireside chat with Path to Cituscon. Checkout the Podcast Why People care about PostGIS and Postgres. There were a surprising number of funny moments and very insightful stuff.
It was a great fireside chat but without the fireplace. We covered the birth and progression of PostGIS for the past 20 years and the trajectory with PostgreSQL. We also learned of Paul's plans to revolutionize PostGIS which was new to me. We covered many other side-line topics, like QGIS whose birth was inspired by PostGIS. We covered pgRouting and mobilitydb which are two other PostgreSQL extension projects that extend PostGIS.
We also managed to fall into the Large Language Model conversation of which Paul and I are on different sides of the fence on.
Continue reading "Why People care about PostGIS and Postgres and FOSS4GNA" -
sur Camptocamp: The QGIS Hub Plugin
Publié: 8 September 2023, 2:00am CEST
Pièce jointe: [télécharger]
Your direct access to the shared resources of the QGIS community. -
sur GRASS GIS: NSF Grant Awarded to Enhance GRASS GIS Ecosystem
Publié: 6 September 2023, 10:12am CEST
We, a team of researchers from four U.S. universities, are excited to announce a significant new project to support and expand the global GRASS GIS community. We have been awarded a prestigious grant (award 2303651) from the U.S. National Science Foundation (NSF) to bolster and broaden the software ecosystem of GRASS GIS for a world that increasingly relies on location-based information. The two main goals of the project are: 1) to facilitate the adoption of GRASS GIS as a key geoprocessing engine by a growing number of researchers and geospatial practitioners in academia, governments, and industry; and 2) to expand and diversify the developer community, especially through supporting next-generation scientists to gain expertise to maintain and innovate GRASS software. -
sur GeoSolutions: GeoSolutions to Sponsor FOSS4G North America – 23-25 OCT – Baltimore, MD
Publié: 5 September 2023, 6:19pm CEST
You must be logged into the site to view this content.
-
sur Marco Bernasocchi: Analyzing and visualizing large-scale fire events using QGIS processing with ST-DBSCAN
Publié: 5 September 2023, 10:04am CEST
A while back, one of our ninjas added a new algorithm in QGIS’ processing toolbox named ST-DBSCAN Clustering, short for spatio temporal density-based spatial clustering of applications with noise. The algorithm regroups features falling within a user-defined maximum distance and time duration values.
This post will walk you through one practical use for the algorithm: large-scale fire event analysis and visualization through remote-sensed fire detection. More specifically, we will be looking into one of the larger fire events which occurred in Canada’s Quebec province in June 2023.
 Fetching and preparing FIRMS data
NASA’s Fire Information for Resource Management System (FIRMS) offers a fantastic worldwide archive of all fire detected through three spaceborne sources: MODIS C6.1 with a resolution of roughly 1 kilometer as well as VIIRS S-NPP and VIIRS NOAA-20 with a resolution of 375 meters. Each detected fire is represented by a point that sits at the center of the source’s resolution grid.
Each source will cover the whole world several times per day. Since detection is impacted by atmospheric conditions, a given pass by one source might not be able to register an ongoing fire event. It’s therefore advisable to rely on more than one source.
To look into our fire event, we have chosen the two fire detection sources with higher resolution – VIIRS S-NPP and VIIRS NOAA-20 – covering the whole month of June 2023. The datasets were downloaded from FIRMS’ archive download page.
After downloading the two separate datasets, we combined them into one merged geopackage dataset using QGIS processing toolbox’s Merge Vector Layers algorithm. The merged dataset will be used to conduct the clustering analysis.

In addition, we will use QGIS’s field calculator to create a new Date & Time field named ACQ_DATE_TIME using the following expression:
to_datetime("ACQ_DATE" || "ACQ_TIME", 'yyyy-MM-ddhhmm')This will allow us to calculate precise time differences between two dates.
 Modeling and running the analysis
The large-scale fire event analysis requires running two distinct algorithms:
- a spatiotemporal clustering of points to regroup fires into a series of events confined in space and time; and
- an aggregation of the points within the identified clusters to provide additional information such as the beginning and end date of regrouped events.
This can be achieved through QGIS’ modeler to sequentially execute the ST-DBSCAN Clustering algorithm as well as the Aggregate algorithm against the output of the first algorithm.

The above-pictured model outputs two datasets. The first dataset contains single-part points of detected fires with attributes from the original VIIRS products as well as a pair of new attributes: the CLUSTER_ID provides a unique cluster identifier for each point, and the CLUSTER_SIZE represents the sum of points forming each unique cluster. The second dataset contains multi-part points clusters representing fire events with four attributes: CLUSTER_ID and CLUSTER_SIZE which were discussed above as well as DATE_START and DATE_END to identify the beginning and end time of a fire event.
In our specific example, we will run the model using the merged dataset we created above as the “fire points layer” and select ACQ_DATE_TIME as the “date field”. The outputs will be saved as separate layers within a geopackage file.
Note that the maximum distance (0.025 degrees) and duration (72 hours) settings to form clusters have been set in the model itself. This can be tweaked by editing the model.
Visualizing a specific fire event progression on a mapOnce the model has provided its outputs, we are ready to start visualizing a fire event on a map. In this practical example, we will focus on detected fires around latitude 53.0960 and longitude -75.3395.
Using the multi-part points dataset, we can identify two clustered events (CLUSTER_ID 109 and 1285) within the month of June 2023. To help map canvas refresh responsiveness, we can filter both of our output layers to only show features with those two cluster identifiers using the following SQL syntax: CLUSTER_ID IN (109, 1285).
To show the progression of the fire event over time, we can use a data-defined property to graduate the marker fill of the single-part points dataset along a color ramp. To do so, open the layer’s styling panel, select the simple marker symbol layer, click on the data-defined property button next to the fill color and pick the Assistant menu item.
In the assistant panel, set the source expression to the following:
day(age(to_date('2023-07-01'),”ACQ_DATE_TIME”)). This will give us the number of days between a given point and an arbitrary reference date (2023-07-01 here). Set the values range from 0 to 30 and pick a color ramp of your choice.
When applying this style, the resulting map will provide a visual representation of the spread of the fire event over time.
 Having identified a fire event via clustering easily allows for identification of the “starting point” of a fire by searching for the earliest fire detected amongst the thousands of points. This crucial bit of analysis can help better understand the cause of the fire, and alongside the color grading of neighboring points, its directionality as it expanded over time.
Analyzing a fire event through histogram
Having identified a fire event via clustering easily allows for identification of the “starting point” of a fire by searching for the earliest fire detected amongst the thousands of points. This crucial bit of analysis can help better understand the cause of the fire, and alongside the color grading of neighboring points, its directionality as it expanded over time.
Analyzing a fire event through histogram
Through QGIS’ DataPlotly plugin, it is possible to create an histogram of fire events. After installing the plugin, we can open the DataPlotly panel and configure our histogram.
Set the plot type to histogram and pick the model’s single-part points dataset as the layer to gather data from. Make sure that the layer has been filtered to only show a single fire event. Then, set the X field to the following layer attribute: “ACQ_DATE”.
You can then hit the Create Plot button, go grab a coffee, and enjoy the resulting histogram which will appear after a minute or so.
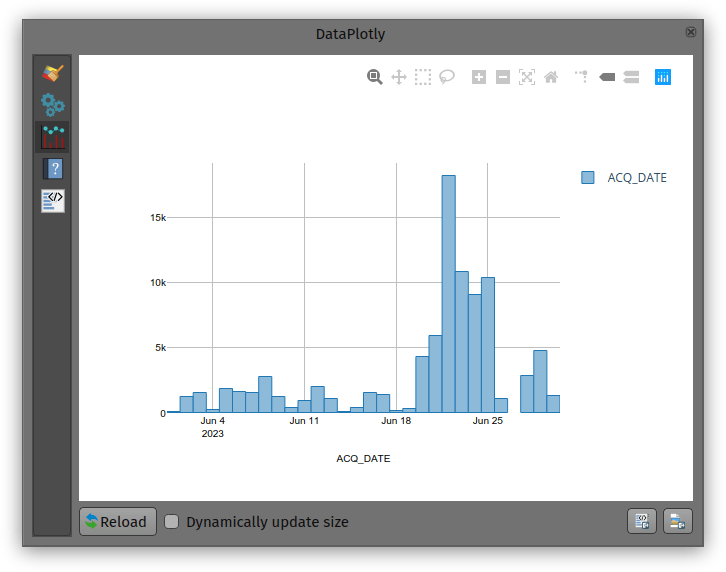
While not perfect, an histogram can quickly provide a good sense of a fire event’s “peak” over a period of time.
-
sur QGIS Blog: Plugin Update August 2023
Publié: 3 September 2023, 1:08pm CEST
In August 13 new plugins that have been published in the QGIS plugin repository.
Here’s the quick overview in reverse chronological order. If any of the names or short descriptions piques your interest, you can find the direct link to the plugin page in the table below the screenshot.

Cesium ion Browse and add datasets from Cesium ion Land Use Analyzer A plugin for Land Use spatial analysis tools GNAVS GNSS Navigate and Save Soar – the new atlas Import or export maps via the Soar platform FotovolCAT Spatial analysis automation for solar power station sitting in Catalonia QGISSPARQL-Layer2Triple Layer2Triple osm2topomap A plugin intended to intermediate the process of using OSM data for official (authoritative) Topographc Maps, or rather, databases Plugin Exporter A QGIS plugin for exporting plugins GetBaseLine GetBaseLine Fast Field Filler The plugin was created to quickly fill in the fields in the attribute table. Radiation ToolBox Plugin Plugin for loading data from Safecast and other radiation monitoring devices LocationIQ Geocoding and Maps LocationIQ integration to add geocoding and map tiles to QGIS Proxy Handler Adds prefix proxy addresses to connections -
sur From GIS to Remote Sensing: Road to the Semi-Automatic Classification Plugin v.8: Landsat and Sentinel-2 images download and preprocessing, classification
Publié: 2 September 2023, 11:10am CEST
This is the second post describing the main new features of the new version 8 (codename "Infinity") of the Semi-Automatic Classification Plugin (SCP) for QGIS, which will be released in October 2023.The new version is based on Remotior Sensus, a new Python processing framework.
The tool "Download products" has been updated to download Landsat and Sentinel-2 images from different services. In particular, through the service NASA Earthdata (registration required at [https:]] ) it will be possible to download the Harmonized Landsat and Sentinel-2 which are surface reflectance data product (generated with Landsat 8, Landsat 9, and Sentinel-2 data) with observations every two to three days at 30m spatial resolution (for more information read here). This is therefore a great source for frequent and homogeneous monitoring.Moreover, Copernicus Sentinel-2 images will be searched through the Copernicus Data Space Ecosystem API, while the images are downloaded through the Google Cloud service that provides the free dataset as part of the Google Public Cloud Data program.Other download services that were available in SCP 7 (e.g. Sentinel-1, ASTER images) will be available with future updates.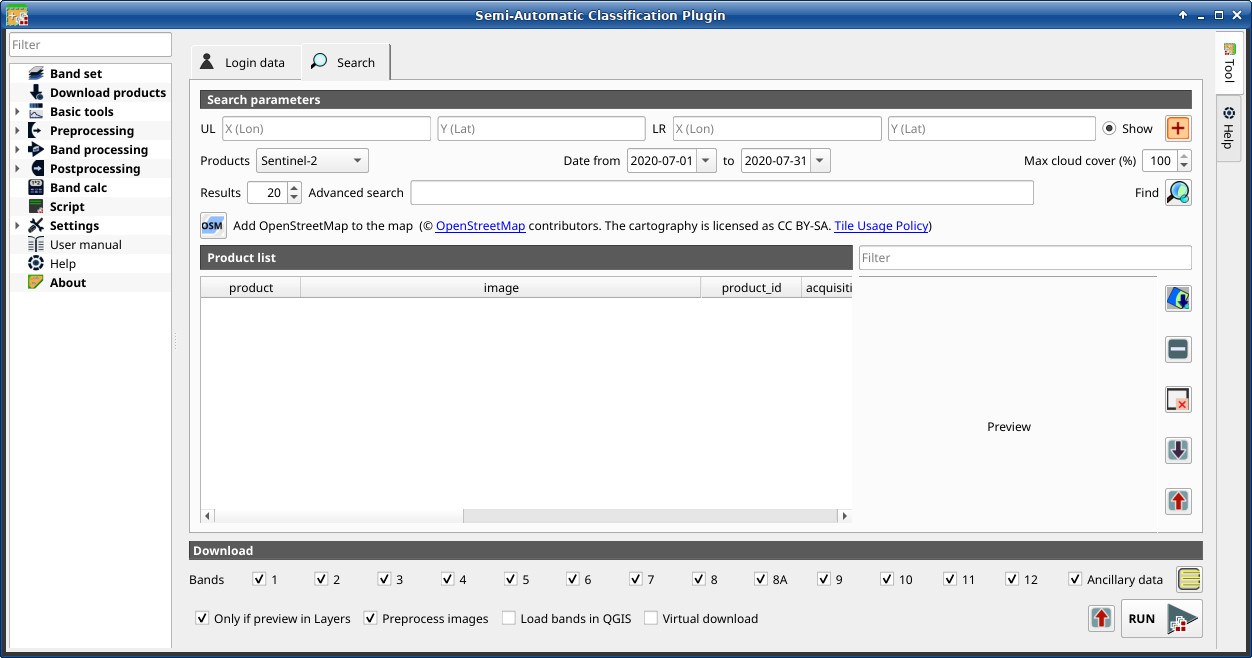
Read more » -
sur GeoSolutions: Partnership with Ecoplan (Bosnia & Herzegovina)
Publié: 1 September 2023, 5:45pm CEST
You must be logged into the site to view this content.
-
sur Free and Open Source GIS Ramblings: Comparing geographic data analysis in R and Python
Publié: 1 September 2023, 10:14am CEST
Today, I want to point out a blog post over at
written together with my fellow “Geocomputation with Python” co-authors Robin Lovelace, Michael Dorman, and Jakub Nowosad.
In this blog post, we talk about our experience teaching R and Python for geocomputation. The context of this blog post is the OpenGeoHub Summer School 2023 which has courses on R, Python and Julia. The focus of the blog post is on geographic vector data, meaning points, lines, polygons (and their ‘multi’ variants) and the attributes associated with them. We plan to cover raster data in a future post.
-
sur GeoTools Team: GeoTools 28.5 Released
Publié: 31 August 2023, 12:07pm CEST
The GeoTools team are pleased to announce the release of the latest stable version of GeoTools 28.5 geotools-28.5-bin.zip geotools-28.5-doc.zip geotools-28.5-userguide.zip geotools-28.5-project.zip This release is also available from the OSGeo Maven Repository and is made in conjunction with -
sur GeoTools Team: GeoTools 28.5 Released
Publié: 31 August 2023, 12:01pm CEST
The GeoTools team are pleased to announce the release of the latest stable version of GeoTools 28.5 geotools-28.5-bin.zip geotools-28.5-doc.zip geotools-28.5-userguide.zip geotools-28.5-project.zipThis release is also available from the OSGeo Maven Repository and is made in conjunction with GeoServer 2.22.5. We are grateful to Peter Smythe (AfriGIS) for carrying out the -
sur gvSIG Batoví: edición 2023 del concurso: Proyectos de Geografía con estudiantes y gvSIG Batoví
Publié: 30 August 2023, 8:32pm CEST

Habiendo finalizado con éxito la etapa de capacitación de la iniciativa Geoalfabetización mediante la utilización de Tecnologías de la Información Geográfica, lanzamos la convocatoria a participar de la edición 2023 del concurso: Proyectos de Geografía con estudiantes y gvSIG Batoví. Pueden acceder aquí a la convocatoria y bases.
Todos los años tenemos alguna novedad y este año no es la excepción:
- tenemos el apoyo del Instituto Panamericano de Geografía e Historia (la iniciativa fue seleccionada por el Programa de Asistencia Técnica 2023, Proyecto PAT No. GEOG-04/2023 Geoalfabetización mediante la utilización de Tecnologías de la Información Geográfica)
- este año participa también la Dirección General de Educación Técnico Profesional (UTU)
- la certificación se obtiene participando del curso y del concurso
- contamos con la colaboración de la Universidad Politécnica de Madrid en la organización de la iniciativa
Agradecemos el apoyo de todas las instituciones que hacen posible la realización de esta propuesta.
-
sur GeoServer Team: GeoServer 2.22.5 Release
Publié: 30 August 2023, 2:00am CEST
GeoServer 2.22.5 release is now available with downloads ( bin, war, windows) , along with docs and extensions.
This is a maintenance release of GeoServer providing existing installations with minor updates and bug fixes. GeoServer 2.22.5 is made in conjunction with GeoTools 28.5, and GeoWebCache 1.22.5.
Thanks to Peter Smythe (AfriGIS) for making this release.
2023-09-05 update: GeoServer 2.22.5 has been recompiled and uploaded to SourceForge. The initial upload was accidentally compiled with Java 11 and would not function in a Java 8 environment.
Thanks to Jody Garnett (GeoCat) for this update, and Steve Ikeoka for testing in a Java 8 environment.
Java 8 End-of-lifeThis GeoServer 2.22.5 maintenance release is final scheduled release of GeoServer 2.22.x series, and thus the last providing Java 8 support.
All future releases will require a minimum of Java 11.
Security ConsiderationsThis release addresses security vulnerabilities and is considered an essential upgrade for production systems.
This blog post will be updated in due course with CVE numbers following our coordinated vulnerability disclosure policy.
See project security policy for more information on how security vulnerabilities are managed.
Release notesImprovement:
- GEOS-10856 geoserver monitor plugin - scaling troubles
- GEOS-11048 Improve URL checking
- GEOS-11081 Add option to disable GetFeatureInfo transforming raster layers
- GEOS-11099 ElasticSearch DataStore Documentation Update for RESPONSE_BUFFER_LIMIT
- GEOS-11100 Add opacity parameter to the layer definitions in WPS-Download download maps
Bug:
- GEOS-10874 Log4J: Windows binary zip release file with log4j-1.2.14.jar
- GEOS-10875 Disk Quota JDBC password shown in plaintext
- GEOS-10901 GetCapabilities lists the same style multiple times when used as both a default and alternate style
- GEOS-10903 WMS filtering with Filter 2.0 fails
- GEOS-10932 csw-iso: should only add ‘xsi:nil = false’ attribute
- GEOS-11025 projection parameter takes no effect on MongoDB Schemaless features WFS requests
- GEOS-11035 Enabling OSEO from Workspace Edit Page Results in an NPE
- GEOS-11054 NullPointerException creating layer with REST, along with attribute list
- GEOS-11055 Multiple layers against the same ES document type conflict with each other
- GEOS-11069 Layer configuration page doesn’t work for broken SQL views
Task:
- GEOS-11062 Upgrade [httpclient] from 4.5.13 to 4.5.14
- GEOS-11063 Upgrade [httpcore] from 4.4.10 to 4.4.16
- GEOS-11067 Upgrade wiremock to 2.35.0
- GEOS-11092 acme-ldap.jar is compiled with Java 8
For the complete list see 2.22.5 release notes.
About GeoServer 2.22 SeriesAdditional information on GeoServer 2.22 series:
- GeoServer 2.22 User Manual
- Update Instructions
- Metadata extension
- CSW ISO Metadata extension
- State of GeoServer (FOSS4G Presentation)
- GeoServer Beginner Workshop (FOSS4G Workshop)
- Welcome page (User Guide)
Release notes: ( 2.22.5 | 2.22.4 | 2.22.3 | 2.22.2 | 2.22.1 | 2.22.0 | 2.22-RC | 2.22-M0 )
-
sur gvSIG Team: Curso-Concurso TIGs y gvSIG Batoví. 6ª edición
Publié: 29 August 2023, 8:56am CEST

Nos hacemos eco del lanzamiento de la 6ª edición del Curso-Concurso TIGs y gvSIG Batoví. Este año viene con una importante novedad, Colombia se suma a esta iniciativa uruguaya.
Y se ha comunicado que más de cien docentes de Uruguay y Colombia ya se inscribieron al curso TIGs y gvSIG Batoví… ¡enhorabuena!
-
sur Sean Gillies: Bear training week ~5 recap
Publié: 28 August 2023, 3:54am CEST
The third week of my season's big training block was my biggest yet from the climbing perspective. My runs averaged 220 feet of elevation gain (D+) per mile, which is what the Bear 100 course will demand of me in 5 weeks. Here are last week's numbers.
20 hours, 37 minutes
76.2 miles
16,775 feet D+
Extrapolating that to 100 miles, naively, predicts a 28 hour finish. That would be amazing! There's no way I'm going to finish in 28 hours. I think I'll be able to keep up this week's average pace for 60 miles and then will slow down dramatically after that. We'll see!
Next week I'm giving myself a break from long hilly runs. I'll do daily runs of not much more than an hour, yoga, some strength and conditioning. And I'll be working on my race day planning: gear, drop bags, fueling, etc.
-
sur GRASS GIS: New Docker images for GRASS GIS
Publié: 27 August 2023, 10:42am CEST
Moving GRASS GIS Docker Images to the OSGeo Repository In the field of open source software development and deployment, the accessibility and maintenance of resources is of paramount importance. To this end, there has been a major change in the repository structure for the GRASS GIS Docker images. In the past years, these Docker images have been maintained and hosted under the mundialis organisation’s repository. The company mundialis has played a crucial role in providing and maintaining these images, ensuring their availability and stability for the wider GIS community. -
sur From GIS to Remote Sensing: Road to the Semi-Automatic Classification Plugin v.8: Band sets, Band calc and Scripts
Publié: 26 August 2023, 12:10am CEST
As already announced, the new version 8 (codename "Infinity") of the Semi-Automatic Classification Plugin (SCP) for QGIS will be released in October 2023.This post describes a few main new features of the SCP, which is still under development, based on a completely new Python processing framework that is Remotior Sensus.
The Main interface will include all the tools, as in SCP version 7. The Band set tab will allow to manage more than one Band set; the interface has been restyled with a table on the left to manage the list of Band sets, and the larger table on the right to display the bands of the active band set.
Read more » -
sur KAN T&IT Blog: XVII Jornadas IDERA: Nuestra Experiencia
Publié: 25 August 2023, 7:56pm CEST
Cada año, desde 2007, la Infraestructura de Datos Espaciales de la República Argentina (IDERA) extiende su invitación a los apasionados de la información geoespacial a unirse a las Jornadas IDERA. Este evento anual se ha convertido en una tradición, y en 2023, se llevó a cabo en la hermosa ciudad de Santa Rosa, provincia de La Pampa, Argentina. Es un hecho que IDERA se enorgullece de propiciar un espacio donde los expertos pueden compartir y celebrar los avances en el campo de la información geoespacial.
El equipo de Kan participó de este evento, que tuvo como objetivo central impulsar la publicación de datos, productos y servicios geoespaciales de manera eficiente y oportuna, con la finalidad de respaldar la toma de decisiones basadas en evidencias. Las XVII Jornadas IDERA fueron el punto culminante de este esfuerzo, transformándose en el evento geoespacial del año en Argentina. Fue un momento invaluable para intercambiar ideas y debatir sobre los avances y desafíos relacionados con la publicación y utilización de información geoespacial abierta, interoperable y accesible para el desarrollo del país.
Bajo el lema “La comunidad de IDERA hacia un marco integrado de información geoespacial”, las XVII Jornadas IDERA proporcionaron un espacio de reflexión sobre las propuestas globales emergentes destinadas a desarrollar, integrar y fortalecer la gestión de información geoespacial. Este enfoque permitirá mejorar las Infraestructuras de Datos Espaciales en los diferentes niveles jurisdiccionales de Argentina.

La agenda de las XVII Jornadas IDERA estuvo repleta de eventos emocionantes y presentaciones interesantes. Los talleres y ponencias que realizamos desde Kan fueron los siguientes:
Presentación institucional de KAN en el espacio de networking
Taller “Potenciá el uso de tus datos geo con Geonode 4”
Presentación de casos de éxito en el grupo de provincias
Taller “Recolección de datos en campo con Kobo” Ponencia “
Desarrollo de un Sistema de Monitoreo y Manejo Integral de Humedales a partir de Información Satelital”
Además aprovechamos para compartir y asistir a otras charlas y muestras de nuestros colegas. Muchísimas gracias IDERA por esta oportunidad única para conectarnos con otros expertos, dejarnos aprender de sus experiencias y contribuir al avance de la comunidad de información geoespacial en Argentina. ¡Nos vemos el próximo año!
-
sur Stefano Costa: Gli atti del workshop Archeofoss 2022 sono stati pubblicati
Publié: 23 August 2023, 12:38pm CEST
Gli atti del workshop Archeofoss 2022 sono stati pubblicati in open access su Archeologia e Calcolatori. Li trovate qui [www.archcalc.cnr.it] come numero 34.1 della rivista.
Ho curato insieme a Julian Bogdani l’edizione di questo volume ed è quindi motivo di soddisfazione, anche per i tempi rapidi con cui siamo arrivati alla pubblicazione grazie al lavoro collettivo degli autori e autrici, di chi ha fatto il referaggio, della redazione e della casa editrice.
Rimane una mancanza in questo volume rispetto alla ricchezza dei due giorni di incontro, delle sette sessioni tematiche, delle discussioni guidate da chi ha moderato le sessioni, ibride eppure vivacissime. La mancanza in parte è fisiologica ma in parte deriva da un certo numero di autrici e autori che non hanno presentato il proprio contributo per la pubblicazione. Ad esempio, nella sessione sui dati stratigrafici che ho moderato con Emanuel Demetrescu erano stati presentati 7 interventi ma solo 2 sono confluiti come paper nel volume.
Nei prossimi anni dovremo fare di più per fare in modo che gli atti raccolgano ancora più fedelmente il convegno.
Ci ritroveremo con la comunità Archeofoss a Torino nel mese di dicembre 2023.
-
sur QGIS Blog: QGIS server 3.28 is officially OGC compliant
Publié: 22 August 2023, 12:05pm CEST
QGIS Server provides numerous services like WMS, WFS, WCS, WMTS and OGC API for Features. These last years, a lot of efforts were made to offer a robust implementation of the WMS 1.3.0 specification.
We are pleased to announce that QGIS Server LTR 3.28 is now certified against WMS 1.3.0.

This formal OGC certification process is performed once a year, specifically for the Long Term Release versions. But, as every change in QGIS source code is now tested against the formal OGC test suites (using OGC TeamEngine) to avoid any kind of regressions, you can always check any revision of the code against OGC failures in our Github continuous integration results.
All this has been possible thanks to the QGIS’s sustaining members and contributors.
-
sur Sean Gillies: Bear training week ~6 recap
Publié: 20 August 2023, 8:14pm CEST
For fun I'm using the bitwise complement operator
~in the title of this post. Race week is week ~0. On Monday, it was 6 weeks to race week. I'm starting to feel fit, close to my 2020-2021 form.The numbers for the week:
16 hours, 54 minutes
71 miles
12,165 feet D+
I've run six days in a row and my shortest run was today's: an hour and 20 minutes. I went out for five hours in Rocky Mountain National Park on Wednesday, two hours in Lory State Park on Friday, and five and a half hours at Horsetooth Open Space on Saturday.

Soaking hot and tired feet in the Big Thompson River below Fern Lake in RMNP.

Below the Westridge Wall in Lory S.P.

Alone on Arthur's Rock, looking NE across the reservoir and plains.

Towers trail tailgating
A bear was active around Towers Trail yesterday, but successfully avoided me. According to some bikers, it crossed the trail behind my back near the top during my first lap. If I'd turned when I heard them shouting, I might have seen it. I know there are bears up there, but have never seen one while I've been on the trail. It's a good time to be filling up on chokecherries, that's for sure.
Next week I'm going to increase my training volume a little more. Instead of two 5.5 hour runs, I'll aim for 3 x 4 hours.
-
sur Free and Open Source GIS Ramblings: I’ve archived my Tweets: Goodbye Twitter, Hello Mastodon
Publié: 20 August 2023, 4:38pm CEST
Today, Jeff Sikes @box464@firefish.social, alerted me to the fact that “Twitter has removed all media attachments from 2014 and prior” (source: [https:]] ). So far, it seems unclear whether this was intentional or a system failure (source: [https:]] ).
Since I’ve been on Twitter since 2011, this means that some media files are now lost. While the loss of a few low-res images is probably not a major loss for humanity, I would prefer to have some control over when and how content I created vanishes. So, to avoid losing more content, I have followed Jeff’s recommendation to create a proper archival page:
It is based on an export I pulled in October 2022 when I started to use Mastodon as my primary social media account. Unfortunately, this export did not include media files.
To follow me in the future, find me on:
Btw, a recent study published on Nature News shows that Mastodon is the top-ranking Twitter replacement for scientists.
To find other interesting people on Mastodon, there are many useful tools and lists, including, for example:
-
sur QGIS Blog: Plugin Update June & July 2023
Publié: 16 August 2023, 8:27pm CEST
In this summer plugin update, we explore 51 new plugins that have been published in the QGIS plugin repository.
Here’s the quick overview in reverse chronological order. If any of the names or short descriptions piques your interest, you can find the direct link to the plugin page in the table below the screenshot.


JAPATI The QGIS plugin is used by agencies in the West Java provincial government to upload data and create map services on the geoserver in order to publish data internally and publicly BD TOPO® Extractor This tool allows you to extract specific data from IGN’s BD TOPO®. The extraction is based on either an extent drawned by the user on the map canvas or a layer’s extent. Opacity Set Sets opacity 0.5, 0.75 or 1 for selected raster layer. USM toolset (Urban Sprawl Metric toolset) The USM Toolset was developed to facilitate the calculation of Weighted Urban Proliferation (WUP) and all components of urban sprawl for landscapes that include built-up areas (e.g., dispersion (DIS), land uptake per person (LUP). DAI DAI (Daily Aerial Image) France Commune Cadastre Search for a cadastral parcel with the French cadastre API Two distances intersection Get the intersection of two distances (2D cartesian) IDG Plugin providing easy access to data from different SDI SPAN SPAN is a flexible and easy to use open-source plugin based on the QGIS software for rooftop mounted PV potential estimation capable of estimating every roof surface’s PV potential. CSV Batch Import Batch import of CSV vector layers Imagine Sustainability sustainability assessment tool based on geographic MCDA algorithms. Especially suitable for Natura 2000 sites, based on pyrepo-mcda package( [https:]] ) QGIS Hub Plugin A QGIS plugin to fetch resources from the QGIS Hub VFK Plugin Data ?eského katastru nemovitostí (VFK)<br><br>Czech cadastre data (VFK) LinearReferencing Tools for linear referenced data CIGeoE Circumvent Polygon Changes the line to circumvent a polygon between the intersection points UA XML importer ???????? ????????? ???????, ????????, ????? ?? ?????????????? ??? ? ???????????? ????????? ????? XML eagris QGIS eAGRI plugin Geojson Filling Allows to fill imported geojson layers with pre-defined field values Save All File saving script that saves qgis project file and all vector and raster layers into user-specified folder. Automatically detects file type and saves as that file type (supports SHP, GPKG, KML, CSV, and TIF). All styles and formatting are saved with each layer (except for KML), ensuring that they are opened up with the proper style the next time the project is opened. Temporary layers are made permanent automatically. Fast Density Analysis A fast kernel density visualization plugin for geospatial analytics StreetSmart This plugin manages the Street Smart imagery FilePath Copies the path of layer pandapower QGis Plugin Plugin to work with pandapower or pandapipes networks Eqip Qgis Pip Management Infra-O plugin Plugin for Finnish municipal asset management. Add to Felt Create a collaborative Felt (felt.com) map from QGIS Lahar Flow Map Tools This plugin is for opening and processing results from LaharFlow Station Offset This plugin computes the station and offset of points along polylines and exports those values to csv for other applications Jilin1Tiles Jilin1Tiles SiweiEarth This plugin is used to load the daily new map provided by Siwei Earth. QdrawEVT Easily draw and select entities in the drawing footprint. Installation of the plugin “Memory layer saver” highly recommended. See Read_me.txt file in the Help folder of the plugin. Dessiner et selectionner facilement les entités dans l’emprise du dessin. Installation du plugin “Memory layer saver” fortement recommandé. Voir fichier Lisez_moi dans le dossier Hepl du plugin. Merci ! Fuzzy Logic Toolbox This plugin implements the fuzzy inference system feature_space A plugin to plot feature space and export areas as raster or vector Panorama Viewer Plugin for QGIS to view 360-degrees panoramic photos Map Segmenter Uses machine learning to segment a map into ares of interest. ALKIS Plugin Das Plugin verfügt über zwei Werkzeugkästen und insgesamt vier einfache Werkzeuge. Im Werkzeugkasten “Gebäude” finden Sie drei nützliche Werkzeuge, um ALKIS-Gebäudedaten aufzubereiten. Sie können Dachüberstände erstellen, Gebäude auf der Erdoberfläche extrahieren und redundante Gebäudeteile eliminieren. Im Werkzeugkasten “Nutzung” steht Ihnen ein weiteres Werkzeug zur Verfügung, mit dem Sie die Objektarten in den Objektartengruppen Vegetation, Siedlung, Verkehr und Gewässer zuordnen können. Das Plugin erfordert als Datengrundlage ALKIS-Daten im vereinfachten Format, die in NRW, Deutschland, frei verfügbar sind. Dieses Plugin wurde zu Demonstrationszwecken entwickelt. Das Ziel besteht darin, in einer Videoreihe die Entwicklung eines Plugins ohne die Anwendung von Python vorzustellen. Die Tutorials dazu findet ihr in der folgenden Playlist: [https:]] isobenefit Isobenefit Urbanism plugin for QGIS. UA_MBD_TOOLS Tools for Qpositional assessment the positional quality of geographic data Terraform Implementation of popular topographic correction algorithms and various methods of their evaluation. PathoGAME The goal is to find the location of the contamination as soon as possible. Azure Maps Creator Provides access to Azure Maps Creator services CIGeoE Identify Dangles Identifies dangles in a viewport Delete Duplicate Fields Delete duplicate or redundant fields from a vector file LocationFinder Allow QGIS to use LocationFinder (interactive geocoding) COA TPW Polygonizer This plugin can be used to create polygons that track the shape of a line network, including the proper handling of intersections with common nodes of the line segments. XPlan-Umring Create XPlanGML from polygon(s) Tweet my river AI Tweet classifier for river layers 3DCityDB Tools Tools to visualize and manipulate CityGML data stored in the 3D City Database GroundTruther A toolset for Seafloor Caracterization Faunalia Toolkit Cartographic and spatial awesome analysis tool and much much more! -
sur PostGIS Development: PostGIS 3.4.0
Publié: 15 August 2023, 2:00am CEST
The PostGIS Team is pleased to release PostGIS 3.4.0! This version works with versions PostgreSQL 12-16, GEOS 3.6 or higher, and Proj 6.1+. To take advantage of all features, GEOS 3.12+ is needed. To take advantage of all SFCGAL features, SFCGAL 1.4.1+ is needed.
3.4.0This release is a major release, it includes bug fixes since PostGIS 3.3.4 and new features.
-
sur GRASS GIS: Report of the GRASS GIS Community Meeting in Prague
Publié: 13 August 2023, 1:12pm CEST
Community Meeting to celebrate the GRASS GIS 40th birthday!! The GRASS GIS Community Meeting was held in the Czech Republic from June 2 to 6 at the Faculty of Civil Engineering of the Czech Technical University in Prague. The meeting was a milestone event to celebrate the 40th birthday of GRASS GIS and brought together users, supporters, contributors, power users and developers to celebrate, collaborate and chart the future of GRASS GIS. -
sur Jackie Ng: MapGuide Maestro 6.0m12 nuget packages now available on nuget.org
Publié: 12 August 2023, 12:47pm CEST
nuget.org support finally provided a resolution on my account issue and I was able to regenerate my publishing keys.
As a result, the 6.0m12 release (6.0.0-pre500) nuget packages are now finally available on nuget.org
We now return to your regularly scheduled programming ... -
sur Stefano Costa: I servizi da tè e caffè di Laveno al Museu Nacional Feroviario del Portogallo
Publié: 12 August 2023, 9:45am CEST
Ho scritto un articolo sul nuovo forum per gli appassionati di ceramica italiana. Treni e tazzine da caffè, una accoppiata particolare!
-
sur GeoSolutions: GeoNode 4.1.1 is out
Publié: 10 August 2023, 4:43pm CEST
You must be logged into the site to view this content.
-
sur Jackie Ng: Where's the new Maestro API nuget packages?
Publié: 7 August 2023, 1:34am CEST
There were a few things I left out of the previous announcement that I'll use this post to address.
Firstly, the 6.0m12 release of MapGuide Maestro formally drops all Fusion editor support for integration with Google Maps tiles and services. We no longer support Google Maps integration in Fusion and the editor in previous releases gave the false impression that this is still possible. That is no longer the case with this release.
Secondly, the more important thing (and the subject of this post) is that if you are using the Maestro API and consume this through nuget packages from nuget.org you may be wondering why there are no new versions?
The answer to that one is simply: My nuget package publishing keys have expired and something in the nuget.org website or something with my nuget.org account is preventing me from regenerating these keys or to generate a fresh set. As a result, I currently cannot upload any new nuget packages to nuget.org
But do not fret, because there is an alternative solution.
As part of the MapGuide Maestro release on GitHub, the nuget .nupkg files are also included

From here, you can set up a local directory-based nuget package source, drop the .nupkg files into it and the this version of the package is available to install in your Visual Studio solution.
If/when I get a resolution on this publishing key matter, I will upload the .nupkg files for this release and make another announcement. Until then, this local package source is a suitable workaround.
-
sur Narcélio de Sá: A Importância das Conferências do State of the Map para o OpenStreetMap
Publié: 6 August 2023, 7:46pm CEST
Se você teve a sorte de participar de uma conferência do State of the Map (SotM), já sabe que elas oferecem alguns dos melhores conhecimentos, habilidades e treinamentos em SIG (Sistemas de Informações Geográficas) e geoespaciais disponíveis. Isso é além de ser um evento de networking fantástico, com muito tempo social divertido e envolvente. Se você é novo na comunidade do OpenStreetMap e ainda não participou de um SotM, ou faz parte de uma empresa pensando em patrocinar um SotM, juntamente com o envio de uma equipe para participar, este post é para você.
 Image credit: Parker Michels-Boyce Photography. Please tag @OpenStreetMapUS in social media posts when using these photos.
O que é um State of the Map – SotM?
Image credit: Parker Michels-Boyce Photography. Please tag @OpenStreetMapUS in social media posts when using these photos.
O que é um State of the Map – SotM?
Os membros da comunidade do OpenStreetMap (OSM) organizam encontros anuais do State of the Map como uma forma de construir comunidade, compartilhar ferramentas e pesquisas, e estabelecer contatos entre si com o objetivo comum de melhorar o mapa. Esses encontros têm diversos tamanhos e são organizados local, regional e globalmente, mas o objetivo é sempre o mesmo: se reunir para discutir pesquisas sobre a criação de mapas, ferramentas, iniciativas e outros tópicos da comunidade. Os SotMs locais e regionais são organizados por comunidades locais, e o SotM global é organizado pela Fundação OSM.
As conferências do Estado do Mapa estabelecem pontes entre os mapeadores do OSM e ativistas comunitários, desenvolvedores de código aberto, pesquisadores de universidades e instituições acadêmicas, designers, cartógrafos, bem como profissionais de tecnologia de empresas privadas e instituições públicas.
Quais Tipos de Tópicos são Discutidos?A variedade de tópicos é tão diversa quanto a comunidade. As apresentações variam desde “palestras relâmpago” de 5 minutos até apresentações de 15-20 minutos e workshops de 75 minutos. Eles abordam temas como desenvolvimento de plataformas e ferramentas, análise de dados, mapeamento humanitário e muitos outros. Os apresentadores estão afiliados a comunidades locais, Youthmappers, HOTOSM, maplibre, FOSS4G, academia, outras organizações sem fins lucrativos e empresas pequenas e grandes.
A conferência global SotM de 2022 em Firenze, Itália, fornece um bom exemplo da variedade de informações e habilidades representadas em um SotM. Aqui estão apenas alguns títulos de sessões: “OSM Carto as Vector tiles; Innovating on Derivative OpenStreetMap Datasets”, Mapping a Small Town”, “maplibre-rs: Cross-platform Map Rendering using Rust”, “Ten Years iD Editor—The Road Ahead”, “Women Leadership in Mapping Riverside Communities in the Amazon Forest Using OSM.”
Esses exemplos mal arranham a superfície. Aqui está o programa completo e as gravações das apresentações. Há também uma exposição de pôsteres – sim, até as paredes do SotM de 2022 eram educacionais! E há um resumo dos procedimentos acadêmicos.

Portanto, como você pode ver, um SotM oferece inspiração e conhecimento para qualquer pessoa interessada no futuro da tecnologia geoespacial, OpenStreetMap e software e dados livres e de código aberto.
Participe do State of the Map Curitiba 2023
Faça Parte do State of the Map Brasil 2023: Conectando-se ao Futuro do Mapeamento Geoespacial!
Prepare-se para uma experiência extraordinária! Estamos animados em anunciar o aguardado “State of the Map Brasil 2023?. De 2 a 4 de outubro de 2023, você terá a oportunidade de se envolver nesse evento imperdível, sediado na renomada Universidade Federal do Paraná, na charmosa cidade de Curitiba. E tem mais: este evento incrível acontecerá em um formato híbrido, permitindo que você participe tanto pessoalmente quanto virtualmente. Ah, e não se esqueça de marcar em sua agenda a pré-conferência, no dia 30 de setembro (sábado), para um mergulho profundo em conhecimento e networking.
Se você é um aficionado por mapeamento, um pesquisador curioso ou um usuário ávido por dados geoespaciais, esta é a sua oportunidade de brilhar! Estamos convocando você a compartilhar suas experiências, ideias inovadoras e trabalhos científicos através da nossa chamada para resumos de experiências acadêmicas e práticas. Mal podemos esperar para ver as gemas de conhecimento que você tem a oferecer.
O SOTM Curitiba 2023 é uma chance única para compartilhar sua expertise, conectar-se com colegas entusiastas e explorar as tendências mais recentes no mundo do mapeamento geoespacial. Junte-se a nós nessa emocionante jornada e contribua para construir um futuro mais mapeado e interconectado.
Para obter mais detalhes e informações sobre o evento, visite o site oficial aqui.
Não perca essa oportunidade singular. Estamos ansiosos para receber sua contribuição e encontrá-lo(a) pessoalmente no SOTM Curitiba 2023!
Fonte:
Why State of the Map Conferences Are So Important to OSM
The post A Importância das Conferências do State of the Map para o OpenStreetMap appeared first on Narcélio de Sá.
-
sur GRASS GIS: GRASS GIS 7.8.8 released
Publié: 6 August 2023, 1:38pm CEST
What’s new in a nutshell The GRASS GIS 7.8.8 release provides more than 80 improvements and fixes compared to the 7.8.7 release. This release is expected to be the last 7.8 release. Development continues with GRASS GIS 8.x. The overview of features in the 7.8 release series is available at new features in GRASS GIS 7.8. See also our detailed announcement with the full list of changes and bugs fixed at [https:] -
sur Sean Gillies: Never Summer training weekend recap
Publié: 5 August 2023, 4:15am CEST
Thursday, July 27, I drove west on CO-14 up the long Poudre River canyon and over Cameron Pass to Gould, the base for the Never Summer 60K and 100K races, for three days of camping and running in the mountains. Friday I would run the 60K race, Saturday I would go out for a few hours in the morning, and Sunday I would run a few more hours before driving home. Back-to-back-to-back easy long runs at high elevation to help me get in shape for the Bear 100 in September.
I had completely fair weather for the drive and for setting up my tent. I tossed a drop bag with spare shoes and socks in the truck bound for the Bockman aid station, caught up with other runners who I haven't seen in a while, cooked some quinoa for dinner, and tucked myself in.

Nokhu crags from Cameron Pass on CO-14
Thunderstorms passed over Gould almost all night long. I slept fitfully, and struggled to get my act together before the 5:30 a.m. start. I tied my shoes in the last 30 seconds before race director Nick Clark let us go. Not being a morning person, getting to the start on time is always a challenge for me.
After two miles of rolling along the margin of the valley floor, the course climbs steeply up Seven Utes Mountain. I stopped feeling groggy and started feeling the effort. I hiked the whole thing, comfortable at the back of the pack, and in a little over an hour, I was on top of the first alpine summit.
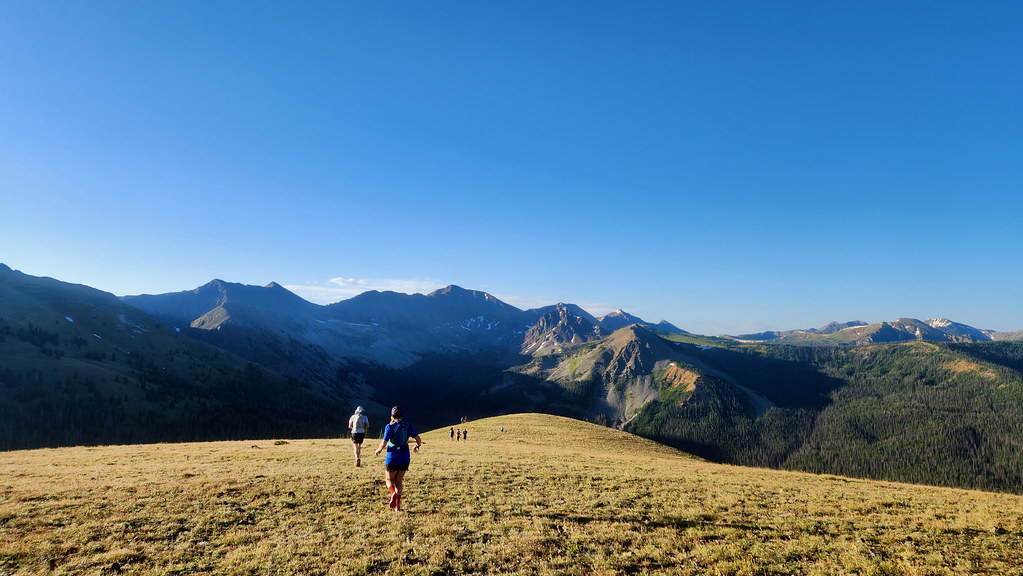
Runners heading down from the summit of Seven Utes Mountain, mile 6
My plan for the day was to go at an average pace of 20 minutes per mile. At the Bear 100, this would equate to a 33 hour finish, comfortably within the 36 hour cut off. I got to the Michigan Ditch aid station (11 miles) ahead of schedule and reached the Diamond Peak aid station (19 miles) 45 minutes ahead of schedule. The segment between them climbs 1000 feet, then becomes a highly runnable downhill. I ate solid food at the aid station, filled some pockets with cookies, and took 3 soft bottles of VFuel (race sponsor) solution to get me through the Diamond Peak climb and the ridge connection to Montgomery Pass.
Sweltering conditions made the first part of the Diamond Peak climb tough. A steady breeze above treeline helped make the slow, steep slog up the ridge more comfortable. The last unforgettable mile of the climb has a vertical gain of 1370 feet.
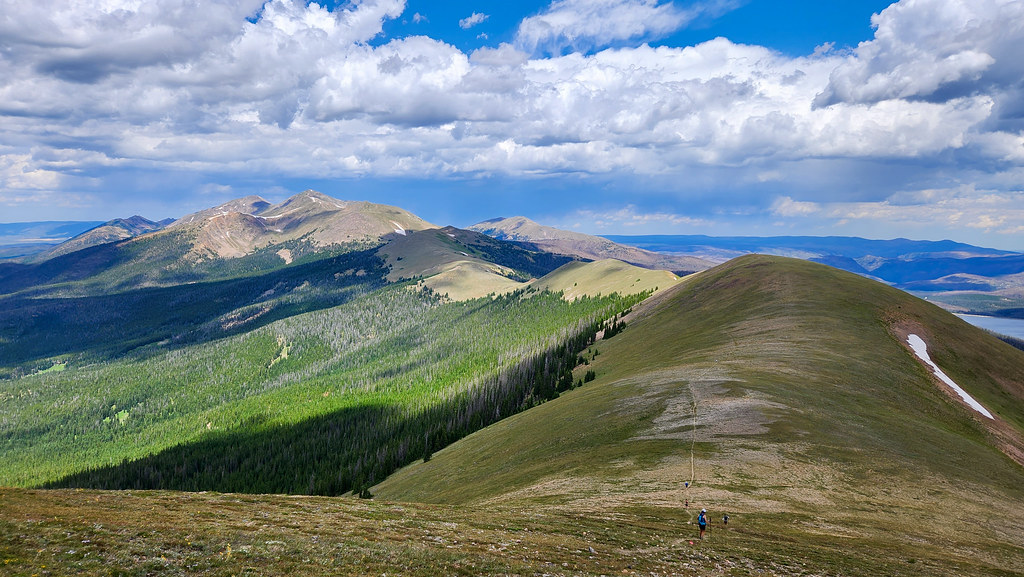
The ridge between North Diamond Peak and Montgomery Pass, mile 21
I took it easy on top, taking lots of pictures with my phone, and texting them to my family. News from the course always makes my mom happy. I reached the Montgomery Pass aid station a little less than three hours after leaving the Diamond Peak aid station.
I've been recovering from a back injury, perhaps from my crash at Kettle Moraine, and by the time I reached Montgomery Pass it had seized up. I wasn't able to do any consistent downhill running after this point. Still, seven hours of pain free running and hiking felt like major progress. I hope I'll be close to 100 percent by the Bear. I hiked down to Bockman aid station, did not change shoes and socks, grabbed more drinks and cookies, and hiked and jogged intermittently to the finish. I was just seven minutes over my goal.
Fort Collins runners Clint Anders and Jenna Bensko won the men's and women's divisions. Full results are here on OpenSplitTime.
Saturday morning I woke early to the sounds of the 100K race starting, dozed for another two hours, then drove 45 minutes to the Bockman aid station. It was dormant at 9. It is the 100K race's 50 mile mark and the first runner wouldn't be arriving before 2 p.m. From Bockman, I hiked the course in reverse to the Ruby Jewel aid station, then went forward on the course to the pass overlooking Kelly Lake, roughly mile 35. The lead runner and eventual winner, Zachary Russell, caught up to me just before the top. I stuck around to see the next ten runners come over, then headed back to Ruby Jewel. Saturday was warm, and the closer I got to Ruby Jewel, the more suffering I saw on faces. I heard later that 50 runners dropped out there at mile 31.
Pass above Kelly Lake, mile 35
I returned to Bockman, hung out there chatting with the aid station crew for a bit, then went for a swim in North Michigan Reservoir, a place where I've camped with my family, and which is full of water again after being drained for maintenance of the dam in 2021. After cooling and washing off, I returned to my camp at the race finish to change and get ready to work at the kitchen. From 6 p.m. until midnight I washed dishes and served food to runners. The kitchen group was a lot of fun and was lead by an actual chef who does the same duty at Hardrock 100 and a few other serious races. People are super grateful for a hot meal after a long day on the trail or at an aid station, and there isn't anywhere to eat in Gould. I would do this again.
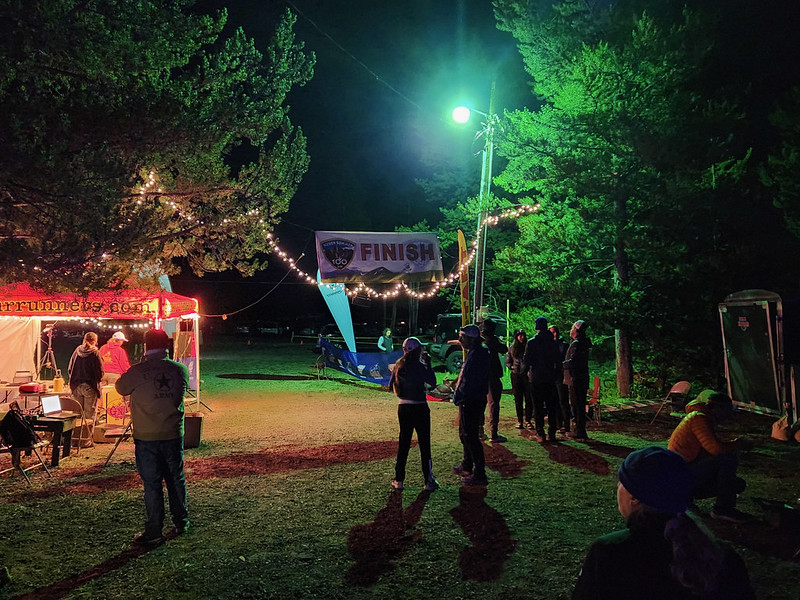
100K finish line
I slept very little Saturday night. Runners trickled in until 6 a.m., and Brad Bishop (volunteer coordinator and finish line announcer among many roles) read every name and number over the PA system. On the bright side, I did hear names I knew, and was glad for them. My friend Ivan became the 100K race's first 70 year old finisher at 3:50 a.m.
After breaking camp and packing my car, I said good-bye to people, and drove homewards, stopping at the American Lakes trailhead for one more trip to that beautiful alpine basin. This time I went all the way to Thunder Pass for the view into Rocky Mountain National Park.

American Lakes basin from Thunder Pass
Over the weekend, I spent 20 hours on trails, covered 100 kilometers distance, and climbed over 4,000 meters. A successful mountain training camp, for sure. I got signs that my back is healing, did some volunteering, hung out with my favorite runners, and met some fun folks for the first time. I don't know if I'll run this next year, but I'll be back to be a part of it.
-
sur PostGIS Development: PostGIS 3.4.0rc1
Publié: 5 August 2023, 2:00am CEST
The PostGIS Team is pleased to release PostGIS 3.4.0rc1! Best Served with PostgreSQL 16 Beta2 and GEOS 3.12.0.
This version requires PostgreSQL 12 or higher, GEOS 3.6 or higher, and Proj 6.1+. To take advantage of all features, GEOS 3.12+ is needed. To take advantage of all SFCGAL features, SFCGAL 1.4.1+ is needed.
3.4.0rc1This release is a release candidate of a major release, it includes bug fixes since PostGIS 3.3.4 and new features.
-
sur Sean Gillies: Laid off
Publié: 4 August 2023, 6:35pm CEST
My position evaporated on Monday, one of many layoffs at my job. This is a first for me. If you've got advice, I'm all ears. If you're a former coworker and looking for help finding a new job, hit me up. I'm good at reviewing resumes and enjoy telling hiring managers good things about good people.
I'm fortunate to be in a good position right now. My family is healthy, we are insured through Ruth's position at CSU, and have some savings. This is not the case for everyone who gets laid off, I know.
Am I going to let this derail my attempt to finish a 100 miler in September? No way. Looking for work will take time, and I'm picking up more family duties, but it looks like I'll also have more free time to spend on the trail this summer.

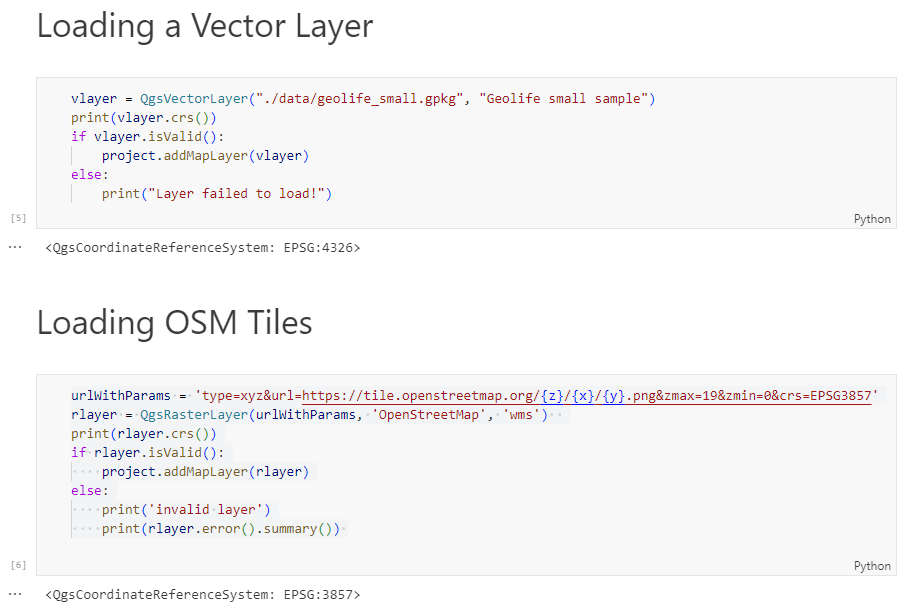
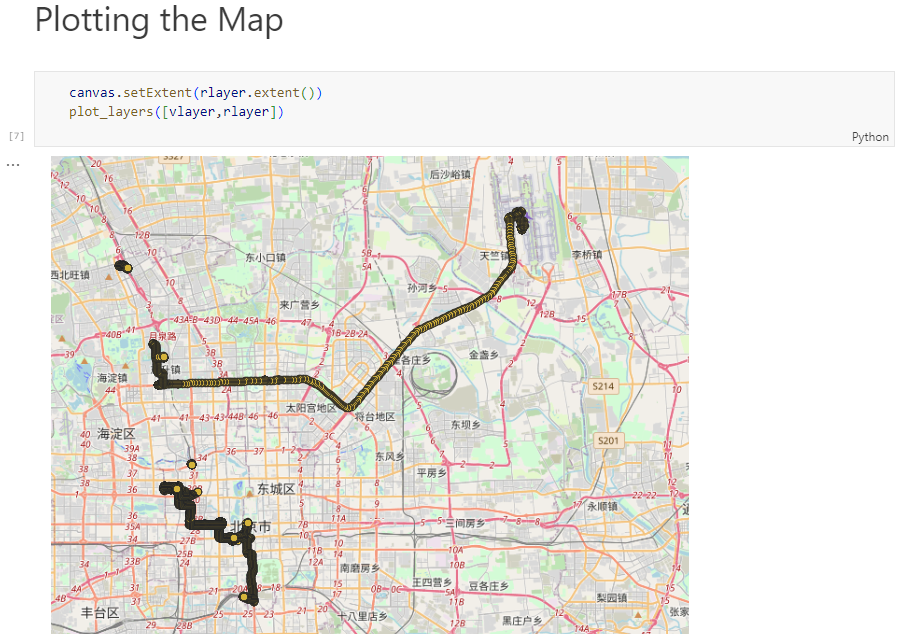

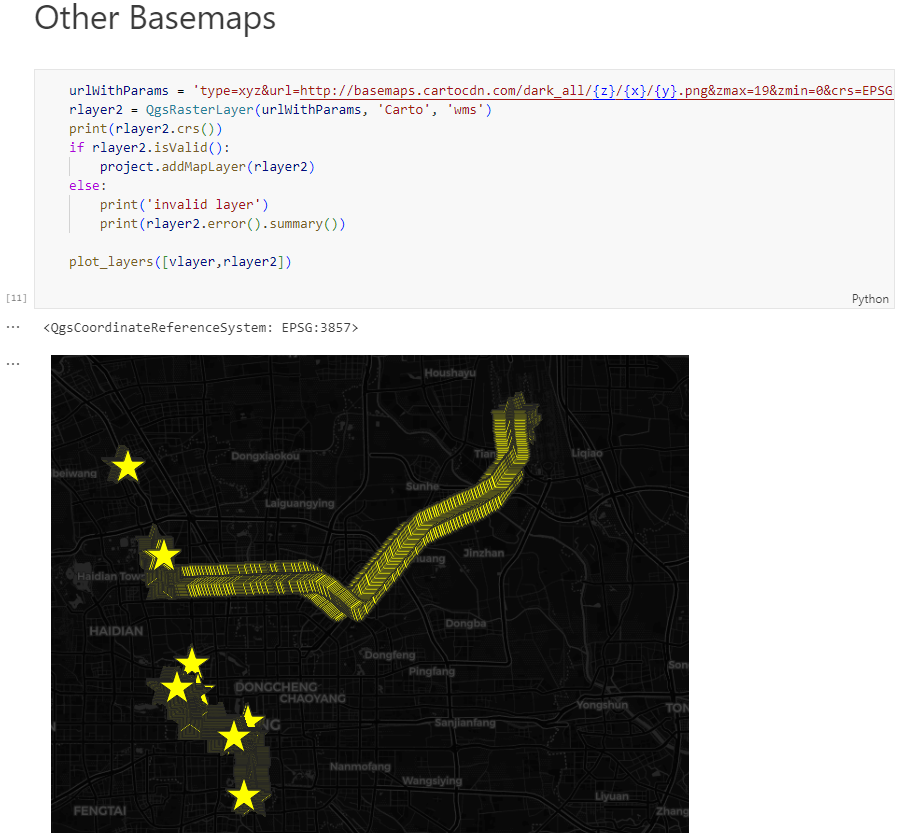


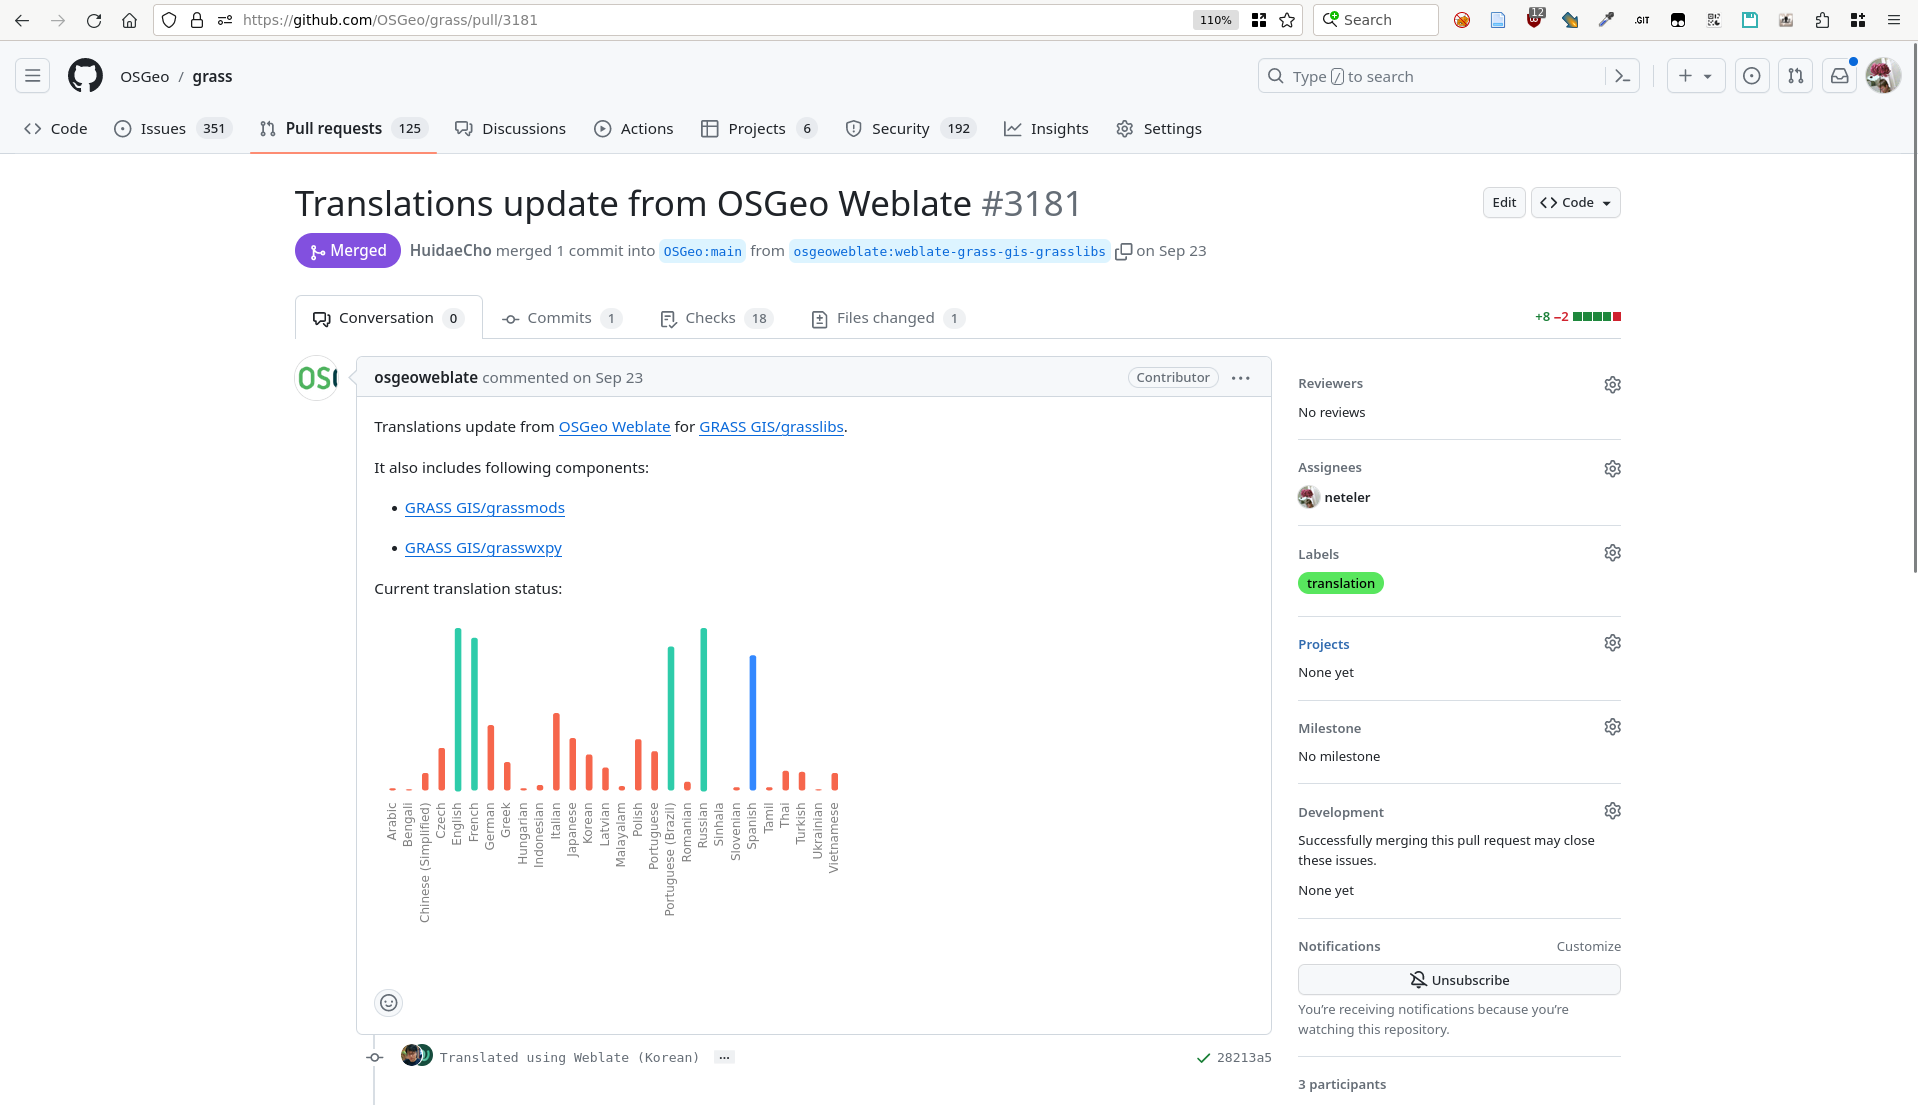


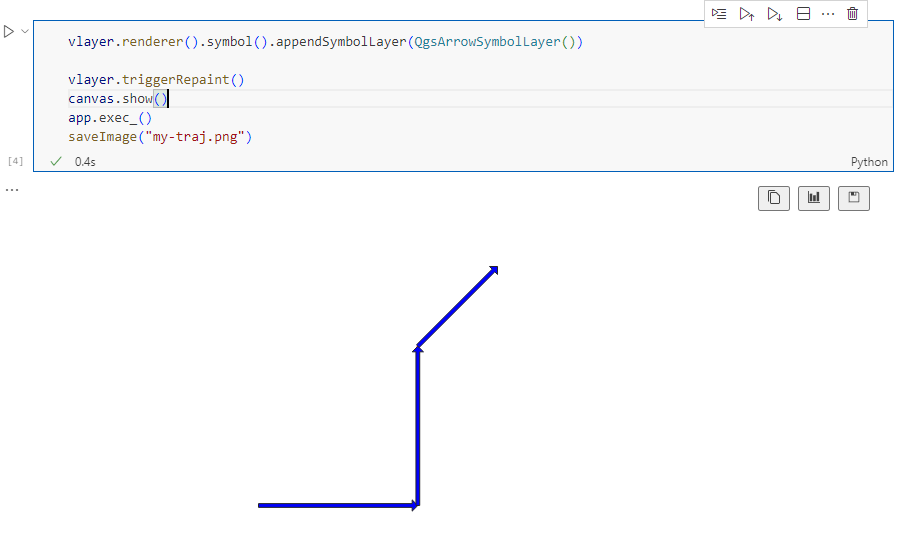


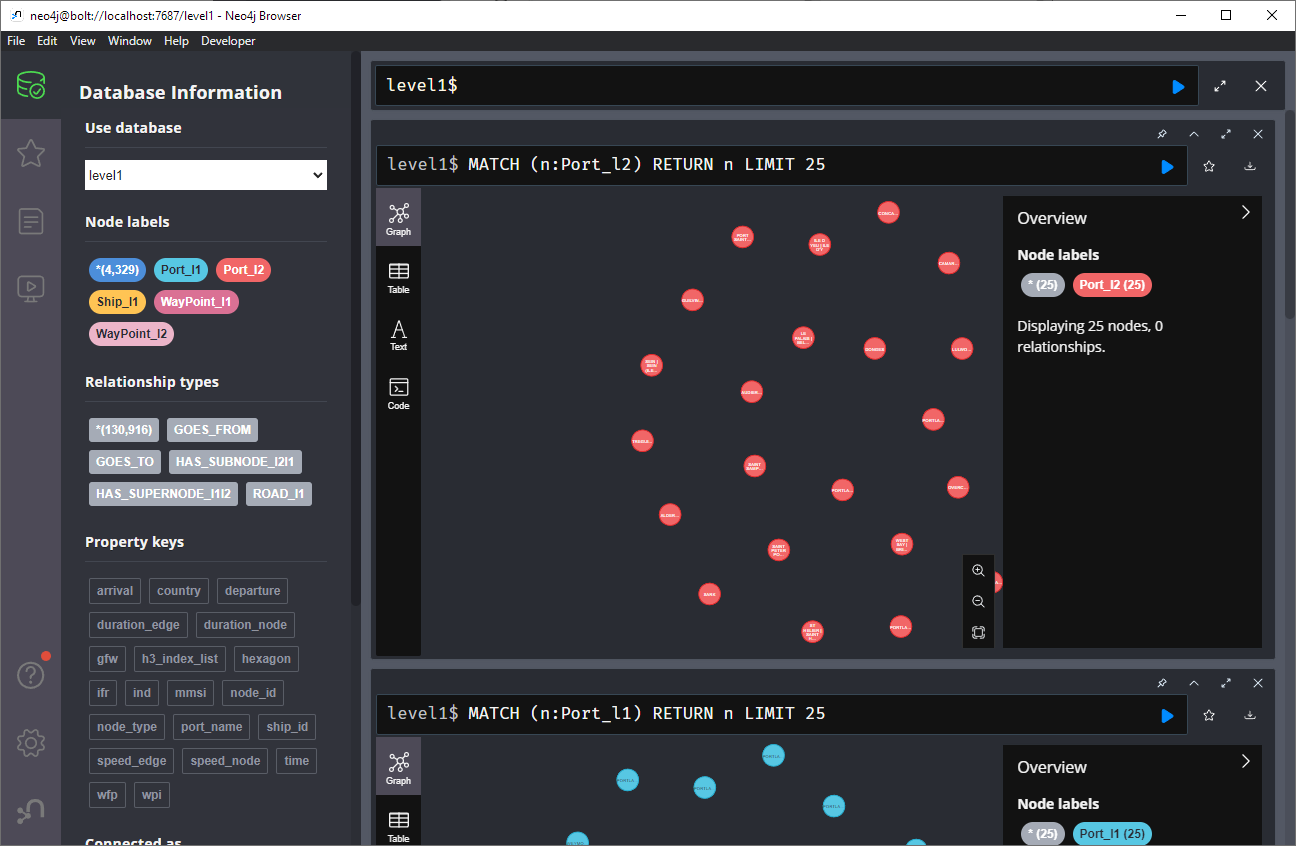


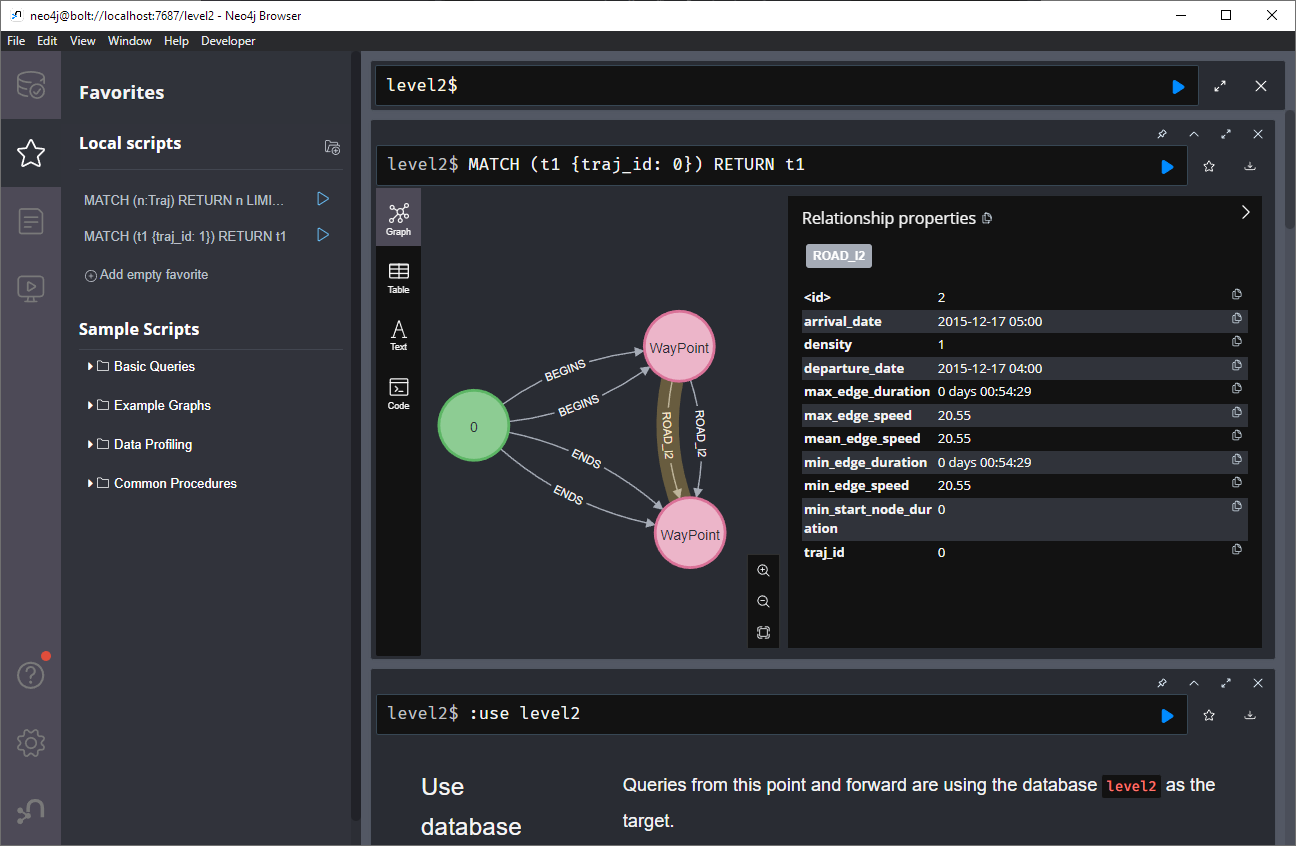


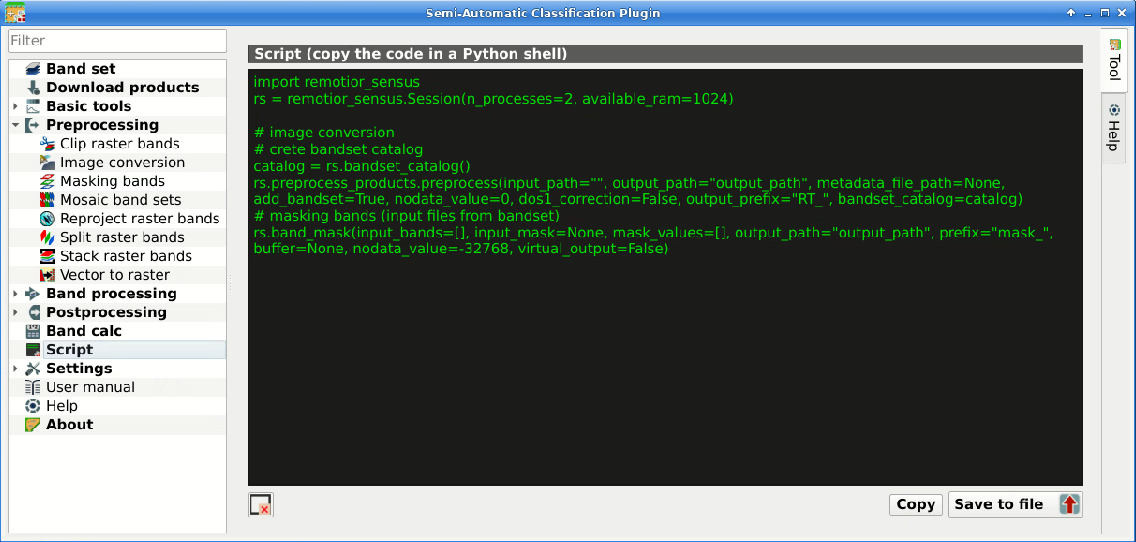


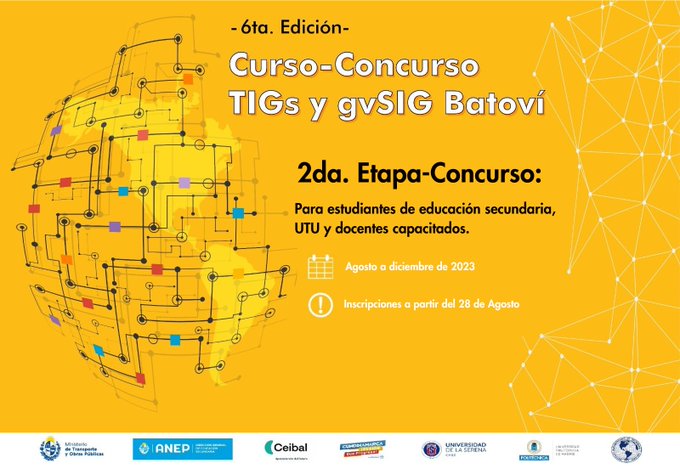

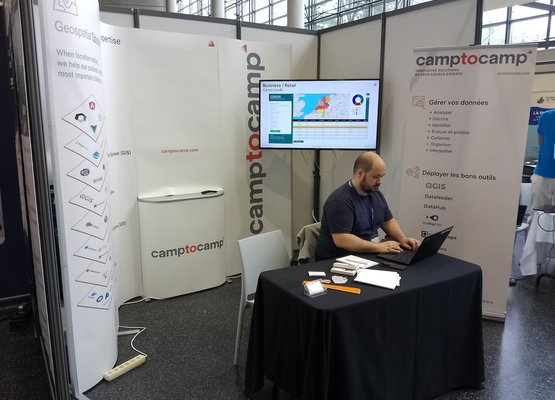
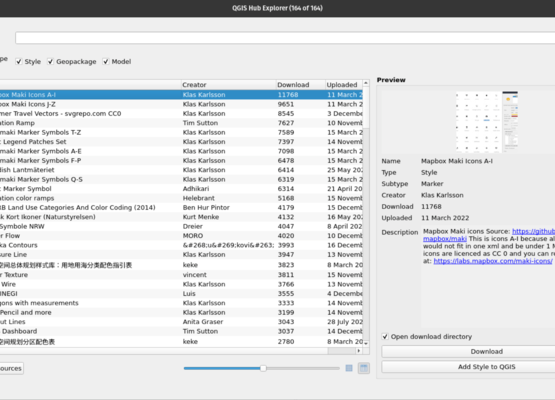