
Vous pouvez lire le billet sur le blog La Minute pour plus d'informations sur les RSS !
Canaux
3990 éléments (8 non lus) dans 55 canaux
-
 Décryptagéo, l'information géographique
-
Cybergeo
-
Revue Internationale de Géomatique (RIG)
-
SIGMAG & SIGTV.FR - Un autre regard sur la géomatique
-
Mappemonde
-
Imagerie Géospatiale
-
Toute l’actualité des Geoservices de l'IGN
-
arcOrama, un blog sur les SIG, ceux d ESRI en particulier
-
arcOpole - Actualités du Programme
-
Géoclip, le générateur d'observatoires cartographiques
-
Blog GEOCONCEPT FR
 Toile géomatique francophone
(8 non lus)
Toile géomatique francophone
(8 non lus)
-
Géoblogs (GeoRezo.net)
-
Conseil national de l'information géolocalisée
-
 Geotribu
(3 non lus)
Geotribu
(3 non lus) -
Les cafés géographiques
(1 non lus)
-
UrbaLine (le blog d'Aline sur l'urba, la géomatique, et l'habitat)
-
Icem7
-
Séries temporelles (CESBIO)
-
Datafoncier, données pour les territoires (Cerema)
-
Cartes et figures du monde
-
SIGEA: actualités des SIG pour l'enseignement agricole
-
Data and GIS tips
-
Neogeo Technologies
(1 non lus)
-
ReLucBlog
-
L'Atelier de Cartographie
-
My Geomatic
-
archeomatic (le blog d'un archéologue à l’INRAP)
-
Cartographies numériques
(1 non lus)
-
Veille cartographie
-
Makina Corpus
-
Oslandia
(2 non lus)
-
Camptocamp
-
Carnet (neo)cartographique
-
Le blog de Geomatys
-
GEOMATIQUE
-
Geomatick
-
CartONG (actualités)

Géomatique anglophone
-
sur Fernando Quadro: 4 dicas para melhorar sua aplicação GIS Mobile
Publié: 25 September 2024, 2:00pm CEST
A demanda por soluções geoespaciais acessíveis e em movimento está maior do que nunca. Como uma empresa de desenvolvimento de software que atende ao setor de GIS, você precisa entender a importância de fornecer aplicativos amigáveis ??para dispositivos móveis que atendam às necessidades de seus clientes.
Você precisa criar soluções inovadoras e amigáveis ??que capacitem os profissionais a acessar e utilizar dados espaciais a qualquer hora, em qualquer lugar.
 Alguns recursos principais de seus aplicativos GIS móveis devem incluir:
 Recursos offline: Projete seus aplicativos para funcionar perfeitamente, mesmo em áreas com conectividade limitada à Internet, garantindo acesso ininterrupto a dados geoespaciais críticos.Coleta de dados em tempo real: Os usuários devem ser capazes de capturar e atualizar informações espaciais em movimento, agilizando as operações de campo e melhorando a precisão dos dados.Interfaces intuitivas: Priorize interfaces de usuário intuitivas e responsivas, facilitando a navegação e a interação dos profissionais com dados geoespaciais em seus dispositivos móveis.Integração perfeita: Você deve ser capaz de integrar aplicativos GIS móveis com plataformas GIS existentes de desktop e baseadas em nuvem, garantindo um fluxo de trabalho coeso e eficiente.
Ao aproveitar o poder da tecnologia móvel, seus clientes podem aumentar sua produtividade, tomar decisões mais bem informadas e fornecer serviços superiores aos seus usuários finais.
Fonte: webgis.tech
Instagram: [https:]]
LinkedIn: [https:]]
-
sur OpenFreeMap Map Styles
Publié: 25 September 2024, 12:16pm CEST par Keir Clarke
One very important feature I overlooked in the launch of OpenFreeMap is the ability to customize the styles of OpenFreeMap map-tile sets using the Maputnik open-source visual editor for the MapLibre Style Specification. If you have ever wanted to make your maps stand out, reflect your brand, or just look completely unique you can now do that for free by editing OpenFreeMap map tile styles
-
sur Mappery: Atlas in Potsdam
Publié: 25 September 2024, 11:00am CEST
Pièce jointe: [télécharger]

Reinder sent this pic of Atlas holding up the world from the roof of the Alte Rathaus at the Alte Markt, Potsdam, Germany (he wasn’t actually on the roof but you know what I mean)
-
sur Fernando Quadro: Como ser tornar um Desenvolvedor WebGIS?
Publié: 24 September 2024, 2:00pm CEST
Se você já se perguntou como se tornar um especialista em desenvolvimento WebGIS, este roteiro o guiará passo a passo pelas ferramentas e habilidades essenciais:
Fundamentos do WebGIS: Aprenda a arquitetura e os termos chave. Desenvolvimento do lado do cliente (front-end): domine JavaScript, HTML/CSS e estruturas de UI (User Interface) como Bootstrap, por exemplo. Bibliotecas WebGIS: use o poderoso OpenLayers, Leaflet, Turf.js e muito mais e crie seu projeto. Domínio do lado do servidor (back-end): Aprenda Python, PostGIS, Django, GeoServer e obtenha a experiência que faz com que as empresas de GIS precisem de você. Crescimento na carreira: procure oportunidades para desenvolvedor WebGIS no mercado, mas enquanto ela não aparece, você pode começar como freelancer ou criar seu próprio WebGIS para ir adquirindo experiência!E ai, o que você está esperando?
Fonte: webgis.tech
Instagram: [https:]]
LinkedIn: [https:]] -
sur Mappery: Afghan Carpet
Publié: 24 September 2024, 11:00am CEST
Pièce jointe: [télécharger]

Raymond pointed out that the Afghani restaurant we featured a few weeks ago also had this carpet map on the wall and this one is slightly different to this carpet map
-
sur Konbini Wars
Publié: 24 September 2024, 10:09am CEST par Keir Clarke
Imagine being able to walk down any street and being only minutes away from your next snack, a freshly brewed coffee, or even a place to pay your bills. This is the magic of konbini - Japan's beloved convenience stores that have become an integral part of Japanese daily life. In Japan, you don’t have to travel very far before encountering a konbini convenience store. These compact stores are
-
sur From GIS to Remote Sensing: Random Forest Classification of Sentinel-2 image in Python using Remotior Sensus
Publié: 24 September 2024, 8:00am CEST
This video tutorial illustrates how to perform Random Forest classification of a Copernicus Sentinel-2 image using Remotior Sensus, a Python package that allows for the processing of remote sensing images and GIS data.The tutorial is available as Jupyter notebook in Google Colab, a free service by Google that allows for executing a Jupyter notebook in the cloud. Following the video of this tutorial.
Read more » -
sur Paul Ramsey: Cancer 11
Publié: 24 September 2024, 2:00am CEST
Back to entry 1
What happened there, I didn’t write for three months! Two words: “complications”, and “recovery”.
In a medical specialty where so many of the treatments are brutally hard on the body–surgery and chemotherapy–one of the painful ironies of cancer treatment is that patients spend a lot of time recovering from complications and side effects.

A lot of this comes with the territory of major surgery and dangerous chemicals. My surgery included specific possible complications including, but not limited to: incontinence, sexual disfunction, urinary disfunction, and sepsis.
Fortunately, I avoided all the complications specific to my surgery. What I did not avoid was a surprisingly common complication of spending some time in a hospital while taking broad spectrum antibiotics–I contracted the “superbug” clostridioides difficile, aka c.diff.
Let me tell you, finding you have a “superbug” is a real bummer, and c.diff lives up to its reputation. Like cancer, it is hard to kill, it does quite a bit of damage while it’s in you, and the things that kill it also do a lot of damage to your body.

Killing my c.diff required a couple of courses of specialized antibiotics (vancomycin), that in addition to killing the c.diff also killed all the other beneficial bacteria in my lower intestine.
So, two months after surgery, I was recovering from:
- having my lower intestine handled and sliced in a major surgery
- having that same intestine populated with c.diff and covered in c.diff toxins
- having the microbiotic population living in my intestine nuked with a modern antibiotic developed to kill resistant superbugs
Not surprisingly, having all those things at once makes for a much longer recovery, and a pretty up-and-down one. My slowly recovering microbiota is in constant flux, which results in some really surprising symptoms.
- highly variable stomach discomfort (ok)
- highly variable appetite (makes sense)
- random days of fatigue (really?)
- random days of anxiety (what?!?)
I had not really understood the implications of gut/brain connection, until this journey showed me just how tightly bound my mental state was to the current condition of my guts. The anxiety I have experienced as a result of my c.diff exposure has been worse, amazingly, than what I felt after my initial cancer diagnosis. One was in my head, but the other was in my gut.

I have also developed a much more acute sympathy for people suffering from long Covid and other chronic diseases. The actual symptoms are bad enough, but the psychological effect of the symptom variability is really hard to deal with. Bad days follow good days, with no warning. I have mostly stopped voicing any optimism about my condition, because who knows what tomorrow will bring.
When people ask me how I’m doing, I shrug.
One thing I have got going for me, that chronic disease sufferers do not, is a sense that I am in fact improving. I started journaling my symptoms early in the recovery process, and I can look back and see definitively that while things are unpredictable day to day, or even week to week, the long term trajectory is one of improvement.
Without that, I think I’d go loopy.
Anyways, I am now rougly three months out from my last course of antibiotics, and I expect it will be at least another three months before I’m firing on all cylinders again, thanks mostly to the surgical complication of acquiring c.diff. If I was just recovering from the surgery, I imagine I would be much closer to full recovery.

-
sur The 2024 GeoGuessr World Cup
Publié: 23 September 2024, 11:41am CEST par Keir Clarke
Do you think you’ve got what it takes to be the next GeoGuessr World Champion?This year's GeoGuessr World Cup was won by Blinky, who defeated the U.S.'s mk, to become the 2024 GeoGuessr World Champion. The dramatic final was a tense affair. Blinky took an early 2-0 lead, but mk made a stunning comeback winning the next two games, to take the competition into the fifth and final game.
-
sur Mappery: Jo Spier
Publié: 23 September 2024, 11:00am CEST
Pièce jointe: [télécharger]

A cartographic book cover by Jo Spier (1900-1978) spotted by Reinder – exquisite.
-
sur Mappery: Oh, Toulouse!
Publié: 22 September 2024, 11:00am CEST
Pièce jointe: [télécharger]

Exploring the heart of Toulouse, France, a city steeped in history and culture. This tiny map highlights some of the must-see spots in the city center:
- Capitole: The grand city hall and opera house.
- Place du Capitole: A bustling square with cafes, shops, and street performers.
- Saint-Sernin Basilica: A UNESCO World Heritage Site known for its Romanesque architecture and impressive cloister.
-
sur Free and Open Source GIS Ramblings: Trajectools tutorial: trajectory preprocessing
Publié: 21 September 2024, 4:34pm CEST

Today marks the release of Trajectools 2.3 which brings a new set of algorithms, including trajectory generalizing, cleaning, and smoothing.
To give you a quick impression of what some of these algorithms would be useful for, this post introduces a trajectory preprocessing workflow that is quite general-purpose and can be adapted to many different datasets.
We start out with the Geolife sample dataset which you can find in the Trajectools plugin directory’s sample_data subdirectory. This small dataset includes 5908 points forming 5 trajectories, based on the trajectory_id field:

We first split our trajectories by observation gaps to ensure that there are no large gaps in our trajectories. Let’s make at cut at 15 minutes:

This splits the original 5 trajectories into 11 trajectories:

When we zoom, for example, to the two trajectories in the north western corner, we can see that the trajectories are pretty noisy and there’s even a spike / outlier at the western end:

If we label the points with the corresponding speeds, we can see how unrealistic they are: over 300 km/h!

Let’s remove outliers over 50 km/h:

Better but not perfect:

Let’s smooth the trajectories to get rid of more of the jittering.
(You’ll need to pip/mamba install the optional stonesoup library to get access to this algorithm.)

Depending on the noise values we chose, we get more or less smoothing:

Let’s zoom out to see the whole trajectory again:

Feel free to pan around and check how our preprocessing affected the other trajectories, for example:


-
sur Mappery: Eugeniusz Romer
Publié: 21 September 2024, 11:00am CEST
Pièce jointe: [télécharger]

This came from Reinder
Portrait of Eugeniusz Romer
It hangs above the desk of the director of the Institute of Geography and Regional Development at the University of Wroclaw. It shows the eminent geographer and cartographer depicted against the background of a planiglobium map.Romer, (1871-1954) was the founder of modern Polish cartography and co-founder of the Ksiaznica-Atlas publishing house in Lwow, one of the most important Polish publishing houses in the interwar period. It was a house publishing textbooks and teaching aids for teachers and students, cartographic publications, children’s and young adult literature, and encyclopaedias. After the Second World War, the publishing house resumed its activities in Wroctaw, where many atlases of Poland and the world were published under Romer’s editorship.


-
sur Urban Planning in 3D
Publié: 21 September 2024, 10:44am CEST par Keir Clarke
The Studio Carto is a French design company dedicated to creating innovative experiences in the visualization of architectural, urban, and territorial projects. The company uses interactive maps to explore the challenges involved in transforming environments.The Studio Carto - Urban Project is a beautifully realized interactive presentation of the planned redevelopment of the Bois du Château -
sur Free Maps for All
Publié: 20 September 2024, 11:21am CEST par Keir Clarke
All my recent personal map projects (Backdrop, World Level Zero, Guess This City) are available for free online. However, because I make zero money from my maps, I cannot afford to host them myself or pay a provider for the map tiles that they use. This means I have to be a little creative in publishing my maps online.Thanks to the amazing Glitch and the generosity of TripGeo I am able to host
-
sur Mappery: Seated on the Helsinki Tram Network
Publié: 20 September 2024, 11:00am CEST
Pièce jointe: [télécharger]

Maarten Pullen sent me this. “Helsinki has a fair number of tram lines in its city center. A great way of doing sightseeing when you’re tired of walking. The seats in the tram also have a network map.”
-
sur Nick Bearman: New Website - Quarto
Publié: 20 September 2024, 1:00am CEST
I’ve been thinking for a bit of time that I need to redo my website as some of the pages had evolved a bit, and were getting a bit too long. What you see now is what I have come up with:

I also took the opportunity to ‘rebrand’ myself. Previously I’d used the name Geospatial Training Solutions to market my freelance work. I was never completely happy with the name - it was a bit long and a bit generic - and after some thought I decided I would be better trading under my own name - Nick Bearman - as that is a name already known in the GIS community and it is me that I am selling. I am freelance and have no current plans to expand or to hire other people - I am just me!
Anyway, once I’d made that decision, the question was how to make my new website. I’ve been using WordPress which worked reasonably well, but it has a relatively complex infrastructure under the hood (database, etc.) which:
opens it up to more vulnerabilities and
upgrading WordPress was always something that needed to be done every so often, and then I had to make sure everything worked as I wanted.
I looked around and found various examples that were similar to what I wanted to achieve:
- Kate Berg / Pokateo [https:]] Wix
- James Cheshire [https:]] WordPress
- Mike Spencer [https:]] Start Bootstrap - Agency (using Respond.js)
- Alessia Calafiore [https:]] Hydejack theme on Jekyll
- Caitlin Robinson [https:]] Wix
- Andy Kirk [https:]] WordPress
- Robin Wilson [https:]] Jekyll
I mostly used these to think about content, but it was also helpful to consider the different technologies as well. More people were using WordPress that I thought, and often they were not ‘obviously’ WordPress sites. I wanted something simple, and certainly something I could update easily. Easy of updating was a common theme! To quote Pokateo / Kate:
From [https:]]
At this point, Quarto had been released and they had some interesting possibilities for websites. I’d dabbled a bit with Quarto for PDF documents and websites (including A geographer’s introduction to QGIS & R) after using RMarkdown for several years. Quarto looked ideal, so I started experimenting with it. It is plain text, and can work with GitHub, which I am using fairly regularly.
Quarto also has a very good website, with lots of examples including creating a website [https:]] and you can also choose from a variety of different themes [https:]] .
After various rounds of development, I came up with this site, [https:] It is (I hope) a simple site which has what I need on it. It also supports blogs, which I do contribute to semi-regularly. It is also all static pages, so once it is updated it can just sit there and doesn’t need any database provision or anything else to run. The new site also incorporated a search, which is handy.
You can host it through GitHub Pages, and there are various options to automatically compile it using continuous integration, but I decided to keep things simple, to compile the site locally and the push to GitHub. Sometimes the potential to automate things isn’t worth the time to set it up!
from [https:]] CC license
Transferring my blog posts from WordPress (geospatialtrainingsolutions.co.uk and nickbearman.me.uk) was a bit of a faff but it is getting there. It is a work in progress. I have found a semi-automated">[https%3A%2F%2Fgithub,folder%20in%20your%20quarto%20blog">semi-automated] way of doing this, but it will still take some time. I’m also trying to extract a static copy of the WordPress sites for archiving, with the Simpy Static WordPress plugin looking useful.
I also used to have a contact form, which I received some useful contacts through so I wanted to include this. Quarto as such doesn’t include such a form, as there is no interaction, but I had a brainwave and decided to use a Google Forms instead. We’ve used these a lot at OSGeo:UK and they work really well.
I hope you found this useful - do let me know what you think!
And if you want to learn more about GIS, checkout my new Training Courses page and if you want a bespoke course, make use of my new Contact Form!
-
sur OGC Membership approves OGC API – Maps – Part 1: Core as an official OGC Standard
Publié: 19 September 2024, 3:00pm CEST par Simon Chester
The Open Geospatial Consortium (OGC) Membership has approved OGC API – Maps – Part 1: Core as an official OGC Standard.
The OGC API – Maps – Part 1: Core Standard defines a web interface for portraying geographic information. One of the main benefits of this Standard is the ability to generate maps by combining data from one or more servers into a single view, ensuring fast and efficient cartographic portrayal.
Additional features include options for retrieving data layers within specific areas of interest (AOIs) as well as specifying transparency, styles, scales, and device display settings. The Standard also provides the ability to specify map orientation and supports multiple Coordinate Reference Systems (CRS).
The OGC API – Maps – Part 1: Core Standard is designed as a modern, API-based alternative to the Web Map Service (WMS) and Web Map Tile Service (WMTS) Standards. It can be integrated with the OGC API – Tiles – Part 1: Core Standard to support more advanced capabilities.
To help developers quickly implement products that support this standard, example API definitions and schemas are available on the OGC API – Maps webpage. These resources conform to OpenAPI Specification v3.0, making them easy to integrate into various Web APIs.
OGC API – Maps – Part 1: Core is the outcome of the work and dedication of the OGC API – Maps Standards Working Group. Development of the Standard was led by:
- Editors:
- Joan Masó, Universitat Autònoma de Barcelona (CREAF)
- Jérôme Jacovella-St-Louis, Ecere Corporation
- Submitters:
- Jeff Harrison, US Army Geospatial Center (AGC)
- Satish Sankaran, Esri
As with any OGC standard, the OGC API – Maps – Part 1: Core Standard is free to download and implement. Interested parties can learn more on the OGC API – Maps Standard webpage.
The post OGC Membership approves OGC API – Maps – Part 1: Core as an official OGC Standard appeared first on Open Geospatial Consortium.
- Editors:
-
sur Crowdsourcing Neighborhood Borders
Publié: 19 September 2024, 11:29am CEST par Keir Clarke
Is your neighborhood where you think it is? In a world where cities are constantly changing, the power of crowdsourcing is helping redefine neighborhood borders. While official maps draw static lines, the people who live in these urban spaces often see things differently. What one person considers the "end" of their neighborhood could be another's starting point, creating a patchwork of local
-
sur Mappery: Archimedes
Publié: 19 September 2024, 11:00am CEST
Pièce jointe: [télécharger]

Reinder sent this from his visit to Warsaw
“… in the beautifully 18th C. baroque decorated main hall, Aula Leopoldina, in the University Museum in Wroc?aw, Poland. “
-
sur pycsw Team: Using keywords from a thesaurus as queryables
Publié: 18 September 2024, 8:59pm CEST
Using keywords from a thesaurus as queryablesA common convention in catalogues is the use of keywords from a dedicated thesaurus. The assignment of these keywords can then later be used to filter or query the catalogue by these terms. To achieve this use case in pycsw, some configuration needs to be tailored. This blog post indicates the changes needed for this scenario.
For this example we’ll use a keyword from the INSPIRE Themes thesaurus. We will define a new queryable
inspiretheme, which will be populated with the relevant keyword (if present).You can repeat these steps for any other thesaurus.
Extra database columnExtend the records table in the database with an extra field for the selected thesaurus. This is usually a manual operation on the database.
Add parameter to pycswALTER TABLE records ADD inspiretheme VARCHAR(255);In
pycsw/core/config.pythe newly created database column can be registered to pycsw.
Add column to mapping'pycsw:InspireTheme': 'inspiretheme',etc/mappings.pylinks the pycsw parameter to the columnname in the table.
Define parameter as queryable'pycsw:InspireTheme': 'inspiretheme',Which of the parameters are queryable is defined in
pycsw/core/repository.py.
Add parameter to record results?'inspiretheme': self.dataset.inspiretheme,Keywords are already published in records, so there is generally no need to extend the record with the new parameter. If needed you can do so in
Populate the parameter from record importspycsw/ogc/api/records.py(Line 1150).We have 2 options here, either manage the population of the column within the database as part of an insert trigger on the
record.themesfield. Alternatively updatepycsw/core/metadata.pyso the column is populated when records are imported.For the second option consider the following code. For each of the keyword blocks, it tries to match the thesaurus title or uri and, if matched, adds the keywords to the new parameter.
Add parameter to OGC API - Records facets_set(context, recobj, 'pycsw:InspireTheme', ", ".join( [", ".join(k.name for k in t.keywords if k.name not in [None,'']) for t in md_identification.keywords if ( hasattr(t,'thesaurus') and t.thesaurus not in [None,''] and (( 'title' in t.thesaurus and t.thesaurus['title'] not in [None,''] and t.thesaurus['title'] in ['GEMET - INSPIRE themes, version 1.0','GEMET Themes, version 2.3'] ) or ( 'uri' in t.thesaurus and t.thesaurus['uri'] not in [None,''] and t.thesaurus['uri'] == 'http://inspire.ec.europa.eu/theme')))]))Facets enable to further limit search results. Keywords from thesauri are very useful to add as facet. Add the paremeter to
default.yml.facets: - type - inspiretheme
-
sur OGC Membership approves OGC API – Features – Part 3: Filtering as an official OGC Standard
Publié: 18 September 2024, 3:00pm CEST par Simon Chester
The Open Geospatial Consortium (OGC) Membership has approved OGC API – Features – Part 3: Filtering as an official OGC Standard.
OGC API – Features defines a web interface for creating, modifying, and querying feature data. Part three of this standard is focused on defining query parameters and the Queryables resource, allowing users to specify filter criteria in API requests.
OGC API – Features – Part 3: Filtering extends the ability to extract data subsets that meet specific criteria beyond bounding boxes or date and time attributes. This enhanced query functionality is specified using the Common Query Language (CQL2) – a recently approved OGC Standard.
Part 3 is designed to extend and interoperate with other parts of the OGC API – Features Standard. It builds on Part 1, which defines basic server behavior and is compatible with Part 2, which extends support for different Coordinate Reference Systems.
To help developers quickly implement products that support this standard, example API definitions and schemas are available on the OGC API – Features webpage. These resources conform to the OpenAPI Specification v3.0, making them easy to integrate into various Web APIs.
OGC API – Features – Part 3: Filtering is the outcome of the work and dedication of the OGC API – Features Standards Working Group. Development of the standard was led by:
- Editors:
- Panagiotis (Peter) A. Vretanos, CubeWerx Inc.
- Clemens Portele, interactive instruments GmbH
- Submitters:
- Andrea Aime, GeoSolutions di Giannecchini Simone & C. s.a.s.
- Jeff Harrison, US Army Geospatial Center (AGC)
- Jérôme Jacovella-St-Louis, Ecere Corporation
As with any OGC Standard, the OGC API – Features – Part 3: Filtering Standard is free to download and implement. Interested parties can learn more on the OGC API – Features Standard webpage.
The post OGC Membership approves OGC API – Features – Part 3: Filtering as an official OGC Standard appeared first on Open Geospatial Consortium.
- Editors:
-
sur Mappery: North Quabbin Lager
Publié: 18 September 2024, 11:00am CEST
Pièce jointe: [télécharger]

Doug shared this can of North Quabbin Lager from the Honest Weight Brewing co. Nice spot.
In case you have never heard of North Quabbin, it is not a place in a Harry Potter novel, it’s halfway between Albany and Boston
-
sur 15 Minutes Cities by Sony CSL
Publié: 18 September 2024, 10:29am CEST par Keir Clarke
Sony Computer Science Laboratories in Rome have released a new interactive map which provides 15 Minute City accessibility scores for nearly every city in the world. The '15-minute city' is an urban planning concept aimed at designing cities in a way that ensures residents can access most of their daily needs—such as work, shopping, healthcare, education, and recreation—within a 15-minute walk
-
sur GeoServer Team: GeoServer 2.26.0 Release
Publié: 18 September 2024, 2:00am CEST
GeoServer 2.26.0 release is now available with downloads (bin, war, windows), along with docs and extensions.
This is a stable release of GeoServer recommended for production use. GeoServer 2.26.0 is made in conjunction with GeoTools 32.0, GeoWebCache 1.26.0, ImageIO-EXT 1.4.13, and JAI-EXT 1.1.27.
Thanks to Peter Smythe (AfriGIS) and Jody Garnett (GeoCat) for making this release and everyone who has helped out during this release cycle. Special thanks Andrea for helping with release announcement, and Torben for troubleshooting the build server and docker environment for this release.
Nightly build testingThis release cycle we asked our new user forum to test a nightly build, as we did not have capacity to make a release candidate.
Thanks to Daniel Calliess for responding during our public testing cycle. Daniel noted that he had to add
Security Considerations/geoserver/webresourcesto his proxy for the OpenLayers preview to function. This change is due to an ongoing effort to move all CSS and JS to external resources allowing Content Security Policy headers to be introduced.This release addresses security vulnerabilities and is considered is a recommended upgrade for production systems.
- CVE-2024-45748 High (to be disclosed)
- CVE-2024-34711 Improper ENTITY_RESOLUTION_ALLOWLIST URI validation in XML Processing (SSRF) (High 7.3)
- CVE-2024-35230: Welcome and About GeoServer pages communicate version and revision information (Moderate 5.3)
See project security policy for more information on how security vulnerabilities are managed.
- GEOS-11400 About Page Layout and display of build information
The binary distribution and the Windows installer now work with Java 17.
When using the war distribution with Tomcat and Java 17 double check the Server status page. If the Java Rendering Engine is listed as “Unknown”, double check the Running in Java 17 production considerations.

Thanks to Andrea Aime and everyone who worked on testing this in different environments.
- GEOS-11467 Update Marlin, make the bin package compatible with Java 17
The base image
tomcat:9.0.95-jdk17-temurin-jammyis now used - providing the latest Tomcat 9 and Java 17. The docker crew changed from usingubuntu:22.04with our own Tomcat install script earlier in the year.To try out GeoServer 2.26.0 with docker:
docker pull docker.osgeo.org/geoserver:2.26.0
docker run -it -p8080:8080 docker.osgeo.org/geoserver:2.26.0
Thanks to Nils Bühner (terrestris) and everyone who has contributed to the Docker build.
Search improvementA small but fun change for the layer preview - it is now easier to find just the layer you are looking for using quotes to isolate an individual word.

Thanks to Alessandro Ricchiuti for this work.
- GEOS-11351 Exact term search in the pages’ filters
Thanks to Natural Resources Canada for sponsoring an extensive set improvements for the MapML extension.

This update was carried out by a group of GeoSolutions devs, Andrea Aime, Daniele Romagnoli and Joseph Miller.
- GEOS-11322 MapML WMS Vector Representation include query filter
- GEOS-11324 MapML WMS Vector Representation Style Classes
- GEOS-11337 Support feature tiles in MapML
- GEOS-11349 MapML Use WMS Resource Consumption Limit to specify max image size
- GEOS-11461 Enable MapML Viewer output for WFS getFeature.
- GEOS-11486 Adding custom dimensions to MapML
- GEOS-11528 Update MapML viewer to latest release 0.14.0
- GEOS-11471 Remove Sharding configuration support from MapML
The Demo Request page has been rewritten to use JavaScript to issue POST examples. This provides a much better user experience:
- Show Result lists the response headers to be viewed along side the returned result (with an option for XML pretty printing).
- Show Result in a New Page is available to allow your browser to display the result.
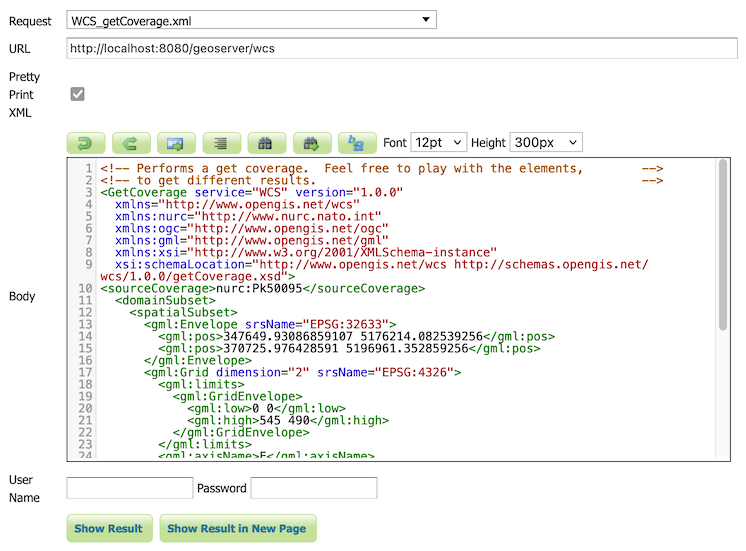
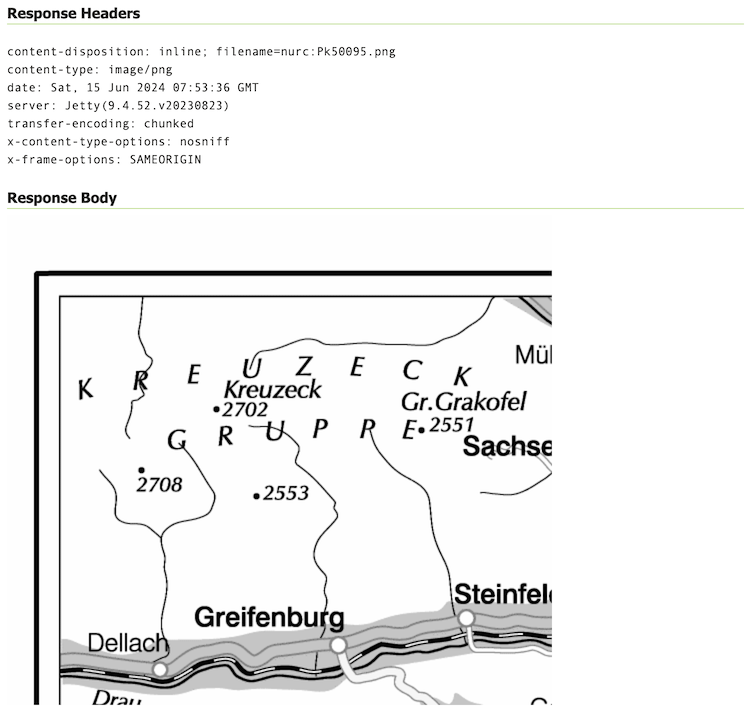
The WCS Request Builder and WPS Request Builder demos now have the option to show their results in Demo Requests page. Combined these changes replace the previous practice of using an iframe popup, and have allowed the TestWfsPost servlet to be removed.
For more information please see the Demo requests in the User Guide.
Thanks to David Blasby (GeoCat) for these improvements, made on behalf of the GeoCat Live project.
- GEOS-11390 Replace TestWfsPost with Javascript Demo Page
We are overjoyed to update to the latest JTS 1.20.0 release which includes a new implementation of spatial relationships.
Use
-Djts.relate=ngto try out the new implementation (replacingRelateOpwith theReleateNGnext generation implementation). Let us know how it goes, a future update will make this setting the default and expand the approach to “prepaired geometry” bulk operations used for WFS Queries.Thanks to Martin Davis (CrunchyDB) for the JTS improvements, and Jody Garnett (GeoCat) for the release and GeoServer update.
- GEOS-11532 Update to JTS 1.20.0
A new extension is available that takes advantage of the GDAL Raster Attribute Table (RAT). This data structure provides a way to associate attribute information for individual pixel values within the raster. This provides a table that links each cell value in the raster to one or more attributes on the fly.
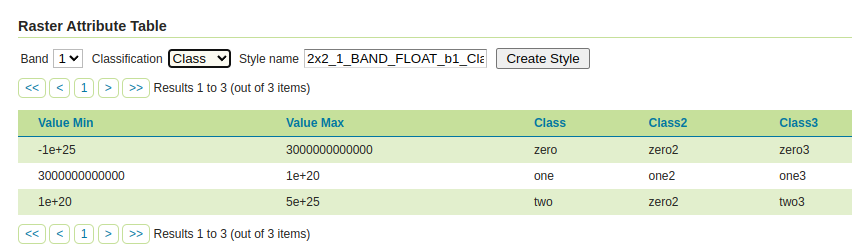
Thanks to Andrea Aime (GeoSolutions) for the development and NOAA for sponsoring this new capability. Please see the user guide Raster Attribute Table support for more information.
- GEOS-11376 Graduate Raster Attribute Table to extension
GeoCSS can now perform scale dependent rendering by the zoom level, assuming web mercator by default, but allowing the configuration of a different gridset as well. It’s also possible to create multi-layer styles and use them as style groups.
@mode 'Flat';
@TileMatrixSet 'WorldCRS84Quad'

tiger:poly_landmarks {

  /* @title parks and green spaces */
  [CFCC in ('D82', 'D32', 'D84', 'D85')] {
    fill: #B4DFB4;
    stroke: #88B588;
  };
  …
}

tiger:tiger_roads [@z > 12] {
  stroke: #666666, #FFFFFF;
  stroke-width: 6, 4;
  z-index: 1, 2;
  …
}

…
Thanks to Andrea Aime (GeoSolutions) for this work, performed in preparation for the FOSS4G-NA 2024 vector tiles workshop.
- GEOS-11495 Support multi-layer output in CSS
- GEOS-11515 Add support for zoom level rule filtering in CSS
- GEOS-11414 Adding css-uniqueRoleName
AUTO:97004has been introduced as a new vendor extension to WMS AUTO codes. It implements the geostastionary satellite project and allows to change the central meridian as part of the GetMap request.
Thanks to Andrea Aime (GeoSolutions) for this work, and Eumetsat for sponsoring it.
labelPoint function improvedThe
labelPointfunction has been improved with more precise calculation of the polygon label points, and not requiring to specify a tolerance any longer. This helps get better maps, especially with tiling enabled (fixed labelling point no matter which tile is requested):<sld:TextSymbolizer> <sld:Geometry> <ogc:Function name="labelPoint"> <ogc:PropertyName>the_geom</ogc:PropertyName> </ogc:Function> </sld:Geometry> </sld:TextSymbolizer>

Thanks to Andrea Aime (GeoSolutions) for this work, performed in preparation for the FOSS4G-NA 2024 vector tiles workshop.
Improved vector tiles generationA few new vendor options have been added in GeoServer, that control how vector tiles are built, with the objective of producing smaller, faster, more useful vector tiles.
vt-attributes: comma separated list of attributes included in the vector tilevt-labels: when true, generates a sidecar-labellayer for polygons, with the label point of the polygon (vector tile clients generally cannot produce a good label placement otherewise)vt-label-attributes:: attributes included in the label point layervt-coalesce: if true, takes all features in the tile sharing the same attribute values, and coalesces their geometries into a single multi-geometry.
Here is an example style using the above vendor options, in GeoCSS:
@mode "Flat";

tiger:poly_landmarks {
  fill: gray;
  vt-attributes: 'CFCC,LANAME';
  vt-labels: true;
}

tiger:tiger_roads [@z > 11] {
  stroke: black;
  vt-attributes: 'NAME';
  vt-coalesce: true;
}

tiger:poi [@z > 12] {
  mark: symbol(square);
}
The GWC layer preview has also been improved to show the vector tile feature attributes on hover:

Thanks to Andrea Aime (GeoSolutions) for this work, performed in preparation for the FOSS4G-NA 2024 vector tiles workshop.
GeoPackage QGIS Compatibility ImprovementsA number of issues affecting interoperability with QGIS have been addressed:
GeoPackage extension output could contain field types that are not supported by GDAL. It turns out the GeoPackage export was picking up some of the file type information intended for PostGIS resulting output that could not be read by other programs such as QGIS.
We were also able to fix up the TIMESTAMP information representation as DATETIME, making the file format timezone agnostic as intended.

Thanks to David Blasby (GeoCat) for these fixes made on behalf of Zeeland and South Holland.
- GEOS-11416 GeoPackage output contains invalid field types when exporting content from PostGIS
These two new image mosaic merge modes activate when multiple images overlap with each other, choosing respectively the minimum and maximum value amongst the super-imposed pixels.

Thanks to Andrea Aime for the work, and the US National Research Laboratory for sponsoring it.
Release notesNew Feature:
- GEOS-11322 MapML WMS Vector Representation include query filter
- GEOS-11324 MapML WMS Vector Representation Style Classes
- GEOS-11352 REST service for URL checks
- GEOS-11376 Graduate Raster Attribute Table to extension
- GEOS-11390 Replace TestWfsPost with Javascript Demo Page
- GEOS-11414 Adding css-uniqueRoleName
Improvement:
- GEOS-11271 Upgrade spring-security to 5.8
- GEOS-11325 Add properties to set additional security headers
- GEOS-11337 Support feature tiles in MapML
- GEOS-11338 CapabilityUtil SearchMinMaxScaleDenominator should include support for multiple NamedLayers
- GEOS-11349 MapML Use WMS Resource Consumption Limit to specify max image size
- GEOS-11351 Exact term search in the pages’ filters
-
GEOS-11369 Additional authentication options for cascaded WMS WMTS data stores - GEOS-11370 Refactor inline JavaScript in the TestWfsPost Page
- GEOS-11371 Refactor inline JavaScript in the GetMap OpenLayers format
- GEOS-11379 Refactor inline JavaScript in the OGC API modules
- GEOS-11400 About Page Layout and display of build information
- GEOS-11401 Introduce environmental variables for Module Status page
- GEOS-11427 metadata: “fix all” to support changing config repeatable field
- GEOS-11443 REST API does not take effect immediately due to 10 minute authentication cache
- GEOS-11461 Enable MapML Viewer output for WFS getFeature.
- GEOS-11467 Update Marlin, make the bin package compatible with Java 17
- GEOS-11477 Add a max and a min merge mode for image mosaics
- GEOS-11486 Adding custom dimensions to MapML
- GEOS-11488 Double-Click-to-Copy featurecaption variable reference
- GEOS-11495 Support multi-layer output in CSS
- GEOS-11502 Permit resize on user/group/role palette textbox to allow for extra long role names
- GEOS-11503 Update mongo schemaless DWITHIN to support non-point geometry
- GEOS-11515 Add support for zoom level rule filtering in CSS
- GEOS-11526 GeoFence: slow GeoServer response when there are many roles and layergroups
- GEOS-11527 Add new vector tiles generation options in style body: vt-attributes, vt-coalesce, vt-labels, vt-label-attributes
- GEOS-11528 Update MapML viewer to latest release 0.14.0
- GEOS-11531 When coalescing linestrings in vector tiles output, fuse them to create a single long line
Bug:
- GEOS-7183 Demo request/wcs/wps pages incompatible with [HTTPS]
- GEOS-11202 CAS extension doesn’t use global “proxy base URL” setting for service ticket
- GEOS-11266 csw-iso: missing fields in summary response
- GEOS-11314 Error in IconService when style has multiple FeatureTypeStyle
- GEOS-11385 Demo Requests functionality does not honour ENV variable PROXY_BASE_URL
- GEOS-11416 GeoPackage output contains invalid field types when exporting content from PostGIS
- GEOS-11422 MapML License Metadata Stored With Incorrect Keys
- GEOS-11430 CiteComplianceHack not correctly parsing the context
- GEOS-11446 [INSPIRE] Incorrect behavior for unsupported languages
- GEOS-11462 500 error thrown when double adding a user to a group via REST with JDBC user/group services
- GEOS-11484 DirectRasterRenderer is not respecting advancedProjectionHandling and continuosMapWrapping format_options
- GEOS-11530 Adding or removing a grid subset in the layer caching tab, causes the grid dropdown to get duplicated
Task:
- GEOS-11341 Upgrade NetCDF to 5.3.3
- GEOS-11360 Upgrade Apache POI from 4.1.1 to 5.2.5
- GEOS-11362 Upgrade Spring libs from 5.3.32 to 5.3.33
- GEOS-11374 Upgrade Spring version from 5.3.33 to 5.3.34
- GEOS-11375 GSIP 224 - Individual contributor clarification
- GEOS-11393 Upgrade commons-io from 2.12.0 to 2.16.1
- GEOS-11395 Upgrade guava from 32.0.0 to 33.2.0
- GEOS-11397 App-Schema Includes fix Integration Tests
- GEOS-11402 Upgrade PostgreSQL driver from 42.7.2 to 42.7.3
- GEOS-11403 Upgrade commons-text from 1.10.0 to 1.12.0
- GEOS-11404 Upgrade commons-codec from 1.15 to 1.17.0
- GEOS-11407 Upgrade jackson from 2.15.2 to 2.17.1
- GEOS-11464 Update Jackson 2 libs from 2.17.1 to 2.17.2
- GEOS-11470 Upgrade the version of Mongo driver for schemaless plugin from 4.0.6 to 4.11.2
- GEOS-11471 Remove Sharding configuration support from MapML
- GEOS-11472 Upgrade freemarker from 2.3.31 to 2.3.33
- GEOS-11473 Upgrade guava from 33.2.0 to 33.2.1
- GEOS-11475 Upgrade commons-codec from 1.17.0 to 1.17.1
- GEOS-11478 Upgrade commons-lang3 from 3.14.0 to 3.15.0
- GEOS-11479 Upgrade junit from 4.13.1 to 4.13.2
- GEOS-11480 Update map fish-print-lib 2.3.1
- GEOS-11506 Upgrade Spring version from 5.3.37 to 5.3.39 and Spring security from 5.8.13 to 5.8.14
- GEOS-11508 Update OSHI from 6.4.10 to 6.6.3
- GEOS-11512 Upgrade jasypt from 1.9.2 to 1.9.3
- GEOS-11532 Update to JTS 1.20.0
- GEOS-11533 Update org.apache.commons.vfs2 to 2.9.0
- GEOS-11544 Upgrade to ImageIO-EXT 1.4.13
- GEOS-11545 Update to JAI-EXT 1.1.27
For the complete list see 2.26.0 release notes.
Community UpdatesCommunity modules are shared as source code to encourage collaboration. If a topic being explored is of interest to you, please contact the module developer to offer assistance.
Community module development:
- GEOS-10690 Task manager plugin is missing dependencies
- GEOS-10824 gs-flatgeobuf extension can clash with “directory of shapefiles” datastores
- GEOS-11331 OAuth2 can throw a “ java.lang.RuntimeException: Never should reach this point”
- GEOS-11358 Feature-Autopopulate Update operation does not apply the Update Element filter
- GEOS-11381 Error in OIDC plugin in combination with RoleService
- GEOS-11412 Remove reference to JDOM from JMS Cluster (as JDOM is no longer in use)
- GEOS-11466 move reusable elements of the graticule plugin to GeoTools
- GEOS-11469 Datadir catalog loader does not decrypt [HTTPStoreInfo] passwords
- GEOS-11518 DGGS JDBC store SQL encoder should not force the timezone to CET
- GEOS-11519 Make DGGS rHealPix tests run again
- GEOS-11521 Expose a JNDI variant of the DGGS Clickhouse datastore
- GEOS-11541 STAC search endpoint sortby query not working with POST
OGC API modules now nicely slot into the home page in the corresponding functional section, e.g., since both provide raw vector data, both OGC API Features and WFS show up in the same area:

Thanks to David Blasby (GeoCat) for this work.
- GEOS-11445 OGCAPI ServiceDescriptors
The “Data Directory loader”, by Gabriel Roldan (Camptocamp), is a replacement data directory loader, reading the XML configuration files at startup. It has been optimized to achieve better parallelism and be more efficient over network file systems.
It can be found amongst the nightly builds, it’s a simple drop in replacement, just unzip the plugin in
WFS HTML Freemarker outputWEB-INF/liband restart. Let us know how it works for you.The WFS HTML Freemaker output format is a community module generating HTML in response to GetFeature, using the GetFeatureInfo Freemarker templates.
Thanks to Alessio Fabiani (GeoSolutions) for starting this activity.
Graticule moduleThe graticules module is the combination of a data store and a rendering transformation allowing to generate graticules at multiple resolutions, and optionally placing the graticule labels at the map borders.

Thanks to Ian Turton for working on this activity. Ian needs a few more people to try this out before it can be included in our GeoServer roadmap.
Developer UpdatesGeoServer team has identified quite the challenges for GeoServer 2024 Roadmap Plannings.
Wicket ProgressAfter initial testing of 2.26-M0 milestone release we held off including Wicket 9 until after the 2.26.0 release. Thanks to Peter Smythe and Jody Garnett for testing.
Thanks to Brad Hards who started this work in November 2023, and David Blasby who helped bring this up to a state it could be tested ahead of the 2.26.0 release.
Spring Security 5.8Thanks to Andreas Watermeyer (ITS Digital Solutions) completed this important update.
This is the last stopping place before Spring Security 6, and the last chance to work with the OAuth2 community modules.
- GEOS-11271 Upgrade spring-security to 5.8
Additional information on GeoServer 2.26 series:
-
sur Mappery: Watervliet Shaker Village
Publié: 17 September 2024, 11:00am CEST
Pièce jointe: [télécharger]

Patrick Curley shared this – A map of the Watervliet Shaker Village at the Shaker Heritage Society in Albany, NY.
-
sur World Level Zero
Publié: 17 September 2024, 10:37am CEST par Keir Clarke
How well traveled are you?My new map World Level Zero turns your travel experiences into a global achievement tracker. Whether you've been globetrotting for years or are just getting started, World Level Zero allows you to plot your personal journey across the globe and turn your wanderlust into a tangible score.What Is World Level Zero?At its core, World Level Zero revolves around a simple
-
sur geomatico: Misión exploratoria de visualización raster serverless: COG en Maplibre y más allá
Publié: 16 September 2024, 11:23am CEST
Jornadas SIG Libre 2024
Conferencia sobre cómo consumir y visualizar datos en formato raster desde la nube en la XVII Edición de las Jornadas de SIG Libre, ponentes: Francisco Pérez Sampayo y Óscar Fonts
-
sur Mappery: 50 Yard Line Map of Illinois
Publié: 16 September 2024, 11:00am CEST


Doug shared this, he said “Go Penn State!” whatever that means to a Brit?
-
sur Every Basketball Court on Google Maps
Publié: 16 September 2024, 9:30am CEST par Keir Clarke
The Pudding has mapped Every Outdoor Basketball Court in the U.S.A.. I'm not sure why The Pudding decided to collate satellite imagery of every basketball court visible in Google Maps' aerial imagery but it is quite fun to play with.My guess is that Every Outdoor Basketball Court in the U.S.A. is an experiment by The Pudding in using computer vision to detect, recognize and classify objects in
-
sur From GIS to Remote Sensing: Tutorial: Random Forest Classification Using the Semi-Automatic Classification Plugin
Publié: 16 September 2024, 8:00am CEST
This is a tutorial about the land cover classification using the Random Forest algorithm in the Semi-Automatic Classification Plugin (SCP).Please note that the installation of the dependency scikit-learn is required (see Plugin Installation). It is assumed that you have already read the Basic Tutorials.Following the video tutorial.
Read more » -
sur PostGIS Development: PostGIS 3.5.0rc1
Publié: 16 September 2024, 2:00am CEST
The PostGIS Team is pleased to release PostGIS 3.5.0rc1! Best Served with PostgreSQL 17 RC1 and GEOS 3.13.0.
This version requires PostgreSQL 12 - 17, GEOS 3.8 or higher, and Proj 6.1+. To take advantage of all features, GEOS 3.12+ is needed. SFCGAL 1.4+ is needed to enable postgis_sfcgal support. To take advantage of all SFCGAL features, SFCGAL 1.5 is needed.
3.5.0rc1This release is a release candidate of a major release, it includes bug fixes since PostGIS 3.4.3 and new features.
Changes since 3.5.0beta1 are as follows:
-
sur PostGIS Development: PostGIS 3.5.0beta1
Publié: 16 September 2024, 2:00am CEST
The PostGIS Team is pleased to release PostGIS 3.5.0beta1! Best Served with PostgreSQL 17 RC1 and GEOS 3.13.0.
This version requires PostgreSQL 12 - 17, GEOS 3.8 or higher, and Proj 6.1+. To take advantage of all features, GEOS 3.12+ is needed. SFCGAL 1.4+ is needed to enable postgis_sfcgal support. To take advantage of all SFCGAL features, SFCGAL 1.5 is needed.
3.5.0beta1This release is a beta of a major release, it includes bug fixes since PostGIS 3.4.3 and new features.
-
sur WhereGroup: Artenvielfalt, Naturschutz und Rohstoffe? Kein Widerspruch! Die bundesweite Biodiversitätsdatenbank der Baustoff-Steine-Erden-Industrie
Publié: 15 September 2024, 12:00pm CEST
Interview mit Tanja Lenz, Leiterin Reporting und Statistik beim Bundesverband Baustoffe - Steine und Erden e.V. -
sur Mappery: The Travels of Marco Polo
Publié: 15 September 2024, 12:00pm CEST
Pièce jointe: [télécharger]

Reinder spotted this exquisite flyleaf detailing the travels of Marco Polo. I could gawp at this for ages without ever turning a page. The cover is pretty amazing too.
BTW, today is Marco Polo’s birthday (born in 1254)

-
sur Scrambled Maps on Toast
Publié: 14 September 2024, 3:30pm CEST par Keir Clarke
I have a new favorite daily breakfast map game. Everyday my espresso and avocado toast is now served with a side dish of Scrambled Maps.Scrambled Maps is a new daily map challenge. Everyday Scambled Maps presents you with a map of a different city of the world. The only problem is that all the map tiles on this city map have been mixed up. Your task is simply to drag the tiles back into the
-
sur Mappery: Dena’ina
Publié: 14 September 2024, 11:00am CEST
Pièce jointe: [télécharger]

Greg Fiske said “Admiring the nexus of #IndigenousArt and #mapsinthewild this week. Dena’ina land” In case you are wondering Dena’ina is in south Alaska (the map shows the whole of Alaska)

-
sur Mappery: World Time
Publié: 13 September 2024, 11:00am CEST
Pièce jointe: [télécharger]

Michel Stuyts asks “Am I the only one who sees this kind of clock in a shop and the first thing that comes to mind is: I wonder what kind of projection they used?”
The answer is definitely not! There are thousands of map lovers here who would love to answer you Michel
-
sur Create an AI Poster for Your Location
Publié: 13 September 2024, 10:59am CEST par Keir Clarke
The Global Culture Map is a fun little tool which uses AI to create a poster for any location chosen on an interactive. Simply click on the Global Culture Map and it will use a generative AI to design a poster based on that location.Currently I would say that the Global Culture Map is an interesting fun experiment rather than a completed, fully-realized AI poster creation tool. At the moment the
-
sur Fernando Quadro: 5 maneiras de usar IA generativa em seus aplicativos geoespaciais
Publié: 12 September 2024, 2:00pm CEST
A IA generativa claramente faz jus ao hype. Onde a localização importa, os LLMs trazem muitas oportunidades para melhorar seus aplicativos GIS e facilitar as interações com os usuários ao introduzir solicitações de linguagem natural.
Aqui estão 5 maneiras de usar IA generativa em seus aplicativos geoespaciais:
 Melhore a busca por dados com pesquisa semântica
A pesquisa semântica melhora drasticamente os resultados de uma pesquisa lexica simples porque a IA entende o significado das solicitações, sem prestar atenção às palavras escolhidas.
A pergunta “Quando as lixeiras são recolhidas” encontrará resultados sobre “Política de coleta de lixo”, enquanto a pesquisa lexica não pode corresponder a nenhuma palavra.
Você pode ir além e usar uma abordagem híbrida (mesclando léxico e semântico) para ajustar sua pesquisa. Enriqueça seu conjunto de dados extraindo dados estruturados de texto não estruturado
Os LLMs podem extrair valores estruturados de dados não estruturados, como texto. Quando você tem apenas um título e/ou uma descrição sobre seu conjunto de dados, a IA pode extrair palavras-chave, temas ou qualquer outra informação contextual contida na descrição. Essas informações extraídas podem então ser indexadas para ajustar a pesquisa. Este método pode ser usado para enriquecer registros de metadados e conjuntos de dados.
Por exemplo, extrair pontos de vista de uma descrição de trilha Conduza seu aplicativo geoespacial com ferramentas e chamadas de função
Com a chamada de função, os modelos de IA fornecem uma maneira de especificar diferentes ações que o LLM deve entender de sua solicitação e chamar os métodos apropriados com os argumentos correspondentes diretamente do seu código. Você pode então conduzir seu aplicativo por solicitações naturais (texto ou voz).
Por exemplo: Adicione ciclovias ao mapa, ative o modo escuro etc. Desenvolva habilidades de inteligência de localização com modelos text2sql específicos
Modelos de IA específicos realmente brilham ao transformar uma solicitação do usuário em uma consulta SQL. Isso permite que o usuário solicite qualquer informação complexa oculta em seu banco de dados. O modelo definitivo para aplicações geoespaciais pode ser um modelo text2postgis que permite qualquer consulta espacial para sua aplicação, como junções espaciais, buffers, agrupamento, distribuições h3 e muito mais possibilidades.
Por exemplo: encontre todos os restaurantes a 1 km de qualquer hotel em Paris. Crie seu chatbot personalizado com agentes
Com agentes, você pode usar LLMs para escolher uma sequência de ações a serem tomadas. Isso significa que a IA escolherá por conta própria quais métodos chamar, sequencialmente, para responder à sua solicitação. Uma dessas ações pode ser pedir esclarecimentos ao usuário sobre sua solicitação, criando uma conversa com o usuário. Além disso, ajuda a entender como a IA constrói os resultados, pois o agente está lhe dizendo o que ele está realmente fazendo para atender à sua demanda.Por exemplo: encontre todos os restaurantes a 1 km de qualquer hotel em Paris.
Extraindo a geometria de Paris
Colocando todos os hotéis contidos nessa geometria
Construindo um buffer de 1 km ao redor das geometrias de pontos de hotéis
Colocando todos os restaurantes contidos nesses buffersComo você vê, a IA Generativa oferece habilidades inestimáveis ??para impulsionar seus aplicativos geoespaciais para o próximo nível e realmente ajudar seus aplicativos a serem realmente consumidos pelos usuários. Ao combinar todas essas técnicas, você pode acabar construindo um chatbot de inteligência de localização para resolver quaisquer preocupações territoriais e ajudar no processo de tomada de decisão em qualquer escala.
Fonte: webgis.tech
Instagram: [https:]]
LinkedIn: [https:]] -
sur Mappery: Salt Lake City Woodcarving
Publié: 12 September 2024, 11:00am CEST
Pièce jointe: [télécharger]

Matt Malone shared this, he said “Stumbled upon this excellent woodcarved street map of Salt Lake City recently. Airports should have their own #MapsInTheWild category.” We don’t really do categories on Mappery because I would forget to tag things and Arnaud or Dan would probaly tag them differently and there chaos lies.
Cracking piece of woodwork though!
-
sur The EJAtlas: A Map for Environmental Justice
Publié: 12 September 2024, 8:49am CEST par Keir Clarke
Around the world the ever demanding quest for economic growth and profit is having an impact on natural environments. The result is that local communities and groups are often forced into fighting governments and multinational companies in order to try to save their local environments from the eternal forces of 'progress'.The Environmental Justice Atlas has set itself the task of documenting
-
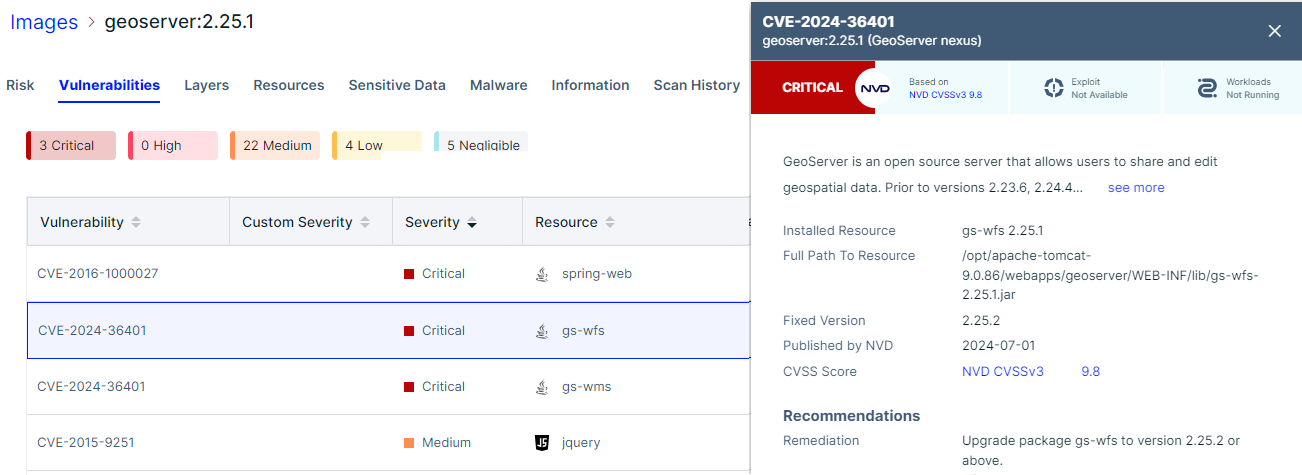
sur GeoServer Team: CVE-2024-36401 Remote Code Execution (RCE) vulnerability in evaluating property name expressions
Publié: 12 September 2024, 2:00am CEST
The GeoServer community has been under considerable strain responding to CVE-2024-36401. This vulnerability stems from GeoTools library CVE-2024-36404.
This vulnerability, in the handling of XPath expressions, affords a “remote code execution” attack that is under active exploit. A remote code execution (RCE) attack allows an attacker to run malicious code on your computer or network.
For more information:
- GeoServer 2.25.2 Release (Jun 18, 2024)
- GeoServer 2.24.4 Release (Jun 18, 2024)
- CVE-2024-36401 (July 1, 2024)
- CISA Warns of Actively Exploited RCE Flaw in GeoServer GeoTools Software (The Hacker News, July 18, 2024)
- GeoServer Vulnerability Targeted by Hackers to Deliver Backdoors and Botnet Malware (The Hacker News, September 6, 2024)
You are responsible for running a GeoServer instance that has not been updated.
-
CVE-2024-36401 provides mitigation instructions which you should perform immediately.
Please stop reading and do this now.
-
Update your instance: Upgrading existing versions (User Guide)
The instructions include notes on upgrading specific versions. Please read carefully to see if any manual changes are required.
With such a serious issue several service providers have stepped forward to make fixes available for prior releases.
Full release:
- GeoServer 2.23.6 Release (GeoCat)
Patch provided with CVE-2024-36401 report:
- GeoServer 2.25.1 (GeoSolutions)
- GeoServer 2.24.3 (GeoSolutions)
- GeoServer 2.24.2 (GeoSolutions)
- GeoServer 2.23.2 (GeoSolutions)
- GeoServer 2.22.2 (GeoSolutions)
- GeoServer 2.21.5 (GeoSolutions)
- GeoServer 2.21.4 (GeoSolutions)
- GeoServer 2.20.7 (GeoSolutions)
- GeoServer 2.20.4 (GeoSolutions)
- GeoServer 2.19.2 (GeoSolutions)
- GeoServer 2.18.0 (GeoSolutions)
Free software is a participation sport - to create a patch for a prior release volunteer with community development.
Q: How often should I upgrade GeoServer?GeoServer operates with a time boxed release cycle, maintaining “stable” and “maintenance” releases, over the course of a year.
-
Upgrade GeoServer twice a year as new stable releases are made.
-
Once the release you are using has entered “maintenance” it is a good idea to upgrade (before the release is no longer supported).
-
GeoServer security policy provides one year of support. You may also contact our service providers for extended support beyond this timeframe.
Stay up to date:
-
Please monitor release announcements for the heading “Security Considerations”.
Security Considerations
This release addresses security vulnerabilities and is considered an essential upgrade for production systems.
- CVE-2024-36401 Critical
You can review the release announcement, and in this case with a “Critical” vulnerability decide to update.
-
When everyone has had an opportunity to update the details of the vulnerability are announced.
Security Considerations
This release addresses security vulnerabilities and is considered an essential upgrade for production systems.
- CVE-2024-36401 Remote Code Execution (RCE) vulnerability in evaluating property name expression (Critical)
-
As GeoServer has now adopted use CVEs for publication you may also have success with vulnerability scanning tools.
These tools function when the vulnerability is published, and do not provide any advance notice.
As security reports contain sensitive information they are only shared with representatives of the geoserver-security email list.
Participation in geoserver-security, like commit access, is volunteer based and reflects trust.
Please review GeoServer Security Policy if you are in a position to help out.
-
sur Bentley Systems increases investment in OGC and reinforces commitment to Open Standards following Cesium acquisition
Publié: 11 September 2024, 3:00pm CEST par Simon Chester
The Open Geospatial Consortium (OGC) is pleased to announce that infrastructure engineering software company Bentley Systems is increasing its investment and engagement in OGC—and further strengthening its commitment to growing an open ecosystem.
Bentley recently acquired Cesium, a fellow OGC member and the creator of 3D Tiles, an OGC Community Standard for massive heterogenous 3D geospatial content.
Bentley’s increased investment in OGC, coupled with its acquisition of Cesium, signals their commitment to a future built around open standards, data, and infrastructure. OGC’s trusted community of problem solvers leverages the power of geography, open standards, and interconnected systems to address real-world problems while opening up opportunities for commercial growth.
“We are pleased to see this increased investment in OGC by Bentley, and their support to us as a Principal member,” said Peter Rabley, Chief Executive Officer, OGC. “As a Principal Member of OGC, Bentley will play a significant role serving on OGC’s Executive Planning Committee and participating in final approval decisions for all OGC Standards and nominations to the Board of Directors.”
Patrick Cozzi, Chief Platform Officer, Bentley, and Cesium founder, commented, “The success and impact of 3D Tiles as an open standard reinforces our belief that openness and interoperability are essential to making the best use of location information to benefit society. We look forward to continuing to work within the OGC community as part of Bentley.”
“Bentley is a strong supporter of open data ecosystems,” added Julien Moutte, Chief Technology Officer, Bentley Systems. “As a principal member of OGC, we are committing further resources to accelerate the development and adoption of open standards that benefit applications for the built and natural environment.”
About OGC
The Open Geospatial Consortium (OGC) is a membership organization dedicated to using the power of geography and technology to solve problems faced by people and the planet. OGC unlocks value and opportunity for its members through Standards, Innovation, and Policy & Advocacy. Our membership represents a diverse and active global community drawn from government, industry, academia, international development agencies, research & scientific organizations, civil society, and advocates.
Visit ogc.org for more information about our work.About Bentley Systems
Bentley Systems (Nasdaq: BSY) is the infrastructure engineering software?company. Bentley provides innovative software to advance the world’s infrastructure – sustaining both the global economy and environment. Bentley’s industry-leading software solutions are used by professionals, and organizations of every size, for the design, construction, and operations of roads and bridges, rail and transit, water and wastewater, public works and utilities, buildings and campuses, mining, and industrial facilities. Bentley’s offerings, powered by the iTwin?Platform for infrastructure digital twins, include MicroStation and Bentley Open?applications for modeling and simulation, Seequent’s software for geoprofessionals, and Bentley Infrastructure Cloud encompassing ProjectWise?for project delivery, SYNCHRO?for construction management, and AssetWise?for asset operations. Bentley Systems’ 5,200 colleagues generate annual revenues of more than $1 billion in 194 countries.About Cesium
Cesium is the open platform for 3D Geospatial. Cesium created 3D Tiles, the Open Geospatial Consortium community standard for streaming massive 3D geospatial datasets. Use Cesium ion to optimize, host, and combine your data with curated global 3D content and stream to any device. With unique expertise at the intersection of 3D geospatial and computer graphics, Cesium is deeply committed to openness and interoperability through open standards, open APIs, and open source offerings like CesiumJS, Cesium for Unreal, Cesium for Unity, and Cesium for Omniverse. Originally built for Aerospace, Cesium is now used to power thousands of applications in industries like Defense, Architecture, Engineering, Construction and Operations, Commercial real estate, urban planning, and more.The post Bentley Systems increases investment in OGC and reinforces commitment to Open Standards following Cesium acquisition appeared first on Open Geospatial Consortium.
-
sur The Map to the White House
Publié: 11 September 2024, 11:20am CEST par Keir Clarke
NBC has launched the 2024 edition of its Road to 270 interactive electoral college map. The map visualizes the current likely, possible and fantastical outcomes of the 2024 U.S. Presidential race. Last night Kamala Harris and Donald Trump went head-to-head in their first presidential debate. The Philadelphia debate was a hugely significant opportunity for both Harris and Trump to present their
-
sur Mappery: La Tharee
Publié: 11 September 2024, 11:00am CEST
Pièce jointe: [télécharger]

Julien Minet shared this spectacular mappy beer bottle. “Here again an association of cartography and beers, a hand-drawn map of some part of the Ardenne printed on a special edition of the Belgian beer La Tharée”
-
sur Sean Gillies: Fiona 1.10.0
Publié: 11 September 2024, 3:16am CEST
I made a software release last Tuesday. One with new features, deprecations, major refactoring, and packaging and dependency changes, not just bug fixes. Fiona 1.10.0 has three main changes: Python openers, CLI filter commands, and new data classes.
Python openers can connect filesystems implemented in Python, like fsspec or tiledb.vfs, to GDAL's own virtual filesystem machinery. In most cases, you should reply on GDAL's built-in virtual filesystem handlers. On the other hand, if you have unique or proprietary data access protocols, then Fiona's new openers may be useful. As far as I know, Fiona (and Rasterio) have the only open source implementations of GDAL's virtual filesystem plugin system. David Hoese had the initial idea, Even Rouault helped a lot, and I got it over the finish line. I think this is right up there with MemoryFile for my favorite feature that didn't exist in Python-GIS software before.
Fiona's CLI has three new commands, filter (strictly speaking, a new mode of this command), map, and reduce. These provide some great features for Unix-style data processing pipelines and are designed to work well with jq and programs of that nature. Think of them as the data processing part of ogr2ogr, split into 3 simpler commands, reading and writing to stdin/stdout by default, with no SQL and no need to know about different SQL dialects. The documentation contains a new tutorial about using filter, map, and reduce. This work began in planetlabs/fio-planet and now lives in the Fiona CLI core. Thank you, Tim Schaub, for stewarding the transition.
Lastly, Fiona now longer represents GIS features (and their geometries and properties) as Python dicts, but as Python classes:
fiona.model.Feature,fiona.model.Geometry, andfiona.model.Properties. These classes provide dict-like access for backwards compatibility, but raise warnings when mutated. These data classes will be immutable in version 2.0.A lot of GIS-Python attention has moved on to columnar data and massive amounts of time series, trajectories, telemetry, etc, using Parquet and Arrow. But, there's still a need to reason about persistent spatial things in our world and their relationships to each other. Classic GIS features, in other words. Watersheds, counties, neighborhoods. That's what Fiona remains concerned about.
-
sur Camptocamp: GeoServer 3 Call for Crowdfunding
Publié: 11 September 2024, 2:00am CEST
Pièce jointe: [télécharger]
GeoServer is at a critical turning point and it needs your help to continue its journey as the leading free and Open Source platform for geospatial data. With GeoServer 3 we are transforming the way you interact with geospatial data—making it faster, more intuitive, and more secure. -
sur Fernando Quadro: GeoServer 3 – Campanha de Crowdfunding
Publié: 10 September 2024, 9:49pm CEST
O GeoServer precisa da sua ajuda para continuar sua jornada como a principal plataforma gratuita e de código aberto para dados geoespaciais. Com o GeoServer 3, estamos transformando a maneira como você interage com dados geoespaciais, tornando-os mais rápidos, intuitivos e seguros.
Esta grande atualização, liderada pela Camptocamp, GeoSolutions e GeoCat, fornecerá:
- Desempenho futuro: um núcleo modernizado para compatibilidade com as mais recentes tecnologias de gerenciamento e implantação de dados.
- Processamento de imagem aprimorado: manuseio mais rápido e suave de imagens espaciais e conjuntos de dados maiores.
- Segurança e conformidade aprimoradas: atenda aos padrões regulatórios e proteja seus dados com os mais recentes aprimoramentos de segurança.
- Experiência do usuário simplificada: navegação mais fácil, integração de novos serviços e capacitação de usuários em todos os níveis.
O escopo deste trabalho está além de atualizações de rotina ou manutenção, já que a transição para o GeoServer 3 requer um amplo redesenvolvimento dos sistemas principais, bem como a implementação de práticas de segurança modernas e também testes e validação completos em todas as extensões do GeoServer.
Os membros do consórcio – Camptocamp, GeoSolutions e GeoCat – têm uma longa história de suporte e contribuição ao GeoServer e estão totalmente comprometidos com o sucesso desta migração. No entanto, este é um grande esforço que não pode ser concluído sem o suporte da comunidade.
Ao apoiar esta campanha de crowdfunding, você está investindo no futuro do GeoServer e ajudando a sustentar a comunidade geoespacial inovadora e de código aberto.
1. Por que GeoServer 3?
À medida que o cenário digital evolui, manter-se atualizado com as últimas tecnologias não é mais opcional — é essencial. O GeoServer 3 está sendo desenvolvido para enfrentar desafios cruciais e garantir que o GeoServer continue sendo uma plataforma confiável e segura para o futuro. Vários fatores-chave tornam esta atualização crítica agora:
- Conformidade regulatória: Novas regulamentações, incluindo a lista de vulnerabilidades exploradas conhecidas da CISA, exigem que os sistemas sejam totalmente corrigidos para garantir a prontidão operacional. Sem as últimas atualizações, o GeoServer corre o risco de ficar aquém desses padrões, e é por isso que migrar para o Spring 6 é essencial.
- Fim do suporte para o Spring 5: Em janeiro de 2025, o Spring 5 não receberá mais atualizações de segurança, deixando os sistemas vulneráveis. Como o GeoServer opera como middleware entre serviços da web e camadas de dados essenciais, esta atualização para o Spring 6 é crucial para manter conexões seguras e proteger dados de possíveis violações.
- Melhorias de segurança: A atualização para o Spring 6 habilita protocolos OAuth2 para autenticação segura, especialmente crítica para uso em larga escala ou em nível empresarial. Esses avanços ajudarão as organizações a atender aos requisitos de segurança em evolução e proteger dados geoespaciais confidenciais.
- Mudança para o JDK 17: Esta atualização também marca a transição do GeoServer para o JDK 17, que traz melhorias em desempenho, segurança e suporte de longo prazo. Manter o GeoServer alinhado com as versões mais recentes do Java garante compatibilidade com as modernas tecnologias de implantação Tomcat 10 e Jakarta e prepara a plataforma para o futuro.
- Processamento de imagem aprimorado: O GeoServer 3 substituirá a biblioteca Java Advanced Imaging (JAI) desatualizada pelo kit de ferramentas ImageN mais moderno e flexível. Esta mudança aumentará significativamente os recursos de processamento de imagem, permitindo um manuseio mais rápido de grandes conjuntos de dados espaciais e melhorando a compatibilidade com Java.
- Conjunto de tecnologia à prova do futuro: Com a migração para o Spring 6 e a mudança para o JDK 17, o GeoServer 3 garante viabilidade de longo prazo. Abordar toda a pilha do GeoServer, incluindo os componentes corporativos GeoFence e Cloud Native GeoServer, permite que as organizações adotem perfeitamente a infraestrutura moderna e os modelos de implantação sem comprometer o desempenho ou a segurança.
Com este trabalho, o GeoServer está caminhando para um futuro mais seguro e de alto desempenho, pronto para atender às necessidades em evolução da comunidade geoespacial.
2. Sobre a Campanha de Crowdfunding
Embora o consórcio esteja totalmente comprometido com esse esforço, o tamanho da tarefa significa que precisamos de suporte financeiro adicional para que isso aconteça. É aqui que você entra. Ao contribuir para esta campanha de financiamento coletivo, você está apoiando diretamente os desenvolvedores e engenheiros que realizarão a atualização, garantindo o sucesso contínuo do GeoServer.
Seu suporte, seja como indivíduo, instituição pública ou provedor de serviços, é vital. Ao contribuir para esta campanha de financiamento coletivo, você está investindo no futuro da tecnologia geoespacial de código aberto. O financiamento coletivo será estruturado em duas fases para garantir o sucesso:
- Fase de compromisso: patrocinadores e membros da comunidade prometerão seu suporte financeiro durante esta fase, mas nenhum fundo será coletado. O objetivo é atingir uma meta predefinida que cubra todo o escopo de trabalho necessário para a migração.
- Ativação do financiamento: assim que a meta for atingida, o financiamento coletivo será ativado e os patrocinadores serão faturados pelos valores prometidos. Isso garante que haja suporte financeiro suficiente para concluir a migração sem correr o risco de subfinanciamento.
Essa abordagem estruturada garante que o GeoServer 3 seja totalmente financiado antes de qualquer trabalho começar, evitando o risco de uma migração incompleta. Isso garante que o projeto terá os recursos necessários para ser concluído em sua totalidade.
3. Como participar
O GeoServer tem a confiança de milhares de organizações no mundo todo. Agora é a hora de dar um passo à frente e se juntar a essa comunidade de apoiadores.
Ao doar, você ajudará a garantir o futuro do GeoServer como uma plataforma de alto desempenho e código aberto. Cada contribuição conta.
Pronto para dar suporte ao GeoServer 3? Entre em contato pelo e-mail gs3-funding@googlegroups.com para expressar seu interesse ou prometer seu apoio.
Juntos, podemos garantir o futuro do GeoServer nos próximos anos.
-
sur GeoCat: GeoServer 3 Call for Crowdfunding
Publié: 10 September 2024, 5:35pm CEST
GeoServer is at a critical turning point and it needs your help to continue its journey as the leading free and open-source platform for geospatial data. With GeoServer 3 we are transforming the way you interact with geospatial data—making it faster, more intuitive, and more secure.
This major upgrade, led by Camptocamp, GeoSolutions, and GeoCat, will deliver:
- Future-Proof Performance: A modernized core for compatibility with the latest data management and deployment technologies.
- Enhanced Image Processing: Faster, smoother handling of spatial imagery and larger datasets.
- Improved Security and Compliance: Meet regulatory standards and protect your data with the latest security enhancements.
- Streamlined User Experience: Easier navigation, integrating new services, and empowering users at all levels.
The scope of this work is beyond routine updates or maintenance since the transition to GeoServer 3 requires extensive redevelopment of core systems as well as implementing modern security practices and also thorough testing and validation across all GeoServer extensions
The consortium members – Camptocamp, GeoSolutions, and GeoCat – have a long-standing history of supporting and contributing to GeoServer and are fully committed to the success of this migration. However, this is a major effort that cannot be completed without community support.
By supporting this crowdfunding campaign, you are investing in the future of GeoServer and helping to sustain the innovative, open-source geospatial community.
Why GeoServer 3As the digital landscape evolves, staying up-to-date with the latest technology is no longer optional—it’s essential. GeoServer 3 is being developed to address crucial challenges and ensure that GeoServer remains a reliable and secure platform for the future. Several key factors make this upgrade critical right now:
- Regulatory Compliance: New regulations, including the CISA known exploited vulnerabilities list, demand that systems be fully patched to ensure operational readiness. Without the latest updates, GeoServer risks falling short of these standards, which is why migrating to Spring 6 is essential.
- End of Support for Spring 5: By January 2025, Spring 5 will no longer receive security updates, leaving systems vulnerable. As GeoServer operates as middleware between web services and essential data layers, this upgrade to Spring 6 is crucial to maintaining secure connections and protecting data from potential breaches.
- Security Enhancements: Upgrading to Spring 6 enables OAuth2 protocols for secure authentication, especially critical for large-scale or enterprise-level use. These advancements will help organizations meet evolving security requirements and protect sensitive geospatial data.
- Switching to JDK 17: This upgrade also marks GeoServer’s transition to JDK 17, which brings improvements in performance, security, and long-term support. Keeping GeoServer aligned with the latest Java versions ensures compatibility with modern deployment technologies Tomcat 10 and Jakarta and future-proofs the platform.
- Improved Image Processing: GeoServer 3 will replace the outdated Java Advanced Imaging (JAI) library with the more modern and flexible ImageN toolkit. This switch will significantly enhance image processing capabilities, enabling faster handling of large spatial datasets and improving Java compatibility.
- Future-Proof Technology Stack: With the migration to Spring 6 and the shift to JDK 17, GeoServer 3 ensures long-term viability. Addressing the entire GeoServer stack, including enterprise components GeoFence and Cloud Native GeoServer, allows organizations to seamlessly adopt modern infrastructure and deployment models without compromising performance or security.
With this work, GeoServer is moving into a more secure, high-performing future—ready to tackle the evolving needs of the geospatial community.
About the Crowdfunding campaignWhile our consortium is fully committed to this effort, the size of the task means that we need additional financial support to make it happen. This is where you come in. By contributing to this crowdfunding campaign, you are directly supporting the developers and engineers who will carry out the upgrade, ensuring the continued success of GeoServer.
Your support, whether as an individual, a public institution, or a service provider, is vital. By contributing to this crowdfunding campaign, you’re investing in the future of open-source geospatial technology. The crowdfunding will be structured in two phases to ensure success:
- Commitment Phase: Sponsors and community members will pledge their financial support during this phase, but no funds will be collected. The goal is to reach a predefined target that covers the full scope of work necessary for the migration.
- Funding Activation: Once the target is reached, the crowdfunding will be activated, and sponsors will be invoiced for their pledged amounts. This ensures there is enough financial backing to complete the migration without risking underfunding.
This structured approach ensures that GeoServer 3 is fully funded before any work begins, preventing the risk of an incomplete migration. This guarantees that the project will have the necessary resources to be completed in its entirety.
How to participateGeoServer is trusted by thousands of organizations worldwide. Now is the time to step forward and join this community of supporters.
By donating, you’ll help secure GeoServer’s future as a high-performance, open-source platform. Every contribution counts.
Ready to support GeoServer 3? Contact us at gs3-funding@googlegroups.com to express your interest or pledge your support.
Together, we can secure the future of GeoServer for years to come.
The post GeoServer 3 Call for Crowdfunding appeared first on GeoCat bv.
-
sur GeoSolutions: GeoServer 3 Call for Crowdfunding
Publié: 10 September 2024, 5:04pm CEST
You must be logged into the site to view this content.
-
sur Fernando Quadro: Geotecnologias e o Combate à Violência
Publié: 10 September 2024, 2:00pm CEST
A violência, principalmente os Crimes Violentos Letais Intencionais (CVLIs), são um problema grave no Brasil. Essa categoria engloba homicídios dolosos, latrocínios (roubos seguidos de mortes) e lesões corporais seguidas de morte. Analisar a evolução desses índices nas maiores cidades do país e em âmbito nacional e fundamental para compreender as dinâmicas da violência urbana e para o desenvolvimento de políticas púbicas eficazes que propõem um enfoque multifacetado que combine ações repressivas e preventivas, com base em dados e análises geoespaciais.
Quais ferramentas podem nos auxiliar na gestão da segurança pública? Visualização de padrões espaciais da criminalidade: Mapas de calor e outras ferramentas identificam áreas com alta concentração de CVLIs, auxiliando na alocação de recursos policiais e na definição de zonas prioritárias para ações preventivas.
Análise de tendências e identificação de focos de violência: Dados históricos e em tempo real permitem identificar tendências da criminalidade, prever picos de violência e direcionar ações de forma proativa.
Monitoramento de operações policiais em tempo real: O rastreamento de viaturas e equipes facilita a coordenação de operações e otimiza a resposta a crimes em andamento.
Investigação de crimes com mais precisão: A análise espacial de cenas de crime, incluindo sobreposição de dados de diferentes fontes, pode auxiliar na investigação e na identificação de suspeitos.
Engajamento da comunidade na prevenção da violência: O compartilhamento de informações geoespaciais com a comunidade pode aumentar a percepção de segurança e fomentar a colaboração na prevenção da criminalidade.A integração da Geotecnologia com as estratégias de combate à violência pode fortalecer significativamente as ações de segurança pública:
Fortalecimento das forças policiais: Pode auxiliar no treinamento de policiais na análise espacial, permitindo uma melhor compreensão da dinâmica da criminalidade em suas áreas de atuação.
Prevenção através da educação e inclusão social: Pode ser utilizada para mapear e direcionar programas sociais e educativos para áreas com maior vulnerabilidade à violência, promovendo a inclusão social e prevenindo a criminalidade.
Melhoria do sistema de justiça criminal: A análise geoespacial pode auxiliar na investigação de crimes, na identificação de reincidentes e na definição de medidas socioeducativas mais eficazes.Através da inteligência geográfica, é possível ter uma visão mais completa e precisa da criminalidade, permitindo ações mais eficazes na prevenção e no combate à violência.
Fonte: webgis.tech
Instagram: [https:]]
LinkedIn: [https:]]
-
sur Tracking Russia's 'Dark' Shadow Ships
Publié: 10 September 2024, 11:34am CEST par Keir Clarke
Asya Energy's AIS track places it in the Norwegian Sea, at the same time satellite imagery shows it at the ALNG2 plantIn response to Russia's invasion of Ukraine the West has imposed sanctions on the sale of Russian oil. In an attempt to avoid these sanctions Russia has been operating a shadow fleet of covert oil tankers. The West has been working on strengthening international cooperation to try
-
sur Mappery: Noel Gallagher Goes European
Publié: 10 September 2024, 11:00am CEST
Pièce jointe: [télécharger]

Berndasn shared this pic from a Noeel Gallagher concert in Amsterdam
-
sur AI Search of San Francisco
Publié: 9 September 2024, 12:18pm CEST par Keir Clarke
AI and machine learning are revolutionizing the field of remote sensing. The ability of machine learning algorithms to automatically detect and identify objects in satellite images has enhanced our abilities to monitor deforestation, identify illegal fishing, track wildlife, and more quickly implement disaster response.Thanks to AI it is now also possible to see who owns a Tesla car in San -
sur China vs America - World Influence Map
Publié: 7 September 2024, 11:10am CEST par Keir Clarke
The Global Influence Index (GII) shows the influence of the United States and China on 191 countries around the world based on 28 different economic, security, and political criteria. Using the GII's new 3D globe you can tell at a glance where in the world either the U.S. or China has the greatest influence.Individual countries on the GII globe are colored to show whether they are aligned more
-
sur Mappery: Argentina on Cow Hide
Publié: 7 September 2024, 11:00am CEST
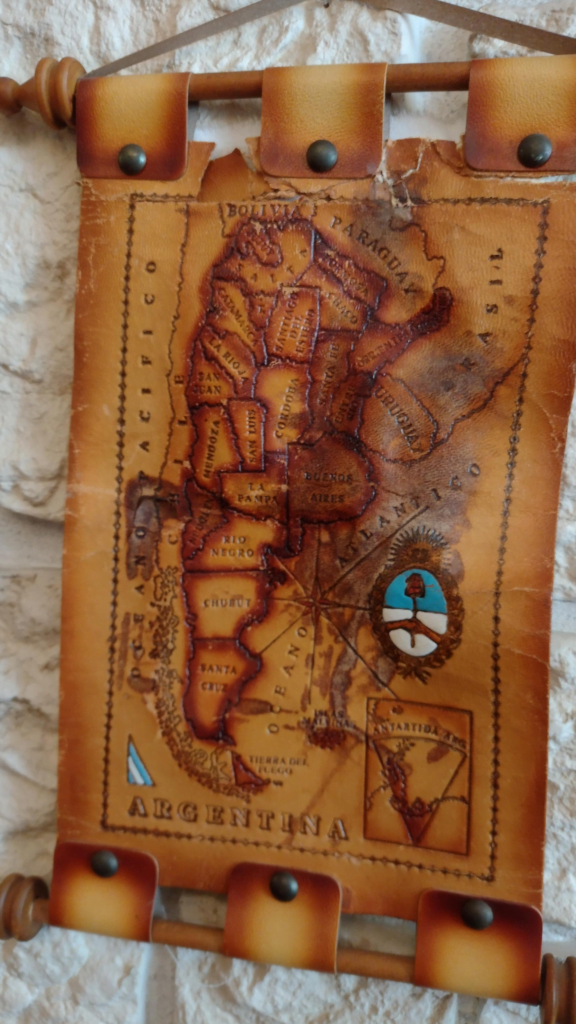
Jachym Cepicky spotted this leatgher map of Argentina in Cafe Dlask in Varnsdorf
MapsintheWild Argentina on Cow Hide
-
sur Sean Gillies: Black Squirrel volunteering
Publié: 7 September 2024, 1:18am CEST
Black Squirrel is the local trail half-marathon that I've finished five times since 2016. I registered to run it again this year, but had to scratch because of my Achilles tendonitis.
Instead, I'm going to volunteer at the event. I'll be among the first at Lory State Park, helping arriving runners park their cars and find the starting line. After that, I'm going to a trail intersection to keep first-time runners on course as they pour down the Howard Trail. It's going to be a beautiful late summer morning and I'm looking forward to being part of the event.
-
sur GeoSolutions: FREE Webinar: MapStore Major Release 2024.01 and Beyond
Publié: 6 September 2024, 2:46pm CEST
You must be logged into the site to view this content.
-
sur Mappery: River Thames coffee table
Publié: 6 September 2024, 2:00pm CEST

This rather fine coffee table, which used to belong to my father, depicts the River Thames all the way from source to mouth. The river has been carved into the table and then painted silver, with both ends then wrapping around the side of the table. I’m not sure who the original crafts-person was but its quite fun!
Happy birthday Mappery!
MapsintheWild River Thames coffee table
-
sur Mappery: Beer for our Birthday, Mr Wainwright?
Publié: 6 September 2024, 12:00pm CEST
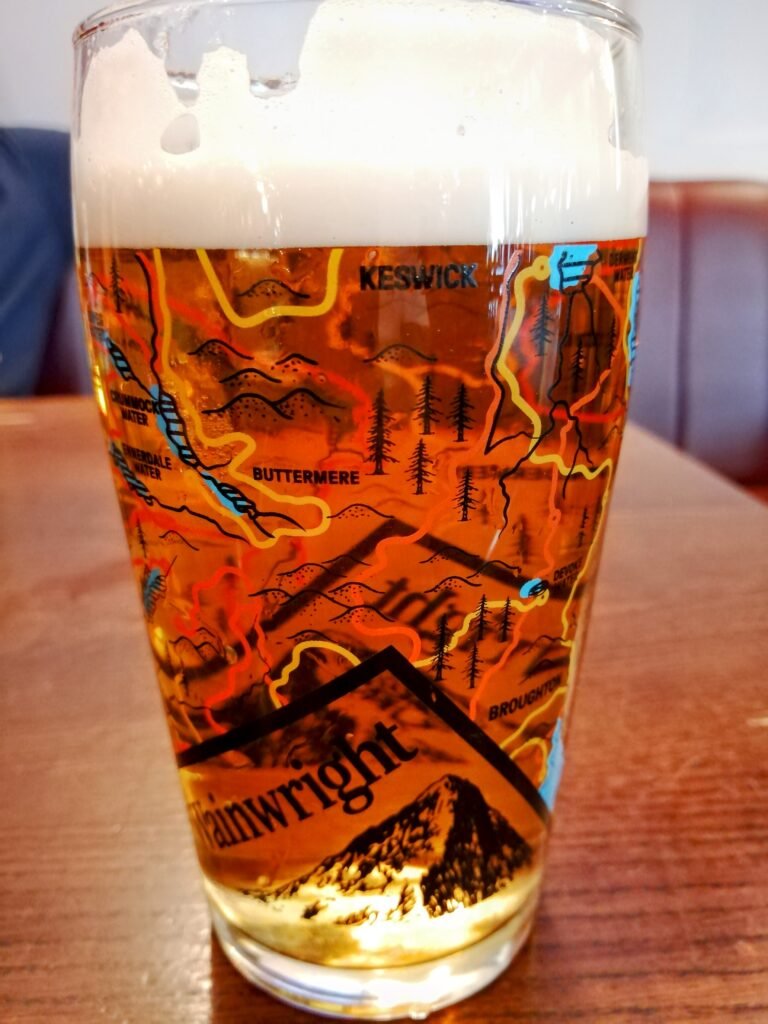
Regulars will know that we get a lot of maps in the wild which feature, wine, spirits or beer. I couldn’t resist this Wainwright beer glass (suitably filled) for the last of my birthday sequence.
Nick Hill sent this pic.
“Not sure if you’ve had this one before? I saw this map of the Lake District on my glass while enjoying a pint of Wainwright Gold in the Queen of Hearts pub in Daventry.
Cheers, Nick”
Well cheers to you Nick and to all of our MapsintheWild community, drink a toast to all of our contributors today if you can.MapsintheWild Beer for our Birthday, Mr Wainwright?
-
sur Mappery: Mappy Birthday!
Publié: 6 September 2024, 11:00am CEST
Happy Birthday to the incredible @mapsinthewild! ? Mappery has been a constant source of inspiration for my wanderlust adventures. I’m sharing a photo of a motorbike I spotted in Toulouse, France to celebrate this special day. The licence plate from Germany stands for a long journey. The vibrant city always brings back fond memories of my years there as a student: a nice combo to share.
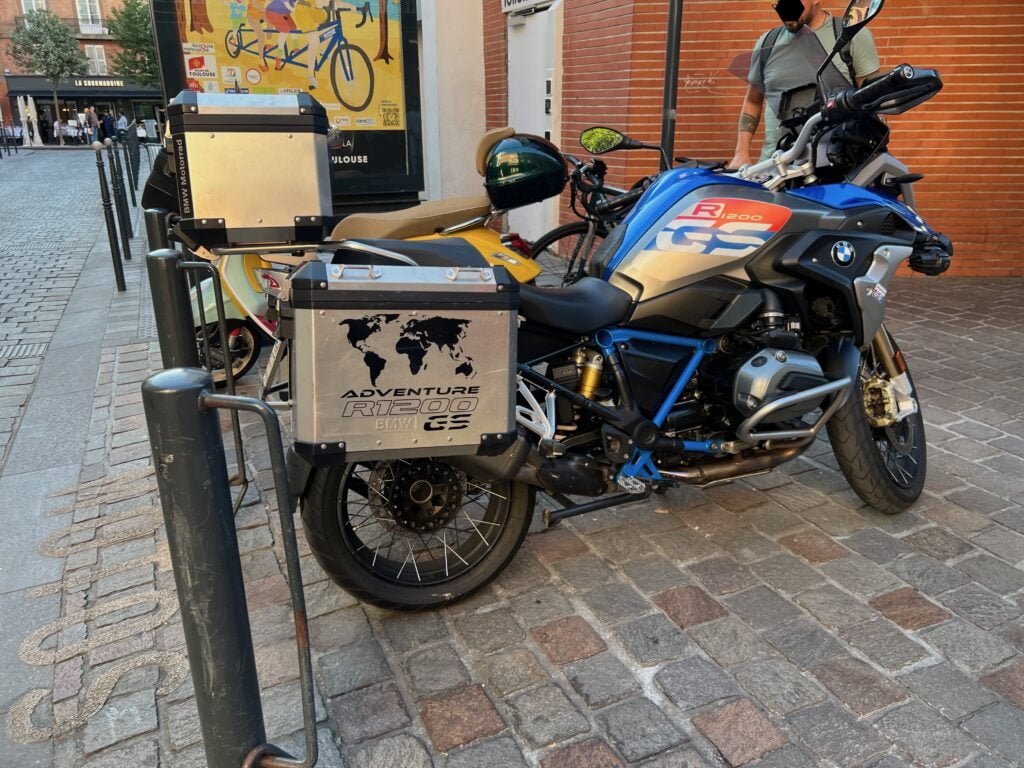
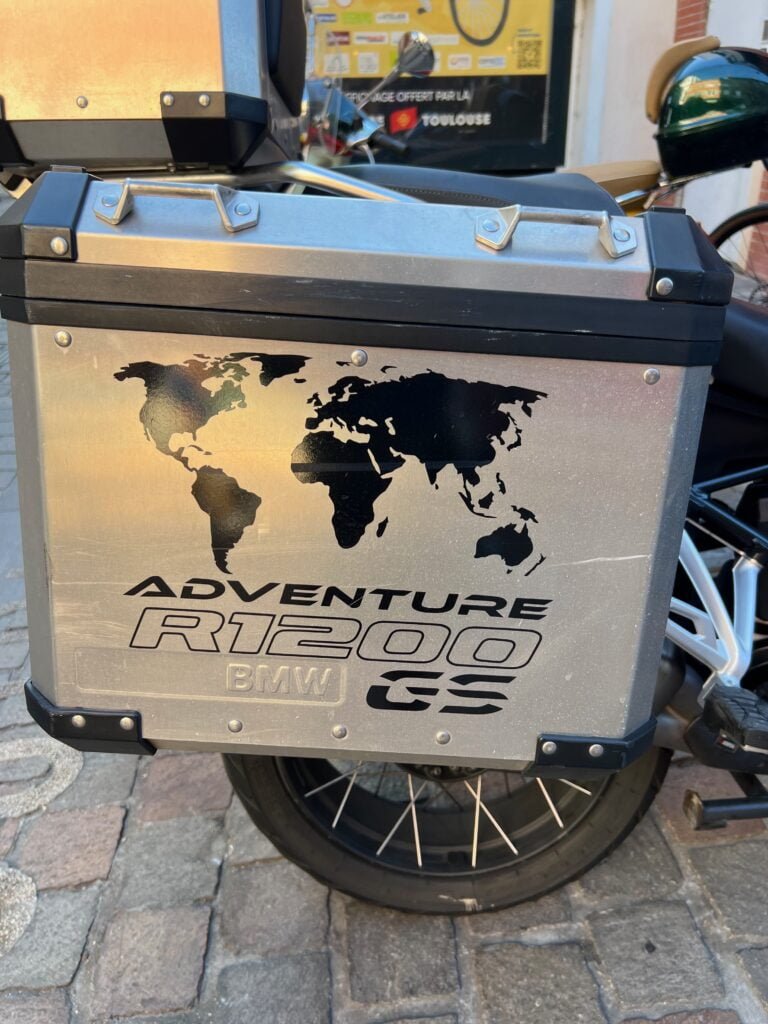
MapsintheWild Mappy Birthday!
-
sur Mappery: Mappy Birthday! – Meridian 17
Publié: 6 September 2024, 10:00am CEST
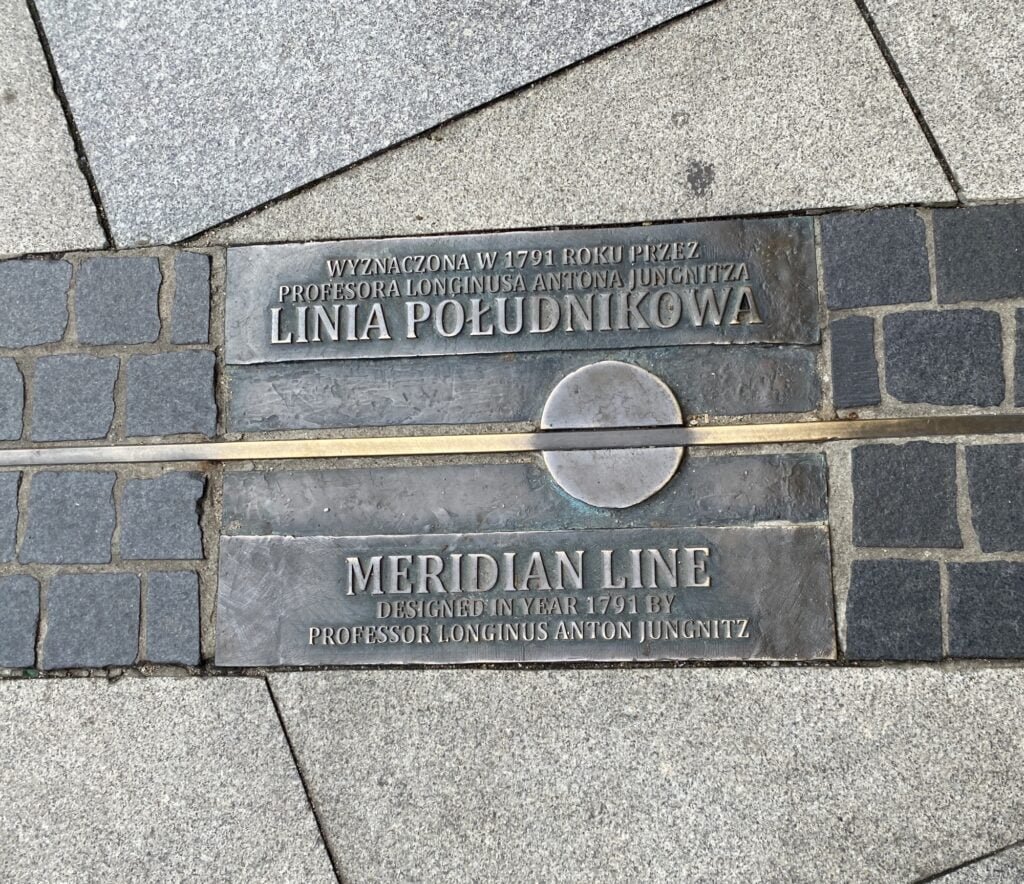
Today is Mappery’s 6th birthday.
Remarkable really that we have kept this up for 6 years, that’s just over 1600 posts with almost 2,500 images, 300 weekly email newsletters, thousands of social media follows (no longer X’ing) and a lot of support from our readers and contributors who have made #MapsintheWild into a community.
So thanks to Ken who helped me to start Mappery when we were on safari together, thanks to Arnaud and Dan who help to share the load and keep the site running and thanks to everyone who has contributed a MapintheWild.
Today’s birthday post is the 17th Meridian line. Why? Well unsurprisingly, for regular readers/followers, this pic came from Reinder Storm, in our six years Reinder has contributed over 180 of the posts that we have featured which is pretty remarkable. I know this isn’t an actual map but it testifies to the map geekiness and passion of our contributors and followers -THANK YOU REINDER
Reinder commented “… passes right through Wroc?aw, Poland. The meridian 17° east of Greenwich is a line of longitude that extends from the North Pole across the Arctic Ocean, Europe, Africa, the Atlantic Ocean, the Southern Ocean, and Antarctica to the South Pole”
We’ll be pushing the boat out with a few more birthday posts today.
MapsintheWild Mappy Birthday! – Meridian 17
-
sur 2024 Fall Foliage Map
Publié: 6 September 2024, 8:55am CEST par Keir Clarke
Autumn is nearly upon us. Although the Autumn Equinox is not until the 22rd September the 2024 Smoky Mountain Fall Foliage Map shows that the most northern counties of the United States will already have begun to notice the colors of the leaves changing.Every year Smoky Mountain releases an interactive Fall Foliage Map, which plots the annual progress of when and where leaves change their colors
-
sur Mappery: The City of New York has fallen over
Publié: 6 September 2024, 1:00am CEST
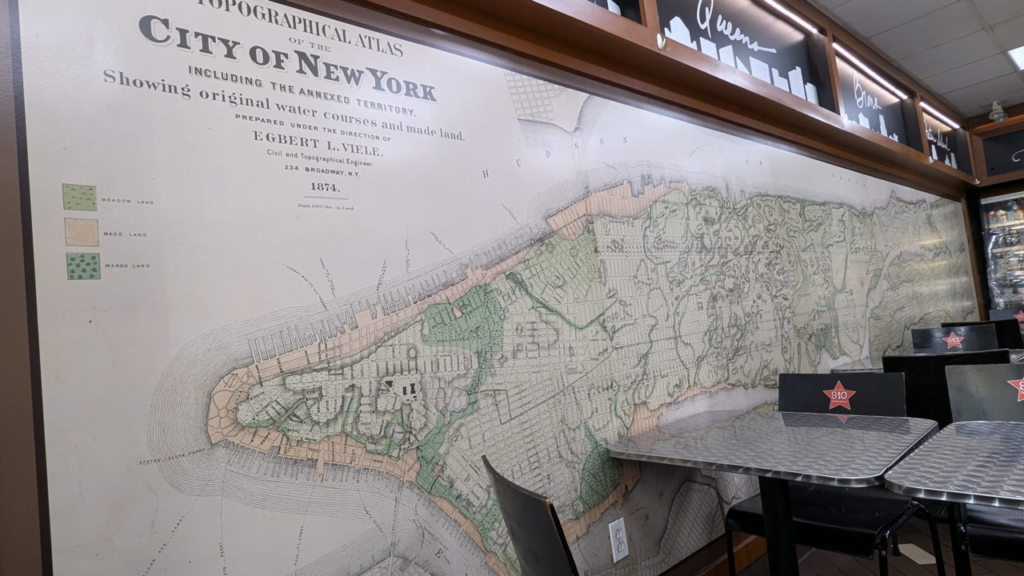
A bonus pic from Ken for our birthday.
Ken was in New York recently and he sent this map in the wild from a diner that he stopped at. To fit the map into the available space they rotated it to west up.
MapsintheWild The City of New York has fallen over
-
sur Fernando Quadro: Geotecnologia aplicada na Silvicultura
Publié: 5 September 2024, 2:00pm CEST
As conhecidas geotecnologias extrapolam os limites de sua ciência de desenvolvimento e aplicação. Dentre os vários setores produtivos nos quais ela é utilizada, a silvicultura é uma atividade que aproveita ao máximo o universo de soluções para diversos setores da gestão florestal. Tudo o que ela tem para oferecer pode ser aproveitado em benefício da gestão florestal. A geotecnologia se apresenta como uma ferramenta poderosa, oferecendo novas maneiras de se coletar dados, monitorar ecossistemas florestais e tomar decisões informadas. Atualmente é impossível imaginar que a gestão de uma floresta plantada possa ser realizada sem o uso desta potente ferramenta.
O drone, por exemplo, como ferramenta é um grande marco na geotecnologia. A possibilidade de municiar cada equipe de campo com um drone com uma câmera fotográfica embarcada elevou o nível da geotecnologia aplicada na silvicultura a um patamar nunca vivenciado. Claro que este avanço teve que superar questões como a dificuldade no processamento de tantas imagens capturadas, na identificação de indivíduos e na separação entre espécies através de técnicas de sensoriamento remoto. Dificuldades essas que se ampliaram com o surgimento de sensores LiDAR embarcados, que detalha o espaço com precisão milimétrica, sendo certo que a resolução dessas demandas abriu muitas possibilidades para o manejo silvicultural, especialmente para o inventário florestal.
Atualmente o estado da arte da geotecnologia aplicada na silvicultura está representada nos seguintes usos:
Big Data Geoespacial: A explosão de dados geoespaciais gerados por uma variedade de fontes, incluindo sensores remotos, dispositivos móveis e estações de monitoramento, está impulsionando o desenvolvimento de técnicas de análise de big data geoespacial. Isso inclui algoritmos de machine learning e inteligência artificial para análise de padrões espaciais, previsão e tomada de decisões. Internet das Coisas (IoT) Geoespacial: A integração de sensores geoespaciais em equipamentos de monitoramento cria um ambiente de IoT geoespacial. Isso permite a coleta contínua de dados em tempo real sobre o ambiente e árvores individuais aumentando a compreensão das interações floresta-ambiente. Geotecnologia para Inteligência Artificial: A geotecnologia está sendo integrada a algoritmos de inteligência artificial para uma variedade de aplicações, incluindo detecção de mudanças no uso da terra, identificação de espécies individuais e doenças a partir de imagens aéreas, previsão de eventos climáticos extremos, otimização de recursos operacionais, entre outras.Não há dúvidas que a geotecnologia tem enorme participação no aumento da produtividade florestal experimentada nos dias de hoje, seja na melhoria do manejo, na conservação hídrica e do solo, seja no aproveitamento de regiões antes consideradas inaptas para a silvicultura.
Fonte: webgis.tech
Instagram: [https:]]
LinkedIn: [https:]] -
sur Mappery: Global Delivery Bike (except New Zealand)
Publié: 5 September 2024, 11:00am CEST
Erik spotted this delivery bike in Delft. It looks as if half of New Zealand is missing.
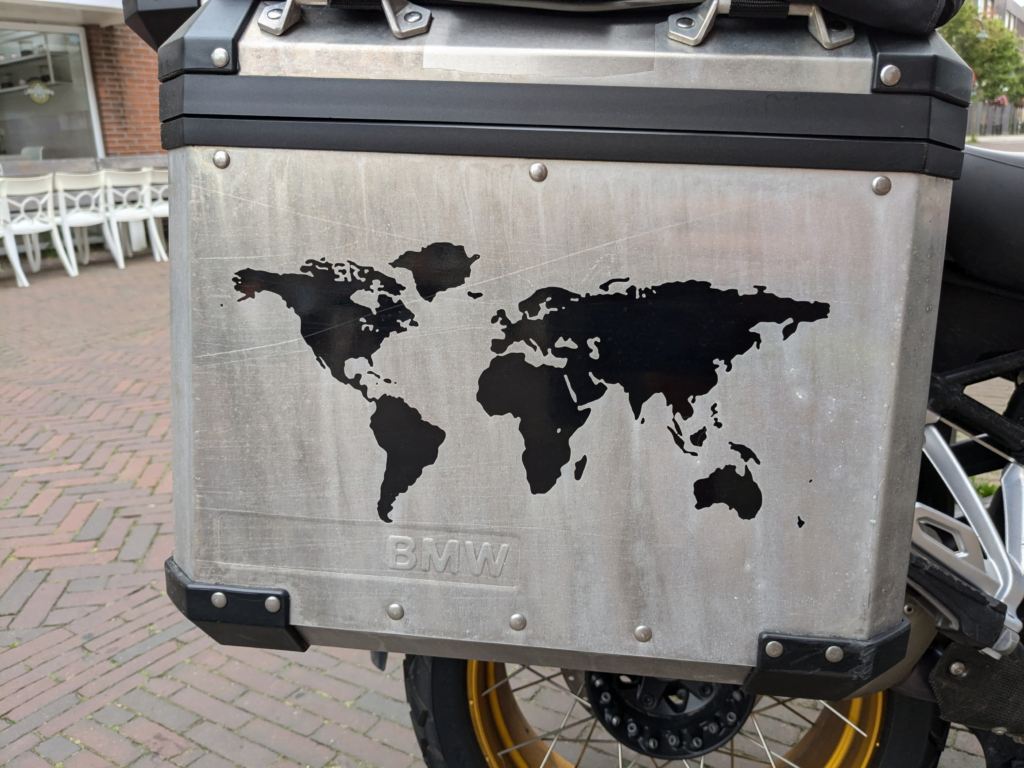
MapsintheWild Global Delivery Bike (except New Zealand)
-
sur The Book Banning Map of America
Publié: 5 September 2024, 9:16am CEST par Keir Clarke
The American Library Association (ALA) reports that attempts to ban books "surged 65% in 2023 compared to 2022 numbers, reaching the highest level ever documented by ALA." Nearly half of the books targeted for banning were related to issues of LGBTQ+ communities or race.Now the ALA has partnered with Little Free Library and PEN America to release an interactive map which shows
-
sur PostGIS Development: PostGIS 3.3.7
Publié: 5 September 2024, 2:00am CEST
The PostGIS Team is pleased to release PostGIS 3.4.7! This is a bug fix release.
3.3.7- source download md5
- NEWS
- PDF docs: en
-
sur W3C Maps for HTML Community Group: MapML.js release v0.14.0: CSS and Pmtiles
Publié: 4 September 2024, 11:38pm CEST
Scripting, Styling and Web Maps: Who’s On First? The Big ThreePart of the job of being a Web standard means that you have to follow the architecture of the web, which allocates specific jobs across the Big Three languages: HTML, CSS and JavaScript. For JavaScript, this ideally means supplying and enhancing site-specific semantics and user experience, and leaving accessibility and rendering up to the browser’s HTML infrastructure; for Cascading Style Sheets, it means supporting the HTML rendering engine through accessibility-enhancing styling instructions declared by the page according to the CSS language. For HTML, it means parsing the page and rendering HTML elements as accessible content, and providing a DOM API to allow access to the content by JavaScript manipulation to provide and enhance effective user experiences.

In the Maps for HTML universe, our goal is an update to Web standards that sees maps and location decomposed with accessibility as a precondition, into rendering, style and behaviour, and fit into the appropriate architectural domain, be that in HTML, CSS or JavaScript. There is no support today for maps or location in any of the Big Three languages. The consequence of this lack of platform support for web maps is their exclusive and massive allocation to the JavaScript domain. The societal implications of this misallocation are a subject for another post.
To date, we have articulated a mechanism to embed accessible and semantic web maps and locations into an HTML viewer widget, the <mapml-viewer> element. So far, the fit of this widget to the HTML media widget paradigm seems appropriate. For a refresher on how the viewer works, check out our Quick Start video.
The question that bears additional scrutiny and community involvement, and that which is the question of this post is: How can we better leverage CSS for styles of maps and location, while enhancing accessibility? Opaque (binary) media types HTML media like video and audio don’t have much relationship with CSS, whereas map rendering has a natural connection to text and graphics styling. It’s the natural connection of maps to web architecture that makes maps and location a good candidate for a web standard.
What You Can Do With CSS in MapML Today – Support by GeoServerThe main use of CSS in MapML is to style the tree of elements rooted at the <map-feature>. The <map-feature> element is a custom element that can be obtained in a fetched MapML-format XHTML document, or found inline in HTML proper, between the <layer-> … </layer-> layer tags. <map-feature> elements are parsed and their <map-geometry> elements rendered as a shadow-DOM embedded SVG <g> tag (group element), with different geometry values rendered within that group as <path>s within the parent <g>. Any class attributes on the <map-feature> are copied to the root <path> element, and class attributes on descendent geometry elements are copied to the <path> that they are rendered as. This allows us to apply CSS rules to <map-feature> as though its parts were actual SVG tags, so long as the rendered feature parts can be selected via their class, which is copied from the source <map-whatever> element. This can even be useful for making accessible interactive maps.
This technique is used by GeoServer for example, which transforms Style Layer Descriptor server styles into CSS stylesheets with selectors for generated class values from the server layers’ contents. In addition to allowing basic styling of points, lines and polygons, this facility enables GeoServer to dynamically generate and style MapML-encoded vector tiles. The perceived performance of tiled vector maps can be acceptable, especially when such tiles are created and cached for later access, and improvements can be expected with additional specification and software development effort. This is all pretty interesting because it is starting to show us a path to (better) integration between the native web platform languages like HTML and CSS on the one hand, and maps on the other.
Mapbox Vector Tiles and the pmtiles Archive Format“pmtiles” is the name of a modern, cloud-friendly map tile archive format that is gaining popularity among web mapping applications, because it allows websites to readily serve their own map vector tile data without necessarily hosting the whole world, which is cost- and time-prohibitive. The motivation behind pmtiles (a product of the Protomaps project) would seem to be compatible with our community’s goal of standardising maps for the web. In the words of its creator Brandon Liu, :
Maps are everywhere on the Internet. Think of any popular retail site, travel search or local government portal. The infrastructure of the web, from languages like JavaScript, front-end frameworks, and databases, is overwhelmingly free software. Maps are one of the few remaining choke points* of an otherwise open web.
* choke points aka control points
pmtiles efficiently manages potentially massive amounts of tiled vector data in a single archive file. The archive can be hosted in a variety of server environments, but the main criteria for success is that the host server is capable of http range requests. When a client needs a particular tile, it makes the request not using the zoom, row and column coordinates as URL parameters or path steps, but by transforming the tile’s coordinates to a pmtiles archive byte range, using the tile’s byte offset and length, calculated from the archive’s metadata which contains, among other information, the formula to perform the transformation.
Under the hood, a .pmtiles archive file is a clever application of Hilbert space filling curves to efficiently compress tiles in the Web Mercator projection, encoded in the Mapbox Vector Tiles or other format (mvt). Mvt is a kind of de facto standard among vector tile formats, of which there are many, too numerous to mention. The protomaps-leaflet library integrates support for both .pmtiles archives as well as raw .mvt tile responses served through a web server API, following the {z}/{x}/{y} URL (template) convention. Protomaps-leaflet styling of tiles is accomplished via “themes”, or “rules”. Rules encode canvas 2D API call parameters on a per-tile, per-layer basis, such that map feature styles are encoded as JavaScript objects and methods that are called back by the protomaps-leaflet tile rendering engine. A theme is a named collection of rules, e.g. “light” or “dark”.
The newly-renamed MapML.js release 0.14.0 supports pmtiles archives and .mvt format API services, including custom map styling, via a protomaps-leaflet integration, mainly through the templated <map-link> element. Projection support is currently limited to OSMTILE maps, because of the (hopefully short-term) restriction of protomaps-leaflet to the Web Mercator projection and powers of 2 tile pyramids. Custom styles can be created and included as a “stylesheet” module by means of an exported symbol named “pmtilesStyles”, containing a defined and required JavaScript object structure.
If you’re using GeoServer, or pmtiles / mvt support in MapML.js, or any open source component from our community in your maps, please get in touch, we’d love to hear from you about your experience.
Call For CommunityA large measure of the payoff for the effort of building maps into HTML will be simple and decentralised access (i.e. no “choke points”) to the incredible rendering performance afforded by native code styling through CSS. What wouldn’t be possible in such a world? Accessible location navigation, animations, moving features, real time location updates, oh my! Worth mentioning: the CSS development community often sets an example of dynamic, open collaboration definitely worthy of emulating, if not wholly joining forces with.
In summary, let’s take the “special” out of spatial, and collectively imagine, design and implement a HTML+CSS engine capable of fully expressing and executing cartographic rules, for the future.

-
sur OGC Membership approves Common Query Language (CQL2) as an official OGC Standard
Publié: 4 September 2024, 3:00pm CEST par Simon Chester
The Open Geospatial Consortium (OGC) is excited to announce that the OGC Membership has approved Version 1.0 of the Common Query Language (CQL2) for adoption as an official OGC Standard.
Filtering is a fundamental operation performed on feature data to obtain a subset that contains the geospatial information a user needs. CQL2 is a filter grammar that can be used to specify how features can be filtered to obtain a subset. The Standard supports both text and JSON encodings so can be easily integrated into a variety of software applications.
CQL2 is a revision of the original Common Query Language. While the language design is consistent with the original version, many changes and additions to improve consistency and capabilities have been made. Existing implementations of CQL will need to be updated to process filter expressions specified by CQL2.
The OGC API – Features Standard currently uses CQL2, and other Standards that require the ability to filter data are likely to adopt it as well. Example files and JSON, YAML, and BNF schemas have been published on the OGC schemas repository to enable software developers to rapidly implement CQL2.
The original Common Query Language (CQL) was created as a text encoding for use in the OGC Catalogue Service Implementation Specification. CQL is based on the capabilities in the OGC Filter Encoding (FE) Standard, which was originally part of the Web Feature Service (WFS) Standard.
CQL2 is the outcome of the work and dedication of the OGC API – Features Standards Working Group, which led the development of the Standard, including:
- Editors:
- Panagiotis (Peter) A. Vretanos, CubeWerx Inc.
- Clemens Portele, interactive instruments GmbH
- Submitters:
- Andrea Aime, GeoSolutions di Giannecchini Simone & C. s.a.s.
- Jeff Harrison, US Army Geospatial Center (AGC)
- Jérôme Jacovella-St-Louis, Ecere Corporation
As with any OGC Standard, CQL2 is free to download and implement. Interested parties can learn more on the OGC CQL2 Standard webpage.
The post OGC Membership approves Common Query Language (CQL2) as an official OGC Standard appeared first on Open Geospatial Consortium.
- Editors:
-
sur Fernando Quadro: Porque usar o Geography no PostGIS?
Publié: 4 September 2024, 2:00pm CEST
Você sabia que ao trabalhar com grandes volumes de dados no PostGIS pode te levar a medições imprecisas?
É verdade. Quando você armazena seus dados geoespaciais como Geometry, o PostGIS trata esses dados como um plano 2D, como se a Terra fosse uma “panqueca”.
Mas não se preocupe, existe solução para isso. Você pode armazenar seus dados com o tipo Geography no PostGIS ao invés de Geometry.
Isso irá dizer ao PostGIS para usar um sistema de coordenadas “arredondas”, proporcionando medições muito mais precisas.
Nesses casos o tipo Geography é a melhor opção, e traz como benefícios:
Dados armazenados em WGS84 (latitude/longitude) com medidas em metros
Funções nativas especiais feitas apenas para este tipo de dados
Perfeito para lidar com grandes regiõesSe você tem já sua base de dados armazenada em Geometry, não se preocupe, você pode transformar seus dados em tempo de execução para Geography e obter resultados mais precisos em suas medições.
Fonte: webgis.tech
Instagram: [https:]]
LinkedIn: [https:]] -
sur WhereGroup: Plugins – praktische Helfer in QGIS
Publié: 4 September 2024, 11:07am CEST
Dieses Mal stellen wir Ihnen eine Auswahl von fünf nützlichen Plugins aus den über 2.000 Plugins für QGIS, die Ihnen bei Ihrer täglichen Arbeit weiterhelfen. -
sur Mappery: Surficial geology of Maine
Publié: 4 September 2024, 11:00am CEST
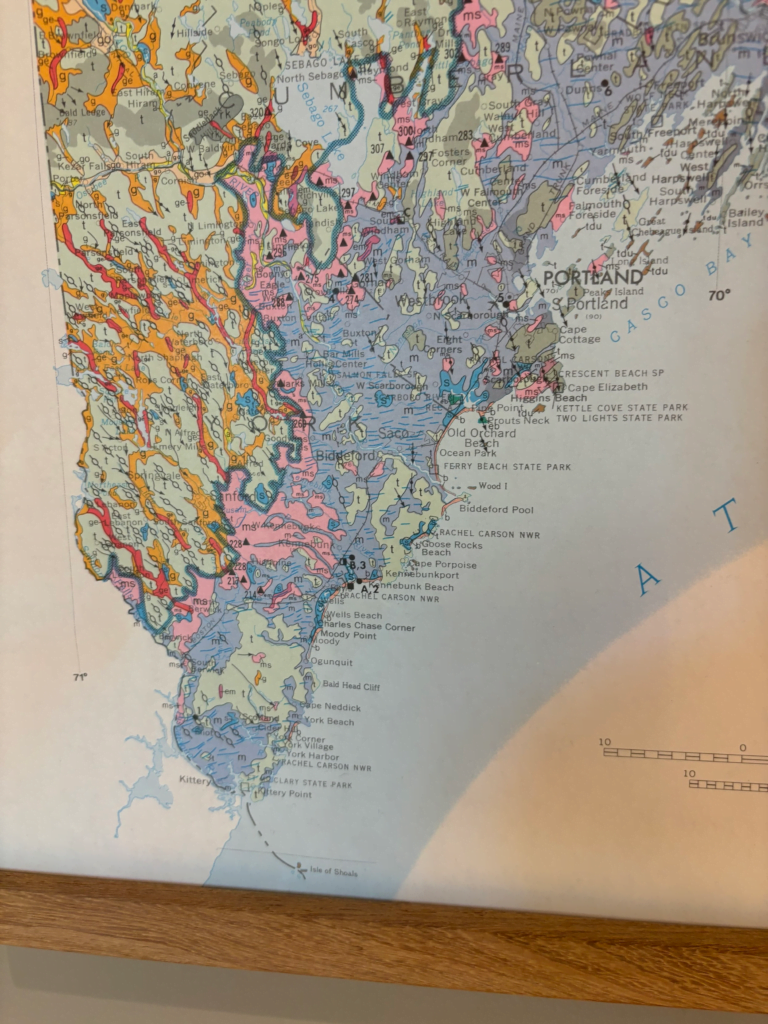
Doug shared this – Surficial geology of Maine #MapsintheWild @ Watershed Art Center Newcastle, Maine
If like me you thought Surficial Geology was a typo, read and learn
MapsintheWild Surficial geology of Maine
-
sur Write Your Name in Landsat
Publié: 4 September 2024, 8:20am CEST par Keir Clarke
the word 'love' in Landsat images Soon after the emergence of Google Maps, a short while after getting bored zooming in on their house in satellite view, some people began searching for satellite images of Earth forms and patterns which resembled letters of the alphabet - when viewed from above.The first pareidolia sufferer that I can remember becoming hooked on discovering typefaces in nature
-
sur PostGIS Development: PostGIS 3.4.3
Publié: 4 September 2024, 2:00am CEST
-
sur Oslandia: (Fr) Variabilisez vos profils QGIS avec QDT
Publié: 3 September 2024, 6:42pm CEST
Sorry, this entry is only available in French.
-
sur Fernando Quadro: Inteligência Artificial, GIS e Smart Cities
Publié: 3 September 2024, 2:00pm CEST
As cidades inteligentes representam o futuro da vida urbana, integrando tecnologia e soluções baseadas em dados para aumentar a eficiência, a sustentabilidade e a qualidade de vida dos residentes. No centro do desenvolvimento das cidades inteligentes está o papel da inteligência artificial (IA) nos Sistemas de Informação Geográfica (GIS), revolucionando a forma como as cidades planejam, otimizam e gerem infraestruturas críticas, como redes de transporte, serviços públicos e serviços públicos.
Nesta postagem falaremos um pouco sobre o papel multifacetado da IA ??no GIS para o planejamento de infraestrutura de cidades inteligentes, com foco em suas implicações e benefícios para o desenvolvimento urbano.
O planeamento de infraestruturas de cidades inteligentes abrange uma vasta gama de elementos, desde sistemas de transporte inteligentes e serviços públicos energeticamente eficientes até serviços públicos responsivos e desenvolvimento urbano sustentável. O GIS alimentado por IA desempenha um papel fundamental neste processo, aproveitando dados espaciais, análises preditivas e monitoramento em tempo real para otimizar o projeto, operação e manutenção de infraestrutura para cidades inteligentes e resilientes.
Aplicações de IA no planejamento de infraestrutura de cidades inteligentes: Otimização de Transporte
Gestão de Utilidades e Eficiência Energética
Prestação de serviço público
Monitoramento Ambiental e Sustentabilidade Benefícios da IA ??no planejamento de infraestrutura de cidades inteligentes: Maior eficiência e otimização de recursos
Tomada de decisão baseada em dados
Melhor experiência do cidadão e qualidade de vida
Desenvolvimento Sustentável e ResiliênciaEmbora a IA traga benefícios significativos para o planeamento de infraestruturas de cidades inteligentes, desafios como a privacidade de dados, a segurança cibernética, a parcialidade dos algoritmos, a conformidade regulamentar e a equidade digital precisam de ser abordados. Isto requer quadros de governação robustos, envolvimento das partes interessadas, práticas éticas de IA e estratégias de planeamento urbano inclusivas para o desenvolvimento equitativo e sustentável de cidades inteligentes.
Concluindo, o SIG alimentado por IA está a transformar o cenário do planeamento de infraestruturas de cidades inteligentes, oferecendo oportunidades sem precedentes de eficiência, sustentabilidade e inovação no desenvolvimento urbano. Ao aproveitar as capacidades da IA, as cidades podem otimizar a infraestrutura, melhorar a prestação de serviços e criar ambientes urbanos mais habitáveis ??e resilientes para as gerações vindouras. Adotar a IA no planejamento de cidades inteligentes não se trata apenas de avanço tecnológico – trata-se de construir cidades mais inteligentes, mais conectadas e sustentáveis ??que beneficiem a todos.
Fonte: webgis.tech
Instagram: [https:]]
LinkedIn: [https:]]
-
sur Mapping Moving Borders in Real-Time
Publié: 3 September 2024, 11:56am CEST par Keir Clarke
The international border between Italy and Switzerland & Austria in the Alps largely follows the path of the watershed line. Unfortunately due to global heating and shrinking glaciers the Alpine watershed line keeps on moving. The result is that the border between Italy and its Alpine neighbors is also constantly moving.In 2016 the Italian Limes project attempted to track the movement of the
-
sur Mappery: Pijnacker-Nootdorp
Publié: 3 September 2024, 11:00am CEST
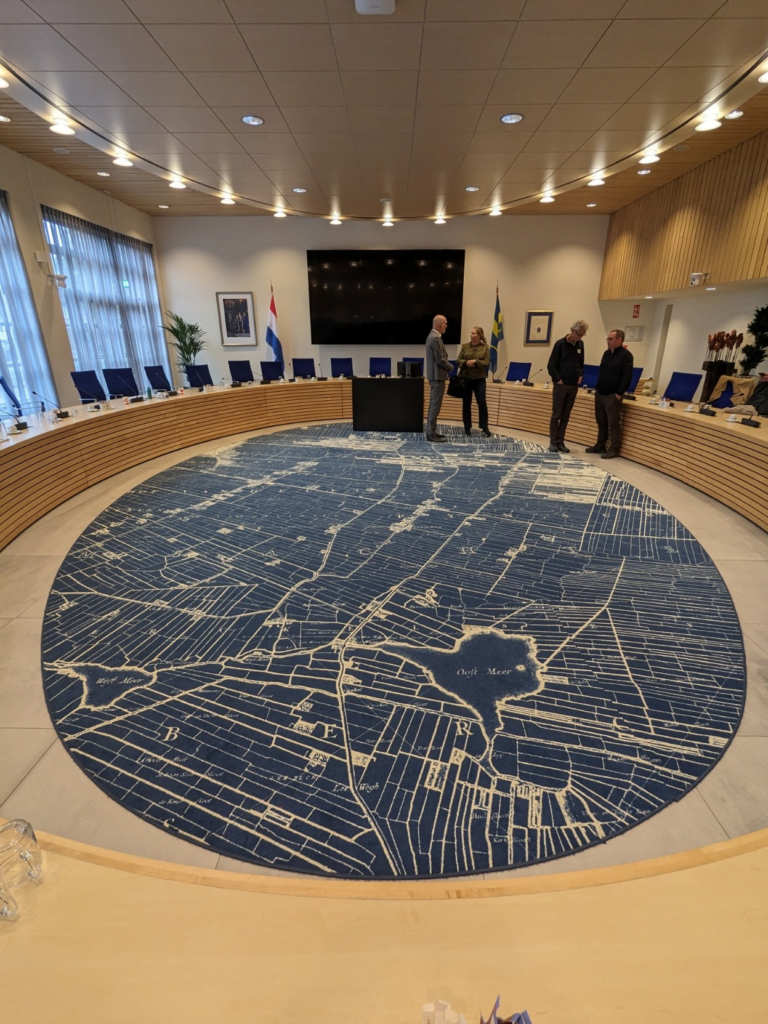
Eric said “Today I visited the municipality of Pijnacker-Nootdorp. There’s a beautiful #mapsinthewild carpet in the Council Chamber (with even half of Delft on it)”
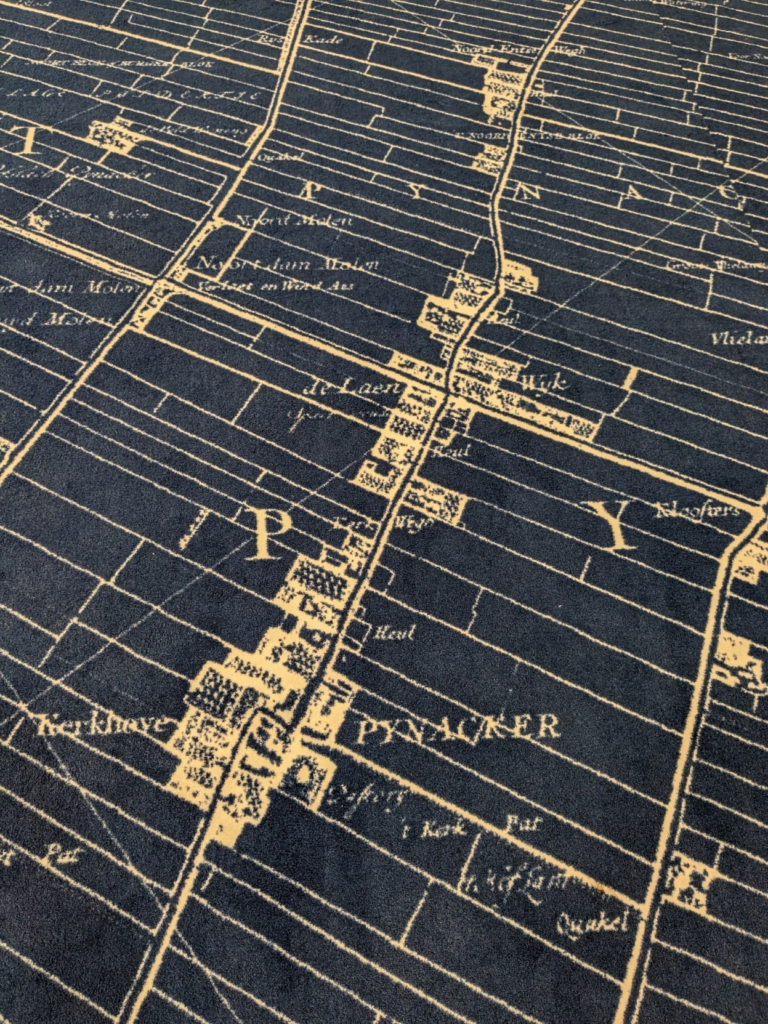
MapsintheWild Pijnacker-Nootdorp
-
sur Sean Gillies: August 22, 2018: Paris in a Day
Publié: 3 September 2024, 1:16am CEST
Six years ago my family and I spent some time in France, passing through Lyon and Paris on the way back to Colorado. While Ruth stayed behind at a conference in Montpellier, Arabelle, Bea, and I did Paris in a day. We saw many bones, ate much gelato, hiked many stairs, rode many trains and buses, and enjoyed being together, seeing new places, and using our second language in one of the world's capitals. I cherish my memories of this day. I felt like I was killing the fun Francophile dad role and thoroughly enjoyed the company of my kids. I had a memorable time. We confirmed in June that Arabelle and Bea have strong, positive memories, as well.
I went to Instagram for the first time in years to dig up a photo taken on that day that I haven't published on my blog before.

A child in a blue top making a peace sign in front of the Eiffel Tower and waxing moon.
We didn't go back to the Trocadero in June, assuming that it was closed for Olympics construction, but we did go back to Montmartre and Sacre Coeur. Both Arabelle and Bea have been cultivating Spanish as a third language since 2018 and had a chance to use it on our recent visit. We encountered a Spanish kid of Bea's age who had been separated from her parents and kept her company until we could reach her mom on the phone. She had no phone of her own, but had memorized key numbers.
-
sur Fernando Quadro: PostGIS e a Inteligência Artificial
Publié: 2 September 2024, 10:13pm CEST
No atual cenário empresarial acelerado, aproveitar os dados de localização pode proporcionar uma vantagem competitiva significativa. Desde a otimização da logística e das rotas de entrega até à melhoria das experiências dos clientes através de serviços baseados em localização, a capacidade de extrair informações valiosas de dados geográficos é fundamental.
Como você já deve saber o PostGIS é uma extensão de código aberto amplamente utilizada que adiciona suporte para objetos geográficos, permitindo que consultas SQL espaciais sejam executadas dentro do sistema de gerenciamento de banco de dados PostgreSQL. O Postgres-AI, por outro lado, é uma extensão introduzida recentemente que traz recursos de aprendizado de máquina (ML) diretamente para o PostgreSQL, permitindo treinamento e inferência de modelos no banco de dados.
A integração do PostGIS e do Postgres-AI abre inúmeras possibilidades para inteligência de localização e análise de dados espaciais, incluindo:
Seleção de sites de varejo e análise de mercado
Logística e otimização da cadeia de suprimentos
Modelagem preditiva para serviços baseados em localização
Planejamento urbano e desenvolvimento de infraestrutura
Monitoramento ambiental e esforços de conservação
Marketing direcionado e segmentação de clientesAo aproveitar essas ferramentas poderosas, as organizações podem tomar decisões baseadas em dados, otimizar operações e aprimorar sua compreensão de padrões e relacionamentos geográficos, ao mesmo tempo em que aproveitam o poder do aprendizado de máquina.
Fonte: webgis.tech
Instagram: [https:]]
LinkedIn: [https:]] -
sur Mappery: Around the Globe
Publié: 2 September 2024, 11:00am CEST

From Reinder “… the title means something like ‘Around the globe’. Needs no further explanation I presume” – nope!
MapsintheWild Around the Globe
-
sur Land doesn't vote, people do!
Publié: 2 September 2024, 10:05am CEST par Keir Clarke
Engaging Data has updated its US County Electoral Map – Land Area vs Population map so that you can now zoom in and explore the election results in each state. The map allows you to see the 2020 Presidential Election election results at the county level based on land area or population size.If you select the 'Population' button on the map then the colored proportional circles change size to
-
sur TorchGeo: v0.6.0
Publié: 1 September 2024, 12:12pm CEST
TorchGeo 0.6.0 Release NotesTorchGeo 0.6 adds 18 new datasets, 15 new datamodules, and 27 new pre-trained models, encompassing 11 months of hard work by 23 contributors from around the world.
Highlights of this release Multimodal foundation models
There are thousands of Earth observation satellites orbiting the Earth at any given time. Historically, in order to use one of these satellites in a deep learning pipeline, you would first need to collect millions of manually-labeled images from this sensor in order to train a model. Self-supervised learning enabled label-free pre-training, but still required millions of diverse sensor-specific images, making it difficult to use newly launched or expensive commercial satellites.
TorchGeo 0.6 adds multiple new multimodal foundation models capable of being used with imagery from any satellite/sensor, even ones the model was not explicitly trained on. While GASSL and Scale-MAE only support RGB images, DOFA supports RGB, SAR, MSI, and HSI with any number of spectral bands. It uses a novel wavelength-based encoder to map the spectral wavelength of each band to a known range of wavelengths seen during training.
The following table describes the dynamic spatial (resolution), temporal (time span), and/or spectral (wavelength) support, either via their training data (implicit) or via their model architecture (explicit), offered by each of these models:
Model Spatial Temporal Spectral DOFA implicit - explicit GASSL implicit - - Scale-MAE explicit - - TorchGeo 0.6 also adds multiple new unimodal foundation models, including DeCUR and SatlasPretrain.
Source Cooperative migration
TorchGeo contains a number of datasets from the recently defunct Radiant MLHub:
- AgriFieldNet Competition Dataset
- Smallholder Cashew Plantations in Benin
- Sentinel-2 Cloud Cover Segmentation Dataset
- CV4A Kenya Crop Type Competition
- Tropical Cyclone Wind Estimation Competition
- Marine Debris Dataset for Object Detection in Planetscope Imagery
- Rwanda Field Boundary Competition Dataset
- South Africa Crop Type Competition
- SpaceNet Datasets
- Western USA Live Fuel Moisture
These datasets were recently migrated to Source Cooperative (and AWS in the case of SpaceNet), but with a completely different file format and directory structure. It took a lot of effort, but we have finally ported all of these datasets to the new download location and file hierarchy. As an added bonus, the new data loader code is significantly simpler, allowing us to remove 2.5K lines of code in the process!
OSGeo community project
TorchGeo is now officially a member of the OSGeo community! OSGeo is a not-for-profit foundation for open source geospatial software, providing financial, organizational, and legal support. We are in good company, with other OSGeo projects including GDAL, PROJ, GEOS, QGIS, and PostGIS. Membership in OSGeo promotes advertising of TorchGeo to the community, and also ensures that we follow best practices for the stability, health, and interoperability of the open source geospatial ecosystem.
All TorchGeo users are encouraged to join us on Slack, join our Hugging Face organization, and join us in OSGeo using any of the following badges in our README:
Lightning Studios support

TorchGeo has always had a close collaboration with Lightning AI, including active contributions to PyTorch Lightning and TorchMetrics. In this release, we added buttons allowing users to launch our tutorial notebooks in the new Lightning Studios platform. Lightning Studios is a more powerful version of Google Colab, with reproducible software and data environments allowing you to pick up where you left off, VS Code and terminal support, and the ability to quickly scale up to a large number of GPUs. All TorchGeo tutorials have been confirmed to work in both Lightning Studios and Google Colab, allowing users to get started with TorchGeo without having to invest in their own hardware.
Backwards-incompatible changes- All Radiant MLHub datasets have been ported to the Source Cooperative file hierarchy (#1830)
- GeoDataset: the bbox sample key was renamed to bounds in order to support Kornia (#2199)
- Chesapeake7 and Chesapeake13: datasets were removed when updating to the 2022 edition (#2214)
- Benin Cashews and Rwanda Field Boundary: remove
os.path.expanduserfor consistency (#1705) - LEVIR-CD and OSCD:
imageskey was split intoimage1andimage2for change detection (#1684, #1696) - EuroSAT:
B08Awas renamed toB8Ato match Sentinel-2 (#1646)
- aws-cli: to download datasets from AWS (#2203)
- azcopy: to download datasets from Azure (#2064)
- prettier: for YAML file formatting (#2018)
- ruff: for code style and documentation testing (#1994)
- radiant-mlhub: website no longer exists (#1830)
- rarfile: datasets rehosted as zip files (#2210)
- zipfile-deflate: no longer needed for newer Chesapeake data (#2214)
- black: replaced by ruff (#1994)
- flake8: replaced by ruff (#1994)
- isort: replaced by ruff (#1994)
- pydocstyle: replaced by ruff (#1994)
- pyupgrade: replaced by ruff (#1994)
- python: 3.10+ required following SPEC 0 (#1966)
- fiona: 1.8.21+ required (#1966)
- kornia: 0.7.3+ required (#1979, #2144)
- lightly: 1.4.5+ required (#2196)
- lightning: 2.3 not supported due to bug (#2155, #2211)
- matplotlib: 3.5+ required (#1966)
- numpy: 1.21.2+ required (#1966), numpy 2 support added (#2151)
- pandas: 1.3.3+ required (#1966)
- pillow: 3.3+ required (#1966), jpeg2000 support required (#2209)
- pyproj: 3.3+ required (#1966)
- rasterio: 1.3+ required (#1966)
- shapely: 1.8+ required (#1966)
- torch: 1.13+ required (#1358)
- torchvision: 0.14+ required (#1358)
- h5py: 3.6+ required (#1966)
- opencv: 4.5.4+ required (#1966)
- pycocotools: 2.0.7+ required (#1966)
- scikit-image: 0.19+ required (#1966)
- scipy: 1.7.2+ required (#1966)
- AgriFieldNet (#1873)
- CaBuAr (#2235)
- ChaBuD (#1259)
- Digital Typhoon (#1748)
- EuroSAT Spatial (#2074)
- GeoNRW (#2209)
- I/O Bench (#1972)
- LEVIR-CD (#1770)
- LEVIR-CD+ (#1707)
- QuakeSet (#1997)
- Sentinel-2 + CDL (#1889)
- Sentinel-2 + EuroCrops (#1869)
- Sentinel-2 + NCCM (#1950)
- Sentinel-2 + South America Soybean (#1959)
- South Africa Crop Type (#1970)
- VHR-10 (#1082)
- Remove torchgeo.datamodules.utils.dataset_split (#2005)
- EuroSAT: make sure normalization is actually applied (#2176)
- Fix plotting in datamodules when dataset is a subset (#2003)
- AgriFieldNet (#1459)
- Airphen (#1803)
- CaBuAr (#2235)
- ChaBuD (#1259)
- CropHarvest (#1677)
- Digital Typhoon (#1748)
- EuroCrops (#1813)
- EuroSAT Spatial (#2074)
- GeoNRW (#2209)
- I/O Bench (#1972)
- LEVIR-CD (#1770)
- Northeast China Crop Map (#1666)
- PRISMA (#1743)
- QuakeSet (#1997)
- SkyScript (#2253)
- South Africa Crop Type (#1840)
- South America Soybean (#1668)
- SpaceNet 8 (#2203)
- Benin Cashews: migrate to Source Cooperative (#2116)
- Benin Cashews: remove
os.path.expanduserfor consistency (#1705) - BigEarthNet: fix broken download link (#2174)
- CDL: add 2023 checksum (#1844)
- Chesapeake: update to 2022 edition (#2214)
- ChesapeakeCVPR: reuse NLCD colormap (#1690)
- Cloud Cover: migrate to Source Cooperative (#2117)
- CV4A Kenya Crop Type: migrate to Source Cooperative (#2090)
- EuroSAT: rename
B08AtoB8Ato match Sentinel-2 (#1646) - FireRisk: redistribute on Hugging Face (#2000)
- GlobBiomass: add min/max timestamp (#2086)
- GlobBiomass: use float32 for pixelwise regression mask (#2086)
- GlobBiomass: fix length of dataset (#2086)
- L7 Irish: convert to IntersectionDataset (#2034)
- L8 Biome: convert to IntersectionDataset (#2058)
- LEVIR-CD+: split
imageintoimage1andimage2for change detection (#1696) - NASA Marine Debris: migrate to Source Cooperative (#2206)
- OSCD: support fine-grained band selection (#1684)
- OSCD: split
imageintoimage1andimage2for change detection (#1696) - PatternNet: redistribute on Hugging Face (#2100)
- RESISC45: redistribute on Hugging Face (#2210)
- Rwanda Field Boundary: don't plot empty masks during testing (#2254)
- Rwanda Field Boundary: migrate to Source Cooperative (#2118)
- Rwanda Field Boundary: remove
os.path.expanduserfor consistency (#1705) - SpaceNet 1–7: migrate to Source Cooperative (#2203)
- Tropical Cyclone: migrate to Source Cooperative (#2068)
- VHR-10: redistribute on Hugging Face (#2210)
- VHR-10: improved plotting (#2092)
- Wester USA Live Fuel Moisture: migrate to Source Cooperative (#2206)
- Add support for
pathlib.Pathto all datasets (#2173) - Datasets can now use command-line utilities to download (#2064)
- GeoDataset:
bboxkey was renamed tobounds(#2199) - GeoDataset: ignore other bands for separate files (#2222)
- GeoDataset: don't warn about missing files for downloadable datasets (#2033)
- RasterDataset: allow subclasses to specify which resampling algorithm to use (#2015)
- RasterDataset: use nearest neighbors for int and bilinear for float by default (#2015)
- RasterDataset: calculate resolution after changing CRS (#2193)
- RasterDataset: support date_str containing % character (#2233)
- RasterDataset: users can now specify the min/max time of a dataset (#2086)
- VectorDataset: add
dtypeattribute to match RasterDataset (#1869) - VectorDataset: extract timestamp from filename to match RasterDataset (#1814)
- IntersectionDataset: ignore 0 area overlap (#1985)
- DatasetNotFoundError: when a dataset has not yet been downloaded (#1714, #2053)
- DependencyNotFoundError: when an optional dependency is not installed (#2054)
- RGBBandsMIssingError: when you try to plot a dataset but don't use RGB bands (#1737, #2053)
- RandomGeoSampler: fix performance regression, 60% speedup with preprocessed data (#1968)
- I/O Bench (#1972)
- Explicitly specify batch size (#1928, #1933)
- MoCo: explicitly specify memory bank size (#1931)
- Semantic Segmentation: support
ingore_indexwhen using Jaccard loss (#1898) - SimCLR: switch from Adam to LARS optimizer (#2196)
- SimCLR: explicitly specify memory bank size (#1931)
- Use Kornia's AugmentationSequential for all model weights (#1979)
- Update TorchGeo's AugmentationSequential to support object detection (#1082)
- Datasets: add license information about every dataset (#1732)
- Datasets: update link to cite SSL4EO-L dataset (#1942)
- Models: emphasize new multimodal foundation models (#2236)
- Trainers: update num_classes parameter description (#2101)
- Add button for the new Lightning Studios (#2146)
- Remove button for the recently defunct Planetary Computer Hub (#2107)
- Custom Raster Datasets: download the dataset before calling super (#2177)
- Custom Raster Datasets: fix typo (#1987)
- Transforms: update EuroSAT band names to match Sentinel-2 (#1646)
- README: fix CLI example (#2142)
- README: add Hugging Face badge (#1957)
- README: fix example of creating fake raster data (#2162)
- Read the Docs: use latest Ubuntu version to build (#1954)
- Allow horizontal scrolling of wide tables (#1958)
- Fix broken links and redirects (#2267)
- Ensure all functions have type hints (#2217)
- Make all class variables immutable (#2218)
- Check for unreachable code (#2241)
- Datasets: test dataset length (#2084, #2089)
- Datamodules: don't download during testing (#2215, #2231)
- download_url: add shared fixture to avoid code duplication (#2232)
- load_state_dict: add shared fixture to avoid code duplication (#1932)
- load_state_dict_from_url: add shared fixture to avoid code duplication (#2223)
- torch_hub: add fixture to avoid downloading checkpoints to home directory (#2265)
- Pytest: silence warnings (#1929, #1930, #2224)
- PyVista: headless plotting (#1667)
- Check numpy 2 compliance (#2151)
- Coverage: use newer flag to override ignores (#2260)
- Dependabot: update devcontainer (#2025)
- Dependabot: group torch and torchvision (#2025)
- Labeler: update to v5 (#1759)
- macOS: disable pip caching (#2024)
- Windows: fail fast mode (#2225)
This release is thanks to the following contributors:
@adamjstewart
@alhridoy
@ashnair1
@burakekim
@calebrob6
@cookie-kyu
@DarthReca
@Domejko
@favyen2
@GeorgeHuber
@isaaccorley
@kcrans
@nilsleh
@oddeirikigland
@pioneerHitesh
@piperwolters
@robmarkcole
@sfalkena
@ShadowXZT
@shreyakannan1205
@TropicolX
@wangyi111
@yichiac -
sur Mappery: Lambeth Palace
Publié: 1 September 2024, 11:00am CEST

Simon Wrigley found this beautiful window near the entrance to Lambeth Palace.
Rounding the corner, He found it was not one window but two – one with each hemisphere of the globe. It looks like a Nicolosi Globular Projection, which is a Double hemispheric polyconic map projection

MapsintheWild Lambeth Palace
-
sur Anime Pilgrimage Maps
Publié: 31 August 2024, 4:44pm CEST par Keir Clarke
Apparently many enthusiastic fans of anime like to go on anime pilgrimages, in order to visit the real-world locations that have featured in their favorite shows. Fans of anime, manga, or other animated media often embark on these pilgrimages to connect with the stories they love and to experience the places that inspired their favorite characters and scenes.A number of interactive mapping
-
sur Mappery: It’s a Squishy World
Publié: 31 August 2024, 11:00am CEST
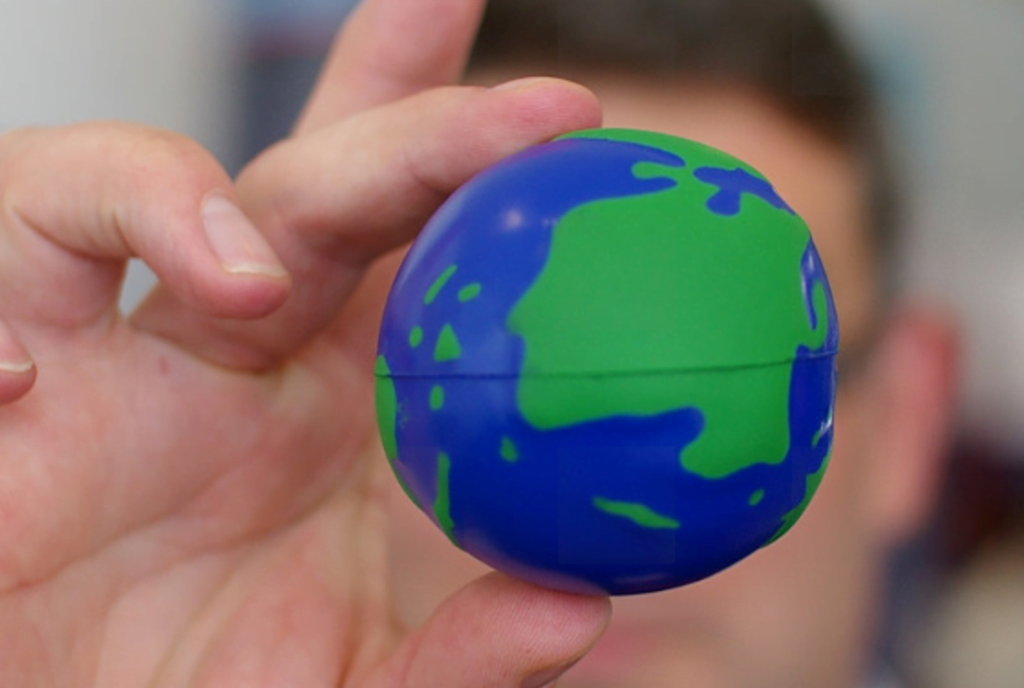
Barry shared this pic of a globe style stress ball, I think it may originate from a proprietary software vendor
MapsintheWild It’s a Squishy World
-
sur Mappery: Collette
Publié: 30 August 2024, 11:00am CEST
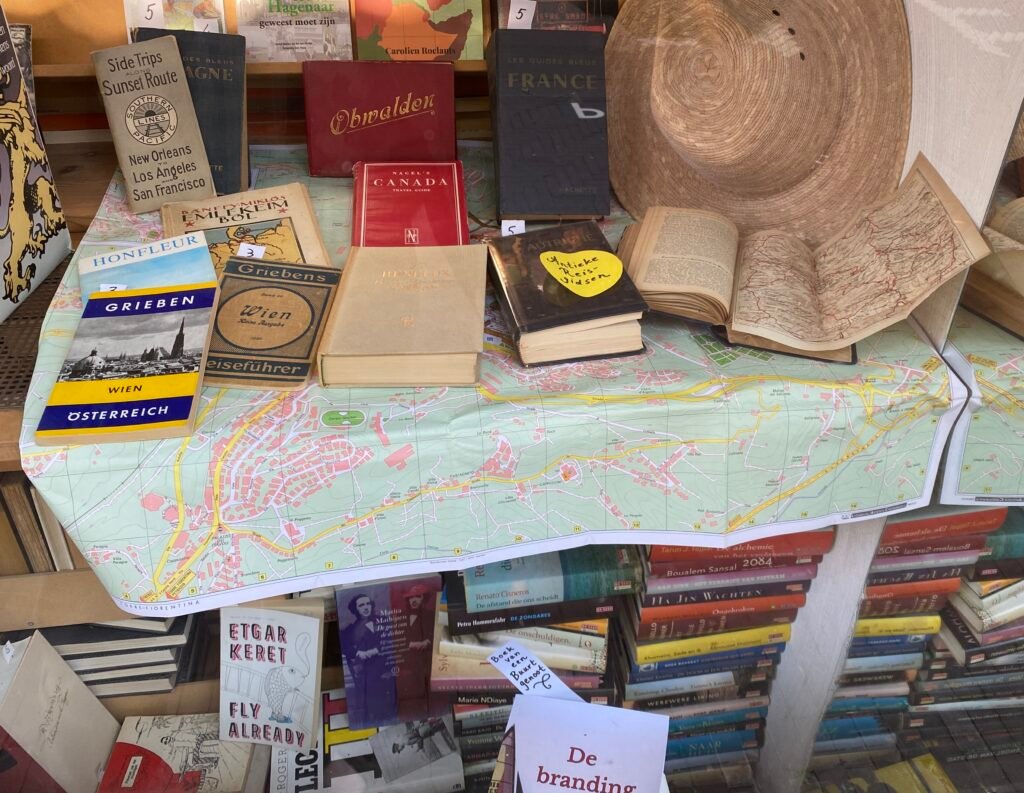
Reinder shared this pic of a shop window display “Cartographically inspired shop window of the 2nd hand bookshop Colette in The Hague”
MapsintheWild Collette
-
sur 245 Russian Military Targets at Risk
Publié: 30 August 2024, 9:54am CEST par Keir Clarke
The Institute for the Study of War (ISW) and Critical Threats have identified hundreds of Russian military sites that are in range of Ukrainian ATACMS. Currently the United States will not allow Ukraine to use US supplied tactical ballistic missiles for long-range deep strikes into Russia. According to the ISW its new map shows "the extent to which US restrictions on Ukraine's use of ATACMS
-
sur Free and Open Source GIS Ramblings: Building spatial analysis assistants using OpenAI’s Assistant API
Publié: 29 August 2024, 8:15pm CEST
Earlier this year, I shared my experience using ChatGPT’s Data Analyst web interface for analyzing spatiotemporal data in the post “ChatGPT Data Analyst vs. Movement Data”. The Data Analyst web interface, while user-friendly, is not equipped to handle all types of spatial data tasks, particularly those involving more complex or large-scale datasets. Additionally, because the code is executed on a remote server, we’re limited to the libraries and tools available in that environment. I’ve often encountered situations where the Data Analyst simply doesn’t have access to the necessary libraries in its Python environment, which can be frustrating if you need specific GIS functionality.
Today, we’ll therefore start to explore alternatives to ChatGPT’s Data Analyst Web Interface, specifically, the OpenAI Assistant API. Later, I plan to dive deeper into even more flexible approaches, like Langchain’s Pandas DataFrame Agents. We’ll explore these options using spatial analysis workflow, such as:
- Loading a zipped shapefile and investigate its content
- Finding the three largest cities in the dataset
- Selecting all cities in a region, e.g. in Scandinavia from the dataset
- Creating static and interactive maps
To try the code below, you’ll need an OpenAI account with a few dollars on it. While gpt-3.5-turbo is quite cheap, using gpt-4o with the Assistant API can get costly fast.
OpenAI Assistant APIThe OpenAI Assistant API allows us to create a custom data analysis environment where we can interact with our spatial datasets programmatically. To write the following code, I used the assistant quickstart and related docs (yes, shockingly, ChatGPT wasn’t very helpful for writing this code).
Like with Data Analyst, we need to upload the zipped shapefile to the server to make it available to the assistant. Then we can proceed to ask it questions and task it to perform analytics and create maps.
from openai import OpenAI

client = OpenAI()

file = client.files.create(
  file=open("H:/ne_110m_populated_places_simple.zip", "rb"),
  purpose='assistants'
)
Then we can hand the file over to the assistant:
assistant = client.beta.assistants.create(
  name="GIS Analyst",
  instructions="You are a personal GIS data analyst. Write and rund code to answer geospatial analysis questions",
  tools=[{"type": "code_interpreter"}],
  model="gpt-3.5-turbo",  # or "gpt-4o"
  tool_resources={
    "code_interpreter": {
      "file_ids": [file.id]
    }
  }
)
Then we can start asking questions and giving our assistant tasks:
thread = client.beta.threads.create()

message = client.beta.threads.messages.create(
  thread_id=thread.id,
  role="user",
  content="Please load the zipped shapefile and describe the content"
)
assistant > The shapefile has been successfully loaded as a GeoDataFrame with the following details:

- The GeoDataFrame has 243 entries.
- It contains a total of 38 columns with various data types including integer, float, and object types.
- One of the columns is a geometry column representing the spatial information.

If you have any specific analysis or visualizations you would like to perform on this data, feel free to let me know!
The docs have a nice example for how to stream the answers back, e.g. into a Jupyter notebook. I’ve used it to create a small convenience function:
def ask_another_question(question):
    message = client.beta.threads.messages.create(
        thread_id=thread.id,
        role="user",
        content=question
    )
    with client.beta.threads.runs.stream(
        thread_id=thread.id,
        assistant_id=assistant.id,
        event_handler=EventHandler(),
    ) as stream:
        stream.until_done()

ask_another_question("Please list the three largest cities")
assistant > code_interpreter # Sort the GeoDataFrame by the population in descending order largest_cities = gdf.sort_values(by='pop_max', ascending=False).head(3)[['name', 'pop_max']] largest_cities assistant > The three largest cities in the dataset, along with their maximum population numbers, are as follows: 1. Tokyo: 35,676,000 2. New York: 19,040,000 3. Mexico City: 19,028,000 These cities have the highest recorded maximum population numbers in the dataset. Let me know if you need any further information or analysis!ask_another_question("extract all scandinavian cities ")assistant > To extract all the Scandinavian cities from the dataset, we can filter the GeoDataFrame based on the countries typically considered part of Scandinavia. These countries include Norway, Sweden, Denmark, Finland, and sometimes Iceland. Let's filter the GeoDataFrame to extract the Scandinavian cities. assistant > code_interpreter # List of countries typically considered part of Scandinavia scandinavian_countries = ['Norway', 'Sweden', 'Denmark', 'Finland', 'Iceland'] # Filter the GeoDataFrame for Scandinavian cities scandinavian_cities = gdf[gdf['adm0name'].isin(scandinavian_countries)][['name', 'adm0name']] scandinavian_cities.head() # Displaying the first few Scandinavian cities assistant > Here are some of the Scandinavian cities extracted from the dataset: 1. Reykjavík, Iceland 2. Oslo, Norway 3. Helsinki, Finland 4. København (Copenhagen), Denmark 5. Stockholm, Sweden These are just a few examples of Scandinavian cities present in the dataset. If you would like the complete list or perform any specific analysis on these cities, feel free to let me know!ask_another_question( "please create a world map with all cities (use gray circles) " "with scandinavian cities highlighted as red circles. " )assistant > To create a world map with all cities represented as gray circles and Scandinavian cities highlighted as red circles, we will use the GeoPandas library for mapping. Let's go ahead and create the map. assistant > code_interpreter import matplotlib.pyplot as plt # Plot all cities with gray circles and Scandinavian cities with red circles fig, ax = plt.subplots(figsize=(12, 8)) # Plot all cities in gray circles gdf.plot(ax=ax, color='lightgrey', markersize=5) # Plot Scandinavian cities in red circles scandinavian_cities.plot(ax=ax, color='red', markersize=50, edgecolor='black', label='Scandinavian Cities') # Set the title ax.set_title('World Map with Scandinavian Cities Highlighted', fontsize=16) # Add legend ax.legend() # Display the map plt.show() assistant > It seems that there was an error while plotting the map because the GeoDataFrame `scandinavian_cities` does not have the necessary numeric data to plot the map directly. ... plt.show() output > assistant > Here is the world map with all cities represented as gray circles and Scandinavian cities highlighted as red circles. The map provides a visual representation of the locations of the Scandinavian cities in relation to the rest of the cities around the world. If you need any further assistance or modifications, feel free to let me know!To load and show the image, we can use:
import matplotlib.pyplot as plt
import matplotlib.image as mpimg

def show_image():
    messages = client.beta.threads.messages.list(thread_id=thread.id)

    for m in messages.data:
        if m.role == "user":
            continue
        if m.content[0].type == 'image_file':
            m.content[0].image_file.file_id
            image_data = client.files.content(messages.data[0].content[0].image_file.file_id)
            image_data_bytes = image_data.read()
            with open("./out/my-image.png", "wb") as file:
                file.write(image_data_bytes)
            image = mpimg.imread("./out/my-image.png")
            plt.imshow(image)
            plt.box(False)
            plt.xticks([])
            plt.yticks([])
            plt.show()
            break
Asking for an interactive map in an html file works in a similar fashion.
You can see the whole analysis workflow it in action here:
This way, we can use ChatGPT to perform data analysis from the comfort of our Jupyter notebooks. However, it’s important to note that, like the Data Analyst, the code we execute with the Assistant API runs on a remote server. So, again, we are restricted to the libraries available in that server environment. This is an issue we will address next time, when we look into Langchain.
ConclusionChatGPT’s Data Analyst Web Interface and the OpenAI Assistant API both come with their own advantages and disadvantages.
The results can be quite random. In the Scandinavia example, every run can produce slightly different results. Sometimes the results just use different assumptions such as, e.g. Finland and Iceland being part of Scandinavia or not, other times, they can be outright wrong.
As always, I’m interested to hear your experiences and thoughts. Have you been testing the LLM plugins for QGIS when they originally came out?
-
sur Mappery: Topo Map Chocolate
Publié: 29 August 2024, 11:00am CEST
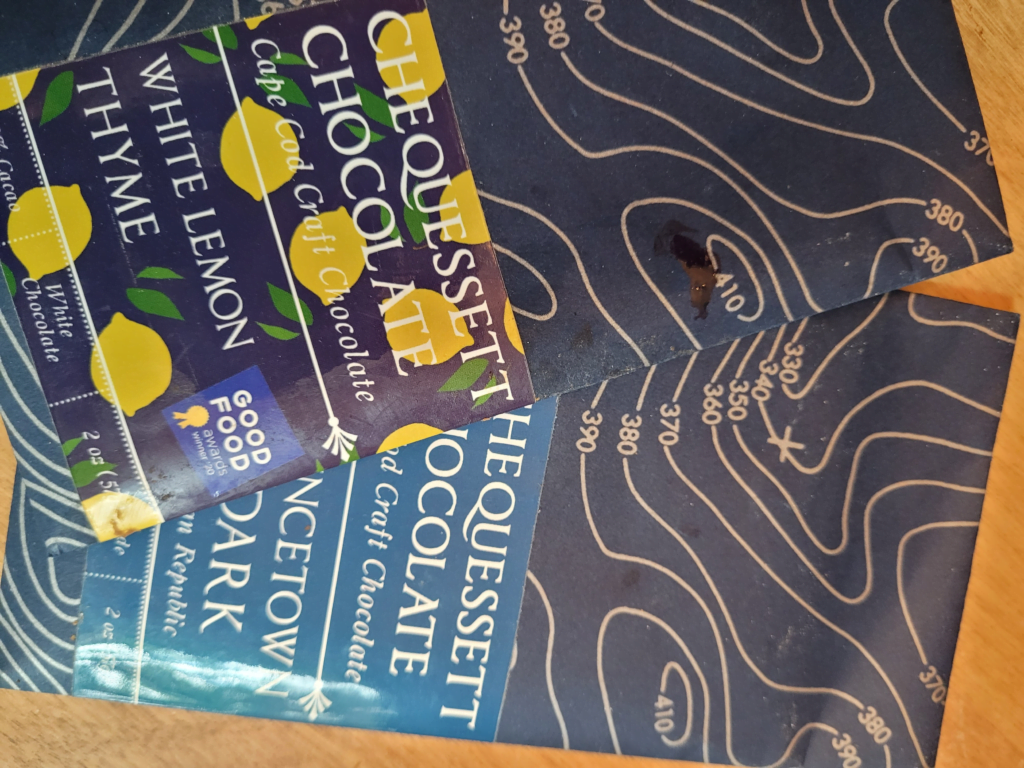
-
sur The Money Mountains of Los Angeles
Publié: 29 August 2024, 7:52am CEST par Keir Clarke
Nick Underwood has visualized the average median household income in each Los Angeles neighborhood using the analogy of elevation. On his The Topography of Wealth in L.A. map city each neighborhood is displaced 'vertically based on median annual household income'. The map uses census data to show the average household income in each Los Angeles neighborhood as a 3D tower. Sea level on
-
sur EOX' blog: Sentinel-2 Cloudless 2023
Publié: 29 August 2024, 2:00am CEST
We are thrilled to announce the latest release of EOxCloudless 2023 imagery. Whether you are an existing customer or new to EOxCloudless, this latest update offers clarity with beautiful sceneries and is designed to meet the needs of our users in a convenient way. With the everchanging and more cha ... -
sur Oslandia: (Fr) [Story] Oslandia x QWC : épisode 1 / 8
Publié: 28 August 2024, 4:51pm CEST
Sorry, this entry is only available in French.
-
sur Mappery: Deventer
Publié: 28 August 2024, 11:00am CEST
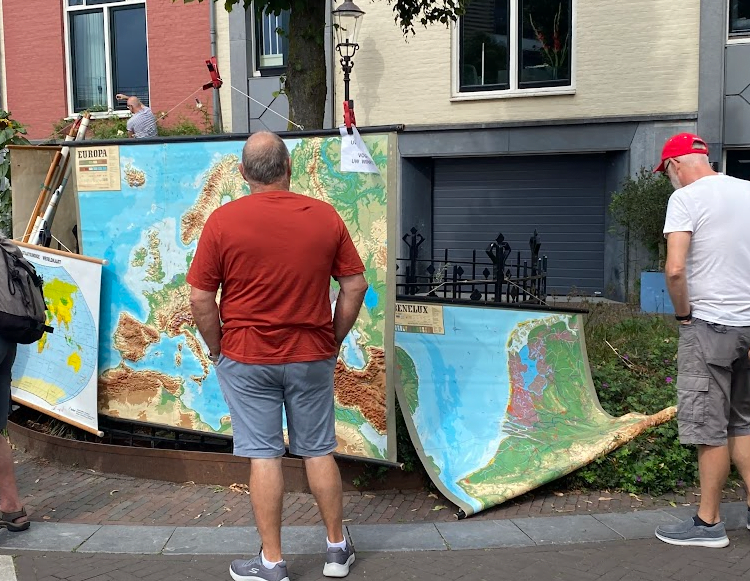
Reinder sent these pics from the second hand book market in Deventer “… at the largest 2nd hand book market of Europe (August 4, 2024) of course there was also some cartographical material for sale.”

MapsintheWild Deventer
-
sur Text Search for Street View
Publié: 28 August 2024, 10:29am CEST par Keir Clarke
all text for nyc (brooklyn) is a very impressive search engine which allows you to search Google Maps Street View imagery for any word. In the words of its developer it is "a unique digital archive of Brooklyn's typography. Users can search and visualize every sign, notice, and street art captured in street images".Enter any word (or combination of words) into 'all text for nyc' and it will -
sur WorldGuessr on Street View
Publié: 27 August 2024, 11:03am CEST par Keir Clarke
My seemingly endless quest to find an alternative to GeoGuessr may be finally over. GeoGuessr is (rightly) by far the most popular Google Maps game on the internet. Unfortunately GeoGuessr's subscription charges mean I can't afford to play it very often. Which means I'm always on the look-out for free alternatives.GeoGuessr is an online geography game that challenges players to identify
-
sur Mappery: Keighley & Worth Valley Railway
Publié: 27 August 2024, 11:00am CEST
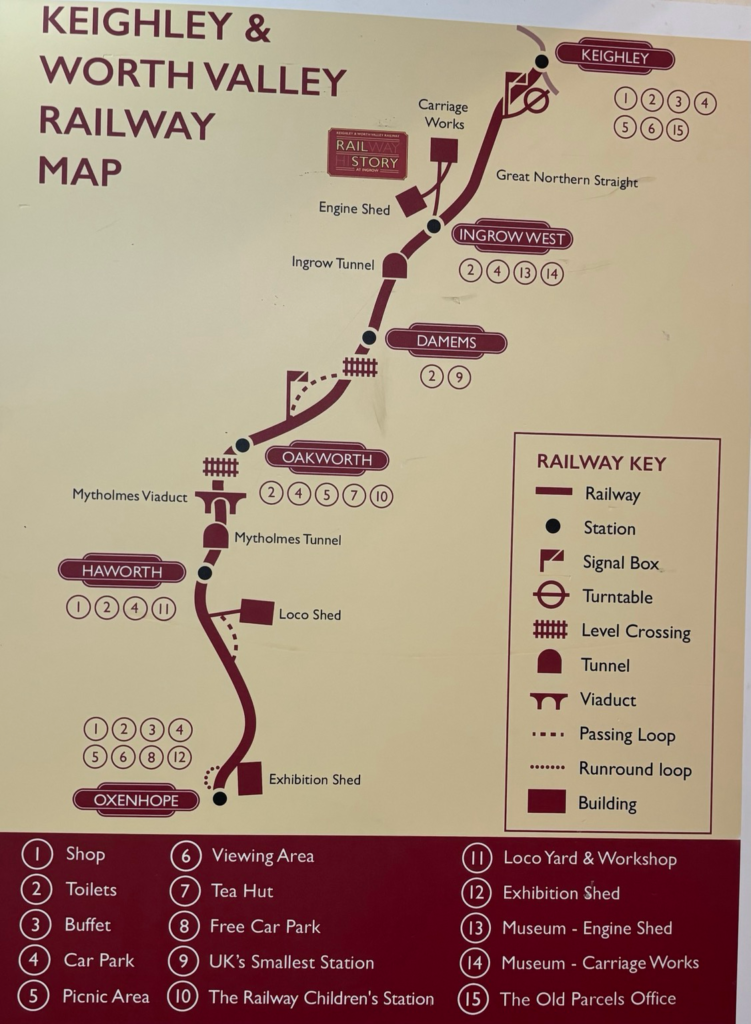
Doug shared this old railway map, you might think this an old relic that he spotted but – no! This 150 year old railway line closed in 1962 and was reopened a few years later, you can read more here and you can still travel on the line.
MapsintheWild Keighley & Worth Valley Railway
-
sur GeoTools Team: GeoTools 30.5 released
Publié: 26 August 2024, 11:23am CEST
The GeoTools team is pleased to the release of the latest stable version of GeoTools 30.5:geotools-30.5-bin.zip geotools-30.5-doc.zip geotools-30.5-userguide.zip geotools-30.5-project.zip This release is also available from the OSGeo Maven Repository and is made in conjunction with GeoServer 2.24.5. The release was made by Andrea Aime (Geosolutions)