
Vous pouvez lire le billet sur le blog La Minute pour plus d'informations sur les RSS !
Canaux
6119 éléments (1853 non lus) dans 50 canaux
 Dans la presse
(1672 non lus)
Dans la presse
(1672 non lus)
-
 Cybergeo
(1611 non lus)
Cybergeo
(1611 non lus) -
Mappemonde
(60 non lus)
-
Dans les algorithmes
(1 non lus)
Du côté des éditeurs
(24 non lus)
-
Toute l’actualité des Geoservices de l'IGN
(15 non lus)
-
arcOpole - Actualités du Programme
-
arcOrama
(9 non lus)
-
Neogeo
Toile géomatique francophone
(110 non lus)
-
Géoblogs (GeoRezo.net) (5 non lus)
-
UrbaLine (le blog d'Aline sur l'urba, la géomatique, et l'habitat)
-
Séries temporelles (CESBIO)
(2 non lus)
-
Datafoncier, données pour les territoires (Cerema)
-
Cartes et figures du monde
-
SIGEA: actualités des SIG pour l'enseignement agricole
-
Data and GIS tips
-
ReLucBlog
-
L'Atelier de Cartographie
-
My Geomatic
-
archeomatic (le blog d'un archéologue à l’INRAP)
-
Cartographies numériques
-
Carnet (neo)cartographique
-
GEOMATIQUE
-
Évènements – Afigéo
(12 non lus)
-
Afigéo
(12 non lus)
-
Geotribu
(50 non lus)
-
Conseil national de l'information géolocalisée
(9 non lus)
-
Icem7
-
Makina Corpus (1 non lus)
-
Oslandia
(1 non lus)
-
CartONG
(2 non lus)
-
GEOMATICK
(6 non lus)
-
Geomatys
(3 non lus)
-
Les Cafés Géo
(1 non lus)
-
L'Agenda du Libre
(3 non lus)
-
Conseil national de l'information géolocalisée - Actualités
(3 non lus)
Géomatique anglophone
(35 non lus)
-
All Points Blog
-
Directions Media - Podcasts
-
Navx
-
James Fee GIS Blog
-
Maps Mania
(19 non lus)
-
Open Geospatial Consortium (OGC)
-
Planet OSGeo
(16 non lus)
Géomatique anglophone
-
 14:00
14:00 Fernando Quadro: Comparando GeoNode e ArcGIS Online: Qual é o certo para você?
sur Planet OSGeoGeoNode e ArcGIS Online são plataformas de software GIS (Geographic Information System) que permitem a criação e o compartilhamento de mapas e aplicativos web. No entanto, existem diferenças importantes entre as duas plataformas que podem influenciar na escolha da solução mais adequada para suas necessidades. Este artigo tem como objetivo fornecer uma comparação entre essas plataformas, com foco em recursos, funcionalidades e sua adequação para instituições governamentais, empresariais e acadêmicas.
 Funcionalidades
O Geonode é uma plataforma open-source com foco na catalogação, visualização e compartilhamento de dados geoespaciais, que apresenta facilidade de uso, gerenciamento e integração com diversas ferramentas e serviços web OGC (Open Geospatial Consortium).
O ArcGIS Online é uma plataforma robusta para criação de mapas e aplicativos WebGIS que possui uma ampla gama de funcionalidades para análise espacial, geoprocessamento e gerenciamento de dados, além da integração com outras plataformas ArcGIS e ferramentas da Esri.
Curva de aprendizadoO Geonode possui uma interface amigável e intuitiva, facilitando o aprendizado para iniciantes por meio de uma documentação completa e uma comunidade ativa que oferece suporte e ajuda aos usuários. Além disso, o Geonode possui uma curva de aprendizado mais suave para usuários com pouca ou nenhuma experiência em GIS.
O ArcGIS Online é uma plataforma mais complexa, com uma curva de aprendizado mais acentuada, o que requer conhecimentos técnicos em GIS para configuração, administração e desenvolvimento de aplicações. Essa plataforma possui documentação extensa e abrangente, com diversos recursos de aprendizado.
DocumentaçãoA documentação do Geonode é recomendada para usuários iniciantes em GIS que buscam uma documentação mais simples e direta e para usuários que desejam configurar e usar a plataforma rapidamente.
O ArcGIS Online é recomendado para usuários experientes em GIS que buscam uma documentação completa e abrangente e para usuários que desejam explorar todos os recursos da plataforma.
Taxas de licenciamento e custos de assinaturaGeoNode: Sendo de código aberto, o GeoNode é totalmente gratuito para baixar, usar e modificar. Não há taxas de licenciamento ou custos de assinatura associados ao uso da plataforma.
ArcGIS Online: O ArcGIS Online exige uma taxa de licenciamento, que pode ser substancial, especialmente para organizações maiores ou com necessidades complexas de GIS. Além disso, poderão ser incorridos custos contínuos de assinatura para acesso a atualizações e suporte.
Personalização e DesenvolvimentoO GeoNode: A natureza de código aberto do GeoNode permite ampla personalização e desenvolvimento. As organizações podem adaptar a plataforma às suas necessidades específicas sem incorrer em custos adicionais com ferramentas de desenvolvimento proprietárias.
ArcGIS Online: A personalização no ArcGIS Online pode exigir o uso de ferramentas e APIs proprietárias, potencialmente levando a taxas de licenciamento ou custos de desenvolvimento
adicionais. Escalabilidade e flexibilidadeGeoNode: A escalabilidade do GeoNode não está vinculada a níveis de licenciamento ou níveis de assinatura. As organizações podem dimensionar a implantação do GeoNode conforme necessário, sem incorrer em custos adicionais de licenciamento.
ArcGIS Online: O dimensionamento do ArcGIS Online pode exigir a compra de licenças adicionais ou níveis de assinatura, o que pode se tornar caro à medida que as necessidades de GIS de uma organização aumentam.
Mas enfim, quando devo usar cada uma das ferramentas?Use o GeoNode se fizer parte de uma pequena, média ou grande organização com necessidades essenciais de mapeamento e compartilhamento de dados geoespaciais e que, além disso, busque uma solução open-source, fácil de usar e sem custos de licenças.
Use o ArcGIS Online se fizer parte de uma grande organização com recursos que possua necessidades complexas de GIS e que busquem uma plataforma robusta e com ampla gama de funcionalidades para usuários que já estão familiarizados com outras plataformas ArcGIS e ferramentas da Esri.
Ficou interessado? -
14:00
Fernando Quadro: Os 5 benefícios da Infraestrutura de Dados Espaciais
sur Planet OSGeoA Infraestrutura de Dados Espaciais (IDE) é uma ferramenta essencial no Geoprocessamento, oferecendo uma série de benefícios. Com a utilização da IDE, é possível organizar, armazenar e compartilhar dados espaciais de forma eficiente, facilitando o acesso e a análise dessas informações.
Princípios como a padronização e a interoperabilidade são fundamentais para o bom funcionamento da IDE, garantindo a qualidade e a integridade dos dados. Além disso, fatores históricos, como o avanço da tecnologia e a democratização do acesso à informação, contribuíram para o desenvolvimento e a popularização da Infraestrutura de Dados Espaciais.
Os benefícios: Melhor organização e gestão dos dados
Maior eficiência na análise espacial
Facilidade no compartilhamento de informações
Melhor tomada de decisões
Estímulo à inovação e desenvolvimento tecnológicoAs aplicações da IDE são diversas, abrangendo áreas como planejamento urbano, gestão ambiental, agricultura, transporte e muitas outras. Através da utilização de mapas e análises espaciais, é possível obter informações valiosas para a tomada de decisões, contribuindo para o desenvolvimento sustentável e a melhoria da qualidade de vida.
E onde o GeoNode se encaixa nisso?O GeoNode é uma plataforma para gestão e publicação de dados geoespaciais que reúne projetos open source maduros e estáveis sob uma interface consistente e fácil de usar. Com ele você consegue implantar sua IDE de forma fácil e prática.
Quer saber mais?O Curso é oferecido na modalidade EAD Ao Vivo, com uma carga horária de 18 horas divididas em 6 encontros. Porém, essas aulas são gravadas e ficam disponíveis ao aluno por 12 meses em nosso portal do aluno.
Então, se por acaso você não puder comparecer em alguma das aulas ao vivo, não se preocupe, você poderá rever a aula gravada a qualquer momento.
Em comemoração ao aniversário de 12 anos da Geocursos, estamos disponibilizando pra você R$ 100 de desconto, basta utilizar o cupom GEOCURSOS12ANOS
Ficou interessado? -
9:19
OPENGIS.ch: INTERLIS Crashkurs Webinar
sur Planet OSGeoDer Crashkurs dauert 2.5 Stunden via Google Meet (kein Google Konto erforderlich) und kostet 90 CHF pro Person.
BeschreibungZiel dieses Crashkurses ist es, “blutigen Anfänger:innen” INTERLIS näher zu bringen. Nach dem Crashkurs werden sie wissen, was INTERLIS ist, wie es angewendet wird und wie ein Modell gelesen wird und man sich darin zurechtfindet. Weiter werden sie fähig sein, ein einfaches Beispielmodell selbst zu modellieren.
VorkenntnisseKeine.
SoftwareKeine. Das Webinar ist primär frontal und es muss keine Software vorinstalliert werden.
Um gleich ein bisschen mitzumachen, können aber optional folgende Tools installiert werden, im Idealfall auf einem separaten Bildschirm:
- Aktuelle QGIS LTR Version für Windows, macOS oder Linux https://download.qgis.org.
- VS Code Texteditor
-
5:38
Adam Steer: Image transects for ecological assessment
sur Planet OSGeoSometimes we don’t need to create full blown orthophotos and 3D models to understand things. Just seeing an image in a location context is enough. With this in mind, I was recenly tasked by Taungurung Land and Waters Council to collect a set of baseline images along preset transects for ecological assessment. The transects were… Read More »Image transects for ecological assessment -
18:29
GeoSolutions: GeoSolutions at CalGIS in Visalia, California – March 18-20, 2024
sur Planet OSGeoYou must be logged into the site to view this content.
-
14:00
Fernando Quadro: O que é um WebGIS
sur Planet OSGeoWebGIS é uma tecnologia usada para exibir e analisar dados espaciais na Internet. Ele combina as vantagens da Internet e do GIS oferecendo um novo meio de acessar informações espaciais sem a necessidade de você possuir ou instalar um software GIS.
A necessidade de divulgação de dados geoespaciais têm estimulado cada vez mais o uso de ferramentas WebGIS para apresentações interativas de mapas e de informações relacionadas por meio da internet.
As soluções adotadas na apresentação destes mapas devem apresentar um equilíbrio entre facilidade de uso, riqueza de recursos para visualização e navegação entre os dados, e funcionalidades geoespaciais para pós-processamento, características que devem ser adequadas para cada perfil de usuário que acessará o WebGIS.
-
10:47
gvSIG Team: Coordinación CArtográfica en el Sistema de Administración del Territorio (CCASAT)
sur Planet OSGeo
Compartimos información sobre CCASAT un grupo de trabajo de expertos en administración del territorio del cual la Asociación gvSIG formamos parte.
Coordinación CArtográfica en el Sistema de Administración del Territorio (CCASAT) es un grupo con sede en la Universitat Politécnica de València, España; en el Departamento de Ingeniería Cartográfica, Geodesia y Fotogrametría (DICGF) y en la Escuela Técnica Superior de Ingeniería Geodésica, Cartográfica y Topográfica (ETSIGCT), cuyos objetivos principales son:
Apoyo, colaboración e investigación en todos aquellos ámbitos relacionados con la información cartográfica que permita una administración efectiva del territorio (como la información catastral, y/o la información registral, o similar), y fundamentalmente en aspectos que sirvan de apoyo para conseguir seguridad en la tenencia de la tierra, y valoración con efecto administrativo. Fomentando la difusión, transferencia de conocimientos, investigación, coordinación, consultoría y optimización de recursos.
CCASAT está enfocado principalmente a España y Latinoamérica, siendo el idioma principal el español.
-
14:00
GeoTools Team: GeoTools 31-RC Release Candidate
sur Planet OSGeo The GeoTools team is pleased share a release candidate GeoTools 31-RC: geotools-31-RC-bin.zip geotools-31-RC-doc.zip geotools-31-RC-userguide.zip geotools-31-RC-project.zip This release candidate is also available from the OSGeo Maven Repository and is made in conjunction with GeoServer 2.25-RC. The release was made by Jody Garnett (GeoCat).Testing -
11:47
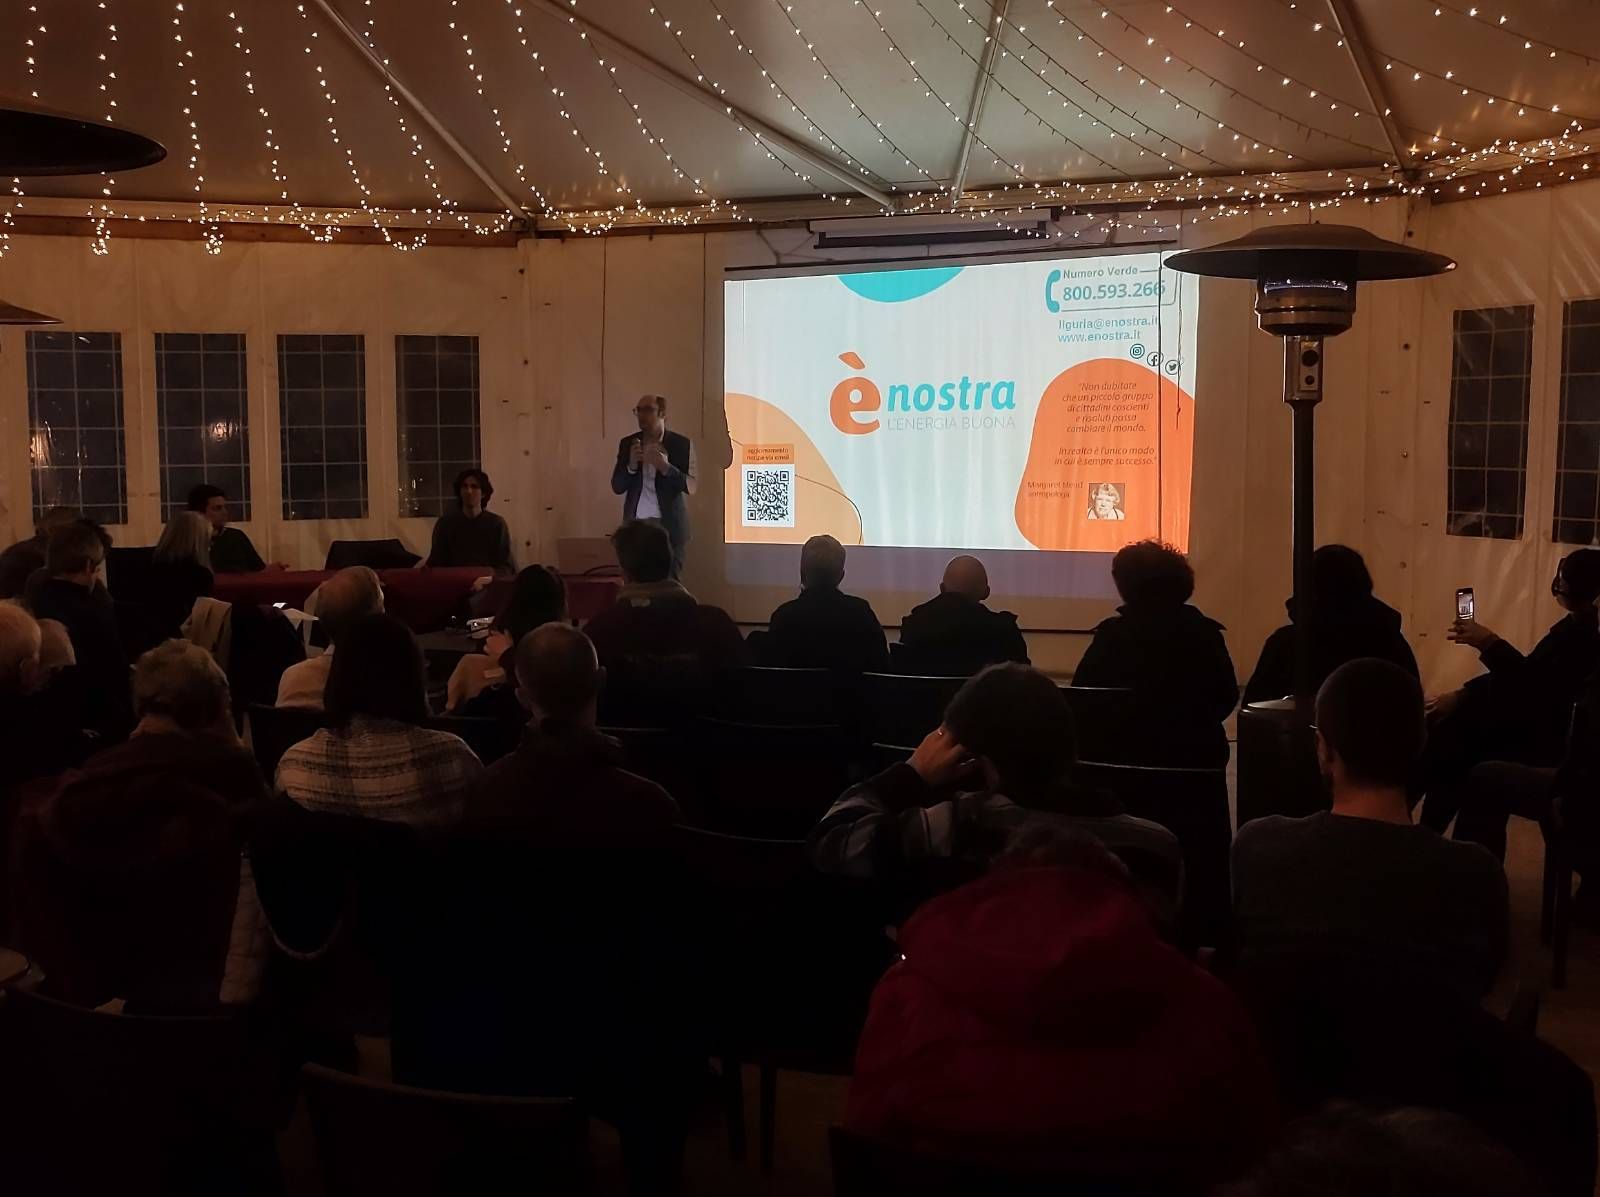
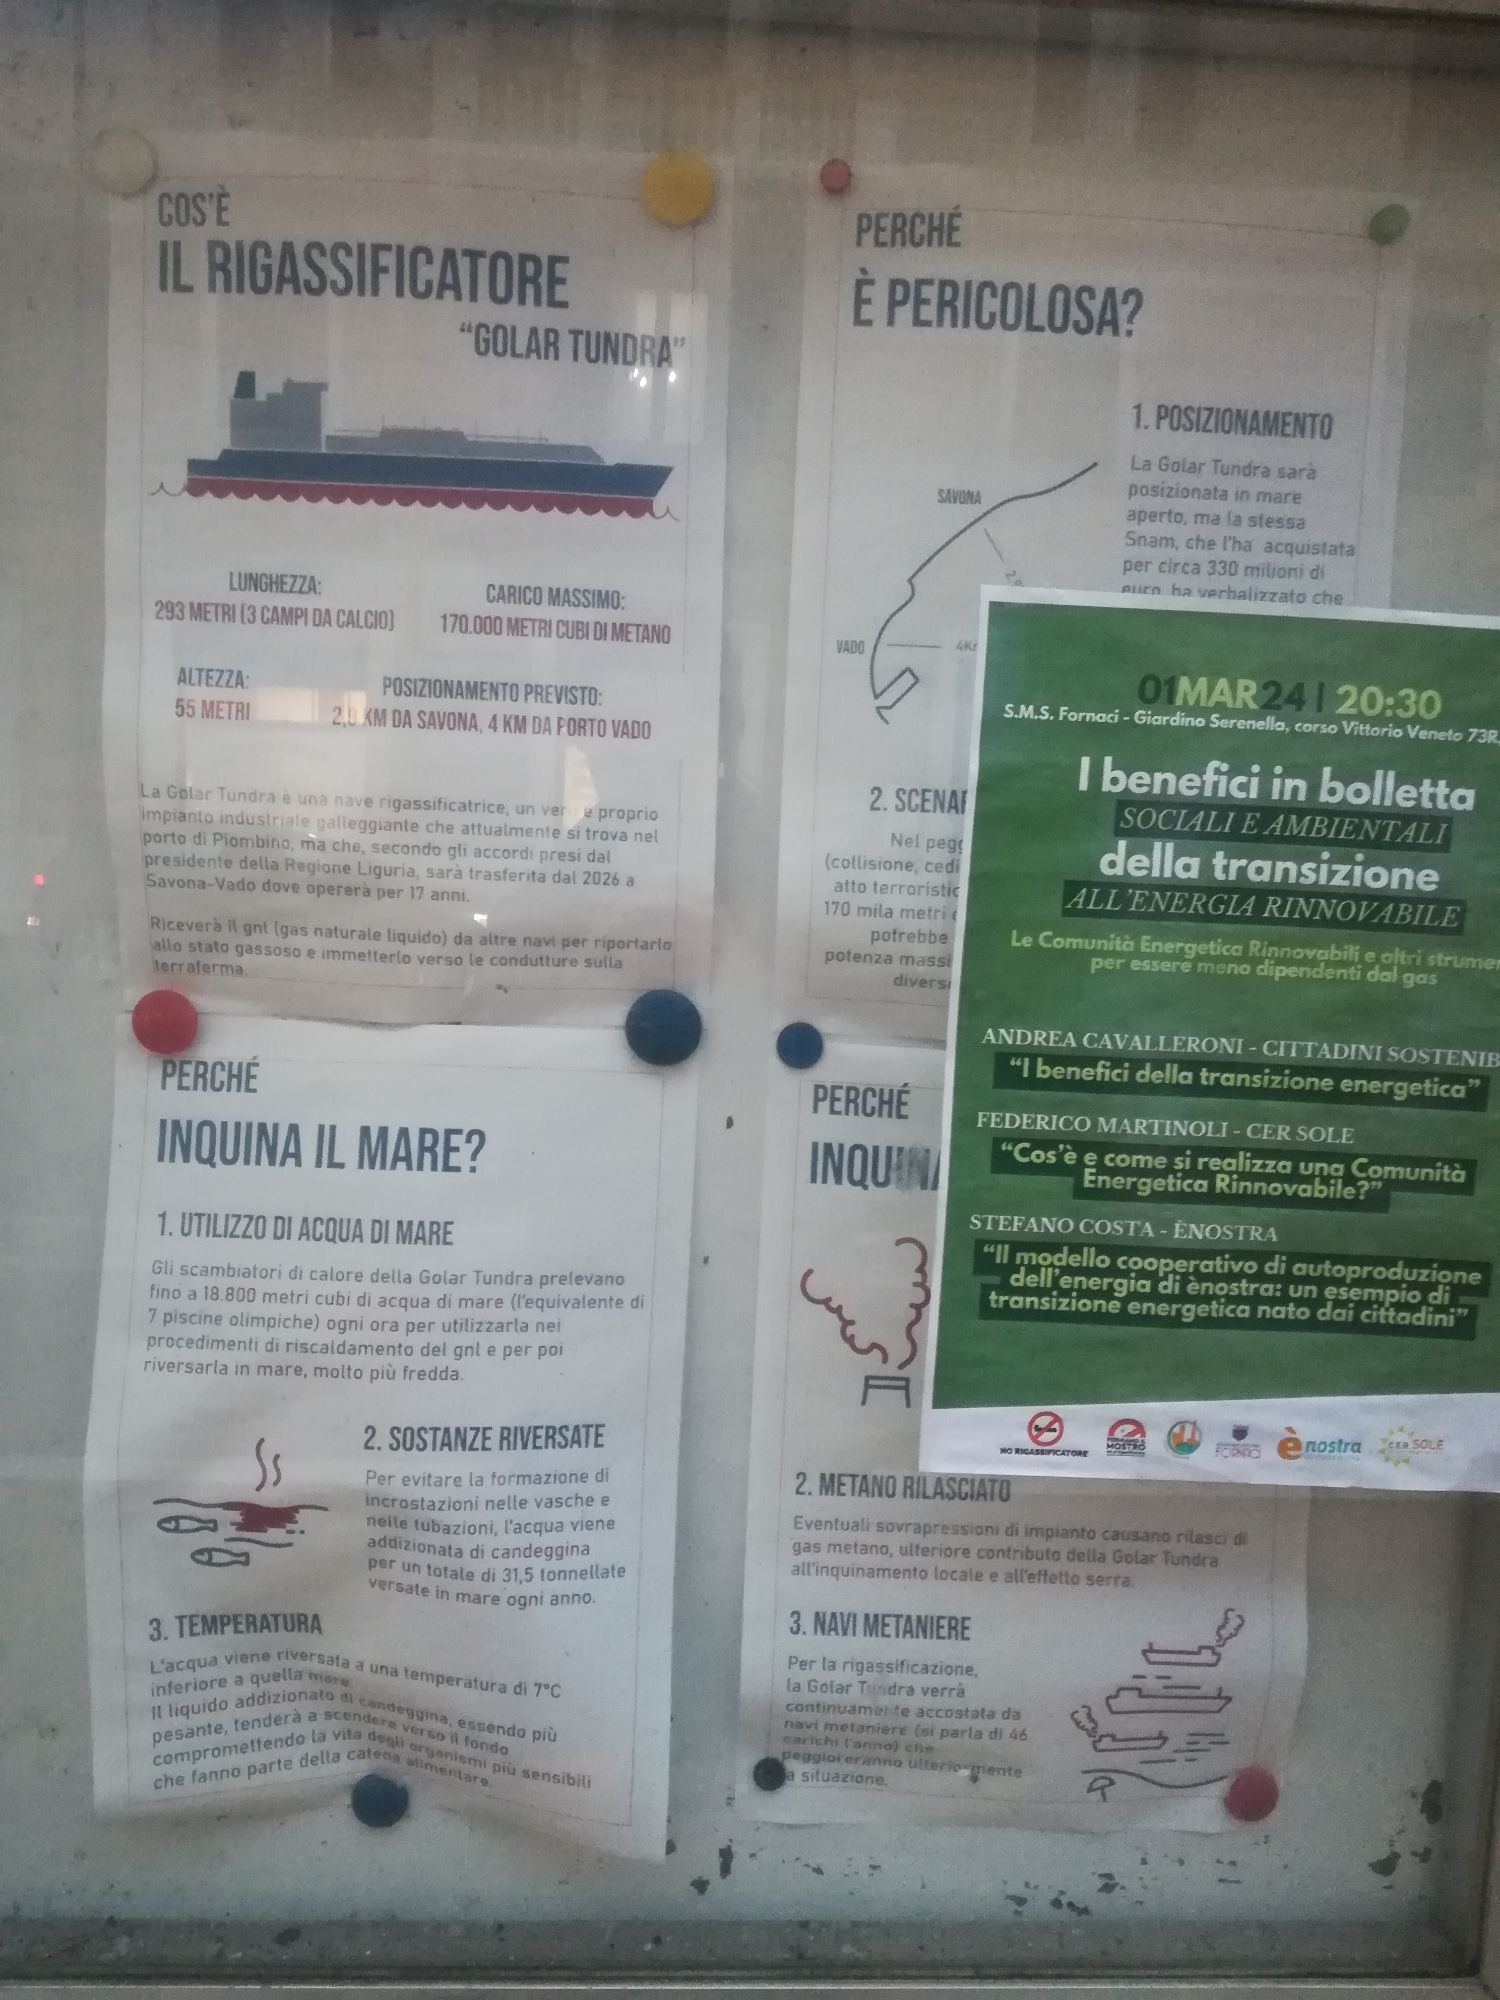
Stefano Costa: ènostra e la transizione energetica dal basso a Savona
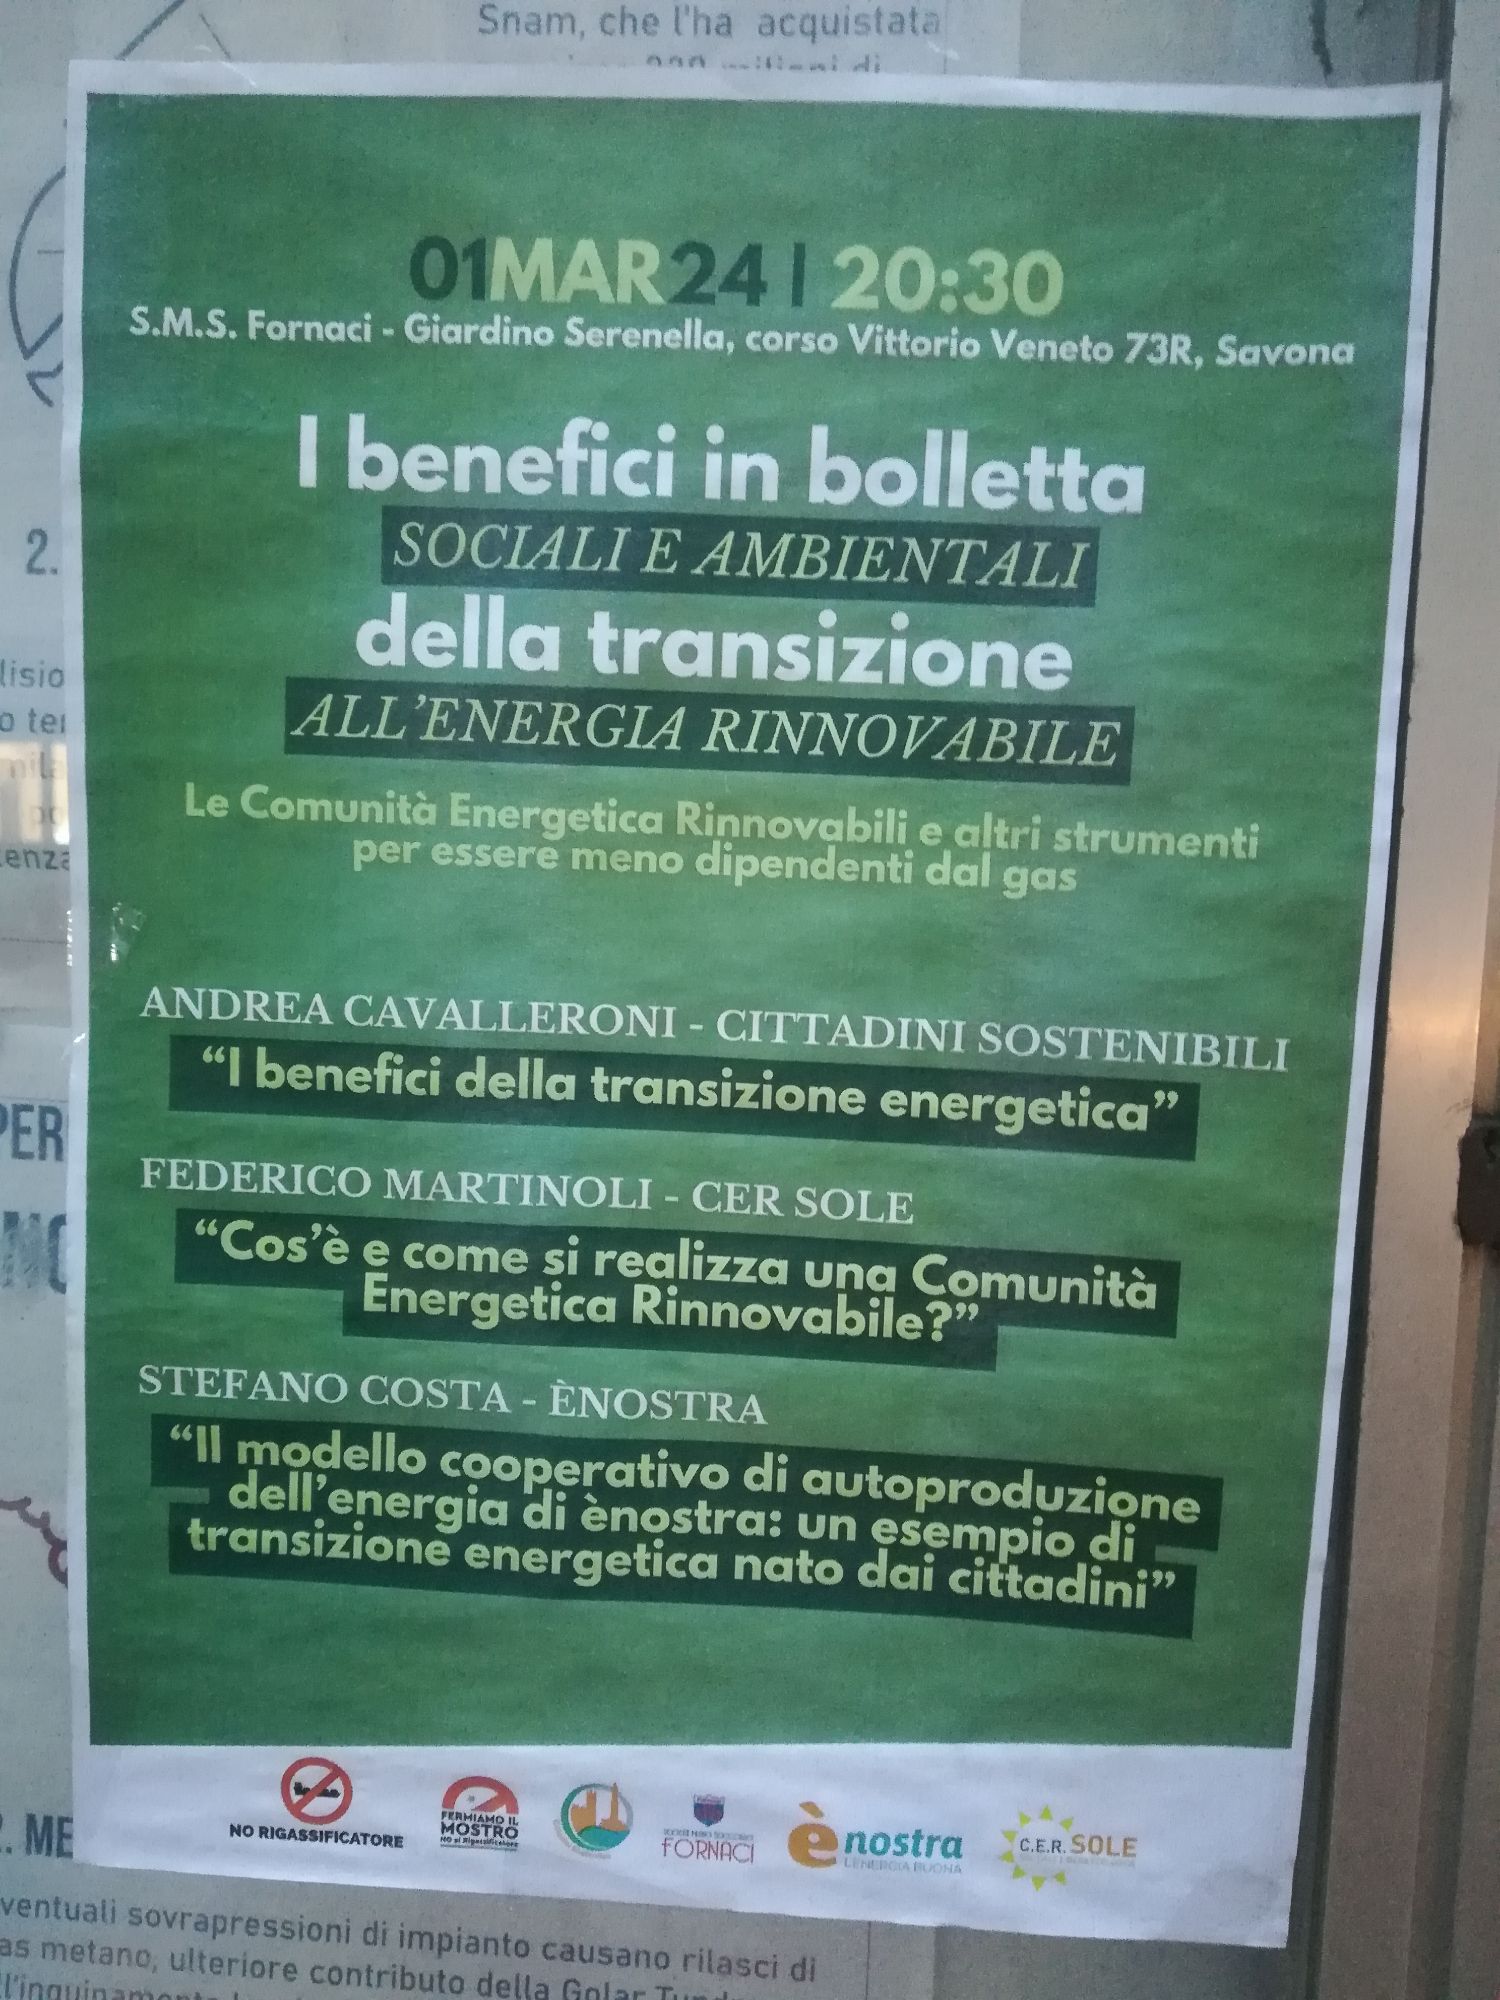
sur Planet OSGeoVenerdì 1 marzo ero a Savona per parlare di transizione energetica dal basso alla Società di Mutuo Soccorso Fornaci, insieme al gruppo territoriale di ènostra. Ci avevano invitati il comitato No rigassificatore e il comitato Fermiamo il mostro per una serata insieme a due associazioni genovesi con cui collaboriamo spesso, Cittadini sostenibili e CER Sole.
Savona e Vado Ligure non assistono passivamente alle scelte assurde dei politici regionali e locali di accogliere un rigassificatore che inquina il mare, deturpa il territorio con tutto il gasdotto necessario a terra, contribuisce a inquinare l’aria rimanendo ancorati alle fonti fossili e arricchendo le grandi multinazionali. C’è stato un risveglio che ha portato a una lunga catena umana lungo la costa, tante mobilitazioni e molti resistono all’idea di avere dei benefici “compensativi”.
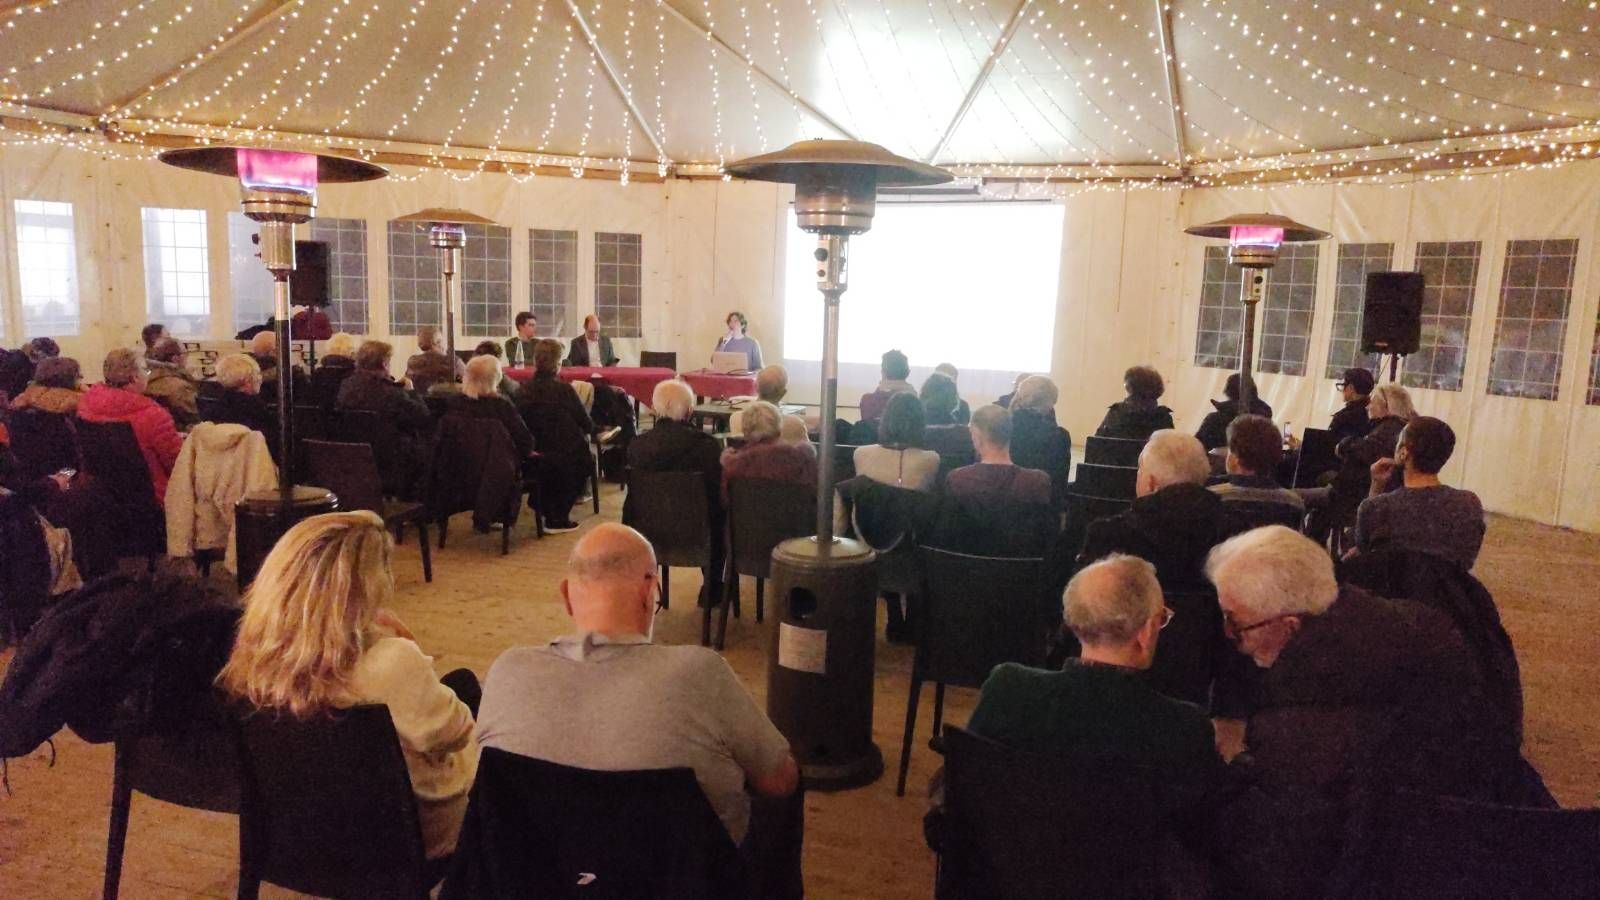
La serata è stata lunga e la partecipazione grande, nonostante la pioggia. Si è parlato dei danni che derivano dalle fonti fossili per il clima e per la salute, delle false notizie sulle rinnovabili, delle comunità energetiche. E io ho presentato le attività di ènostra. Ero piuttosto stanco ma con l’aiuto degli altri soci del gruppo territoriale ho spiegato cosa fa la cooperativa, che principi la guidano e l’importanza della partecipazione alle scelte energetiche al di là del cambio di fornitura. Non tutta l’energia rinnovabile è uguale e quella fatta dal basso, attenta agli impatti sociali e ambientali è quella che preferiamo.
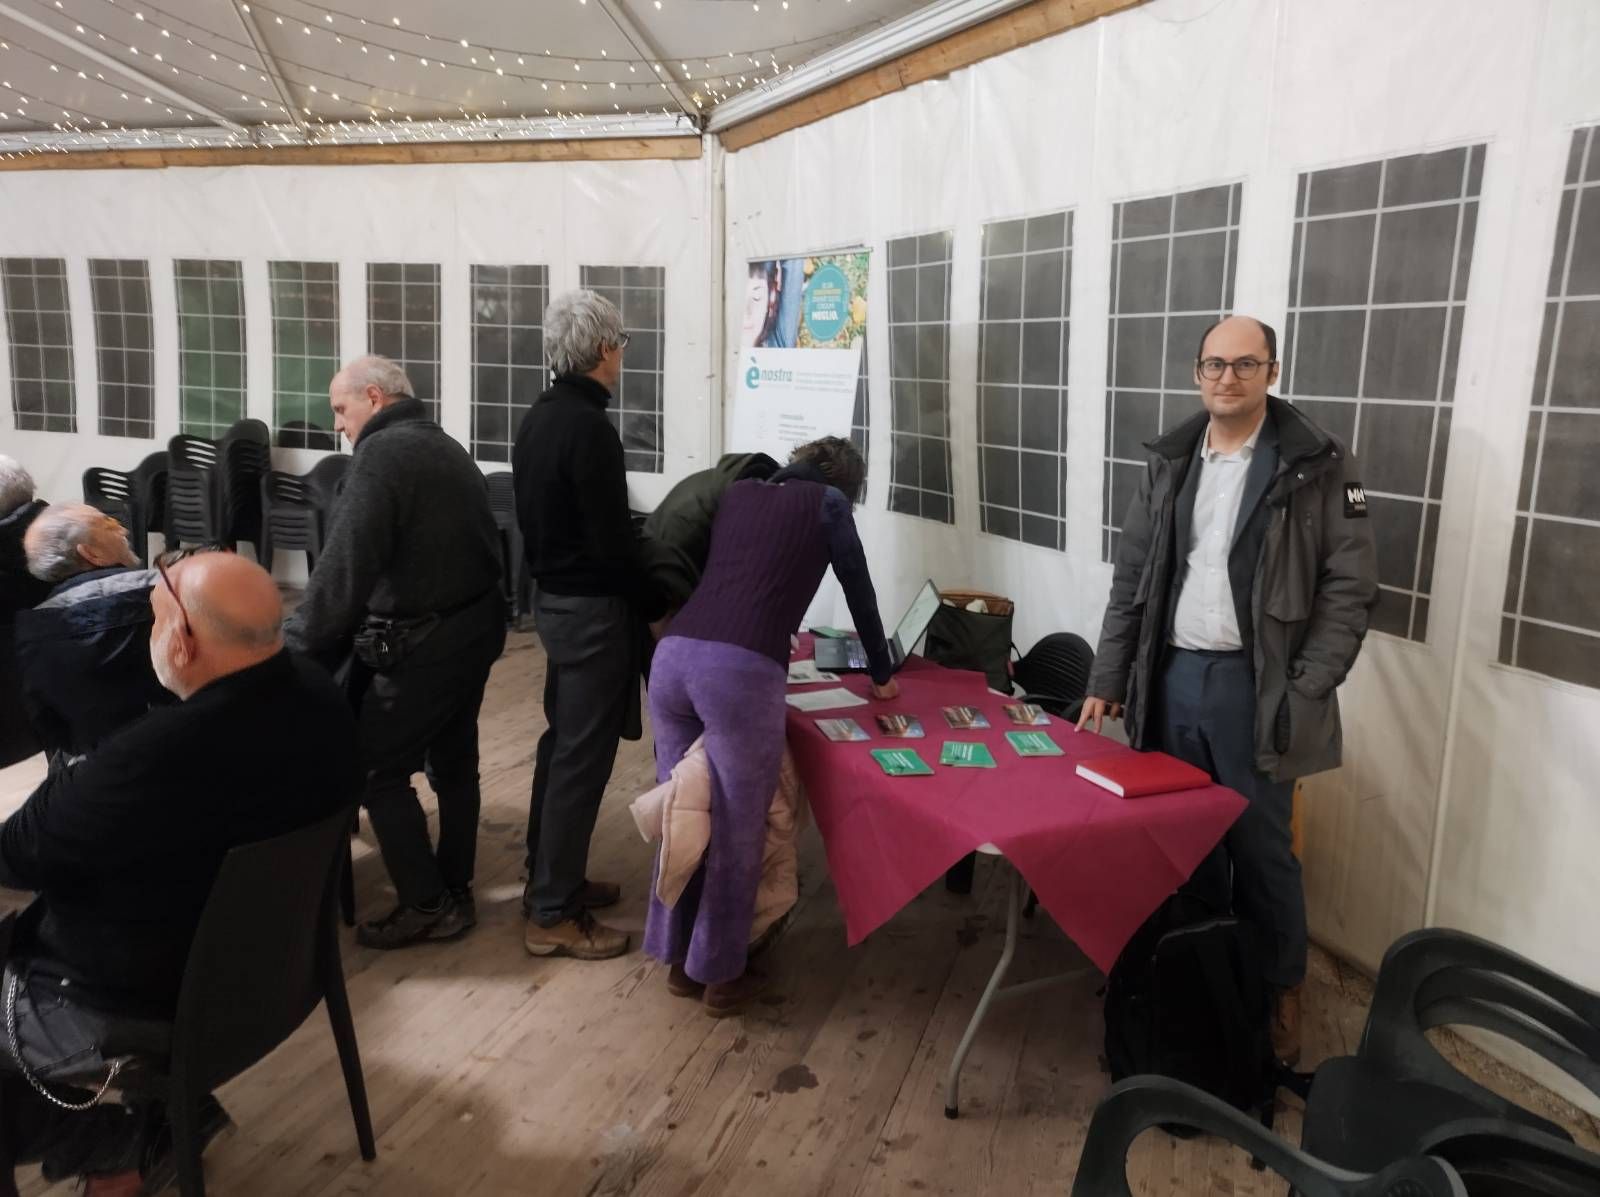
L’accoglienza del comitato è stata molto generosa e sono contento che sia nato questo legame.
Cos’è una cooperativa energetica e cosa fa in concreto (video Youtube)
-
2:00
GeoServer Team: GeoServer 2.25-RC Release
sur Planet OSGeoGeoServer 2.25-RC release is now available with downloads (bin, war, windows), along with docs and extensions.
This is a release candidate intended for public review and feedback. GeoServer 2.25-RC is made in conjunction with GeoTools 31-RC, and GeoWebCache 1.25-RC.
Thanks to Jody Garnett (GeoCat) for making this release.
Why share a release candidate?A sensible question to ask is why a “release candidate” is being produced at all - when we do not recommend running such a thing in production.
GeoServer also follows a “release early, release often” approach which is where the project shares releases so you can test and provide feedback.
This results in a lovely balance:
-
The GeoServer developer has already tested on the data and data sources they got handy.
-
The users of GeoServer have access to a much greater variety in data and and use cases to test with.
Please try out this release candidate and let us know how it works for you.
-
Bonus: By testing with your data directory you are assured that the next GeoServer will work well for you and your team.
This balance of a community sharing and each doing what they can they can do easily, is a nice thing about the open-source approach: the result is software we can trust and works well.
Thank you for being part of the GeoServer community. Testing and feedback is welcome by email and bug reports.
Upgrade NotesWe have a number of configuration changes when updating an existing system:
-
The longstanding
ENTITY_RESOLUTION_ALLOWLISTsetting has been recommended as a way to control the locations available for external entity resolution when parsing XML documents and requests.The default has changed from
*(allowing any location) to allowing the recommendedwww.w3.org,schemas.opengis.net,www.opengis.netlocations used for OGC Web Services, along with theinspire.ec.europa.eu/schemaslocation used by our friends in Europe. -
The FreeMarker Template HTML Auto-escaping is now enabled by default.
-
The spring security firewall is now enabled by default.
-
A new configuration setting is available to limit content served from the
geoserver/wwwfolder.If you have not met the
wwwfolder before it is used to share content, and there is a tutorial serving static files. -
We do add recommendations to production considerations over time, if you have not checked that page in a while please review.
Thanks to Steve Ikeoka and Jody Garnett for these improvements.
Security ConsiderationsThis a reminder to update to GeoServer 2.24.2 Release (or GeoServer 2.35.5 Release).
Alongside the upcoming GeoServer 2.25.0 release we will “publicly disclose” a list of Common Vulnerabilities and Exposures that have been addressed previously.
- If you are working with a commercial support provider that volunteers with the geoserver-security email list they are already informed.
- If you have updated to GeoServer 2.24.2 Release (or GeoServer 2.23.5 Release) you are already patched.
I hope you enjoy our team’s effort to improve communication. The use of the CVE system allows us to reach a wider audience than reads these blog posts.
See the project security policy for more information on how security vulnerabilities are managed.
Experimental Java 21 supportGeoServer, along with GeoTools and GeoWebCache, are now tested to build and pass tests with Java 21.
This is not yet an endorsement to run GeoServer in production with Java 21. We are looking ahead at the 2024 roadmap, and are making sure the basics are covered for the newer Java releases.
JTS fast polygon intersection enabled by defaultThe JTS Next Generation polygon intersection algorithm has been enabled by default, which will improve performance of a number of operations, including WPS processes and the vector tiles generation. We deem the functionality well tested enough that it should be opened to the majority of users, even if it’s still possible to turn it off by adding the
-Djts.overlay=old.
MapML Extension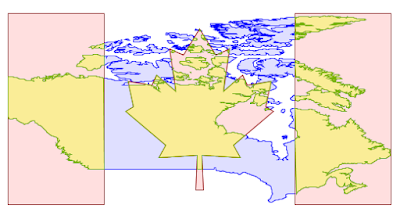
The MapML extension is receiving a number of updates and improvements, with more to come in the following months. It’s now possible to declare “Tiled CRS” as the CRS for a layer, with the implication not just of the CRS, but also of the gridset that will be used by the MapML viewer:
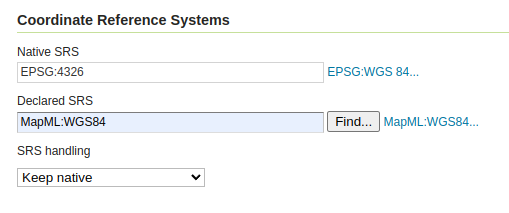
This portion builds on top of the work done months ago to support astronomical CRSs, which allows GeoServer to support multiple CRS authorities.
The MapML preview links are now using the new MapML output format, while the old dedicated REST controller has been removed. This allows for better integration of the MapML format in the GeoServer ecosystem. The MapML viewer has also been updated to the latest version:
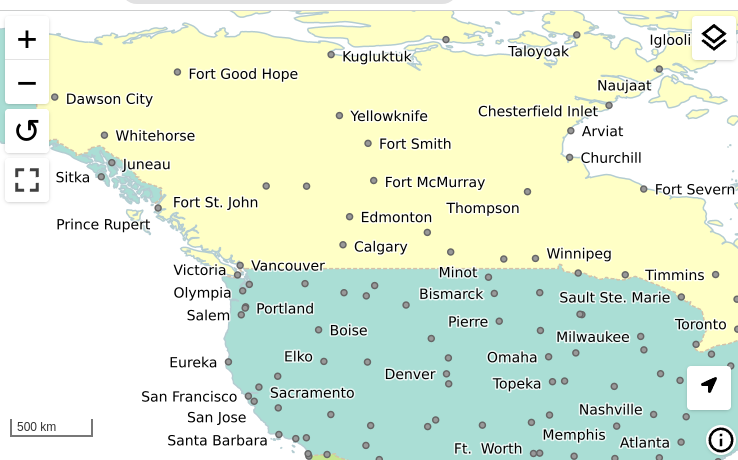
Thanks to Joseph Miller and Andrea Aime (GeoSolutions) for this work, and Natural Resources Canada for sponsoring it.
Community Module UpdatesMuch of the new activity in GeoServer starts as a community module. We’d like to remind you that these modules are not yet supported, and invite you to join the effort by participating in their development, as well as testing them and providing feedback.
Raster attribute Table community moduleDeveloped as part of GEOS-11175, the Raster Attribute Table community module uses the GDAL Raster Attribute Table (RAT) to provide a way to associate attribute information for individual pixel values within the raster, to create styles as well as to provide a richer GetFeatureInfo output.
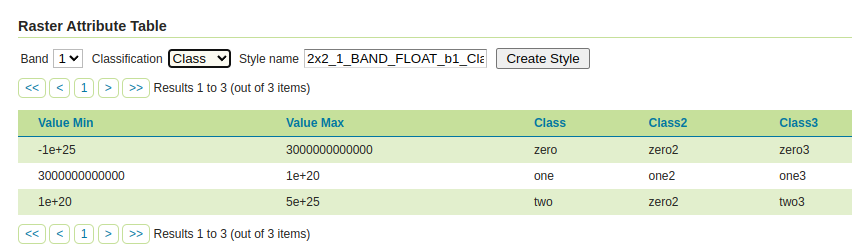
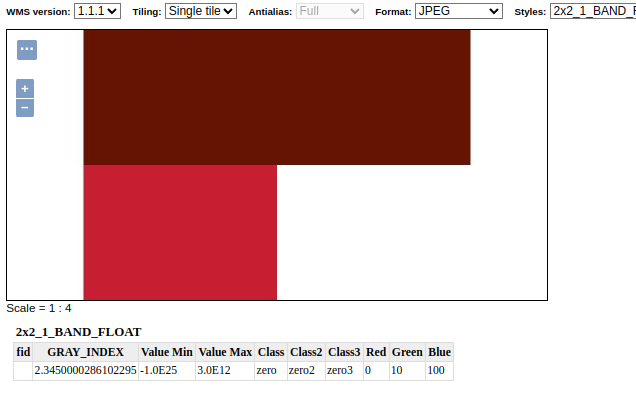
For more information see the user guide.
We’d like to thank Andrea Aime (GeoSolutions) for the development and NOAA for sponsoring.
Graticules for WMS mapsThe graticules community module, developed as part of GEOS-11216, provides a datastore generating graticules for WMS maps, along with a rendering transformation that can be used to label them. The module can be used to draw a graticule in WMS maps, as well as to download them as part of WFS (or in combination with the WPS download module).
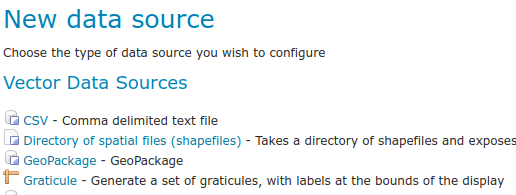
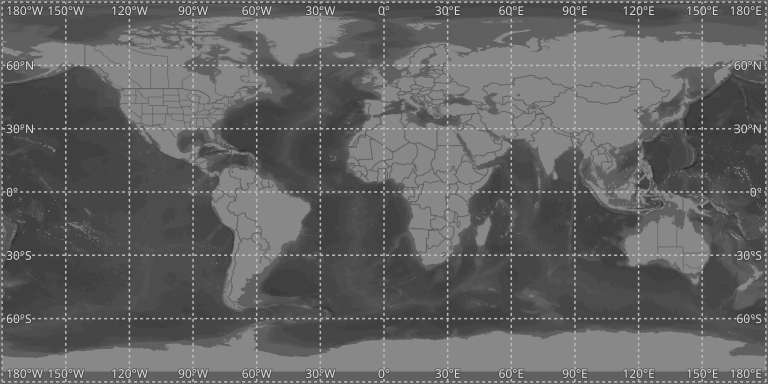
We’d like to thank Ian Turton for development and GeoSolutions for sponsoring the work.
GeoServer monitor Kafka storageThe monitoring Kafka storage module, developed as part of GEOS-11150, allows storing the requests captured by the monitoring extension into a Kafka topic.

We’d like to thank Simon Hofer for sharing his work with the community. To learn more about the module, how to install and use it, see the user-guide.
JWT HeadersThe JWT headers module has been developed as part of GEOS-11317.

The module is a new authentication filter that can read JWT Headers, as well as general JSON payloads and simple strings, to identify a user, as well as to extract their roles. The combination of Apache mod_auth_openidc with geoserver-jwt-headers-plugin provides an alternative to using the geoserver-sec-oauth2-openid-connect-plugin plugin.
We’d like to thank David Blasby (GeoCat) for this work on this module.
Full Release notesNew Feature:
- GEOS-11225 [AuthKey] AuthKey synchronize the user/group automatically
MapML:
- GEOS-10438 ENTITY_RESOLUTION_ALLOWLIST property not parsing empty setting
- GEOS-11207 Refactor MapML MVC controller as GetMap-based operation with standard parameter format
- GEOS-11221 mkdocs preflight rst fixes
- GEOS-11289 Enable Spring Security Stric [HttpFirewall] by default
- GEOS-11297 Escape WMS GetFeatureInfo HTML output by default
- GEOS-11300 Centralize access to static web files
Improvement:
- GEOS-11130 Sort parent role dropdown in Add a new role
- GEOS-11142 Add mime type mapping for yaml files
- GEOS-11148 Update response headers for the Resources REST API
- GEOS-11149 Update response headers for the Style Publisher
- GEOS-11152 Improve handling special characters in the Simple SVG Renderer
- GEOS-11153 Improve handling special characters in the WMS OpenLayers Format
- GEOS-11155 Add the X-Content-Type-Options header
- GEOS-11173 Default to using [HttpOnly] session cookies
- GEOS-11176 Add validation to file wrapper resource paths
- GEOS-11213 Improve REST external upload method unzipping
- GEOS-11222 Include Conformance Class for “Search” from OGC API - Features Part 5 proposal
- GEOS-11226 Enable JTS OverlayNG by default
- GEOS-11246 Schemaless plugin performance for WFS
- GEOS-11247 Avoid HTML annotations special status in APIBodyProcessor
- GEOS-11248 Move version header handling from APIBodyMethodProcessor to APIDispatcher
- GEOS-11260 JNDI tutorial uses outdated syntax
- GEOS-11288 Improve input validation in ClasspathPublisher
- GEOS-11289 Enable Spring Security Stric [HttpFirewall] by default
- GEOS-11298 When a Raster Attribute Table is available, expose its attributes in GetFeatureInfo
Bug:
- GEOS-11050 jdbc-store broken by changes to Paths.names
- GEOS-11051 Env parametrization does not save correctly in AuthKey extension
- GEOS-11145 The GUI “wait spinner” is not visible any longer
- GEOS-11182 Avoid legends with duplicated entries
- GEOS-11187 Configuring a raster with NaN as NODATA results in two NaN in the nodata band description
- GEOS-11190 GeoFence: align log4j2 deps
- GEOS-11203 WMS GetFeatureInfo bad WKT exception for label-geometry
- GEOS-11224 Platform independent binary doesn’t start properly with default data directory
- GEOS-11250 WFS GeoJSON encoder fails with an exception if an infinity number is used in the geometry
- GEOS-11278 metadata: only selected tab is submitted
- GEOS-11312 Used memory calculation fix on legend WMS request
Task:
- GEOS-11242 Remove the Xalan library
- GEOS-11315 Revert to CORS commented out
- GEOS-11318 Update postgresql to 42.7.2
- GEOS-11134 Feedback on download bundles: README, RUNNING, GPL html files
- GEOS-11141 production consideration for logging configuration hardening
- GEOS-11159 Update mapfish-print-lib 2.3.0
- GEOS-11180 Update ImageIO-EXT to 1.4.9
- GEOS-11181 Update jai-ext to 1.1.25
- GEOS-11186 Fix maven enforcer failFast
- GEOS-11220 Upgrade Hazelcast from 5.3.1 to 5.3.6
- GEOS-11245 Update OSHI from 6.2.2 to 6.4.10
- GEOS-11316 Update Spring version to 5.3.32
Community module development:
- GEOS-11305 Add layer information in the models backing STAC
- GEOS-11146 Fix MBTiles output format test
- GEOS-11184 ncwms module has a compile dependency on gs-web-core test jar
- GEOS-11209 Open ID Connect Proof Key of Code Exchange (PKCE)
- GEOS-11212 OIDC accessToken verification using only JWKs URI
- GEOS-11219 Upgraded mail and activation libraries for SMTP compatibility
- GEOS-11293 Improve performance of wps-lontigudinal-profile
Additional information on GeoServer 2.25 series:
Release notes: ( 2.25-RC )
-
-
18:35
Stefano Costa: Install iosacal with conda
sur Planet OSGeoStarting today, you can install iosacal with conda. This adds to the existing installation procedure with pip. Conda is a good fit for complex projects and has better tooling for reproducibility.
Installing iosacal can be achieved by adding conda-forge to your channels with:
conda config --add channels conda-forge conda config --set channel_priority strictOnce the conda-forge channel has been enabled, iosacal can be installed with conda:
conda install iosacalor with mamba:
mamba install iosacal -
21:39
Fernando Quadro: Curso de GeoNode com inscrições abertas!
sur Planet OSGeoAprenda a montar a sua própria Infraestrutura de Dados Espaciais com o GeoNode, uma plataforma para gestão e publicação de dados geoespaciais que reúne projetos open-source maduros e estáveis sob uma interface consistente e fácil de usar, permitindo que os usuários, compartilhem seus dados de forma rápida e facil.
Este novo curso visa capacitar os profissionais no uso eficiente da plataforma GeoNode, e tem como objetivos:
Familiarizar os participantes com os conceitos fundamentais do Geonode e suas capacidades.
Explorar o funcionamento de servidores de mapas e seus benefícios.
Apresentar os padrões de dados do Open Geospatial Consortium (OGC), como Web Map Service (WMS) e Web Feature Service (WFS), para interoperabilidade geoespacial.
Demonstrar a publicação eficiente de dados no Geonode usando views de bancos de dados geográficos.
Ensinar a integração do Geonode com o QGIS através de plugins. Quer saber mais?
O Curso é oferecido na modalidade EAD Ao Vivo, com uma carga horária de 18 horas divididos em 6 encontros. Porém, essas aulas são gravadas e ficam disponíveis ao aluno por 12 meses em nosso portal do aluno.
Então, se por acaso você não puder comparecer em alguma das aulas ao vivo, não se preocupe, você poderá rever a aula gravada a qualquer momento.
Em comemoração ao aniversário de 12 anos da Geocursos, estamos disponibilizando pra você R$ 100 de desconto, basta utilizar o cupom GEOCURSOS12ANOS
Ficou interessado? -
18:27
Stefano Costa: IOSACal in Google Colab
sur Planet OSGeoGoogle Colab is a popular notebook service that you can run directly from your browser. Python is natively supported and it’s fairly easy to run a Jupyter notebook, even with custom dependencies like Numpy and Matplotlib.
You can run IOSACal in Google Colab! I have added a new short how-to guide in the official documentation. Find the how-to at [https:]] .
This takes advantage of a demo notebook that was contributed by Jelmer Wind.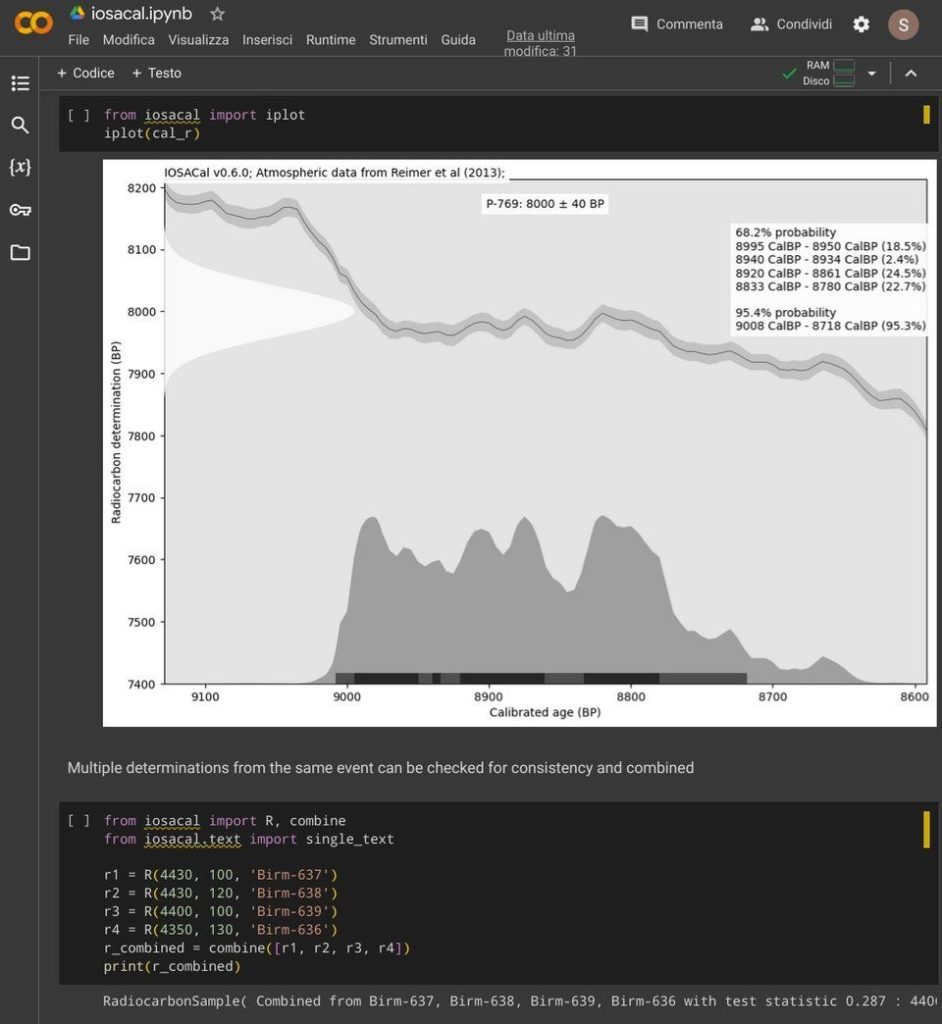 A screenshot of the demo notebook running IOSACal in Google Colab. Even with a plot!
-
19:00
OTB Team: OTB Release 9.0.0
sur Planet OSGeoDear OTB community, We are happy to announce that OTB version 9.0.0 has been released! Ready to use binary packages are available on the package page of the website: The Docker image is available :docker pull orfeotoolbox/otb:9.0.0 It is also possible to checkout the branch with git: git clone [https:] OTB -b release-9.0 The documentation […] -
21:26
Free and Open Source GIS Ramblings: Trajectools 2.0 released ?
sur Planet OSGeoIt’s my pleasure to share with you that Trajectools 2.0 just landed in the official QGIS Plugin Repository.
This is the first version without the “experimental” flag. If you look at the plugin release history, you will see that the previous release was from 2020. That’s quite a while ago and a lot has happened since, including the development of MovingPandas.
Let’s have a look what’s new!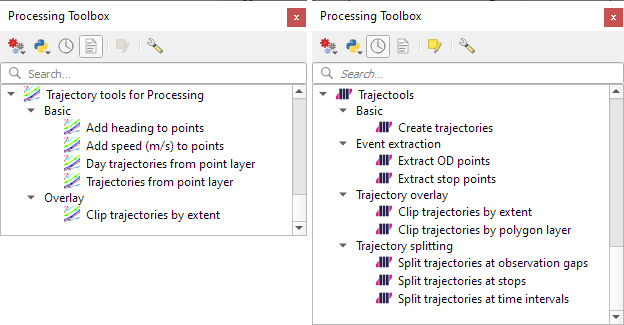
The old “Trajectories from point layer”, “Add heading to points”, and “Add speed (m/s) to points” algorithms have been superseded by the new “Create trajectories” algorithm which automatically computes speeds and headings when creating the trajectory outputs.
“Day trajectories from point layer” is covered by the new “Split trajectories at time intervals” which supports splitting by hour, day, month, and year.
“Clip trajectories by extent” still exists but, additionally, we can now also “Clip trajectories by polygon layer”
There are two new event extraction algorithms to “Extract OD points” and “Extract OD points”, as well as the related “Split trajectories at stops”. Additionally, we can also “Split trajectories at observation gaps”.
Trajectory outputs, by default, come as a pair of a point layer and a line layer. Depending on your use case, you can use both or pick just one of them. By default, the line layer is styled with a gradient line that makes it easy to see the movement direction:

while the default point layer style shows the movement speed:
 How to use Trajectools
Trajectools 2.0 is powered by MovingPandas. You will need to install MovingPandas in your QGIS Python environment. I recommend installing both QGIS and MovingPandas from conda-forge:
(base) conda create -n qgis -c conda-forge python=3.9
(base) conda activate qgis
(qgis) mamba install -c conda-forge qgis movingpandas
The plugin download includes small trajectory sample datasets so you can get started immediately.
OutlookThere is still some work to do to reach feature parity with MovingPandas. Stay tuned for more trajectory algorithms, including but not limited to down-sampling, smoothing, and outlier cleaning.
I’m also reviewing other existing QGIS plugins to see how they can complement each other. If you know a plugin I should look into, please leave a note in the comments.
-
15:17
geomatico: Desarrollo de un gemelo digital para la gestión del agua
sur Planet OSGeoLa escasez de agua en la agricultura, agravada por el cambio climático, amenaza la seguridad alimentaria. Los sistemas de riego eficientes son clave para mitigar estos desafíos, optimizando el uso del agua y fortaleciendo la resiliencia agrícola.
Entre 2022 y 2023 hemos desarrollado un gemelo digital de gestión del agua en agricultura junto al IRTA (Instituto de Investigación y Tecnología Agroalimentaria). En la aplicación web se pueden monitorizar y analizar casi 300 mil parcelas simbolizadas semanalmente por 17 indicadores (unos 250 millones de registros por año) que permiten optimizar la irrigación.
-
22:00
QGIS España: Publicación del libro Introducción a los Sistemas de Información Geográfica con QGIS
sur Planet OSGeoPublicada la Segunda Edición del Libro “Introducción a los Sistemas de Información Geográfica con QGIS” de Federico GazabaUna pregunta recurrente en redes sociales es ¿Dónde puedo encontrar un manual para aprender a usar QGIS? o ¿Cómo puedo iniciarme en el uso de los Sistemas de Información Geográfica (SIG)? Hace aproximadamente 3 años Federico Gazaba publicaba la pimera versión de su libro “Introducción a los Sistemas de Información Geográfica con QGIS” un manual que en su momento fue de referencia obligada para las personas usuarias de QGIS en habla hispana pero que con el paso del tiempo había quedado desactualizado debido a la aparición de nuevas versiones de QGIS.
Recientemente el autor nos comentaba que se estaba preparando una actualización de libro y no nos ha hecho esperar mucho, el 22 de Febrero nos anunciaba en el canal de Telegram de QGIS en español que la versión 2.0 había sido publicada: _“Hola amigos #geoinquietos !. Lo prometido es deuda, les traigo la versión 2.0 de mi libro libre “Introducción a los Sistemas de Información Geográfica con QGIS”. Esta versión actualiza los contenidos de la versión anterior a QGIS 3.34 Prizren.".
El libro ha sido publicado bajo la licencia CC BY-SA 4.0 lo que permite que sea compartido o modificado, para cualquier proposito, con libertad mientras se respete la atribución al autor y se comparta con la misma licencia. Se puede descargar aquí o aquí el repositorio del libro se puede encontrar en GitHub
Este libro es otro ejemplo que demuestra que los proyectos de software libre y open source permiten compartir y colaborar en este tipo de iniciativas donde podemos participar de forma activa y generar grandes sinergias en sus aplicaciones y desarrollos en beneficio, tanto de las comunidades que las desarrollan como las que las usan.
Federico Gazaba es profesor de Matemáticas y Técnico Maestro Mayor de Obras y actualmente es docente en el Instituto de Formación Docente y Técnica 122 “Presidente Illia” de Pergamino (Provincia de Buenos Aires, Argentina) y Director de Sistemas de Información Georreferenciada de la Municipalidad de Pergamino. Desde el año de 2013 es usuario de QGIS y es un entusiasta del las tecnologías libres y de los datos espaciales abiertos. La creación del manual nace de la necesidad de impartir cursos de QGIS a sus colegas de municipalidad y es el resultado de la sistematización de esas enseñanzas. Desde 2016, de forma ininterrumpida, imparte cursos introductorios a los SIG para diferentes instituciones.
Puedes seguir a Federico en la siguientes redes sociales:
-
12:13
Geo-BIM for the Built Environment
sur Open Geospatial Consortium (OGC)OGC holds three Member Meetings each year – one each in Europe, the Americas, and Asia Pacific – where OGC’s Standards Working Groups (SWGs), Domain Working Groups (DWGs), Members, and other geospatial experts meet to progress Standards, provide feedback on initiatives being run by the OGC Collaborative Solutions and Innovation (COSI) Program, hear about the latest happenings at OGC, network with the leaders of the geospatial community, and see what’s coming next. The meetings are open to the public, though there are some closed sessions, and provide a great way to start to get to know – and get involved with – the OGC Community.
The next OGC Member Meeting, OGC’s 128th, will be held at TU Delft on March 25-28, 2024. Fitting for TU Delft and the Netherlands, the theme of the meeting will be ‘Geo-BIM For the Built Environment.’ Meeting sponsorship is generously provided by TU Delft and Geonovum, with support from GeoCAT and digiGO. In the lead up to the event, Geonovum produced a short video highlighting what to expect in Delft.
“In many respects, the Netherlands is the world leader in the use of advanced integration of building data and detailed urban mapping, as well as the use of Open Standards and Open APIs to interface with those data to provide citizen services,” commented Scott Simmons, OGC’s Chief Standards Officer.
“More specifically, TU Delft is a world-leading research institute in Geo-BIM integration, while Geonovum, another meeting sponsor, has done so much to promote the effective use of Open Standards in government & e-government, including documenting proof that Open Standards make things work better, faster, and cheaper.”
Under the theme, the OGC Member Meeting will include several sessions related to the built environment and the integration of Geospatial and Building Information Models (BIM). Such sessions will include: a Geo-BIM Summit that non-members are encouraged to attend; a Built Environment Joint Session; and a Land Administration Special Session.
On top of these, there will be a meeting of the OGC Europe Forum, sessions on Geospatial Reporting Indicators, Observational Data, the ‘Today’s Innovations, Tomorrow’s Technologies’ Future Directions Session, networking opportunities, and the usual host of OGC Working Group meetings on topics ranging from APIs to agriculture, and the sea-floor to space. Most sessions are open to the public, with special encouragement for non-OGC-members to attend the Geo-BIM Summit and any of the Domain Working Group meetings. As always, the opening session will consist of presentations from local organizations that showcase the world-leading geospatial technologies seen in The Netherlands.
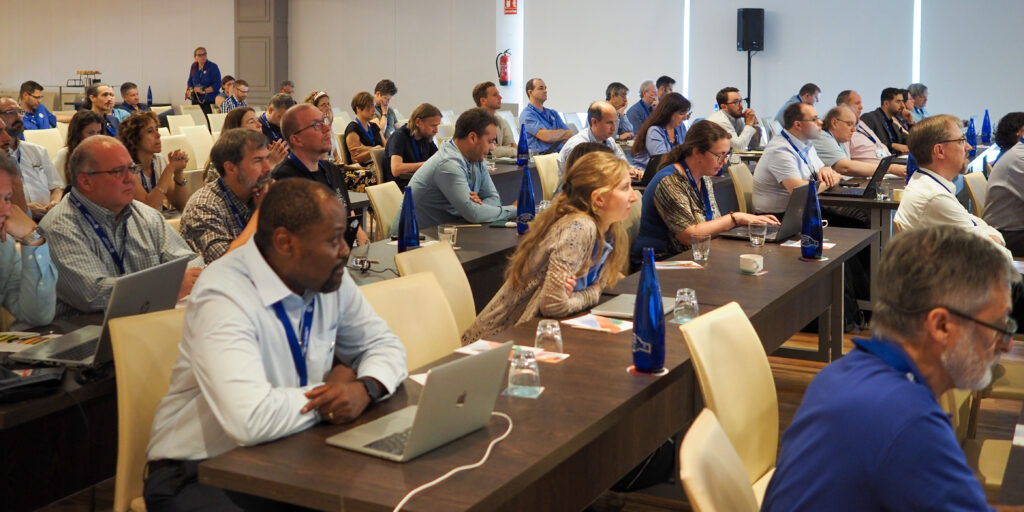
 Dr. Rune Floberghagen, Head of the Science, Applications and Climate Department in the Directorate for Earth Observation Programmes, ESA, was one of the local experts that presented at the opening session of the 125th Member Meeting in Frascati, Italy.
Geo-BIM Summit
Dr. Rune Floberghagen, Head of the Science, Applications and Climate Department in the Directorate for Earth Observation Programmes, ESA, was one of the local experts that presented at the opening session of the 125th Member Meeting in Frascati, Italy.
Geo-BIM Summit
The Geo-BIM Summit will run on Wednesday afternoon and will focus on the integration of geographic data and Building Information Models (BIM).
“In the Building Information Modeling (BIM) world, geographical data about the environment of the construction is becoming increasingly important,” said Prof. Dr. Jantien Stoter, Chair of the OGC 3D Information Management DWG, and part of the organizing committee for the Geo-BIM session. “Similarly, in the Geospatial domain, the need for detailed information about buildings is also growing. There are many initiatives to develop solutions that better facilitate this integration, including projects that realize this integration for a specific use case; automated conversion of data between the two domains; methods to georeference BIM files in a standardized and straightforward way; and profiles for standards that establish the integration for specific use-cases. The Geo-BIM session will present such initiatives in order to address the question of “what more is needed to improve the integration?” This will further shape the OGC & buildingSMART Road Map on integration of both domains, and contribute to the best practices currently under development.”
Built Environment Joint SessionTwo sessions on the Built Environment will run on Wednesday morning. The first is entitled “The Future of Land Infra” and will discuss what more we need to do in the standardization of built infrastructure data, in terms of updating, improving or adding to the OGC Standards Portfolio, and will include input from several OGC activities: the Integrated Digital Built Environment (IDBE) subcommittee, LandAdmin DWG, Model for Underground Data Definition and Integration (MUDDI) SWG; and the Geotech Interoperability Experiment, as well as the wider OGC Collaborative Solutions and Innovation (COSI) Program.
The next session is entitled “What Urban Digital Twins mean to OGC” and will focus on the wider work that OGC is doing in the space and how the Digital Twins DWG can help harmonize it. The session will also include a cross-working-group discussion on the in-progress OGC Urban Digital Twins Position Paper, as well as a presentation by Binyu Lei, researcher at the Urban Analytics Lab at the National University of Singapore, entitled “Humans as Sensors in Urban Digital Twins.”
 Attendees at the 123rd Member Meeting in Madrid, Spain.
Land Admin Special Session
Attendees at the 123rd Member Meeting in Madrid, Spain.
Land Admin Special Session
Following the opening session and keynotes on Monday is a Land Admin special session run by the OGC Land Administration (Land Admin) DWG.
“Worldwide, effective, and efficient land administration is an ongoing concern, inhibiting economic growth and property tenure,” commented Eva-Maria Unger, co-chair of the OGC Land Admin DWG. “Only a limited number of countries globally have a mature land information system.”
The Land Admin Special Session will also be the first meeting of the soon-to-be-formed OGC Land Administration Domain Model (LADM) SWG.
“This is a fairly significant session as we’re going to use it to kick off an effort to create an encoding Standard for Land Administration data that’s globally relevant,” said Scott Simmons. “It’s great to be holding it in Delft because Kadaster, the Netherlands’ Cadaster, Land Registry and Mapping Agency, is one of the world leaders in providing expertise on use of Land Administration and Land Administration modernization across not just Europe but for developing nations around the world. So it’s an opportunity to bring together their expertise along with representatives from all levels of sophistication of land management around the world.”
Peter van Oosterom continued: “The new SWG will work on the Land Administration Domain Model (LADM) Implementation Standard in OGC, which will be included as part 6 of the existing ISO 19152 series of Standards. This sounds modest, but is actually a big step forward. The LADM Standards today are only Conceptual Models, which means that countries implementing them have to find their own solutions for developing their country file, technical encodings, code list values, processes/workflows, etc.
“An open LADM Implementation Standard will not only reduce implementation costs by providing free, proven technical encodings, but would also enable solution vendors to provide commercial off-the-shelf software that works across multiple countries/jurisdictions, rather than having to adapt it to each unique approach.”
Networking, social, and other sessionsIn addition to these sessions, the 128th OGC Member Meeting will also see meetings of over 50 different working groups or committees covering almost the full breadth of geospatial applications and domains, as well as several social and networking events.
Registration remains open, as do sponsorship opportunities. Non-members are encouraged to attend. To see the full agenda, visit ogcmeet.org.
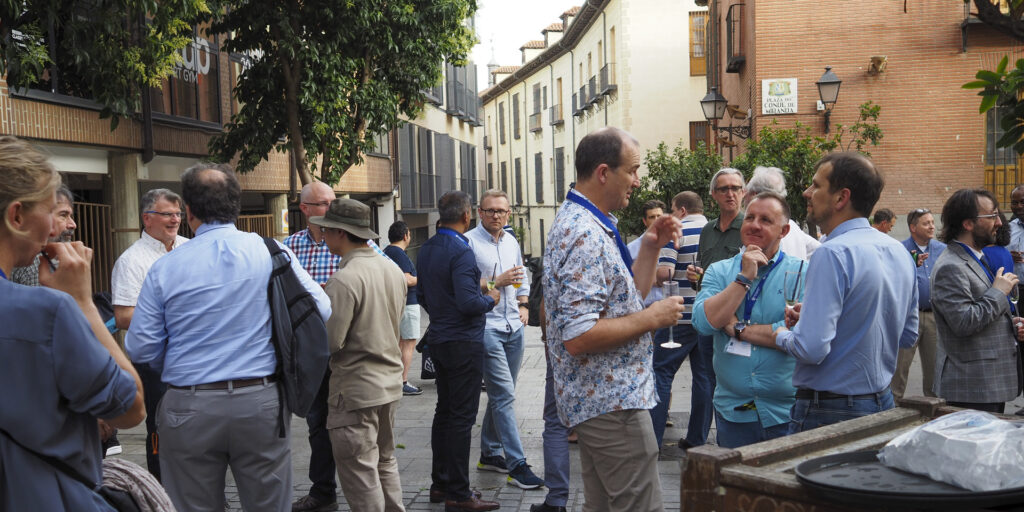 As well as the host of technical content and informative presentations, OGC Member Meetings also include networking events, such as the Wednesday night dinner.
The post Geo-BIM for the Built Environment appeared first on Open Geospatial Consortium.
-
13:30
GeoTools Team: GeoTools 29.5 released
sur Planet OSGeo GeoTools 29.5 releasedThe GeoTools team is pleased to announce the release of the latest maintenance version of GeoTools 29.5:geotools-29.5-bin.zipgeotools-29.5-doc.zipgeotools-29.5-userguide.zipgeotools-29.5-project.zipThis release is also available from the OSGeo Maven Repository and is made in conjunction with GeoServer 2.23.5 and GeoWebCache 1.23.4. We are -
21:17
QGIS Blog: Save the date & call for contributions: QGIS user conference and contributor meeting in Bratislava
sur Planet OSGeoWe are happy to announce that QGIS User Conference will take place on 9-10 September 2024 in Bratislava, Slovakia.
The traditional Contributor Meeting will be held right after the conference on 11-13 September 2024 at the same venue.
Learn more about the user conference and the contributor meeting at the event’s web site: [https:]]
The call for papers for the user conference is now open – you can submit proposals for talks and workshops by 31 March 2024:
[https:]]
We have also started call for sponsors, with sponsorship opportunities at various levels. More details here:
[https:]]
User Conference
The QGIS User Conference is an annual event that brings together users and developers of QGIS. The conference provides an opportunity for attendees to learn about the latest developments in QGIS, share their experiences with others, and network with other QGIS users and
developers.
Contributor Meeting
QGIS Contributor Meetings are volunteer-driven events where contributors to the QGIS project from around the world get together in a common space – usually a university campus. During these events, contributors to the QGIS project take the opportunity to plan their work, hold face-to-face discussions and present new improvements to the QGIS project that they have been working on. Everybody attending the event donates their time to the project for the days of the event.
As a project that is built primarily through online collaboration, these meetings provide a crucial ingredient to the future development of the QGIS project. The event is planned largely as an ‘unconference’ with minimal structured programme planning.For more details and to sign up, please visit the corresponding wiki page [https:]]
-
13:58
Enterprise Products: A Collaborative Journey with OGC
sur Open Geospatial Consortium (OGC)In the ever-evolving realm of energy infrastructure, the success of an organization is often determined by its ability to adapt, innovate, and collaborate effectively. Enterprise Products Partners, L.P. has exemplified these qualities through their ongoing relationship with the Open Geospatial Consortium (OGC).
Under the leadership of Gary Hoover, Enterprise Products’ team of geospatial technology experts has helped develop an open, international geospatial Standard for the pipeline industry, PipelineML, and deployed disruptive open-source geospatial technology.
Doing so helped Enterprise Products optimize the management of their extensive 50,000-mile pipeline network, and supports the larger goal of safe and sustainable energy infrastructure within the oil and gas sector.
Pioneering the PipelineML StandardEnterprise Products became a voting member of OGC in 2013. Shortly after, Data Architect John Tisdale rolled up his sleeves and got to work, learning OGC’s consensus-based Standards process and serving as a charter member and co-chair of the PipelineML Standards Working Group (SWG). In 2019, the PipelineML Conceptual and Encoding Model Standard was approved by the OGC Membership, making it an official OGC Standard.
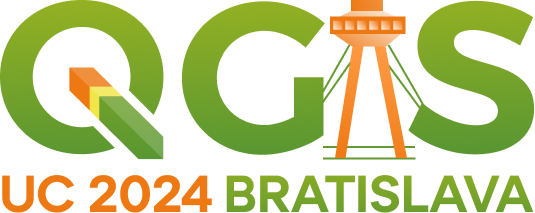
The PipelineML Standard – collaboratively developed by Enterprise Products and contributors from across the US, Canada, Belgium, Norway, Netherlands, UK, Germany, Australia, Brazil, and Korea – defines concepts that support the interoperable interchange of data related to oil and gas pipeline systems. PipelineML addresses two critical business use cases specific to the pipeline industry: new construction surveys and pipeline rehabilitation.
The Standard defines individual pipeline components, provides support for lightweight data aggregation, and provides a mechanism for extensions focused on safety and sustainability through effective data management practices. By working with OGC’s Land and Infrastructure Domain Working Group, PipelineML was aligned with related Standards that ensure compatibility with future land management requirements.
 Three use-cases addressed by the OGC PipelineML Standard.
A Step Towards Modernization
Three use-cases addressed by the OGC PipelineML Standard.
A Step Towards Modernization
June 26, 2023, marked a significant milestone in Enterprise Products’ technical history: in partnership with select technology vendors, the company implemented open-source technology to revamp their existing Asset Information Management (AIM) Program.
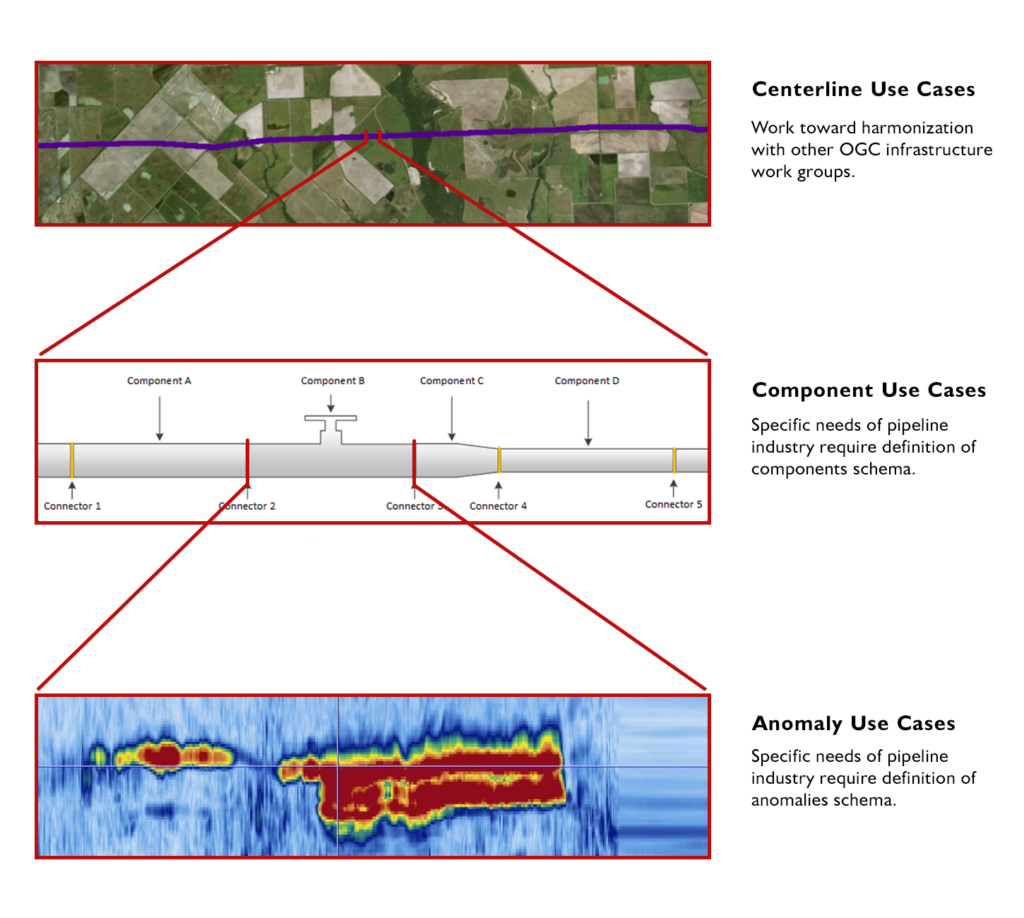
To move off the legacy PODS data model and a dependence on proprietary software, the Enterprise Products team spent years developing, prototyping, and refining the Pipeline Component Data Model (PCDM). Instead of utilizing an ageing linear referencing methodology, PCDM leverages modern geospatial technologies to gather GPS coordinates in the field that accurately mark the real-world location of pipeline components. This “Digital Twin” approach makes PCDM more adaptable to evolving business requirements.
Emerging from this initiative, the AIM Data Architecture Platform and Development Framework now provides data and services that serve as the lifeblood of the organisation.
The Pillars of Value-addingEnterprise Products’s Asset Data Management group has played a vital role in elevating the company’s performance with contributions that have rippled across the organization to deliver tangible value in several areas:
Standards & GovernanceTo facilitate seamless information exchange across business units and external service providers, Enterprise Products has established stringent data standards and governance protocols that ensure consistent and accurate data for decision-making. By aligning their asset data with OGC Standards, Enterprise Products has established a universal language for geospatial data that simplifies communication and interoperability.
Data IntegrationIncorporating integrated inline inspection data has been pivotal in maintaining the integrity of Enterprise Products’ extensive pipeline network. The AIM Data Architecture Platform functions as a nexus for data integration that enables a seamless flow of information across departments that promotes collaboration and efficiency.
Spatio-temporal AnalyticsThe integration of spatio-temporal analytics has introduced a new dimension to Enterprise Products’ pipeline management. Real-time geospatial insights have not only improved operational efficiency but have also fostered proactive problem solving. By incorporating database-native geoprocessing, Enterprise Products has streamlined analytical workflows and enhanced the speed and accuracy of decision-making.
Data DeliverabilityEnterprise Products has democratized data access within the organization by creating a map-based interface that provides intuitive visualisations and reports that empower stakeholders to make informed decisions. This map-based interface supports over 1200 individual users across various departments, including Asset Integrity, Business Development, Field Operations, and Public Awareness.
Safety and SustainabilitySpanning the pipeline asset life-cycle from new construction to divestitures, the AIM Data Architecture supports several Safety and Sustainability programs that ensure safe, reliable operations. Programs such as Public Awareness, OneCall (aka 811 “Call Before You Dig”), Inline Inspections, Pipeline Rehabilitation, Regulatory Compliance, Integrity Assessments, and Field Operations all depend on highly available asset information.
 Rather than linear referencing, Enterprise Products uses GPS coordinates to accurately mark the real-world location of pipeline components.
Scaling for the Future
Rather than linear referencing, Enterprise Products uses GPS coordinates to accurately mark the real-world location of pipeline components.
Scaling for the Future
The volume, variety, and velocity of data required to manage and optimize large pipeline networks presents substantial challenges. However, Enterprise Products’ open architecture effortlessly manages the scale of their installation and provides ample room for growth. To put this into perspective, consider the following statistics:
- 50,000 Miles of Pipeline
- 2,500 Facilities
- 5.6 million Pipe Components
- 45 million rows of inline inspection data – 30 years’ worth
- 80 million Rows of geospatially referenced data, with 10x better lossless compression over the legacy proprietary system
One of the most striking aspects of Enterprise Products’ journey is their embrace of Open Standards and Open Source technology. The AIM Data Architecture Platform represents a complete departure from proprietary systems. Key standards and technologies used by Enterprise Products include PipelineML, GeoServer, QGIS, PostgreSQL, PostGIS Spatial Extender, Python & other open libraries, and XML, GML, JSON, & GeoJSON encoded schemas.
This strategic shift not only reduced dependence on commercial vendors and licensing costs, but also established Enterprise Products as an industry pioneer that set a new standard for innovation and interoperability.
OGC Membership: A Driving ForceEnterprise Products’ journey is a compelling story of innovation and progress, with the OGC Community playing a pivotal role. Through collaborative efforts and a steadfast commitment to OGC’s consensus-based process, Enterprise Products led the development of the PipelineML Standard that has proven vital to optimizing the management of Enterprise Products’ extensive pipeline network.
Working with OGC has provided Enterprise Products with a significant competitive advantage, allowing them to leverage the collective knowledge and resources of the international geospatial community. Their journey underscores the transformative potential when industry leaders partner with organizations like OGC to drive positive change. As the world continues to seek sustainable and efficient energy infrastructure, Enterprise Products serves as a prime example of what is achievable when technology, data, and partnerships come together.
The post Enterprise Products: A Collaborative Journey with OGC appeared first on Open Geospatial Consortium.
-
2:00
Camptocamp: Coopterr, territorial cooperation platform based on Rennes Métropole's digital twin
sur Planet OSGeoPièce jointe: [télécharger]
Coopterr, Rennes Métropole's territorial cooperation platform, is now online. It offers a first service to citizens, enabling them to consult electromagnetic wave exposure measurements and identify radioelectric sites in the city of Rennes. -
2:00
GeoServer Team: GeoServer 2.23.5 Release
sur Planet OSGeoGeoServer 2.23.5 release is now available with downloads (bin, war, windows), along with docs and extensions.
This is the last planned maintenance release of GeoServer 2.23.x, providing existing installations with minor updates and bug fixes. Sites using the 2.23.x series are encouraged to upgrade to GeoServer 2.24.x, or eventually wait next month, for the 2.25.0 release, and upgrade their installation, with the help of the upgrade guide.
GeoServer 2.23.5 is made in conjunction with GeoTools 29.5, and GeoWebCache 1.23.4.
Thanks to Andrea Aime (GeoSolutions) for making this release.
Release notesNew Feature:
- GEOS-11225 AuthKey synchronize the user/group automatically
- GEOS-11279 metadata: allow same field on multiple tabs
Improvement:
- GEOS-11213 Improve REST external upload method unzipping
- GEOS-11246 Schemaless plugin performance for WFS
- GEOS-11260 JNDI tutorial uses outdated syntax
- GEOS-11276 Use style_body to define CSS style for a layer
- GEOS-11288 Improve input validation in ClasspathPublisher
Bug:
- GEOS-11174 GWC rest api returns erroneous truncated response when gzip http encoding is enabled
- GEOS-11205 Layer page: style image fails if it is in isolated workspace
- GEOS-11250 WFS GeoJSON encoder fails with an exception if an infinity number is used in the geometry
- GEOS-11255 Multiple inserts in WPS with different idGen strategies does not work
- GEOS-11256 Cannot retrieve LegendGraphic from a PostGIS datastore with ‘hideEmptyRules’ and ‘Support on the fly geometry simplification’ enabled
- GEOS-11278 metadata: only selected tab is submitted
- GEOS-11285 GWC REST Content-Encoding gzip returns broken response
- GEOS-11291 GeoFence: Cleanup stale log4j references
For the complete list see 2.23.5 release notes.
Community UpdatesCommunity module development:
- GEOS-10933 keycloak logout NPE
- GEOS-11290 With Oauth enabled, anon users get random auth requests
Community modules are shared as source code to encourage collaboration. If a topic being explored is of interest to you, please contact the module developer to offer assistance.
About GeoServer 2.23 SeriesAdditional information on GeoServer 2.23 series:
- GeoServer 2.23 User Manual
- Drop Java 8
- GUI CSS Cleanup
- Add the possibility to use fixed values in Capabilities for Dimension metadata
- State of GeoServer 2.23
- GeoServer Feature Frenzy 2023
- GeoServer used in fun and interesting ways
- GeoServer Orientation
Release notes: ( 2.23.5 | 2.23.4 | 2.23.3 | 2.23.2 | 2.23.1 | 2.23.0 | 2.23-RC1 )
-
21:09
QGIS Blog: QGIS Grants #9: Call for Grant Proposals 2024
sur Planet OSGeoDear QGIS Community,
We are very pleased to announce that this year’s round of grants is now available. The call is open to anybody who wants to make a contribution to QGIS funded by our grant fund, subject to the call conditions outlined in the application form.
The deadline for this round is in four weeks, on 14 March 2024.
There are no new procedures in 2024. Please note the following guidelines established in previous years:
- The proposal must be submitted as a ‘QEP’ (QGIS Enhancement Proposal) issue in the repo: [https:]] (tagged as Grant-2024). Following this approach will allow people to ask questions and provide public feedback on individual proposals.
- Proposals must clearly define the expected final result so that we can properly assess if the goal of the proposal has been reached.
- The project budgets should account for PR reviewing expenses to ensure timely handling of the project-related PRs and avoid delays caused by relying on reviewer volunteer time.
- In the week after the QEP discussion period, the proposal authors are expected to write a short summary of the discussion that is suitable for use as a basis on which voting members make their decisions.
The PSC of QGIS.ORG will examine the proposals and has veto power in case a proposal does not follow guidelines or is not in line with project priorities.
For more details, please read the introduction provided in the application form.
We look forward to seeing all your great ideas for improving QGIS!
-
2:00
EOX' blog: Open Science Catalog
sur Planet OSGeoJust like the European Space Agency (ESA), we advocate for and actively support Open Science, as we believe in the significance of collaborative efforts in advancing scientific knowledge and addressing global challenges. We acknowledge the transformative power of Open Science in driving interdiscipl ... -
5:19
XYCarto: Projection Grid
sur Planet OSGeoThere are times when I need a regular grid for an entire projection extent. Meaning, for the extent of an entire projection, I need to create a regular grid of uniform tiles across the projection. In past projects, these grids have been very helpful for data alignment and clipping data into uniform shapes and sizes. This has proved especially helpful in Machine Learning pipelines where I need to ensure pixel to pixel alignments between rasters in a specified location.
Gridding, tiling, and indexing type work has been around forever in geospatial, so there is not much to say about the method. Basically, you take an extent and cut it up into a grid. In this case, the extent is for an entire projection.
I built a repository on Github and a quick method to do this via one command.
make build-grid epsg="EPSG:2193" width=1000 height=1000For this method, the width and height are the desired grid cell size. The units are the units for the projection. EPSG:2193 (NZTM) is in metre units, so running the command above will make a grid of the NZTM projection populated with 1000m by 1000m cells.
The GitHub repository can be run using the Make/Docker method or users can access the python script directly using:
python3 create-grid.py EPSG:2193 1000 1000In order to do so, you will need to have installed:
- GDAL
- GeoPandas
- PyProj
- Shapely
Happy mapping!
-
4:29
GeoSolutions: GeoNode 4.2 is out + Free GeoNode Webinar
sur Planet OSGeoPièce jointe: [télécharger]
You must be logged into the site to view this content.
-
2:00
PostGIS Development: PostGIS Patch Releases
sur Planet OSGeoThe PostGIS development team is pleased to provide bug fix releases for 3.4.2, 3.3.6, 3.2.7, 3.1.11, 3.0.11, and 2.5.11. Please refer to the links above for more information about the issues resolved by these releases. -
14:55
Oslandia: Software quality in QGIS
sur Planet OSGeoAccording to the definition of software quality given by french Wikipedia
An overall assessment of quality takes into account external factors, directly observable by the user, as well as internal factors, observable by engineers during code reviews or maintenance work.
I have chosen in this article to only talk about the latter. The quality of software and more precisely QGIS is therefore not limited to what is described here. There is still much to say about:
- Taking user feedback into account,
- the documentation writing process,
- translation management,
- interoperability through the implementation of standards,
- the extensibility using API,
- the reversibility and resilience of the open source model…
These are subjects that we care a lot and deserve their own article.
I will focus here on the following issue: QGIS is free software and allows anyone with the necessary skills to modify the software. But how can we ensure that the multiple proposals for modifications to the software contribute to its improvement and do not harm its future maintenance?
Self-disciplineAll developers contributing to QGIS code doesn’t belong to the same organization. They don’t all live in the same country, don’t necessarily have the same culture and don’t necessarily share the same interests or ambitions for the software. However, they share the awareness of modifying a common good and the desire to take care of it.
This awareness transcends professional awareness, the developer not only has a responsibility towards his employer, but also towards the entire community of users and contributors to the software.
This self-discipline is the foundation of the quality of the contributions of software like QGIS.
However, to err is human and it is essential to carry out checks for each modification proposal.
Automatic checksWith each modification proposal (called Pull Request or Merge Request), the QGIS GitHub platform automatically launches a set of automatic checks.
Example of proposed modification
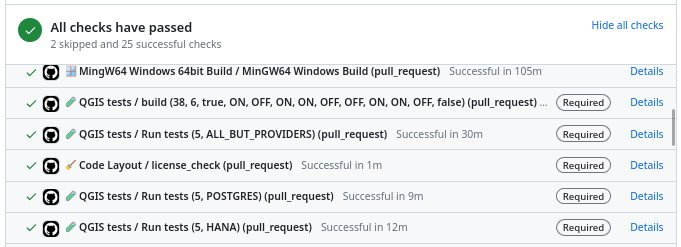
Result of automatic checks on a modification proposal
The first of these checks is to build QGIS on the different systems on which it is distributed (Linux, Windows, MacOS) by integrating the proposed modification. It is inconceivable to integrate a modification that would prevent the application from being built on one of these systems.
The testsThe first problem posed by a proposed modification is the following “How can we be sure that what is going to be introduced does not break what already exists?”
To validate this assertion, we rely on automatic tests. This is a set of micro-programs called tests, which only purpose is to validate that part of the application behaves as expected. For example, there is a test which validates that when the user adds an entry in a data layer, then this entry is then present in the data layer. If a modification were to break this behavior, then the test would fail and the proposal would be rejected (or more likely corrected).
This makes it possible in particular to avoid regressions (they are very often called non-regression tests) and also to qualify the expected behavior.
There are approximately 1.3 Million lines of code for the QGIS application and 420K lines of test code, a ratio of 1 to 3. The presence of tests is mandatory for adding functionality, therefore the quantity of test code increases with the quantity of application code.
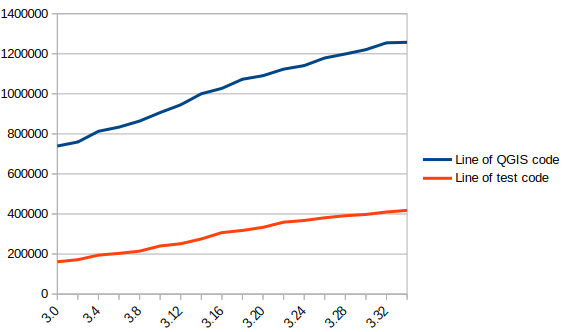
In blue the number of lines of code in QGIS, in red the number of lines of tests
There are currently over 900 groups of automatic tests in QGIS, most of which run in less than 2 seconds, for a total execution time of around 30 minutes.
We also see that certain parts of the QGIS code – the most recent – are better covered by the tests than other older ones. Developers are gradually working to improve this situation to reduce technical debt.
Code checksAnalogous to using a spell checker when writing a document, we carry out a set of quality checks on the source code. We check, for example, that the proposed modification does not contain misspelled words or “banned” words, that the API documentation has been correctly written or that the modified code respects certain formal rules of the programming language.
We recently had the opportunity to add a check based on the clang-tidy tool. The latter relies on the Clang compiler. It is capable of detecting programming errors by carrying out a static analysis of the code.
Clang-tidy is, for example, capable of detecting “narrowing conversions”.

Example of detecting “narrowing conversions”
In the example above, Clang-tidy detects that there has been a “narrowing conversion” and that the value of the port used in the network proxy configuration “may” be corrupted. In this case, this problem was reported on the QGIS issues platform and had to be corrected.
At that time, clang-tidy was not in place. Its use would have made it possible to avoid this anomaly and all the steps which led to its correction (exhaustive description of the issue, multiple exchanges to be able to reproduce it, investigation, correction, review of the modification), meaning a significant amount of human time which could thus have been avoided.
Peer reviewA proposed modification that would validate all of the automatic checks described above would not necessarily be integrated into the QGIS code automatically. In fact, its code may be poorly designed or the modification poorly thought out. The relevance of the functionality may be doubtful, or duplicated with another. The integration of the modification would therefore potentially cause a burden for the people in charge of the corrective or evolutionary maintenance of the software.
It is therefore essential to include a human review in the process of accepting a modification.
This is more of a rereading of the substance of the proposal than of the form. For the latter, we favor the automatic checks described above in order to simplify the review process.
Therefore, human proofreading takes time, and this effort is growing with the quantity of modifications proposed in the QGIS code. The question of its funding arises, and discussions are in progress. The QGIS.org association notably dedicates a significant part of its budget to fund code reviews.
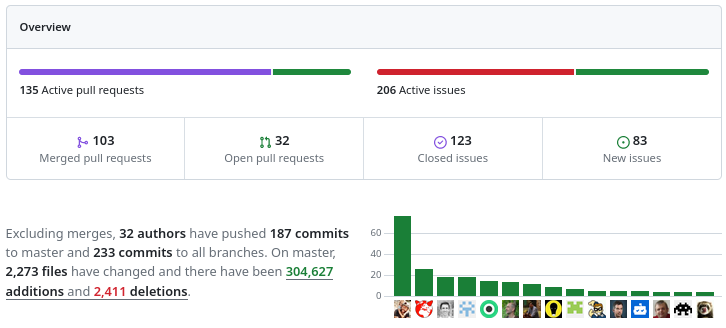
More than 100 modification proposals were reviewed and integrated during the month of December 2023. More than 30 different people contributed. More than 2000 files have been modified.
Therefore the wait for a proofreading can sometimes be long. It is also often the moment when disagreements are expressed. It is therefore a phase which can prove frustrating for contributors, but it is an important and rich moment in the community life of a free project.
To be continued !
As a core QGIS developer, and as a pure player OpenSource company, we believe it is fundamental to be involved in each step of the contribution process.
We are investing in the review process, improving automatic checks, and in the QGIS quality process in general. And we will continue to invest in these topics in order to help make QGIS a long-lasting and stable software.
If you would like to contribute or simply learn more about QGIS, do not hesitate to contact us at infos+qgis@oslandia.com and consult our QGIS support proposal.
-
18:00
Paul Ramsey: Building the PgConf.Dev Programme
sur Planet OSGeoUpdate: The programme is now public.
The programme for pgconf.dev in Vancouver (May 28-31) has been selected, the speakers have been notified, and the whole thing should be posted on the web site relatively soon.

I have been on programme committees a number of times, but for regional and international FOSS4G events, never for a PostgreSQL event, and the parameters were notably different.
The parameter that was most important for selecting a programme this year was the over 180 submissions, versus the 33 available speaking slots. For FOSS4G conferences, it has been normal to have between two- and three-times as many submissions as slots. To have almost six-times as many made the process very difficult indeed.
Why only 33 speaking slots? Well, that’s a result of two things:
- Assuming no more than modest growth over the last iteration of PgCon, puts attendence at around 200, which is the size of our plenary room. 200 attendees implies no more than 3 tracks of content.
- Historically, PostgreSQL events use talks of about 50 minutes in length, within a one hour slot. Over three tracks and two days, that gives us around 33 talks (with slight variations depending on how much time is in plenary, keynotes or lightning talks).
The content of those 33 talks falls out from being the successor to PgCon. PgCon has historically been the event attended by all major contributors. There is an invitation-only contributors round-table on the pre-event day, specifically for the valuable face-to-face synch-up.

Given only 33 slots, and a unique audience that contains so many contributors, the question of what pgconf.dev should “be” ends up focussed around making the best use of that audience. pgconf.dev should be a place where users, developers, and community organizers come together to focus on Postgres development and community growth.
That’s why in addition to talks about future development directions there are talks about PostgreSQL coding concepts, and patch review, and extensions. High throughput memory algorithms are good, but so is the best way to write a technical blog entry.
Getting from 180+ submissions to 33 selections (plus some stand-by talks in case of cancellations) was a process that consumed three calls of over 2 hours each and several hours of reading every submitted abstract.
The process was shepherded by the inimitable Jonathan Katz.
- A first phase of just coding talks as either “acceptable” or “not relevant”. Any talks that all the committee members agreed was “not relevant” were dropped from contention.
- A second phase where each member picked 40 talks from the remaining set into a kind of “personal program”. The talks with just one program member selecting them were then reviewed one at a time, and that member would make the case for them being retained, or let them drop.
- A winnow looking for duplicate topic talks and selecting the strongest, or encouraging speakers to collaborate.
- A third “personal program” phase, but this time narrowing the list to 33 talks each.
- A winnow of the most highly ranked talks, to make sure they really fit the goal of the programme and weren’t just a topic we all happened to find “cool”.
- A talk by talk review of all the remaining talks, ensuring we were comfortable with all choices, and with the aggregate make up of the programme.
The programme committee was great to work with, willing to speak up about their opinions, disagree amicably, and come to a consensus.

Since we had to leave 150 talks behind, there’s no doubt lots of speakers who are sad they weren’t selected, and there’s lots of talks that we would have taken if we had more slots.
If you read all the way to here, you must be serious about coming, so you need to register and book your hotel right away. Spaces are, really, no kidding, very limited.
-
13:03
Oslandia: (Fr) Rencontres QGIS-fr – Grenoble 27 & 28 mars 2024
sur Planet OSGeoSorry, this entry is only available in French.
-
2:00
SourcePole: Designing QGIS Cloud QWC2 with CSS
sur Planet OSGeoIn an earlier post, I showed how it is possible to permanently position a legend in the QGIS Cloud map as part of a QGIS Cloud Pro subscription. To achieve this, the appearance of the map view was changed using CSS. In this post, I will describe exactly what this is and how it works. The appearance of the QGIS Cloud Web Client is controlled via CSS. CSS stands for Cascading Style Sheets. -
10:00
Lutra consulting: New point clouds and mesh features in QGIS 3.36
sur Planet OSGeoQGIS 3.36 is round the corner and as usual, there will be several new exciting features with the new release. Below is the list of features our team has added to the new release. This was made possible by generous funding from clients.
Render point clouds as a surface in 2D map viewsPoint clouds are rendered as individual points by default. Depending on the zoom level and density of the points, you might not be able to get a full picture of the map.
Rendering points as surface enables you to have a better understanding of the data before trying to do any analysis or processing. This has been possible in 3D map views for a couple of QGIS releases, now we have added the functionality also in 2D map views.
The feature generates a surface using triangulation on-the-fly from the points using the same symbology. Below you can see the difference between a point cloud rendered as individual points and rendered as a surface:
Point clouds as individual points vs. as a TIN surface
The good news is that rendering as a surface also works well with global map shading, allowing users to get a nice hillshade:
Point clouds as surface with hillshade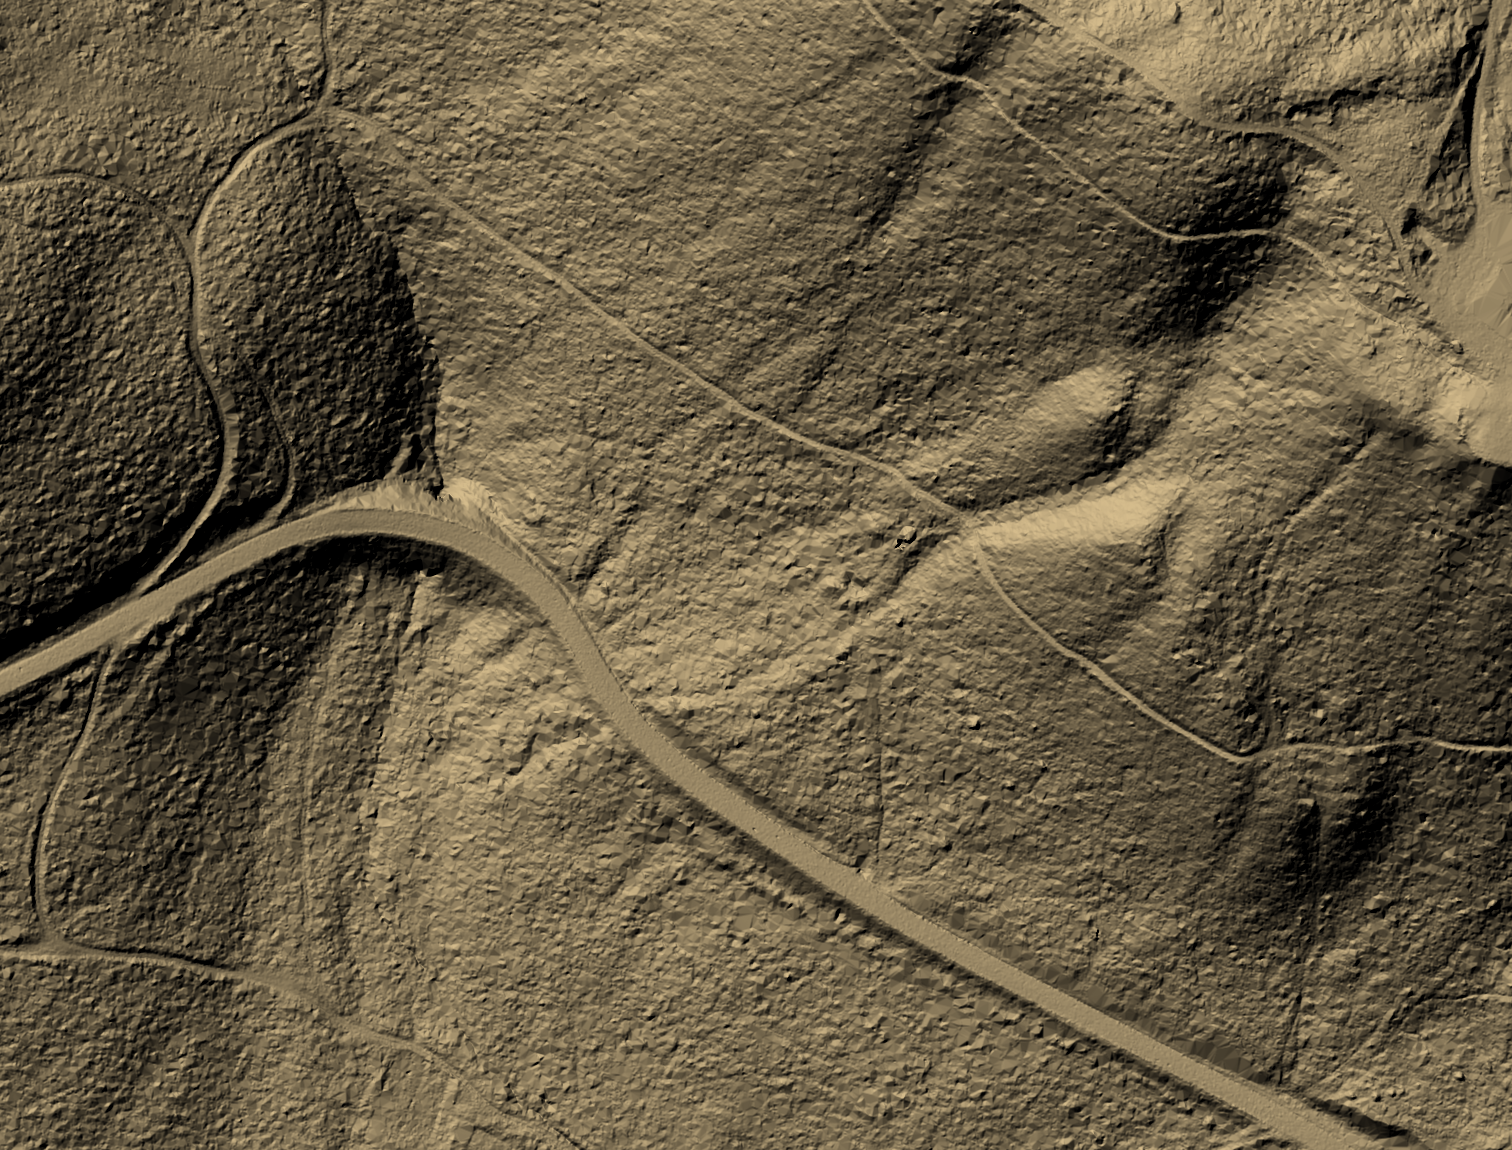
To enable this feature, you need to check the option for Render as a Surface (Triangulate) under the Layer Styling panel.
Settings to display point clouds as surface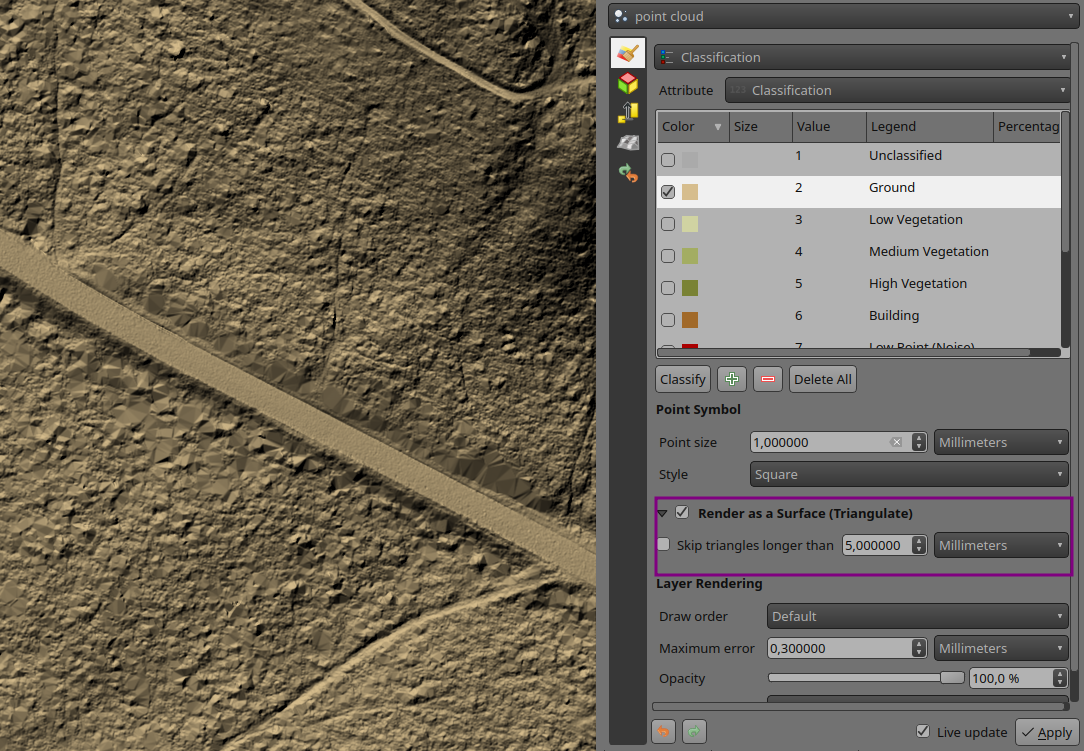
Pro-tip: if the on-the-fly rendering as a surface takes too long to render, try increasing the Maximum error: for example 0.6 mm instead of the default 0.3 mm.
Flexible styling of classesPreviously, point cloud data visualisation in QGIS was limited to rendering all points with a uniform size and opacity. This made it difficult to differentiate between different point classes and highlight specific features of interest. To address this issue, we have introduced a new feature that allows users to customise the point size and opacity for each point cloud data class. This provides a flexible way for visualising point cloud data, allowing users to highlight specific point classes, e.g. by increasing the point size.
Assigning size and opacity to each point cloud class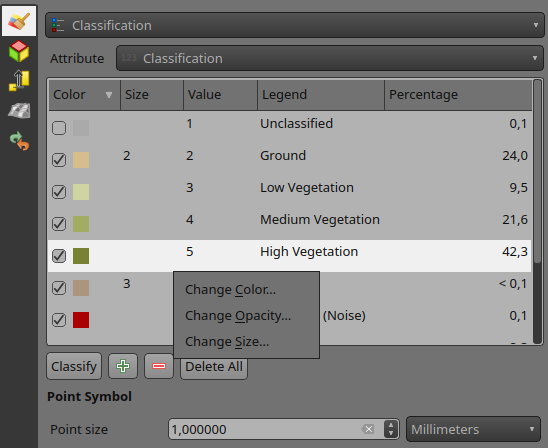
Point clouds with different sizes and opacity levels Set 3D map view extent in 2D map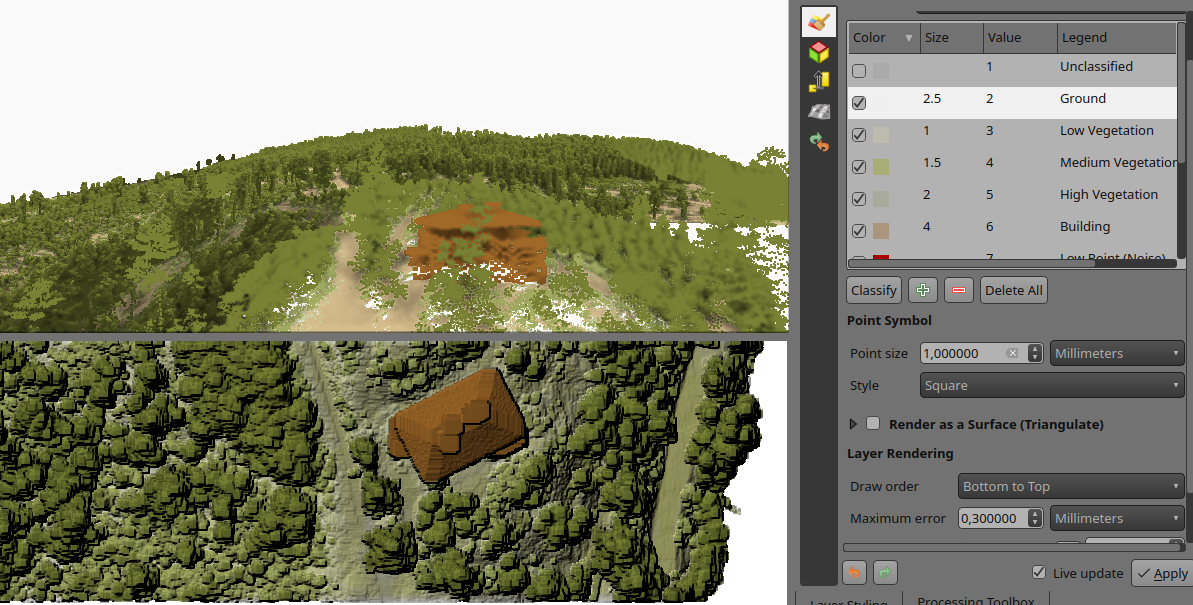
Effectively navigating and visualising large-scale 3D datasets can be challenging on PCs with limited resources. To address this issue, we introduced a new feature that allows users to interactively limit the 3D scene, enabling them to focus on specific areas of interest. This new feature, conveniently accessible from the toolbar, eliminates the need for tedious manual entry of coordinates for bounding boxes. Instead, users can simply drag and draw a box around the desired area, instantly restricting the 3D scene to that specific extent. This interactive approach significantly enhances the user experience and streamlines the process of exploring and analysing 3D data:
Interactive selection of 3D map scene from 2D map Python API for 3D views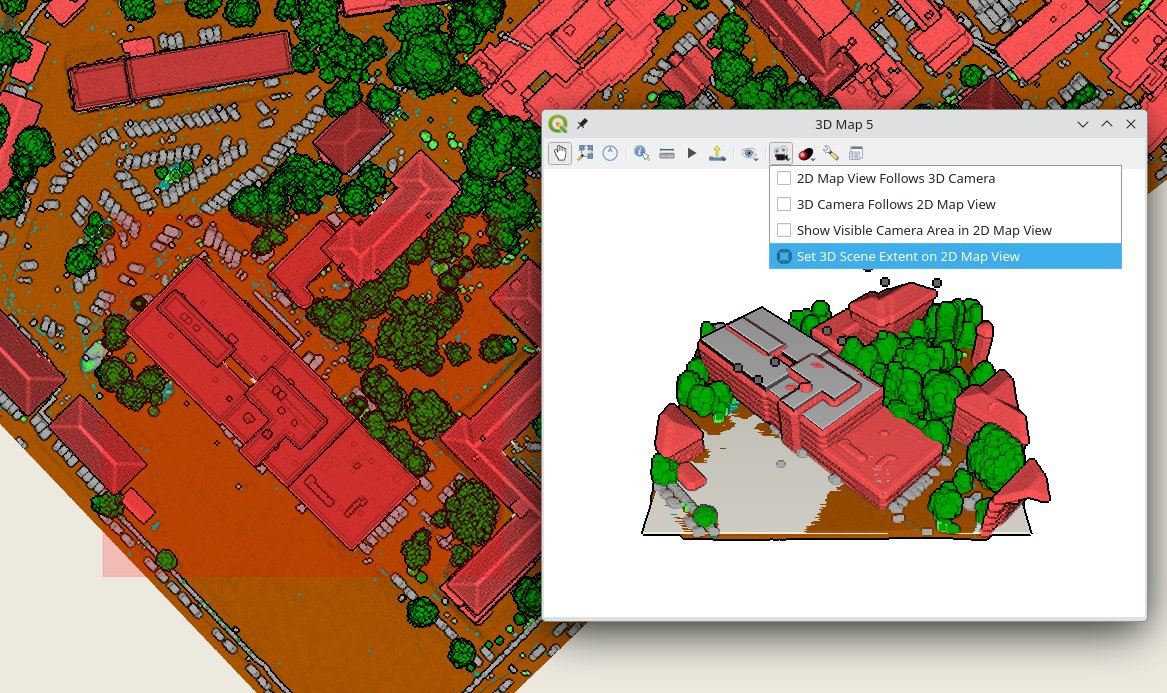
Creating and viewing 3D maps in QGIS with the correct camera location and angle, scene tilt, light, and other parameters can be a time-consuming and error-prone process. This is because it requires users to manually adjust these settings, often through trial and error. However, with the introduction of the new 3D map view API in QGIS, Python plugins can now automate this process, making it much easier, consistent and more efficient to create high-quality 3D maps that are visually appealing and informative.
# List all open 3D map canvases
iface.mapCanvases3D()
# [<qgis._3d.Qgs3DMapCanvas object at 0x7f23491b5e10>]
canvas = iface.mapCanvases3D()[0]
Now let’s try something more complicated:
# Let's change some settings!
ms = canvas.mapSettings()
ms.setEyeDomeLightingEnabled(True)
ms.setBackgroundColor(QColor('beige'))
ms.setTerrainMapTheme('dtm')
ms.setFieldOfView(110)

# Move the camera to look at specific map coordinates in layer's CRS
cam = canvas.cameraController()
mapPoint = QgsVector3D(-498175.92, -1205400.58, 210)
worldPoint = ms.mapToWorldCoordinates(mapPoint)
cam.setLookingAtPoint(worldPoint, 60, 45, 100)

# Create four new 3D map views
c1 = iface.createNewMapCanvas3D('South View')
c2 = iface.createNewMapCanvas3D('West View')
c3 = iface.createNewMapCanvas3D('North View')
c4 = iface.createNewMapCanvas3D('East View')

# Apply settings to all open 3D map views
for canvas in iface.mapCanvases3D():
	canvas.mapSettings().setEyeDomeLightingEnabled(True)

# Define a camera pose to update the views' cameras
pose = QgsCameraPose()
pose.setCenterPoint(QgsVector3D(0, 210, 0))  # This is in 3D world coordinates
pose.setDistanceFromCenterPoint(100)
pose.setPitchAngle(75)  # Tilt the camera by 75 degrees
pose.setHeadingAngle(0)  # Looking towards North
c1.cameraController().setCameraPose(pose)
pose.setHeadingAngle(90)  # Towards East
c2.cameraController().setCameraPose(pose)
pose.setHeadingAngle(180)  # Towards South
c3.cameraController().setCameraPose(pose)
pose.setHeadingAngle(270)  # Towards West
c4.cameraController().setCameraPose(pose)

# We can set the 3D map views 2D extent to always match the main 2D canvas one
# Our 3D views get updated while zooming/panning the main 2D canvas
canvas = iface.mapCanvas()
canvas.extentsChanged.connect(lambda :c1.mapSettings().setExtent(canvas.extent()))
canvas.extentsChanged.connect(lambda :c2.mapSettings().setExtent(canvas.extent()))
canvas.extentsChanged.connect(lambda :c3.mapSettings().setExtent(canvas.extent()))
canvas.extentsChanged.connect(lambda :c4.mapSettings().setExtent(canvas.extent()))
Changing 3D view settings through Python More point clouds attributes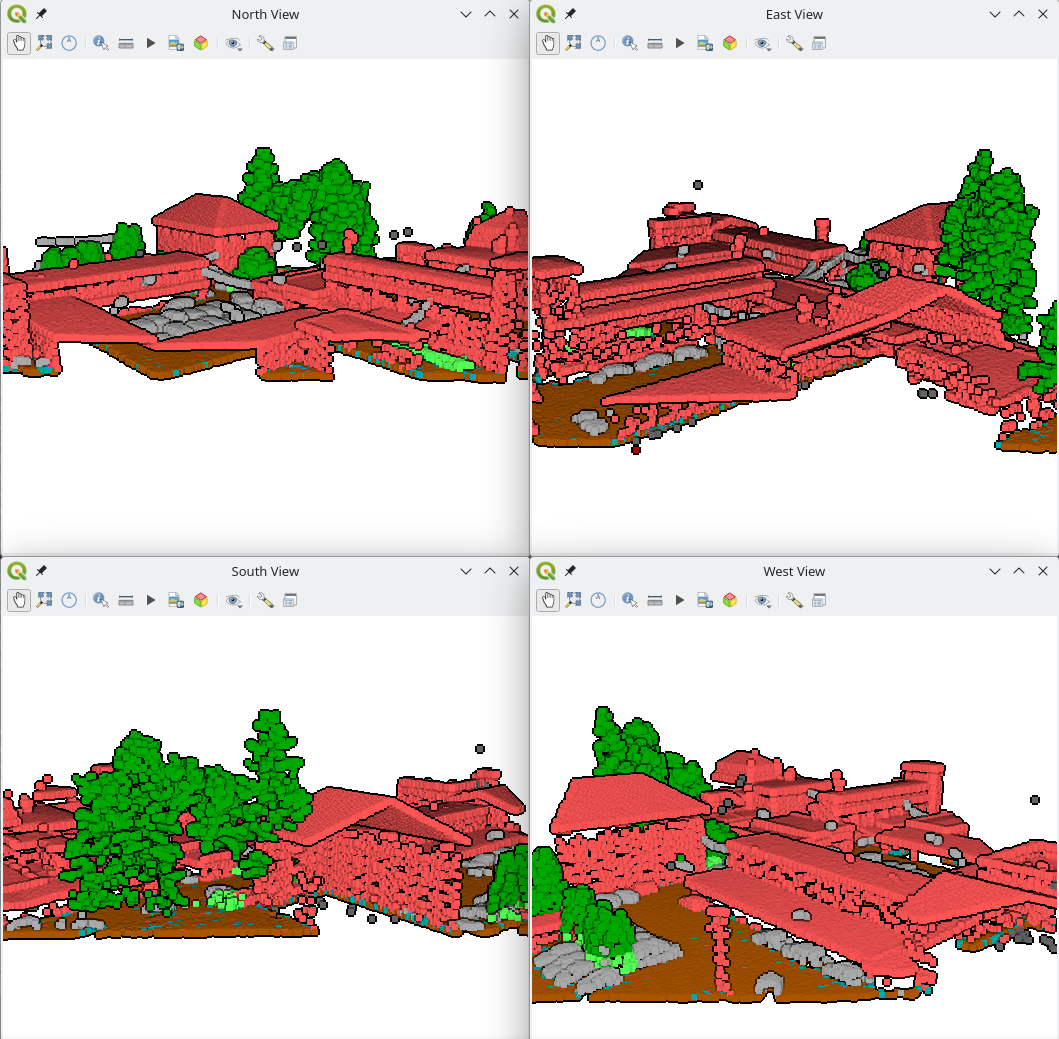
LAS/LAZ/COPC point clouds have a
classificationFlagsattribute that stores four types of information (Synthetic, Keypoint, Withheld, and Overlap) in a single value. This saves space, but it makes it difficult to use the information for styling or filtering, as you need to write complex expressions.To make it easier to use, we are following the approach introduced in PDAL 2.6: the
Performance enhancement for renderingclassificationFlagsattribute gets replaced with four separate attributes: Synthetic, Keypoint, Withheld, and Overlap. This will make it easier to include these attributes in styling and filtering expressions.To improve the performance of point cloud rendering in QGIS, we introduced a new caching system to minimise the need for repeated decompression of LAS node data while panning or zooming. This caching mechanism efficiently stores decompressed points for each unique combination of layer URI, node, requested attributes, filter extent, and filter expression. This enables rapid rendering of previously cached nodes, significantly enhancing the overall rendering performance in 2D and 3D maps.
Performance can vary depending on actual data, but on a local sample COPC file, it renders 7 times faster with this change.
Labels for mesh layerViewing mesh data has been possible through styling, plotting or using the Identify tool. But now you can also create labels on mesh surfaces or vertices similar to vector layers.
To display labels for your mesh data, simply open the styling panel and enable labels for:
- Labels on Vertices
- Labels on Surfaces
Label settings for mesh layers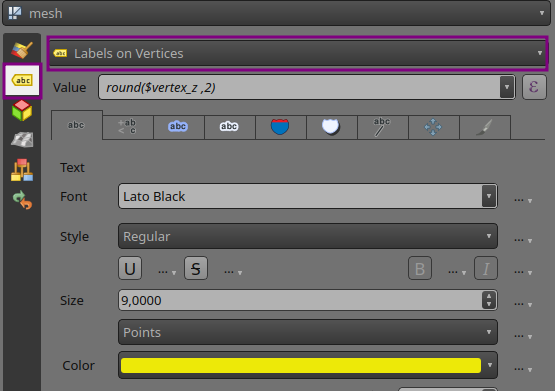
Below is an example of mesh Z values at vertices (yellow) and mesh areas at cell centre (purple):
Example of labels on a mesh layer Want more changes in QGIS?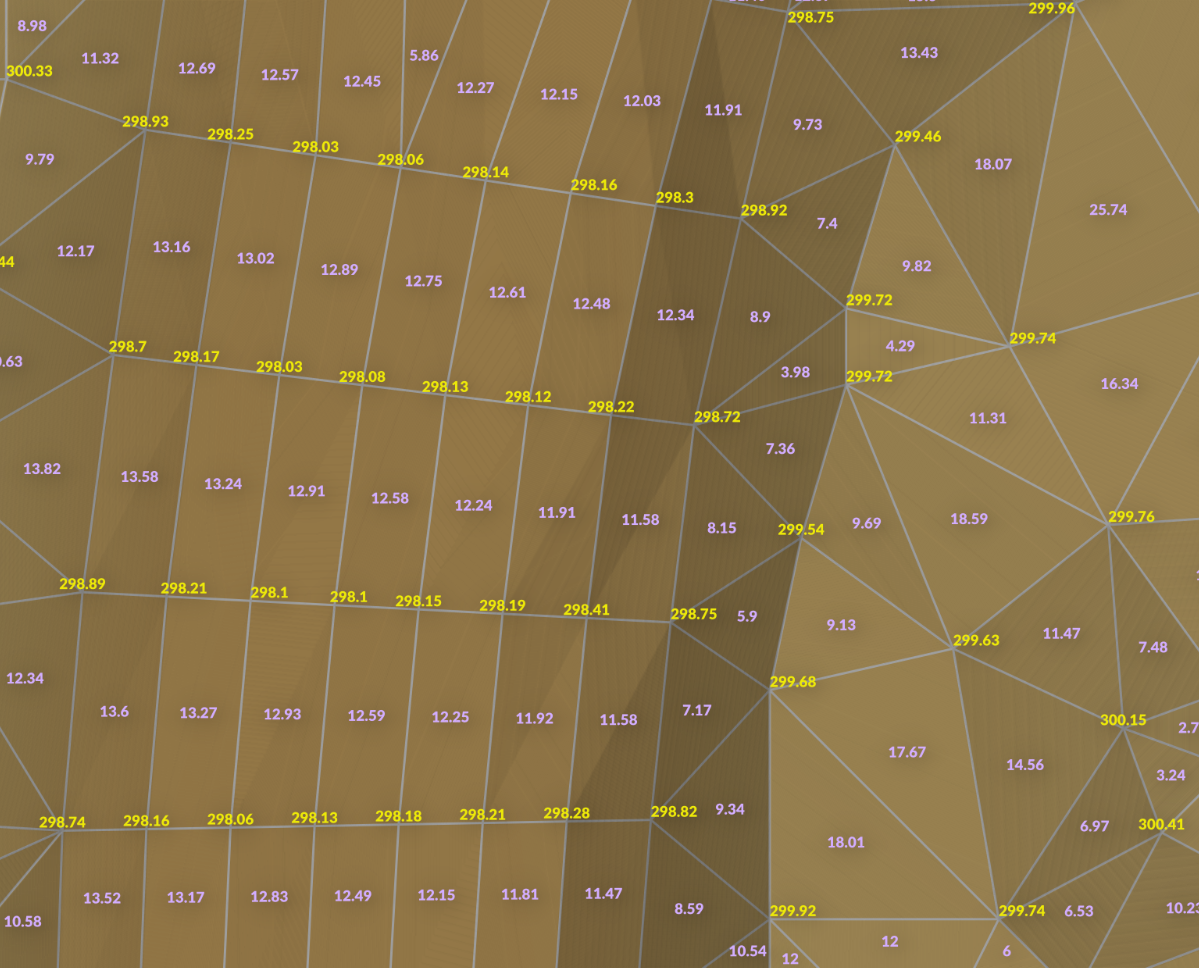
Do you want to see more improvements and new features in QGIS? Do not hesitate to contact us to discuss your requiremnets.
-
1:09
Sean Gillies: Preseason running
sur Planet OSGeoMy 32 week running season starts on February 19 and ends on September 29, at Bear Lake if everything goes right. My preseason running has been light on running because of various maladies. I strained my back at the end of December and just as I recovered from that I experienced some knee inflammation that was badly aggravated by running. For the past three weeks I've switched to weight training and chugging on the elliptical machines at a nearby gym. I'm doing 5x5s of squats, deadlifts, etc three times a week and 4-5 x 3 minute hard elliptical intervals once or twice a week. In between I've been walking briskly on the bike path or hiking on trails. I'd hoped to be actually running 6 hours a week by now, but am adjusting and getting some good workouts in. By February 19, I think I'll be able to take my interval workouts outside and switch from hiking to running without beating up on my knee.
-
16:42
Markus Neteler: Celebrating 18 Years of the Open Source Geospatial Foundation (OSGeo)
sur Planet OSGeoThe Open Source Geospatial Foundation (OSGeo) today celebrates its 18th anniversary, underscoring its pivotal role in the development of open source geospatial software and its impact on the world. Founded in 2006, OSGeo’s mission is to support and promote the collaborative development of open geospatial technologies and data. Over the years, it has become a cornerstone of the open geospatial community, fostering innovation, education and adoption of open source geospatial software worldwide.
The post Celebrating 18 Years of the Open Source Geospatial Foundation (OSGeo) appeared first on Markus Neteler Consulting.
-
1:16
Adam Steer: Route mapping using Strava, OpenStreetMap and QQIS
sur Planet OSGeoTools used: QGIS 3.34.3 Prizren; Inkscape 1.2, a web browser Most of this is reasonably standard ‘get data, make maps’ – you can flick straight to cartographic magic for the un-standard parts if you want! The product Brief and design choices The brief for this map was to visualise a bicycle ride route – and… Read More »Route mapping using Strava, OpenStreetMap and QQIS -
11:54
Free and Open Source GIS Ramblings: Finding geospatial accounts on Mastodon
sur Planet OSGeoBesides following hashtags, such as #GISChat, #QGIS, #OpenStreetMap, #FOSS4G, and #OSGeo, curating good lists is probably the best way to stay up to date with geospatial developments.
To get you started (or to potentially enrich your existing lists), I thought I’d share my Geospatial and SpatialDataScience lists with you. And the best thing: you don’t need to go through all the >150 entries manually! Instead, go to your Mastodon account settings and under “Import and export” you’ll find a tool to import and merge my list.csv with your lists:

And if you are not following the geospatial hashtags yet, you can search or click on the hashtags you’re interested in and start following to get all tagged posts into your timeline:

-
0:07
Markus Neteler: Using leafmap with actinia in a Jupyter notebook
sur Planet OSGeoThis blog post gives an overview of how to easily perform a geodata analysis of an online available dataset (here: a GeoTIFF file) with actinia and display the result in Leafmap browser-based.
The post Using leafmap with actinia in a Jupyter notebook appeared first on Markus Neteler Consulting.
-
19:45
gvSIG Team: Video on the Spatial Data Infrastructure of Albacete
sur Planet OSGeoWe share an institutional video about the Spatial Data Infrastructure of Albacete, developed with the gvSIG Suite, and that is having a significant impact both at the management level and in public service. A video that, in just over a minute, allows you to understand the scope that projects of this kind have.
-
19:41
gvSIG Team: Vídeo sobre la Infraestructura de Datos Espaciales de Albacete
sur Planet OSGeoCompartimos un vídeo institucional sobre la la Infraestructura de Datos Espaciales de Albacete, desarrollada con la Suite gvSIG y que está teniendo un gran impacto tanto a nivel de gestión como a nivel de servicio público.
Un vídeo que en poco más de un minuto permite entender el alcance que tienen este tipo de proyectos:
-
16:34
Enhancing capabilities by adopting Standards for emerging technologies
sur Open Geospatial Consortium (OGC)The pace of technological change is increasing as new products are made available, with ground-breaking innovation often resulting in disruptive change. Coupled with this technological change is the explosion of data from new sources relevant to the geospatial domain, including imagery, sensor feeds, and real-time tracking data. Organisations in the public, private, and third sectors must remain agile and resilient to thrive in this emerging landscape.
Adoption of new technological innovations into large, controlled IT enterprises can be challenging, because of associated costs, integration challenges, and processes. The Open Geospatial Consortium (OGC) is a standards body that, for the last 30 years, has been working to innovate and create community driven Standards in the geospatial domain. These Standards are designed to ensure data and services are Findable, Accessible, Interoperable, and Reusable (FAIR), whilst ensuring that the developed Standards are suited to the target domain and straightforward to adopt. FAIR principles can also be applied to the integration of new technologies into large enterprises, to ensure that interaction patterns with new technologies are known, and the components offering the technology are interchangeable.
Standardising AI/ML Training DataAn OGC Standard supporting a decidedly recent phenomenon is the OGC Training Data Markup Language for Artificial Intelligence. Artificial Intelligence (AI), Machine Learning (ML), and associated applications have been the subject of research since the 1990s and earlier. However, it is only recently that the necessary computational power and, importantly, the data to train AI models, have been available. Training data is the lifeblood of AI. As the old axiom goes, “garbage in, garbage out” and AI models are no different. Additionally, AI models and their inner workings can be opaque with the ‘black box’ effect on the inputs and outputs. Therefore, standardising the management of training data is important for scientific endeavours, not least for repeatability but also the FAIR principles.
In addition to utilising AI to do typical geospatial and imagery work, we are also seeing AI used to create simulated data for training – or even nefarious purposes. Recording information about the input data to ML models in a standardised manner assists with the management and authenticity of outputs. By way of example, the image below is a completely fictional landscape created using some training data of a UK city and a Generational Adversarial Network (GAN). Standardising the training dataset metadata enables others to create their own simulated data with the same feel, whilst understanding the input parameters and likely outcomes.
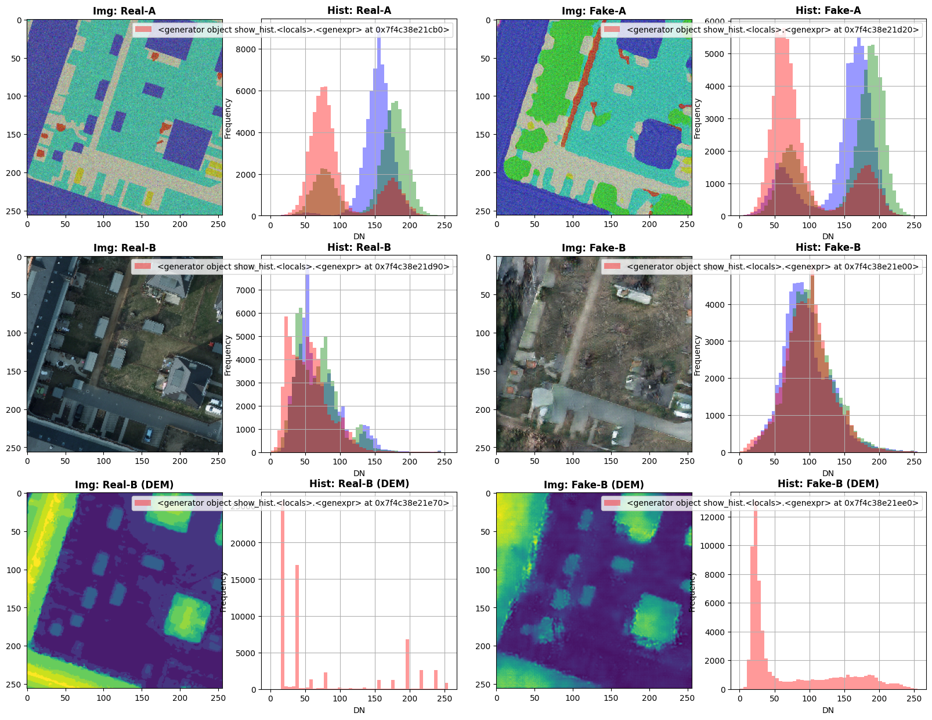 Quantum Computing
While AI/ML is one current technology trend that offers a great example of how the technological landscape can change overnight, like with the 2022 release of ChatGPT, another disruptive technology set that has been on the horizon for the past few decades is Quantum Computing.
Although not likely to be a complete replacement for classical computing, quantum computing potentially offers an exponential speed-up to solving problems that are difficult for classical computing to manage. This is not necessarily because quantum computers are faster in the super computing sense, it is that their approach to solving problems is fundamentally different to classical computing. Classical computing operates by manipulating bits that are either in a 1 or a 0 position, chaining enough of these operations together enables computing machines to do useful work. Quantum computers are different in that their fundamental building block is the qubit that can exist in a superposition of both 1 and 0. There are also different types of quantum computing, circuit-based quantum computers are those that can do the headline-grabbing factoring of large numbers and therefore will be able to crack RSA encryption (which is built on the principle that factoring large numbers is hard). The second type of quantum computing is quantum annealing or adiabatic quantum computing that lends itself to solving optimisation problems.
The geospatial domain is full of optimisation problems, a typical example is the Travelling Salesperson Problem where a salesperson is required to visit several geographically dispersed locations with the constraint that they must visit each location once and only once while completing the route with the lowest cost (shortest distance, fastest drivetime). Another optimisation style problem is the Structural Imbalance Problem where an algorithm attempts to split a social network (often with a geospatial element) into friendly groups where, in a balanced graph, all relationships within the groups are friendly, while all the relationships between the groups are hostile. In the real world it is not usually possible to get a perfect result. This highlights relationships that do not fit the model (strained), which can be a predictor of conflict.
Practical quantum computing is now possible, there are several providers such as Rigetti, D-Wave, and the likes of Amazon, Google, and Microsoft who are starting to make their quantum computing resources available via the cloud. Although none of the quantum computers are sizable enough to provide a quantum advantage in the optimisation space, new quantum computers are planned that will be able to. As a stop gap, there are classical/quantum hybrid approaches that offer advantages of quantum computing but can solve practical problems.
As with many emerging technologies, the interaction patterns for these new quantum computers and hybrid solvers have not yet been standardised and are bespoke down to the hardware. The D-Wave system with the Ocean SDK for quantum computing has patterns and calls that cover many of the optimisation style calls that one could use a quantum solver for. Perhaps the next move for the OGC is to understand the impact of quantum computing through a Domain Working Group to support geospatial optimisation-style problems through a group dedicated to quantum computing and the opportunities it affords.
Where next?Keeping a close eye on emerging technologies and getting ahead of the curve, in terms of adoption, enables Standards to be created that assist with integration and can provide meaningful change to organisations. The technology is the exciting piece and can offer untold opportunities, and the quicker and smoother these technologies can be adopted into the organisations that make use of them, the better the return for businesses, users, and citizens. Good, domain-driven Standards-definition is key to a FAIRer technology landscape.
A quantum computing ad-hoc session will be held at 15:30 CET on March 27 , 2024, as part of the 128th OGC Member Meeting in Delft, Netherlands, to discuss the possibility of Standardisation in the Quantum Computing domain.
The overall theme of the meeting is “Geo-BIM for the Built Environment” and will additionally include a Geo-BIM Summit, a Land Admin Special Session, an Observational Data Special Session, a Built Environment Joint Session, a meeting of the Europe Forum, as well as the usual SWG & DWG meetings and social & networking events. Learn more and register here.Sam Meek is the Chief Technology Officer at Helyx Secure Information Systems Ltd.
The post Enhancing capabilities by adopting Standards for emerging technologies appeared first on Open Geospatial Consortium.
-
2:00
GeoServer Team: A Comprehensive Guide to Publishing a Shapefile in GeoServer
sur Planet OSGeoGeoSpatial Techno is a startup focused on geospatial information that is providing e-learning courses to enhance the knowledge of geospatial information users, students, and other startups. The main approach of this startup is providing quality, valid specialized training in the field of geospatial information.
( YouTube | LinkedIn | Facebook | Reddit | X )
A Comprehensive Guide to publishing a Shapefile in GeoServerIn this session, we want to talk about “How to Publish Shapefile in GeoServer” comprehensively. If you want to access the complete tutorial, simply click on the link
Introduction
The Data section contains configuration options for all the different data-related settings that GeoServer uses to access and publish geospatial information. It also describes how to load, manage, and publish data in the GeoServer web interface. Each section contains the specific pages that provide add, view, edit, and delete capabilities.
Note. In this blog post, we used GeoServer version 2.20.0.
WorkspacesA Workspace serves as a means to group and organize similar layers together. It enables you to associate multiple layers and stores with a single workspace. Each workspace can be managed independently, with its own security policies, data administrator, and web services. Generally, a workspace is created for each project, along with its corresponding stores and layers.
Add a workspaceTo create a new workspace, navigate to Data > Workspaces page. Click on the Add new workspace, then you have to enter a
Workspace NameandNamespace URI.- Workspace Name: It is an identifier describing your project. It must not exceed ten characters or contain spaces (due to use as an XML “prefix” when downloading content).
- Namespace URI: URI stands for Uniform Resource Identifier, is a formal system for uniquely identifying resources, and consists of two types: URL and URN. A Namespace URI does not need to point to an actual location on the web and only needs to be a unique identifier.
- Default Workspace: This setting is useful when you only have one workspace defined. The setting allows users to communicate with the web service using just the layer name (rather than prefix:layer name required when managing hundreds of workspaces). select the Default Workspace checkbox to assign this as your default workspace.
- Sometimes the same feature type needs to be published multiple times with a different mapping and with the same name. This can be done in GeoServer using Isolated Workspaces functionality.
Press the Submit button to save your new workspace.
Edit a workspaceTo view or edit a workspace, click on the Workspace name, then a workspace configuration page will be displayed.
- For Settings, select the Enabled checkbox to customize the settings and contact details for the workspace level. This allows you to define an introduction to your workspace, and override the global settings for your workspace.
- Use the checkbox located next to each service to override the Global Settings for the associated service. Once enabled, clicking on the Services link will open the settings page for the service, allowing default values for the service title, abstract, and other details to be supplied.
- The Security tab allows to set data access rules at the workspace level. To create/edit the workspace’s data access rules, check/uncheck checkboxes according to the desired role.
To remove a workspace, select it by clicking the checkbox next to the workspace. Multiple workspaces can be selected, or all can be selected by clicking the checkbox in the header. Click the Remove selected workspace(s) link. Now you will be asked to confirm or cancel the removal.
Pressing OK removes the selected workspace(s).
StoresThe Stores manage the connection parameters between GeoServer and the data sources where your spatial data reside. They provide a mechanism for GeoServer to connect to various data repositories, including file systems, databases, and cloud storage services. Each store represents a unique data source and has its configuration settings.
Add a storeTo add a Store, navigate to Data > Stores page. Click on Add new store, then you will be prompted to choose a data source. GeoServer supports several different data formats, but they are classified into three types: “Vector data”, “Raster data”, and “Cascaded Services”.
- Vector data formats include Shapefile, GeoPackage, PostGIS, and Properties. The most common and widely used option is Shapefile.
- Raster data formats include ArcGrid, GeoPackage, GeoTIFF, ImageMosaic, and WorldImage. The most used and well-known are the GeoTIFF and the WorldImage. GeoTIFF is a spatial extension of the “TIFF” format and tags image files with geographic information. A WorldImage is similar, but georeferencing information is saved in an external text file.
- Cascaded Services include WFS, WMS, and WMTS. GeoServer can proxy a remote Web Map Service and Web Map Tile Service and load it as a store in GeoServer.
Other data sources are supplied as GeoServer extensions. Extensions are downloadable modules that add functionality to GeoServer. Click the appropriate data source to configure the store, because the connection parameters vary depending on data format.
To create a Shapefile data store, follow these steps:
- Select the desired workspace from the drop-down menu.
- Enter the
Data Source Name. Make sure the “Enabled” checkbox is selected. Otherwise, access to the store along with all the datasets defined, will be disabled for it. - In the “Shapefile location”, click on the Browse link to define the location of the shapefile.
- The DBF file format has a field for character encoding, but it doesn’t always accurately indicate the actual encoding used. As a result, it is important to specify the DBF character set correctly when decoding strings to ensure accurate interpretation of the data.
When finished, press the Save button. Now it will automatically redirect to the Add New Layer page, which will be completely described in the Layer section. Next, we will explain how to edit and remove the store.
Edit a storeTo view or edit a store, click on the Store name. A Store configuration page will be displayed. The exact contents of this page depend on the specific format of the Store. After your configuration is modified, press the Save button.
Remove a storeTo remove a Store, click the checkbox next to the store. Multiple stores can be selected, or all can be selected by clicking the checkbox in the header. Click the Remove selected stores. You will be asked to confirm the removal of the configuration for the store(s) and all resources defined under them.
Pressing OK removes the selected Store(s), and returns to the Stores page.
LayersFrom the administration interface, navigate to the Data > Layers page. On this page, you can view and edit existing layers, add a new layer, or remove a layer. It also shows you the type of layers in the Type column, with a different icon for vector and raster layers, according to the geometry shape. The Title, Workspace, and Store values of each layer are shown.
Add a layerClicking the Add a new layer, brings up a New Layer Chooser panel. The menu displays all currently enabled stores. If you want to add a new layer for a published resource, click on Publish Again. Note that when republishing the name of the new layer may have to be modified to avoid conflict with an existing layer.
The beginning sections (Basic Resource Info, Keywords, and Metadata link) provide metadata, specifically textual information that makes the layer data easier to understand and work with. The metadata information will appear in the capabilities documents which refer to the layer. These options are:
- Name: The identifier used to reference the layer in WMS requests that are filled automatically. Note that for a new layer for an already-published resource, the name must be changed to avoid conflict.
- Enabled: A layer that is not enabled won’t be available to any kind of request, it will just show up in the configuration and in REST config.
- Advertised: A layer is advertised by default. A non-advertised layer will be available in all data access requests (for example, WMS GetMap, WMS GetFeature) but won’t appear in any capabilities document or the layer preview.
- Title: The human-readable description to briefly identify the layer to clients that filled automatically. GeoServer provides an item for the title and abstract and describes how to specify metadata in different languages. By default, it’s disabled and can be enabled from the i18n checkbox.
- Abstract: It describes the layer in detail.
- Keywords: List of short words associated with the layer to assist catalog searching. To add a new keyword, enter your keyword, then press the Add Keyword button to add it.
- Metadata & Data Links: It allows linking to external documents that describe the data layer. The
Typeinput provides a few example types, like FGDC or ISO19115, but allows any other type to be declared.Formatprovides its mime type, whileURLpoints to the actual metadata.
A Coordinate Reference System (CRS) defines how georeferenced spatial data relates to real locations on the Earth’s surface. GeoServer needs to know the CRS of your data. This information is used for computing the latitude/longitude bounding box and reprojecting the data during both WMS and WFS requests.
- Native SRS: Specifies the coordinate system the layer is stored in. Clicking the projection link displays a description of the SRS.
- Declared SRS: Specifies the coordinate system GeoServer publishes to clients.
- SRS Handling: Determines how GeoServer should handle projection when the two SRSes differ. Possible values are:
- Force declared: This is the default option and normally the best course of action. Use this option when the source has no native CRS, has a wrong one, or has one matching the EPSG code.
- Reproject from native: This setting should be used when the native data set has a CRS that does not match any official EPSG. E.g.
Lambert Conformal Conic to WGS84. - Keep native: This is a setting that should be used in very rare cases. Keeping native means using the declared one in the capabilities documents, but then using the native CRS in all other requests.
The Bounding Box determines the extent of the data within a layer. It includes two items: “Native Bounding Box” and “Lat/Lon Bounding Box”. Generate the bounds for the layer by pressing the Compute from data and Compute from native bounds button in the Bounding Boxes section.
Vector layers have a list of the “Feature Type Details”. These include the
PropertyandTypeof a data source. Remember that, if you want to change your data by ArcGIS or QGIS, like add or remove features or fields, or edit the attribute table contents, there is no need to create a layer again in the GeoServer, just press the Reload feature type, so your layer will be updated.Remember that GeoServer, by default, publishes all the features that are currently available in the layer. However, if you wish to limit the features to a specific subset, you can achieve this by specifying a CQL filter in the configuration. Upon completing the layer configuration, finalize the process by pressing the Save button. This action will create the layer based on the specifications you have provided.
Edit a layerTo view or edit a layer, click on the Layer Name from the Layer page. A layer configuration page will be displayed. After your configuration is modified, press the Save button.
Remove a layerTo remove a layer, select the checkbox next to the layer. Multiple layers can be selected, or all can be selected by clicking the checkbox in the header. By clicking the Remove selected layers link, you will be asked to confirm the removal of the configuration for the layer(s) and all resources defined under them.
Press OK removes the selected layer(s), and returns to the Layers page.
-
12:23
gvSIG Team: Manual gvSIG Desktop 2.6
sur Planet OSGeo
La última versión de gvSIG Desktop además de considerables mejoras ha traído un cambio en la interfaz del programa, modernizando el aspecto de los iconos utilizados.
Hoy os compartimos el manual completo en PDF de gvSIG Desktop 2.6, que es una guía estupenda para los nuevos usuarios y a los que lleváis tiempo trabajando con gvSIG Desktop os puede ser útil para familiarizaros con los nuevos iconos.
Y aunque seréis los menos, para los que queráis seguir utilizando el juego de iconos «clásico» podéis instalarlo desde el Administrador de Complementos.
El manual de gvSIG Desktop 2.6 se puede descargar en este enlace.
-
13:00
3liz: Sortie de Lizmap Web Client 3.7
sur Planet OSGeoLizmap Web Client 3.7Nous sommes heureux d'annoncer la sortie de Lizmap Web Client 3.7, la nouvelle version majeure de l'application.
Financeurs


- Geolab.re
- Parc naturel régional du Haut-Jura
- Portes du Soleil
- SDEC Energie
- Tenergie
- Terre de Provence Agglomération
- Vaucluse province in France
- WPD
Il est désormais requis d'avoir un QGIS serveur minimum 3.22. Cependant, nous recommandons fortement d'utiliser une version LTR plus récente, comme la version 3.28 ou bien même la prochaine version LTR 3.34. Consultez la feuille de route QGIS.
Pour utiliser pleinement de cette version 3.7, n'oubliez pas de mettre à jour votre extension Lizmap dans QGIS bureautique. Nous avons écrit un article dédié sur cette nouvelle version.
Fonctionnalités Refonte du thème par défautUn nouveau thème est disponible, apportant une interface utilisateur plus à jour. Il est désormais également plus facile de mettre à jour ces couleurs, car cela a été centralisé en utilisant seulement quelques variables CSS.
Dataviz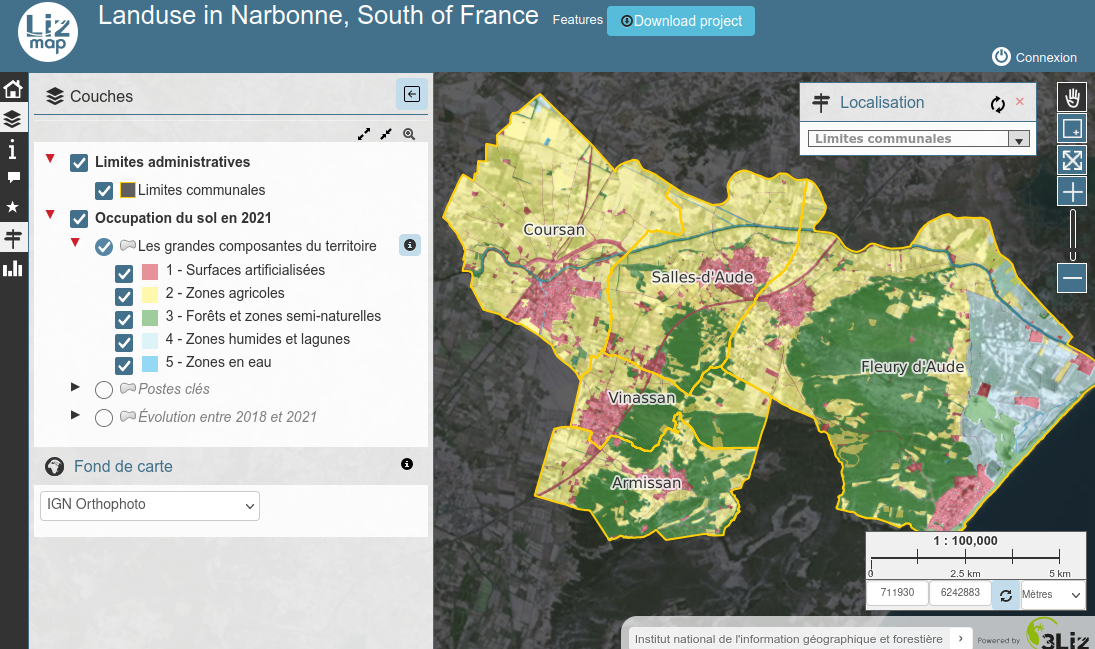
Dans l'extension, vous pouvez trouver de nouveaux paramètres pour chaque graphique. Par exemple, il est possible de définir deux titres différents, selon l'endroit où le graphique est affiché : soit dans le panneau principal de visualisation de données, soit dans une popup.
La principale nouvelle fonctionnalité est la mise en page par Glisser&Déposer. Nous nous sommes inspirés de la fonctionnalité native de QGIS concernant la Mise en page du formulaire Glisser-Déposer. Dans Lizmap, lorsque vous avez de nombreux graphiques à afficher, vous pouvez les organiser en onglets ou conteneurs.
Dans QGIS, voici un exemple de mise en page des graphiques :
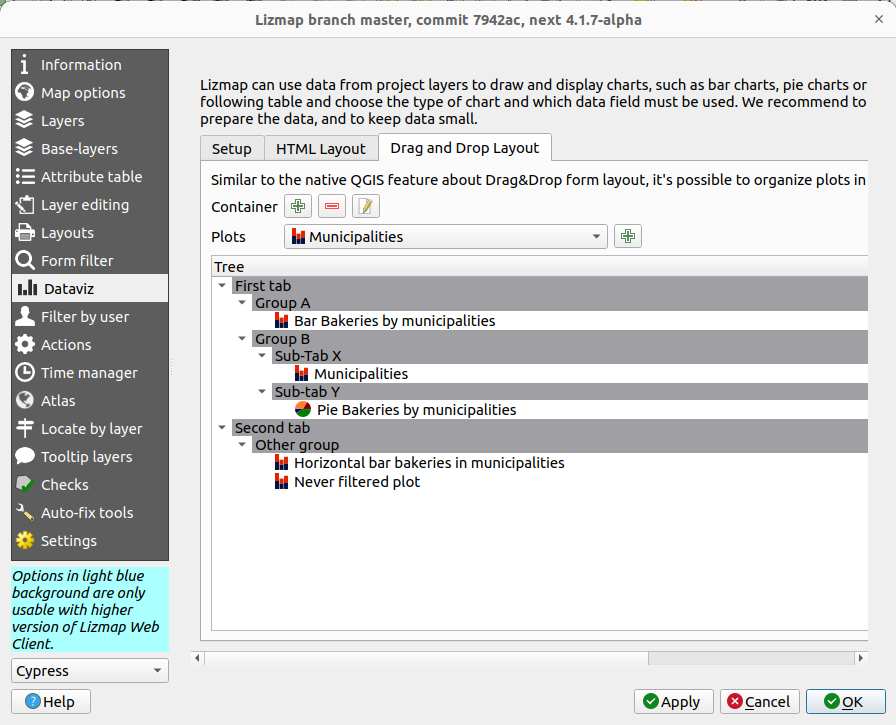
et voici le résultat dans Lizmap Web Client :
Ces nouvelles fonctionnalités ont été financées par DDTM 34.
LégendeC'est l'une des fonctionnalités les plus visibles et attendues de Lizmap, il est possible de cocher/décocher les éléments de la légende individuellement.
Nous avons également revu la façon dont Lizmap gérait les couches de base dans le projet (fonds de carte). Les utilisateurs sont désormais invités à utiliser le groupe
baselayersdans la légende pour définir les couches de base. À l'aide d'une version à jour de l'extension, vous pouvez utiliser l'onglet "Fonds" pour vous aider.Nous avons également décidé d'utiliser le même comportement que dans QGIS Bureautique concernant la manière dont les utilisateurs manipulent la légende. Désormais, lors de l'activation d'un groupe, toutes les couches incluses dans ce groupe ne seront pas activées automatiquement.
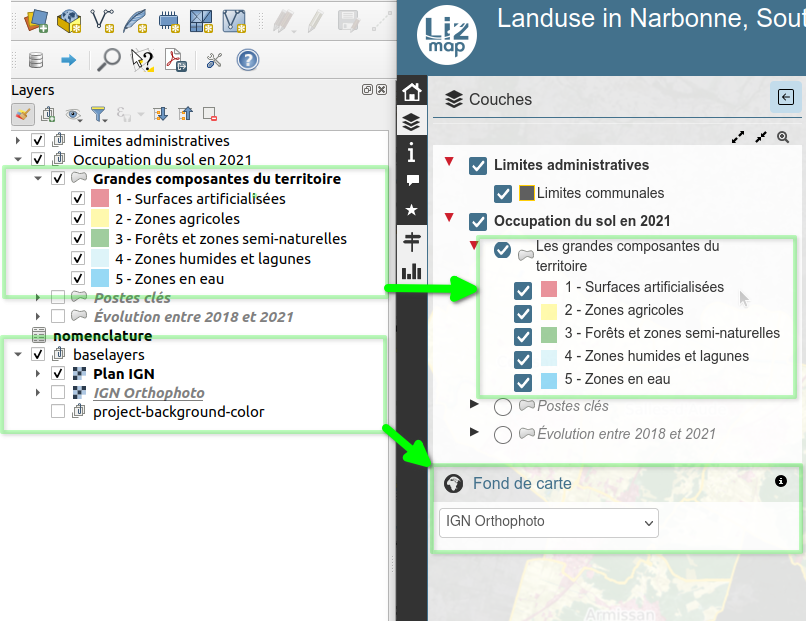
Pour inclure ces nouvelles fonctionnalités, beaucoup de re-factorisation du code Javascript ont été réalisées sous le capot, financées par le département du Calvados et Le Grand Narbonne.
Mise en pageDans l'extension, un nouveau panneau sur les mises en page a été ajouté. Vous êtes invités à jeter un œil à ces nouveaux paramètres. Il est possible de :
- définir par mise en page si nous l'activons ou non sur l'interface Web. Avant, il était seulement possible de choisir d'activer ou non l'impression à l'échelle des propriétés du projet
- définir les groupes Lizmap qui sont autorisés à accéder à chaque mise en page
- définir une icône personnalisée lorsque la mise en page est basée sur un atlas.
- réduire le nombre de formats disponibles. Plus besoin de Javascript pour avoir une interface simplifiée
- ...
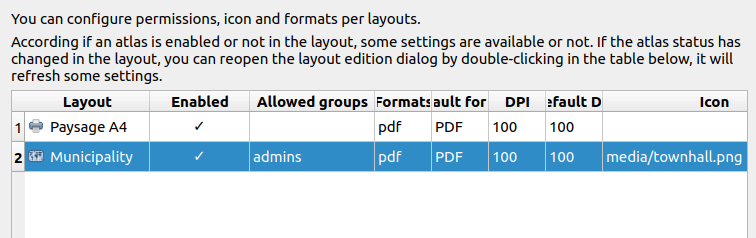
Ces nouvelles fonctionnalités ont été financées par DDTM 34.
Au cours de ce travail, nous avons déprécié l'extension QGIS serveur AtlasPrint. Lizmap utilise désormais la fonctionnalité native de QGIS Serveur pour exporter en PDF un élément de l'atlas.
Edition WebDAVFaunalia a contribué directement au code source de Lizmap en ajoutant le support WebDAV dans le formulaire d'édition lorsque l'outil d'édition a été défini sur stockage WebDAV. Vous pouvez consulter la documentation en ligne. Cela fonctionne également lors de l'affichage de la popup.
Relations entre les tablesLe support des relations 1-n entre tables a été amélioré lors de l'édition de ces couches :
- Ajout d'une nouvelle entité "enfant" depuis la popup d'un parent
- Affichage du tableau des entités "enfants" depuis le formulaire d'édition d'un parent
Ces améliorations des relations 1-n ont été financées à la fois par la ville d'Avignon et Valabre.
Dessin Texte et mesureIl est possible d'annoter la carte avec du texte dans l'outil de dessin. Les mesures ont également été améliorées.
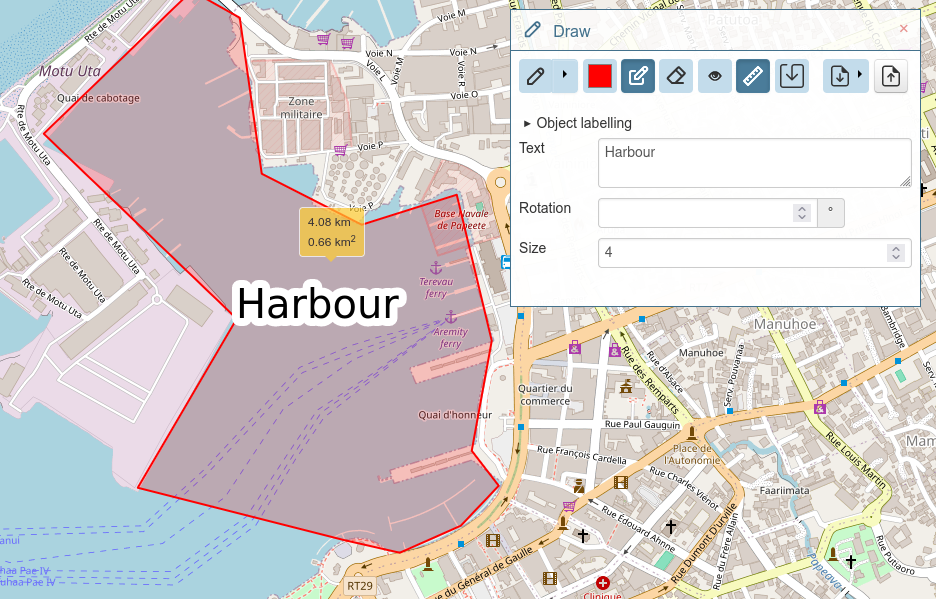
Ces fonctionnalités ont été financées par le Territoire de Belfort et Lons-le-Saunier.
ContraintesLors du dessin de certaines géométries sur Lizmap, vous pouvez désormais définir une contrainte de longueur et/ou d'angle.
Action
De nouveaux "contextes" ont été ajoutés à la fonctionnalité Actions. Avant, les actions n'étaient disponibles que pour le contexte d'entité. Avec la version 3.7, les actions peuvent être définies dans le contexte couche (similaire à la fonctionnalité native de QGIS) ou même au niveau duprojet.
Ces nouveautés ont été financées par Porte du Soleil.
JavascriptEn raison du travail qui a été effectué lors de la légende ou d'autres fonctionnalités de Lizmap, certains scripts Javascript précédents pourraient ne plus fonctionner et devront être adaptés.
Bonne nouvelle, certains de ces anciens scripts pourraient ne plus être nécessaires. Par exemple, à propos de la légende, vous êtes invités à passer au thème QGIS natif.
TéléchargementVous pouvez télécharger le dernier zip sur notre page des sorties.
Vous pouvez également consulter la liste des modifications complètes ("changelog") de la version 3.7.0, en anglais.
ModulesÀ la date du 29 janvier 2024, voici la liste des modules qui ont été mis à jour pour 3.7 :
Les autres modules sont en cours.
Nous espérons que vous allez apprécier cette nouvelle version ?
L'équipe 3Liz
-
13:00
3liz: Release of Lizmap Web Client 3.7
sur Planet OSGeoLizmap Web Client 3.73Liz is pleased to announce the release of Lizmap Web Client 3.7, the new major version of the application.
Funders
- Geolab.re
- Parc naturel régional du Haut-Jura
- Portes du Soleil
- SDEC Energie
- Tenergie
- Terre de Provence Agglomération
- Vaucluse province in France
- WPD
It is now required to have a minimum QGIS server 3.22. However, we highly recommend using the latest LTR version, i.e. version 3.28 or even soon the next LTR version 3.34. Check the QGIS roadmap.
To take full advantage of this version 3.7, don't forget to update your Lizmap plugin in QGIS desktop. We've written an article dedicated to this new version.
Features Overhaul of the default themeA new theme is available, bringing a more up-to-date UI. It's now also easier to update these colors, because it has been centralized using just a few CSS variables.
DatavizIn the plugin, you can find new settings about each plot. For instance, it's possible to set two different titles, depending on where the plot is displayed : either in the main dataviz panel or within a popup.
The main new feature is the Drag&Drop layout. We have been inspired by the native feature in QGIS about the Drag&Drop form layout. In Lizmap, when you have many plots to display, you can organize them in tabs or containers.
In QGIS, this is an example of the layout :
and the result in Lizmap Web Client :
These new features have been funded by DDTM 34.
LegendThis is one of the most visible and expected feature in Lizmap, it's possible to check/uncheck the legend items individually.
We also reviewed the way Lizmap was managing base layers in the project. Users are now invited to use the
baselayersgroup in the legend to define your base layers. With an updated version of the plugin, use the "Baselayers" tab to help you.We also decided to stick to the same behavior as in QGIS Desktop on how users are manipulating the legend. Now, when enabling a group, it will not toggle "ON" all layers included within this group.
To include these new features, a lot of Javascript refactoring has been done under the hood, funded by both Calvados province and Le Grand Narbonne.
LayoutsIn the plugin, a new panel about layouts landed. You are invited to have a look to these new settings. It's possible to :
- set per layout if we enable it or not on the web interface. Before, it was only possible to choose to enable or not printing capabilities at the project level.
- define Lizmap groups which are allowed to access this layout
- define a custom icon when the layout is based on an atlas.
- reduce the number of formats available. No more Javascript needed to have a simplified interface
- ...
These new features have been funded by DDTM 34.
During this work, we deprecated the QGIS server plugin AtlasPrint. Lizmap now uses the native feature from QGIS Server for printing an atlas feature.
Editing WebDAVFaunalia contributed directly on the Lizmap source code by adding WebDAV support in form when the editing widget has been set to WebDAV storage, check the online documentation. It works as well when displaying the popup.
Relations between tablesThe support of relations 1-n between tables has been improved when editing these layers :
- Adding new "child" features from the popup of a parent
- Displaying the table of "child" features from the editing form of a parent
These improvements about relations 1-n were funded by both Avignon city and Valabre.
Drawing Text and measuresIt's possible to annotate the map with some text in the drawing tool. Measures have been improved as well.
These features were funded by Territoire de Belfort and Lons-le-Saunier.
ConstraintsWhen digitizing some geometries on Lizmap, you can now set some length and/or angle constraints.
ActionsSome new scopes have been added the Actions feature. Before, it was only the feature scope. With 3.7, Actions can be defined in the layer scope or (similar to QGIS native actions feature) or even in the project scope.
These new features have been funded by Porte du Soleil.
JavascriptDue to the work which have been done during the legend or other features in Lizmap, some previous Javascript script might not work anymore and need to be adapted.
Good news, some of these legacy scripts might not be needed anymore. For instance, about the legend, you are invited to switch to the native QGIS theme feature.
DownloadYou can download the latest zip on our releases page.
You can also check the full changelog of version 3.7.0.
ModulesAs of January 29rd 2024, this is the list of modules which have been released for 3.7 :
Other modules are work-in-progress.
We hope you will enjoy this new version ?
The 3Liz team
-
15:38
Free and Open Source GIS Ramblings: Trajectools update: stop detection & trajectory styling
sur Planet OSGeoThe Trajectools toolbox has continued growing:
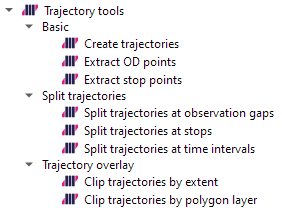
I’m continuously testing the algorithms integrated so far to see if they work as GIS users would expect and can to ensure that they can be integrated in Processing model seamlessly.
Because naming things is tricky, I’m currently struggling with how to best group the toolbox algorithms into meaningful categories. I looked into the categories mentioned in OGC Moving Features Access but honestly found them kind of lacking:
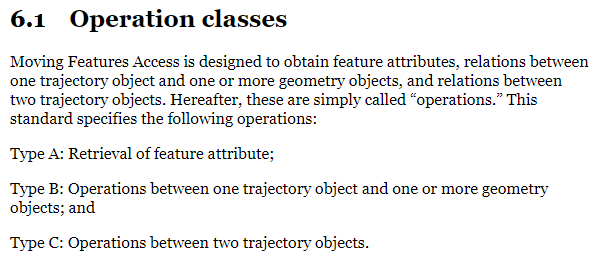
Andrienko et al.’s book “Visual Analytics of Movement” comes closer to what I’m looking for:
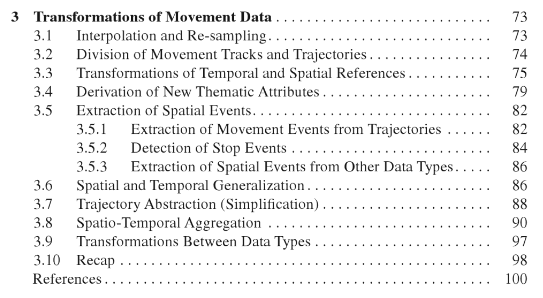
… but I’m not convinced yet. So take the above listed three categories with a grain of salt. Those may change before the release. (Any inputs / feedback / recommendation welcome!)
Let me close this quick status update with a screencast showcasing stop detection in AIS data, featuring the recently added trajectory styling using interpolated lines:

While Trajectools is getting ready for its 2.0 release, you can get the current development version directly from [https:]] .
-
16:38
GIScussions: Geomob London – a Cracking Night of Maps
sur Planet OSGeo
I must have said this before but I will say it again, if you live anywhere near to London and you are into geotech, maps or location influenced applications then you should give Geomob a try. I’d offer you a money back guarantee but as it’s free that isn’t necesary but more on that later.
On Wednesday night (24th Jan 2024) we had nearly a hundred people attending what truly was a cracking event, the room was full (almost overfull), the speakers were eclectic, wide ranging and brilliant, the conversation was sparkling and mappy and it was a treat to be able to stand outside the pub drinking in January.
For a run down on the 5 speakers and their talks have a look at the @Geomob thread on mastodon
The talks covered a new javascript library, a Welsh language version of OSM, crowd sourcing neighbourhood boundaries in New Zealand, mapping bus routes and stops in India and the audience favourite (and mine) A Map Inside. This was a perfect selection of talks, technical, quirky, passionate and absorbing. As always, the best is saved for the end when we go to the nearby pub and chat, make new friends and discover new opportunities.
There is something very special about Geomob and that is perhaps evidenced by its expansion from its origins in London to regular events in Barcelona, Berlin, Finland, Lisbon, Munich and Tel Aviv. Geomob would not be possible without the energy and commitment of Ed Freyfogle whose company OpenCage is the principal sponsor of the events (and the podcast) and the generous sponsors – OpenCage, Mappery, Esri UK, Ed Parsons, Geolytix and SplashMaps.
But here is the rub, the numbers are increasing (which is good) and beer prices are also increasing (which is not so good) so the cost of running the events is increasing faster than sponsorship. We need more sponsors or larger sponsorship to keep Geomob growing and spreading geo-goodness to a wider audience, can you help us? It could be an individual or a company sponsoring events in a city or worldwide or it could be that you would like to sponsor a podcast episode and get a mention of your organisation as a sponsor in our podcast (great if you are hiring or launching a new service). Ed and I have some ideas for novel approaches to sponsorship and would be happy to discuss them with you, just message me through the contact form.
Geomob always needs speakers at the events and on the podcast so if you fancy presenting or being interviewed get in touch with us.
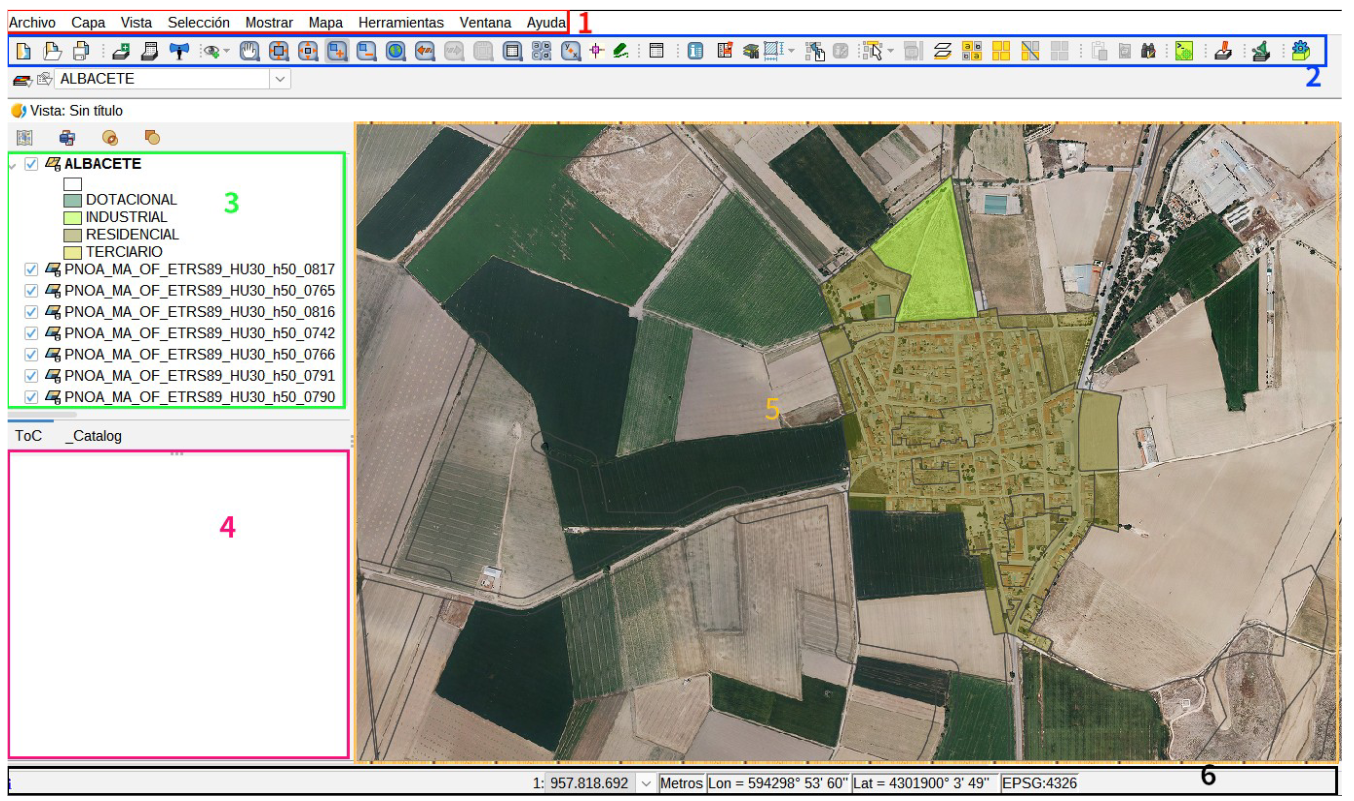

-
16:00
Developers invited to the February 2024 OGC API – Coverages Virtual Code Sprint
sur Open Geospatial Consortium (OGC)The Open Geospatial Consortium (OGC) invites developers to the 2024 OGC API – Coverages Virtual Code Sprint, to be held February 13-15, 2024. Registration is free and open to the public.
The Sprint will focus on refining the OGC API – Coverages – Part 1: Core candidate Standard. OGC API – Coverages enables clients to efficiently retrieve a subset of spatiotemporal data for a given time, area, and resolution of interest through a simple Web API.
Typically, this data is returned in a gridded format such as netCDF, GeoTIFF, CoverageJSON, or CIS JSON, although this also extends to other coverage data types, such as point clouds in e.g. LAS/LASZip format, or tiled coverage data. The candidate Standard also supports the listing and retrieving of data and metadata for individual scenes making up a coverage.
Example types of coverages, sometimes called GeoDataCubes, include weather and climate datasets, Earth Observation time series, static environmental data such as digital elevation models, land cover classification, and point clouds obtained from LiDAR capture or photogrammetry. Furthermore, in recent OGC activities, the development of a proposed GeoDataCube API Standard has leveraged OGC API – Coverages as a Core foundation for data access.
An OGC Sprint is a collaborative and inclusive event driven by innovative and rapid programming with minimal process and organization constraints to support the development of candidate standards and applications that implement those standards.
During the virtual code sprint, there will be an opportunity for joint discussion with all participants on the goals and objectives of the event, as well as the final briefing of findings and opinions of the participants. However, the majority of the time will be spent in collaboration between participants in active coding.
To learn more about how the family of OGC API Standards work together to provide modular “building blocks for location” that address both simple and the most complex use-cases, visit ogcapi.org. For more technical information about OGC Standards, including how to get started, links to each Standards’ GitHub page, official Standards documents, compliance, and more, visit developer.ogc.org
The Sprint will take place on GoToMeeting and Discord platforms from 8:00am to 6:30pm (US Eastern) each day from February 13-15, 2024.
For more information on the Sprint, including objectives, agenda, and registration, visit the February 2024 OGC API ? Coverages Virtual Code Sprint wiki page on GitHub. Information on other OGC Sprints or events for developers can be found on the OGC Developer Events wiki on GitHub.
The post Developers invited to the February 2024 OGC API – Coverages Virtual Code Sprint appeared first on Open Geospatial Consortium.
-
15:08
GeoSolutions: GeoSolutions at GeoWeek Feb 11-13 (Booth 548): Cesium/3D Tiles Support in MapStore
sur Planet OSGeoYou must be logged into the site to view this content.
-
8:56
GeoTools Team: GeoTools 30.2 Released
sur Planet OSGeo The GeoTools team is pleased to the release of the latest stable version of GeoTools 30.2: geotools-30.2-bin.zip geotools-30.2-doc.zip geotools-30.2-userguide.zip geotools-30.2-project.zip This release is also available from the OSGeo Maven Repository and is made in conjunction with GeoServer 2.24.1. The release was made by Jody Garnett (GeoCat). -
2:00
GeoServer Team: GeoServer 2.24.2 Release
sur Planet OSGeoGeoServer 2.24.2 release is now available with downloads (bin, war, windows), along with docs and extensions.
This is a stable release of GeoServer recommended for production use. GeoServer 2.24.2 is made in conjunction with GeoTools 30.2, and GeoWebCache 1.24.2.
Thanks to Jody Garnett (GeoCat) for making this release, everyone who contributed, and to Georg Weickelt and Peter Smythe for preflight testing.
Security ConsiderationsThis release addresses security vulnerabilities and is considered an essential upgrade for production systems.
See project security policy for more information on how security vulnerabilities are managed.
Release notesImprovement:
- GEOS-11213 Improve REST external upload method unzipping
- GEOS-11246 Schemaless plugin performance for WFS
- GEOS-11219 Upgraded mail and activation libraries for SMTP compatibility
Bug:
- GEOS-9757 Return a service exception when client provided WMS dimensions are not a match
- GEOS-11051 Env parametrization does not save correctly in AuthKey extension
- GEOS-11223 Layer not visible in preview/capabilities if security closes the workspace, but allows access to the layer
- GEOS-11224 Platform independent binary doesn’t start properly with default data directory
- GEOS-11235 preauthentication filters - session reuse even after having logout
- GEOS-11241 ModificationProxy breaks information hidding on CatalogInfo.accept(CatalogVisitor) exposing the proxied object
- GEOS-11250 WFS GeoJSON encoder fails with an exception if an infinity number is used in the geometry
- GEOS-11255 Multiple inserts in WPS with different idGen strategies does not work
Task:
- GEOS-11220 Upgrade Hazelcast from 5.3.1 to 5.3.6
- GEOS-11245 Update OSHI from 6.2.2 to 6.4.10
For the complete list see 2.24.2 release notes.
Community UpdatesCommunity module development:
- GEOS-10933 keycloak logout NPE
Community modules are shared as source code to encourage collaboration. If a topic being explored is of interest to you, please contact the module developer to offer assistance.
About GeoServer 2.24 SeriesAdditional information on GeoServer 2.24 series:
-
13:25
GeoSolutions: Partnership with Nordiq Group
sur Planet OSGeoYou must be logged into the site to view this content.
-
13:46
Stefano Costa: I libri che ho letto nel 2023
sur Planet OSGeoFine anno, tempo di elenchi (bilanci, no). Nel 2023 ho letto pochino.
David Graeber, DebitoQuesto è il libro che mi ha impegnato per più tempo. È un saggio, ed era da tempo che non leggevo un saggio, non sono più abituato allo stile e all’impegno richiesto. È un testo rivoluzionario a livello sociologico e psicologico (smonta il senso di colpa!) ancora più che a livello economico. Ha uno stile abbastanza scorrevole (per me) ma comunque è denso di nozioni, confronti tra fatti e conseguenze scagliate come frecce ad ogni pagina. Non conoscevo David Graeber prima della pubblicazione postuma del libro L’alba di tutto (The dawn of everything), scritto a quattro mani con l’archeologo David Wengrow. Ho pensato che non ci fosse nessuna fretta e fosse invece un bene partire da qui per conoscere il lavoro di Graeber, e sono contento di averlo fatto.
Enzo Barnabà, Morte agli Italiani!Il massacro di Aigues-Mortes, che il 17 agosto 1893 costò la vita a nove operai italiani linciati da una folla inferocita, rappresenta un episodio capitale nella storia dei rapporti tra l’Italia e la Francia.
Questo libro di Enzo Barnabà è breve, preciso e senza orpelli.
Racconta la tragedia del massacro di Aigues-Mortes, le premesse che lo hanno reso possibile, le conseguenze che ebbe in Italia capaci di sconvolgere gli assetti politici sia del governo sia delle giovani formazioni socialiste.
Lucia Tozzi, Dopo il turismoQuesto libro è stato scritto di getto nei mesi del lockdown. Trafigge come una spada convinzioni e luoghi comuni, in modo anche un po’ crudele. Il turismo è insostenibile. Distrugge le comunità delle persone, i luoghi abitati da queste comunità.
Luca Mercalli, Salire in montagna
Sono passati appena 3 anni e sembra la cronaca della rivoluzione mancata di un altro pianeta. Abbiamo già dimenticato tutto quello che è accaduto e quello che avrebbe potuto accadere.
Il libro può essere “acquistato” gratuitamente in formato ePub dal sito dell’editore nottetempo.La cosa che mi fa incazzare di questo libro è che è scritto da una persona di cui avevo una stima incondizionata, frutto di altre letture (non della trasmissione televisiva). Ma questo libro sembra scritto da Paolo Rumiz. Infatti Mercalli ce l’ha con chi abita in montagna, con chi non ci abita più, con chi non ci abita e non ci ha mai abitato. Lo scopo principale del libro è lamentarsi della burocrazia che gli impedisce di costruire la sua seconda casa, dove può trovare riparo dalle zanzare della sua abitazione indipendente di pianura. Salire in montagna sarebbe un antidoto al riscaldamento globale, dice il sottotitolo, ma se va bene dire una fesseria del genere al bar, trovarlo propagandato da un climatologo fa per l’appunto incazzare. Le montagne tutte e in particolare le Alpi sono uno degli ecosistemi più fragili di fronte al cambiamento climatico, e per fortuna questa semplice nozione fa capolino qua e là tra le pagine del libro. Costruire una casa recuperando un edificio storico invece che buttarlo giù è una bella cosa, molto costosa (ma Mercalli alla fine non ci dice quanto) ma ne vale la pena perché potremmo ripopolare la montagna lavorando al computer, secondo la logica deformata di questo libro. Non ne sopporto l’idea di fondo perché è la propaganda di una idea individualista, come se i venti milioni di abitanti della pianura padana potessero trovare spazio per la loro seconda casa sulle montagne e salvarsi così tutti dal riscaldamento globale (che li lascerà comunque a morire di fame). E nelle prime pagine è riportata virgola per virgola una pseudoetimologia sull’idronimo della Dora presa da Wikipedia, che mi ha reso da subito indisposto. E non c’è nemmeno una carta geografica.
Assia Djebar, Bianco d’AlgeriaQuesto libro è sicuramente quello che ho faticato di più a leggere, nonostante non sia molto lungo. Trasuda nella sua componente principale un dolore immenso, il dolore di un popolo intero. Parla dello sradicamento ineludibile di chi deve usare la lingua degli oppressori per esprimersi, anche quando questa espressione raggiunge livelli altissimi e anche quando gli oppressori francesi si manifestano come la più grande sciagura mai accaduta al popolo algerino. Parla di profondissimi legami con le persone che per la libertà hanno messo tutto il proprio corpo e non solo il proprio intelletto, a costo di perdere la vita.
Chinelo Okparanta, Sotto gli alberi di udalaQuesto libro inizia con una carta geografica della Nigeria, e questo potrebbe essere sufficiente a metterlo vicino al mio cuore (perché mi piacciono molto le carte geografiche). Ritrovo il Biafra devastato e dilaniato dalla ferocia della guerra civile di Metà di un sole giallo, con un pesantissimo supplizio in più. La protagonista è costretta a vivere con crescente angoscia la propria omosessualità, perché in Nigeria è un peccato mortale che viene punito in modo sommario, anche con linciaggi. Ma nella seconda parte si riaccende la speranza. È la stessa Africa dove oggi vacilla un po’ il colonialismo europeo.
Beata Umubyeyi Mairesse, I tuoi figli ovunque dispersiAnche questo libro è un racconto di sradicamento, che attraversa più generazioni. Tra Ruanda e Francia, tra nonna, madre, figlio, la protagonista trova un senso, anche linguistico, al proprio passato e al proprio futuro, nonostante il trauma del genocidio, della fuga dal genocidio e dello sradicamento che ne deriva. Bellissimo, straziante e lucido.
Gabriela Wiener, SanguemistoAnche questo libro è un racconto di sradicamento, che attraversa più generazioni (non ho sbagliato a fare copia e incolla). È un libro molto forte che si aggancia quasi chimicamente con letture accademiche che sto facendo in questo periodo, su archeologia e colonialismo (in Italia non esiste il postcolonialismo). Ma è anche un tripudio agrodolce di femminilità.
Inizio il 2024 leggendo L’incendio di Cecilia Sala e Tutta intera di Espérance Hakuzwimana.
-
16:04
gvSIG Team: IDE del Ayuntamiento de Albacete, optimizando la gestión de la información
sur Planet OSGeoOs traemos una presentación de la Infraestructura de Datos Espaciales (IDE) de Albacete, proyecto estratégico destinado a proporcionar un marco tecnológico y organizativo para la gestión, acceso y uso de la información geoespacial en el ámbito del municipio de Albacete. Este proyecto ha tenido como objetivo principal mejorar la toma de decisiones, impulsar el desarrollo urbano sostenible y fomentar la colaboración entre los diferentes actores involucrados en la planificación y gestión del territorio.
La ponencia presenta los trabajos principales y avances de la implantación de la IDE de Albacete. Durante el proyecto se ha llevado a cabo tanto la recopilación, integración y homogeneización de una amplia variedad de datos geoespaciales como el desarrollo de herramientas orientadas a ampliar la funcionalidad de la IDE y a fomentar la participación de los distintos departamentos municipales.
En cuanto a los avances logrados, se ha implementado una plataforma tecnológica robusta y escalable, con base tecnológica en la Suite gvSIG, que permite la gestión eficiente de la información geoespacial y su difusión a través de un conjunto de geoportales y servicios web interoperables. Además de los geoportales de uso interno,se ha publicado un visor cartográfico principal y un número creciente de geoportales temáticos (turismo, urbanismo, movilidad, etc.).
Además, se han desarrollado herramientas específicas que facilitan el acceso y uso de los datos geoespaciales por parte de los diferentes usuarios del Ayuntamiento de Albacete, destacando integraciones con otros sistemas informáticos como el gestor de expedientes SEDIPUALBA / SEGEX, el Catastro con acceso a datos protegidos o el Padrón. Integrada con la IDE desarrollada con gvSIG Online, también se cuenta con la app móvil gvSIG Mapps para la toma de datos en campo, tanto en modo online como offline, y un catálogo de metadatos basado en Geonetwork.
Por último, hay que reseñar que el proyecto también ha implicado un esfuerzo en formación y divulgación entre el personal técnico del Ayuntamiento de Albacete.
En conclusión, la implantación de la Infraestructura de Datos Espaciales de Albacete representa un paso significativo hacia una gestión territorial más eficiente y sostenible. Un proyecto que puede servir de referencia para otros municipios con necesidades similares.
-
16:00
OGC forms new GeoZarr Standards Working Group to establish a Zarr encoding for geospatial data
sur Open Geospatial Consortium (OGC)The Open Geospatial Consortium (OGC) is excited to announce the formation of the OGC GeoZarr Standards Working Group (SWG). The new SWG will develop a Zarr encoding for geospatial gridded data in the form of Zarr conventions.
Zarr is a cloud-native data format for n-dimensional arrays that enables access to data in compressed chunks of the original array. Zarr facilitates portability and interoperability on both object stores and hard disks.
As a generic data format, Zarr has increasingly become popular to use for geospatial purposes. As such, in June 2022, OGC endorsed Zarr V2.0 as an OGC Community Standard. The purpose of the GeoZarr SWG is to have an explicitly geospatial Zarr Standard (GeoZarr) adopted by OGC that establishes flexible and inclusive conventions for the Zarr cloud-native format that meet the diverse requirements of the geospatial domain. These conventions aim to provide a clear and standardized framework for organizing and describing data that ensures unambiguous representation.
The objectives of GeoZarr conventions include:
- Compatibility: Ensuring easy compatibility with popular mapping and data analysis tools such as GDAL, Xarray, ArcGIS, QGIS, and other visualization tools, enabling seamless integration into existing workflows.
- Dimensions: Supporting multi-dimensional data, such as hyperspectral and altitude information, to address diverse geospatial data requirements.
- Data Discovery: Providing metadata for discovering, accessing, and retrieving the data, including composite products made of multiple data arrays.
- Mixing Data: Facilitating the combination of different types of geospatial data, including satellite images, elevation maps, and weather models, to create comprehensive and informative datasets.
- Flexibility: Allowing scientists and researchers to work with diverse data types and projections in their preferred software and programming languages, promoting flexibility and adaptability in geospatial data processing and analysis.
In addition to the encoding of geospatial data and metadata, the GeoZarr Standard will provide a multi-dimensional alternative to the two-dimensional Cloud-Optimized GeoTiff format (COG – adopted by OGC in May 2023), which has lately gained popularity due to its serverless capabilities. These capabilities will allow for inherent support of traditionally server-based functions, such as visualization (similar to OGC API – Maps), data subset access (analogous to OGC API – Coverages), and symbology (equivalent to OGC API – Styles). These aspects are planned to be incorporated as optional profiles (e.g. conformance classes).
OGC Members interested in staying up to date on the progress of this standard, or contributing to its development, are encouraged to join the GeoZarr Standards Working Group via the OGC Portal. Non-OGC members who would like to know more about participating in this SWG are encouraged to contact the OGC Standards Program.
The post OGC forms new GeoZarr Standards Working Group to establish a Zarr encoding for geospatial data appeared first on Open Geospatial Consortium.
-
13:24
GeoSolutions: GeoSolutions is now a Cesium Certified Developer – 3D Tiles
sur Planet OSGeoYou must be logged into the site to view this content.
-
10:15
Oslandia: (Fr) [En image] Giros 360 : un jumeau numérique pour la Garonne
sur Planet OSGeoSorry, this entry is only available in French.
-
19:19
gvSIG Batoví: NUEVO GRUPO TELEGRAM PARA URUGUAY (PERO ABIERTO A OTROS…)
sur Planet OSGeo
Hay un nuevo grupo en Telegram para los «geoinquietos»; de Uruguay pero abierto a todo aquel que quiera sumarse. Para compartir información, oportunidades de formación, becas, inquietudes, consultas, y todo aquello vinculado de algún modo a lo geoespacial. Siempre con respeto y buena onda:
Los invitamos a unirse.
-
12:44
Insights from Innovation Days 2023
sur Open Geospatial Consortium (OGC)At the end of another year of prototyping software, experimenting with data access, and debating how to overcome geospatial technology’s many challenges, teams from OGC member organizations gathered in Washington DC to share 2023’s work and help OGC decide what challenges we should address in 2024.
Representatives of government agencies and industry – from FEMA and Natural Resources Canada, to Intact, Canada’s largest insurer – highlighted their successes, current needs, and aspirations. Through panel discussions, demos, and conversations over coffee, teams from startups, like FloodMapp and Navteca, to established industry players, like Bentley Systems and GDIT, shared what they could do to meet today’s needs and shape the tools and systems we’ll be using next.
Here are three key takeaways learned from listening in:
- While looking at maps is the obvious way to interact with spatial data, advances in Artificial Intelligence (AI) mean that a conversation with a map may become normal. Though what this change implies is less clear.
- Sensors, surveys, and citizens continue to produce data at scale. Different approaches – from indexing and cataloging to tagging and the semantic web – help us navigate this endless sea of data, yet too often unable to find the right data when we need it.
- If we were to add another ‘A’ to the FAIR Principles, it might stand for ‘Actionable.’ Even when you can find the data you need, access it, and combine it with other data, robust methods for transforming all that data into actionable intelligence remain limited. The push for organizations to report on how their data supports their decisions may, in 2024, drive collaboration on Standards for describing chains of modeling, inference, and reasoning.
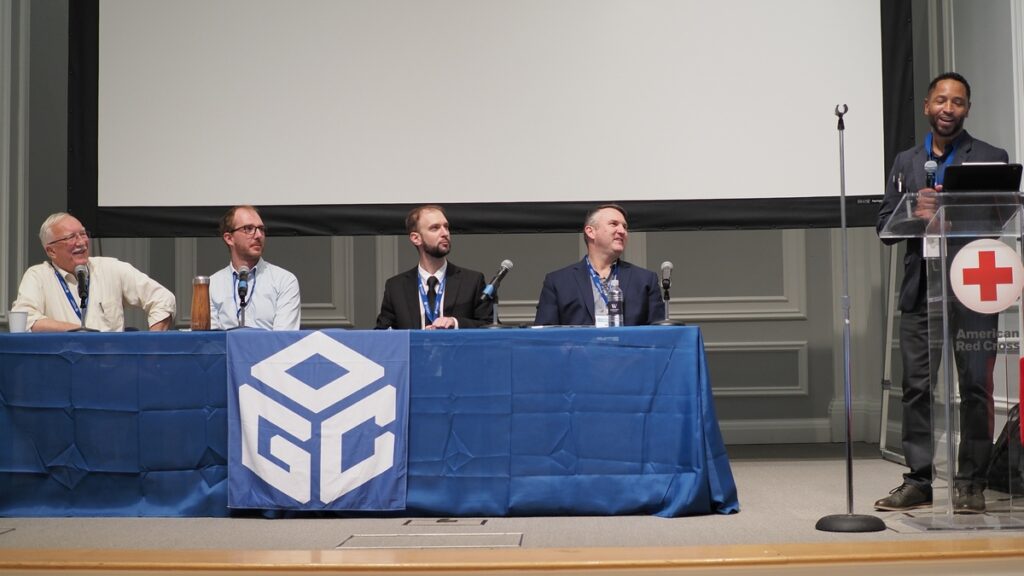 Moderator Eldrich L. Frazier (FGDC and panelists Ryan Ahola (NRCan), Matt Webster (Barbaricum) Tom Landry (Intact Financial Corporation) and Jim Antonisse (WiSC) discuss the transformative power of Geospatial Artificial Intelligence (GeoAI).
AI is changing how we interact with maps and spatial data
Moderator Eldrich L. Frazier (FGDC and panelists Ryan Ahola (NRCan), Matt Webster (Barbaricum) Tom Landry (Intact Financial Corporation) and Jim Antonisse (WiSC) discuss the transformative power of Geospatial Artificial Intelligence (GeoAI).
AI is changing how we interact with maps and spatial data
Following the late 2022 public launch of ChatGPT, “AI” became mainstream in 2023 – and its applications in geospatial broadened. This was clear at Innovation Days 2023.
In the early 2020s, excitement around AI in the geospatial tech community centered around automating the laborious process of identifying the important objects in satellite images and pulling out key data points from large datasets. This transformed the work of many geospatial analysts and developers, as noted by AI Panel chair Rich Frazier (USGS), but had limited impact on how most people interact with maps and spatial data. The panel’s conversation on AI centered on the potential consequences of our newfound ability to speak to an AI tool and ask it to create a map or run a spatial analysis.
Many of us are already doing this in specific contexts, such as asking your phone for driving directions, but advanced spatial analysis still requires mice and menus. This is why Natural Language Processing (NLP) felt like such a breakthrough in 2023. First, it has the potential to bypass specialized software and technical language and almost remove the barrier to entry for harnessing geospatial data. It’s therefore no surprise that NLP featured in several presentations, including those by Navteca co-founder Shayna Solis and Voyager Search’s founder Brian Goldin. Additionally, it might let developers and analysts operate more efficiently and create better products. As highlighted by Matt Webster of Barbaricum, who paraphrased economist Richard Baldwin from his presentation at the May 2023 World Economic Forum’s Growth Summit, “AI won’t take your job, but someone using AI will.” The specialist using NLP AI technology has another tool to deploy and they’re likely to use it to their advantage.
 Shayna Solis, CEO & Co-founder of Navteca demonstrated using Conversational AI to interact with geospatial data for disaster response.
The takeaway is that the current stage of AI not only democratizes access to geospatial information but also enhances user experience and engagement – if we can learn to ask the right questions with the right words. This is the sticky part of the problem. If geospatial really is in everything, there’s a diverse set of questions (aka prompt engineering) for us to teach the NLP AIs to understand. The organizations who gathered at Innovation Days 2023 might start building lots of one-task NLP tools, proliferating the “driving directions” application, or aim for more general ways of describing our mapmaking aims when we speak with an AI tool. Either way, this area looks set for a busy 2024.
Finding the right data when we need it is still too hard“When it comes to asset-scale climate resilience planning, most people don’t want data, they want data-based answers to key questions. Our challenge is helping them extract actionable intelligence from our data in the form of plain-language answers to their questions.”
David Herring, Communication, Education and Engagement Division Chief – NOAA Climate Program Office.A common refrain at Innovation Days 2023 was the ongoing difficulty surfacing the ‘right data’ when it’s needed. Scott Kaplan (USGS, Civil Air Patrol) spoke about the critical need for the ‘right data’ to support crews fighting wildfires. Kasie Richards (American Red Cross) called out the need for the ‘right data’ for planning for future patterns of extreme weather events that will look different from the past. Tom Landry (Intact) pointed to the need to enable public-private partnerships that could make the ‘right data’ held by private entities discoverable and usable for applications that benefit the public.
Catalogs, indexes, semantic knowledge organization systems, and machine-readable metadata systems have proliferated as organizations attempt to keep pace with the growth in data, but the conversations among panelists suggest that these approaches haven’t solved the problem – and it’s worsening as more data is generated.
Alan Lediner (NYC GISMO) characterized the inability to ask for and find what we need in all this data as a “communication problem.” This framing links what we’re stuck on (finding the right data) to where we’re moving toward (using natural language prompts) but requires (again) that we figure out how to describe what we mean when we say ‘the right data.’
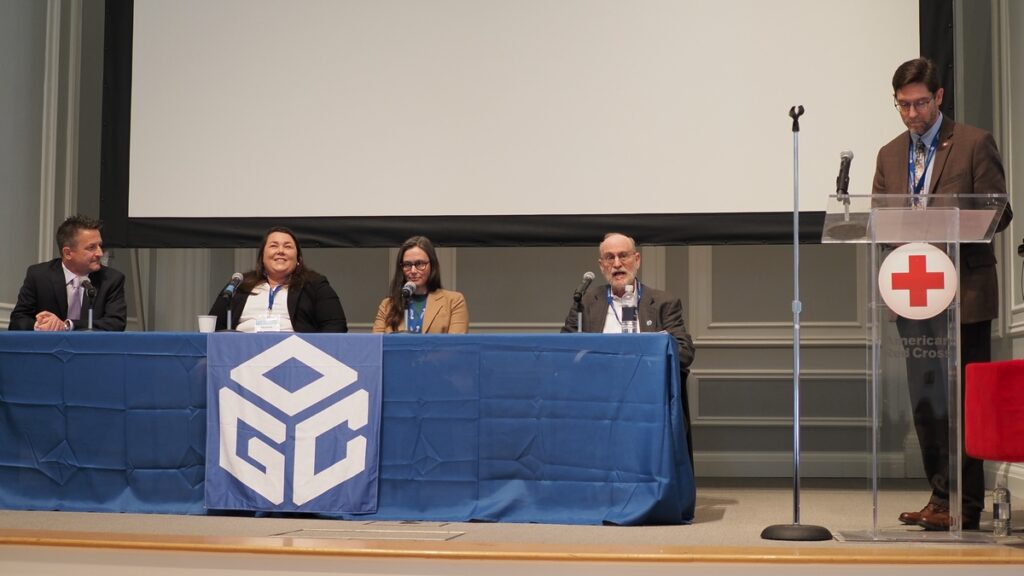 Discussions about how to find the right data were threaded throughout the panels at Innovation Days 2023, highlighted by Alan Leidner speaking about data for emergency response.
There’s another factor that makes addressing the findability problem particularly urgent for 2024: spiraling costs due to duplication. People often make local copies of data they think they’ll need so that they can later access it quickly and reprocess it on their own infrastructure. Dave Borges (CEOS, NASA) pointed to the unintended consequences of this widespread practice: spiraling financial (and environmental) costs, and, perversely, greater difficulty finding the ‘right’ version of a dataset, as multiple organizations make their own versions of datasets cloud-accessible. It’s hard to see us breaking this habit without creating confidence that other organization’s datasets will be findable (and generally FAIR) when they’re needed. Designs that account for people’s behavior and attitudes toward their data sources may push forward Findability as the organizations gathered at Innovation Days 2023 build the next cloud-native geospatial systems.
Data is actionable when it is accountableResponding to emergencies, preparing for future extreme events, and redesigning infrastructures for resilience in a changing climate are all high-stakes uses of geospatial data and technologies that impact lives and communities. Craig Fugate (FEMA), in his keynote at Innovation Days 2023, emphasized these impacts.
 Craig Fugate, Former Administrator, Federal Emergency Management Agency (FEMA), during his keynote address.
Craig encouraged us to think differently about our challenges, suggesting specific changes like taking a “maximum of maximums approach” when formulating an emergency response plan that can quickly scale up the response as an emergency is unfolding. Equally important, in his judgment, were proposed changes to longer term planning and response, such as explicitly considering equity and equality when planning how to deploy resources to prevent disasters or rebuild after they occur. This push for innovation, many years in the making and challenging in its own right, is facing new complications as it intersects with a growing drive for accountability.
Accountability, and the ability to demonstrate that decisions were backed by sound data and reasoning, is emerging as an essential part of decision-making processes – particularly for government and public sector organizations. It’s also supporting new, effective practices because it can allow people and organizations to confidently back the changes made. Synthesizing comments from Shanna McClain (NASA), Norman Speicher (DHS), and Ryan Ahola (NRCan), this in practice means the geospatial community needs to develop methods and systems that allow audits of the complex chains of data, models, tools, and people that inform decisions.
Building these methods and systems will require organizations to grapple with how we express uncertainty, which is only compounded by the growing use of AI tools. One example of how this challenge may play out came from the AI Panel’s discussion on visually representing results in ways that won’t impart false confidence. Juliette Murphy’s (FloodMapp) presentation provided another, highlighting the challenges of getting people to think in terms of probabilities when buying a home in a flood-prone area. Looking to 2024, expect to see considerations of uncertainty and accountability continue to intersect as new geospatial approaches to climate & disaster resilience are developed.
 Juliette Murphy (FloodMapp) discusses the challenges of conveying uncertainty, probability and risk.
What comes next?
Juliette Murphy (FloodMapp) discusses the challenges of conveying uncertainty, probability and risk.
What comes next?
The tendency for geospatial organizations to operate as “Silos of Excellence” was a common theme brought up by several speakers at Innovation Days 2023. The collaborative, consensus-driven approach that underpins all activities at OGC is a proven method for overcoming this challenge. Progress in 2024 will require more collaboration across the community, including between those who use geospatial tools and those affected by the decisions they’re informing. Indeed, how we interact with location data, how we find the geospatial information we need, and how we make data-driven decisions accountable are all issues being tackled by our community through OGC COSI Initiatives, Working Groups, and events. A few to look out for in 2024:
- The OGC Artificial Intelligence in Geoinformatics Domain Working Group (GeoAI DWG) is exploring the implications of natural language processing (NLP) integration with GIS. This public group is broadly focused on fostering collaboration among diverse stakeholders to address gaps and impacts of AI on OGC standards, and is launching a monthly speaker series in early 2024.
- SpatioTemporal Asset Catalog (STAC) is a proposed OGC Community Standard that conforms to OGC APIs and provides an interoperable metadata framework that simplifies the process of finding and using geospatial assets from different providers. In 2024, multiple OGC Code Sprints will continue to give our community a platform to collaborate on emerging OGC and Community Standards and implementations.
- Trust is an essential component of producing actionable geospatial intelligence. As the push continues towards interoperable tool chains for modeling, inference, and reasoning, Standards such as OGC Training Data Markup Language for Artificial Intelligence (TrainingDML-AI) can improve trustworthiness by formalizing how modeling training data is prepared, including data provenance and quality. The Training Data Markup Language for AI Standards Working Group will continue this important work in 2024.
- The Climate and Disaster Resilience Pilot will kick off in Spring 2024, continuing to prototype new Standards-based tools, models, and methods for critical applications – from building warning systems that support natural disaster response to integrating Climate models into emergency management planning. There’s still time to apply to participate and receive funding to address these critical challenges.
By necessity, this blog is only able to cover a small snapshot of the many discussions, insights, and conversations resulting from OGC Innovation Days 2023. A big thank you goes out to all the presenters, panelists, attendees, and other OGC community members that helped make it such a success.
We look forward to seeing many of our community members at the 128th OGC Member Meeting in Delft, Netherlands, March 25-29, and later at OGC Innovation Days 2024.
Want to join the conversation around collaboration and innovation across geospatial data and technologies? Contact OGC or sign up to the OGC Newsletter to hear about upcoming events, funding opportunities, and the latest geospatial Standards.
The post Insights from Innovation Days 2023 appeared first on Open Geospatial Consortium.
-
16:00
Announcing the 2024 Joint OGC ASF OSGeo Code Sprint
sur Open Geospatial Consortium (OGC)The Open Geospatial Consortium (OGC), Apache Software Foundation (ASF), and Open Source Geospatial Foundation (OSGeo) are pleased to announce the date of the 4th annual Joint OGC ASF OSGeo Code Sprint as February 26-28, 2024.
As a hybrid event, the face-to-face component will be held in Casa Cordovil-Universidade de Évora (Évora, Portugal), while the virtual component will be held via the OGC Events Discord server. Registration for the code sprint is free and open to the general public here.
The code sprint will be hosted by Universidade de Évora, NaturalGIS and Geobeyond. Catering will be sponsored by NaturalGIS, Geobeyond and the European Union-funded GEOE3 project. Further sponsorship opportunities remain available: see below for more information.
The code sprint will engage with multiple ASF and OSGeo projects, supported by OGC Standards – including OGC API Standards, the building blocks for location on the web. All OGC, Apache, and OSGeo projects, working groups, and members, as well as the wider public, are encouraged to participate. In addition to developers, technical writers are also encouraged to participate to help the various projects and working groups with their documentation.
A code sprint is a collaborative and inclusive event driven by innovative and rapid programming with minimal process and organization constraints to support the development of new applications and candidate Standards.
The goal of the 2024 Joint OGC ASF OSGeo Code Sprint is to advance support of open geospatial Standards within the developer community, while also advancing the Standards themselves. The code sprint will provide software developers a period of three days in which to focus on projects that implement open geospatial Standards.
There will be an opportunity for joint discussion with other participants, as well as daily briefings from each project and working group. However, the majority of the time will be spent in collaboration between participants in active coding and related activities such as testing, reporting issues, and working on documentation.
The sprint will also provide a mentor stream that’s aimed at developers who are not yet familiar with the software projects and Standards. Through tutorials and 1:1 mentoring, the mentor stream aims to support developers in taking the first steps in their journey toward mastery of open geospatial Standards and projects.
For more information on the code sprint, including registration, the projects and Standards involved, and FAQ, visit the 2024 Joint OGC-ASF-OSGeo Code Sprint website. Registration for in-person participation closes at 9:00am WET on the 19th of February, 2024. Registration for remote participation will remain open throughout the code sprint.
To set the context of the code sprint, and to help participants prepare, there will be a one-hour pre-event webinar on Discord at 14:00 WET/UTC/GMT, on February 20.
The agenda and other logistical information about the code sprint can be found on the 2024 Joint OGC – OSGeo – ASF Code Sprint GitHub Wiki. Information on other OGC Sprints or events for developers can be found on the OGC Developer Events wiki on GitHub.
Event SponsorshipOpportunities to sponsor the code sprint remain available. A range of packages are available that offer different opportunities for organizations to support the geospatial development community while promoting their products or services. Visit the OGC Code Sprint sponsorship page for more information. Organizations interested in sponsoring the Code Sprint should contact the OGC Standards Program and OSGeo point of contact.
About OSGeo
OSGeo is a not-for-profit organization whose mission is to foster global adoption of open geospatial technology by being an inclusive software foundation devoted to an open philosophy and participatory community driven development.About the Apache Software Foundation
Since 1999, The Apache Software Foundation has been shepherding, developing, and incubating Open Source innovations “The Apache Way”. The ASF’s all-volunteer community comprising 816 individual Members and 8,500 Committers on six continents steward 227M+ lines of code, oversee 350+ Apache projects and their communities, and provide $22B+ worth of software to the public at 100% no cost.The post Announcing the 2024 Joint OGC ASF OSGeo Code Sprint appeared first on Open Geospatial Consortium.
-
1:00
Sean Gillies: 2024 running goals
sur Planet OSGeoI've registered for the Never Summer 100K (my 3rd) at the end of July, the Black Squirrel Trail Half-Marathon (my 4th) in early September, and the Bear 100 Mile at the end of September (my 2nd try). All are events that I've run before, but never as a set. I ran Never Summer and Black Squirrel together in 2021. I did the shorter 60K version of Never Summer last year along with the Bear.
I intend to do Never Summer as part of my build up for the Bear 100. I'll give it a good go, but stay composed, and be mindful that it will be just the first week of my peak training block. I registered for Black Squirrel because I've missed running it, could be really fit that week, and some faster running might be a fun break from the long slogs of late summer.
Finishing the Bear 100 is my number one goal. I'd like to finish and do well at Never Summer and Black Squirrel, too, but am ready to sacrifice these goals if I must.
Along the way to finishing the Bear I'm going to try to add 250 miles at 220 feet per mile to last year's numbers, so 1850 miles running and 275,000 feet of climbing. This is feasible if things go well. I ran 2000 miles in 2021.
I aim to lose at least 15 pounds in the next 9 months so I don't have to drag them for 30 hours through the mountains of Utah and Idaho. I'll have to omit junk food and DIPAs to do it. In their place, I can work on training my stomach to handle Spring Energy gels.
My last goal is to increase the flexibility and durability of my ankles so that I have a better chance of weathering the trails of the Bear in 2024. I'm planning to get some physical therapy help on this early this next spring.
Good luck in reaching your own goals for next year, whether they are on or off trail!
-
21:53
Tom Kralidis: Cheers to 2023
sur Planet OSGeo2023 was a memorable year and quite the ride! Eventful and full swing on so many fronts. Here’s the annual rundown: pygeoapi: two releases, lots of development at code sprints and continuous improvement for the project. Dutch API rules, CRS and increased support for the various standards as they evolve. As well, numerous valuable discussions […] -
3:34
Sean Gillies: Running in 2023
sur Planet OSGeo2023 was a pretty good running year. I was both ambitious and conservative, overcame some adversity and learned a lot. The numbers for 2023:
363 hours
1610 miles
220,128 feet D+
3 ultra finishes
1 DNF
Coming off a down year, I signed up for my first 100 mile run, and tried to do it on fairly minimal training relative to the big miles I ran in 2021. I got my third Quad Rock 50 mile finish in May, did the Kettle Moraine 60K fun run in June, and the Never Summer 60K in July.
I had to manage and run through an episode of intense back pain in July, but recovered in time for the Bear 100 in September. At that race I was on track to finish in less than 36 hours, but wrecked my left ankle and dropped out at 61 miles. I'm going to try it again.
I ran fewer miles than in 2019-2021 years, but did a lot of climbing (including a new weekly total high), and started 4 ultra-marathons. That's a new high for me.
In 2024, I'll be trying a different mix of events. And I'll be back here at Kelly Lake.
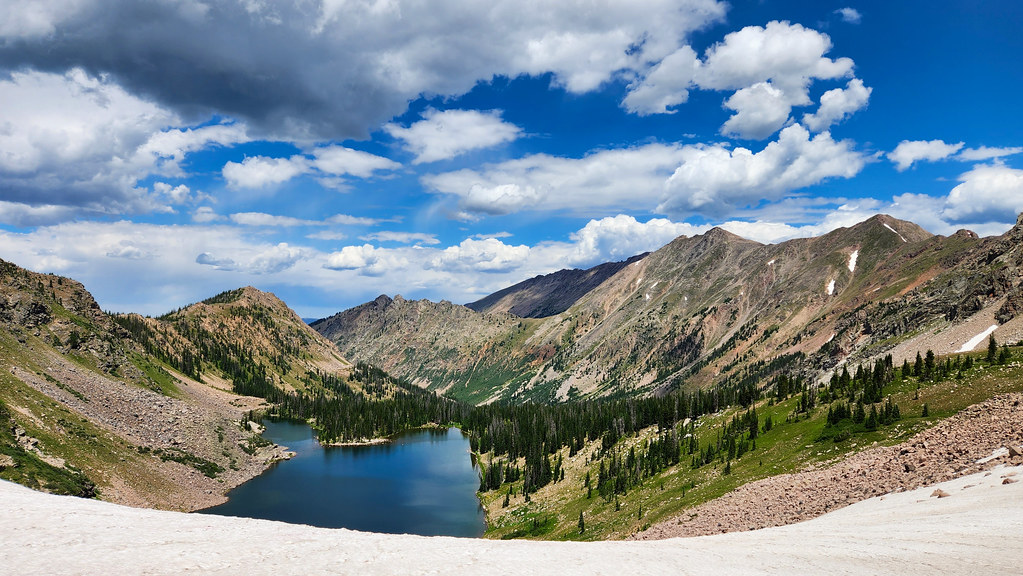
Kelly Lake at Never Summer 2023
-
14:38
From GIS to Remote Sensing: Remotior Sensus Update: Version 0.3
sur Planet OSGeoI'm glad to announce the update of Remotior Sensus to version 0.3.The main new feature is a new module for displaying an interface similar to the Semi-Automatic Classification Plugin (which is based on Remotior Sensus) in Jupyter notebooks.Jupyter notebooks are interactive documents that can be edited in a web browser, which allow for coding in Python and interact with widgets.
The Jupyter interface is still in development and only a few tools are available. For the moment, the available tools are:- search and download of remote sensing images;
- creation and management of Band Sets;
- the dock for creating a training input and saving ROIs created interactively through polygons or region growing;
- the import of vectors in training input;
- the plot of spectral signatures;
- the classification of the Band Sets;
- a file browser for selecting files or directories.
import remotior_sensus
rs = remotior_sensus.Session(n_processes=2, available_ram=1000)
rs.jupyter().download_interface()

Of course this is a proof of concept, considering that this interface doesn't have all the functions of the Semi-Automatic Classification Plugin, and there are a few differences in the look and feel because of the characteristics of Jupyter notebooks.A tutorial describing this new feature will be released soon.
For any comment or question, join the Facebook group or GitHub discussions about the Semi-Automatic Classification Plugin.
-
17:58
Andrea Antonello: SMASH 1.8 is out!
sur Planet OSGeoDear all, it has been a while, but some stuff has been going on in the SMASH community. And we now have a new release. So let's have a look at what is new.
We farewell the play storeIt is a while we have additional work to do and are loosing usability in SMASH due to the restrictions imposed by the google store. The most impacting has sure been the fact to not be able to access the phone memory freely. And asking google permission to do so didn't work out, since it seems that only file browsers applications and antivirus need to access the memory freely.
With the help of the F-Droid community (special thanks to IzzySoft, Linsu and Licaon-kter) we have been able to make our second appearance on the f-Droid store. And that is now enough to completely migrate there. So we made a last release of SMASH for the store today, but it will be the last one. Please from now on come and get SMASH from the F-Droid store, where the real open source apps live.
Flutter mapWe finally made an upgrade of flutter_map, the map widget library used. This took so long, because the architecture of the library had changed and took some rework inside SMASH.
And now on to the new features:
Geometries inside formsOne nice addition that we have to thank Luca Delucchi and the Digiagriapp for is the possibility to insert inside of complex notes.
URL based forms combosIt is now possible to insert in forms URLs to substitute long item lists in comboboxes (dropdown lists). This allows forms to be smaller in case of large amounts of items and also to be more dynamic.
Gejson layer supportGeojson is now one of the supported formats in read and write mode (together with geopackage and postgis). It can be used in combination with sld styling as for the other vector formats.
More efficient toolbarThe toolbar has been redone with more usability in mind.
Editing is done on a sidebar now:
and in the settings it is possible to remove unused buttons:
leads to:
Other tiny things that might be worth telling- now the default behavior of tile maps is to zoom beyond the max zoom level by scaling (no more white emptiness)
- the current log panel has now 3 sizes for better overlay on map
- the info tool is now a box selection tool and as such way more usable
- online sources have been reworked to have the possibility to add and remove from the default. Also the default maps have been reviewed to ensure they are working
- feature info now also presents the length and area of the geometry as derived value
- we did many many bugfixes
One last thing to add. SMASH 1.8 already presents the possibility to import layers from the new GSS server. This is still in testing mode and ongoing work with the Region Piemonte and not yet disseminated as such. Just to give an idea, it will be possible to generate database tables on the server based on form definitions and download the tables as layers from the GSS and sync them two-ways. Also it will allow for point, line and polygon geometries. All in all it will be an alternative way to take notes, still using the form system and having a way to synchronize data to teh central server instance. But well, this will probably be the next story to tell, once testing is done.
Enjoy!!
-
15:36
SIG Libre Uruguay: Y se va el último…
sur Planet OSGeo -
15:35
SIG Libre Uruguay: ¡Colombia bien representada!
sur Planet OSGeo -
15:25
gvSIG Batoví: Repaso a los proyectos premiados (final) en el Curso–Concurso Geoalfabetización mediante la utilización de Tecnologías de la Información Geográfica
sur Planet OSGeoPara despedirnos por este año elegimos comentar otro proyecto que bien podía haber integrado la lista de finalistas, y que por el altísimo nivel alcanzado, tal vez injustamente, ha quedado fuera del podio:
 Título: 10 años del Geoparque Mundial UNESCO Grutas del Palacio
Institución: Liceo Departamental N° 1
Localidad: Trinidad
Docente de referencia: Gerardo Moraes
Tutora: Nadia ChaerQueremos resaltar especialmente este proyecto por varias razones:
- porque realizaron una publicación como parte del proyecto, en la que utilizaron los mapas creados con gvSIG Batoví
- porque los estudiantes extendieron lo que habían aprendido a otros estudiantes, en este caso de Educación Primaria, a través de la realización de varios talleres en la escuela N°31 de Trinidad, departamento de Flores (Uruguay); pueden ver un video aquí
- y porque presentaron su proyecto de una forma muy interesante, amena e interactiva
Este proyecto, realizado por estudiantes de 5° Humanístico (16 y 17 años), ha destacado también por la gran cantidad y calidad de trabajo producido: hasta elaboraron los diplomas a entregar a los participantes de los talleres escolares antes mencionados.
Nuestras felicitaciones a todo el equipo por el estupendo proyecto que han desarrollado (¡en sólo 3 meses!). Y nuestras felicitaciones también a todos los demás equipos porque, como dijimos anteriormente, en esta iniciativa no hay perdedores, sólo ganadores.

-
16:29
gvSIG Batoví: Repaso a los proyectos premiados (IV) en el Curso–Concurso Geoalfabetización mediante la utilización de Tecnologías de la Información Geográfica
sur Planet OSGeoDedicamos este post muy especialmente a los proyectos participantes desde Colombia, ya que es la primera vez que esta iniciativa cuenta con concursantes extranjeros.
 equipo del proyecto 6 Turismo, Desarrollo y Medio Ambiente en Choachí presentando mediante video-conferencia su trabajo frente a los demás equipos concursantes
Para ello contamos con la colaboración de la Gobernación de Cundinamarca, a través de su Secretaría de Educación, que nos permitió extender la iniciativa del curso-concurso a todas la IED (instituciones educativas departamentales) de ese departamento colombiano.
 defensa final del proyecto 8 Conectando con el Agua: Georreferenciando El «Páramo de Guerrero» en Subachoque y su Importancia Hídrica frente a integrantes del jurado, y acompañados por su tutor
Todos los equipos han hecho un excelente trabajo, a pesar de las dificultades que el traslado de la experiencia naturalmente implicaba: trabajo 100 % desde la virtualidad, aprendizaje de tecnologías desconocidas hasta el momento, diferencias culturales, dificultades en cuanto a la conectividad, etc. Al respecto cabe destacar la actitud de todos los equipos, siempre con la mejor disposición para capacitarse y para comprender los inconvenientes que pudieran surgir, así como para compartir conocimientos y aprendizajes.
 el equipo del proyecto 11 Mapeando nuestro territorio: Tabio compartiendo su trabajo con los demás participantes
Queremos agradecer muy especialmente a quienes colaboraron desde la Secretaría de Educación de la Gobernación de Cundinamarca (Colombia), en particular a Efraín Castro; también a los equipos que se animaron a participar de la iniciativa y que han realizado impresionantes trabajos, además de demostrar una enorme paciencia hacia nosotros, organizadores de la propuesta; por último pero no menos importante, a Luis Vilches por haber logrado que esta participación desde Colombia finalmente se pudiera concretar. De nuestra parte, nos sentimos muy privilegiados de haber compartido un año más este proyecto con todos ustedes, e inmensamente agradecidos pues -una vez más- hemos aprendido mucho todos nosotros de esta hermosa experiencia.
 logo proyecto 6
 logo proyecto 8
 logo proyecto 11
Por decisión del jurado resultó ganador el proyecto 6. El mismo fue desarrollado por estudiantes de décimo y undécimo grado de la IED Ignacio Pescador de la localidad de Choachí, siendo su docente de referencia la profesora Astrid Corredor. Asistió como tutor Neftalí Sillero, de la Faculdade de Ciências da Universidade do Porto (Portugal)
Pueden acceder a los demás proyectos en los siguientes enlaces:
proyecto 8: Conectando con el Agua: Georreferenciando El «Páramo de Guerrero» en Subachoque y su Importancia Hídrica, de estudiantes de séptimo, octavo y décimo de la IED La Pradera de la localidad de Subachoque. Docente de referencia: Sandra Milena Diaz Vargas; tutor: Antoni Pérez Navarro, profesor de los Estudios de Informática, Multimedia y Telecomunicación, Universitat Oberta de Catalunya (España);
proyecto 11: Recurso hídrico del municipio de Tabio: cuidado y preservación de la subcuenca del Río Chicú, de estudiantes de noveno y décimo de la IED Instituto Tecnico Comercial José de San Martín de la localidad de Tabio. Docente de referencia: John Castrillón; Tutora: Nadia Chaer, de la Comunidad gvSIG Uruguay (Uruguay);
-
16:00
QGIS España: Participación en la GeoCamp 2023
sur Planet OSGeoGeoCamp ESGeoCamp es un congreso nacional sin ánimo de lucro, que nació en 2013 y que organiza anualmente el colectivo internacional de Geoinquietos. Esta Comunidad está formada por grupos informales que se reúnen para hablar y aprender sobre cualquier tema relacionado con las ciencias de la tierra y que siente una especial afinidad por los servicios de geodatos abiertos, proyectos comunitarios, software libre y aplicaciones SIG (Sistemas de Información Geográfica), especialmente los desarrollados en torno a la comunidad OSGeo (Open Source Geospatial).
Este año Geocamp ha celebrado su 10ª Edición en septiembre en la isla de la Illa de San Simón en la ría de Vigo (Galicia - España) y ha tenido un formato Open Space, donde todos los participantes tienen un papel activo en la realización del evento para aumentar la interacción entre los asistentes para poder, con agilidad e improvisación, satisfacer espontáneamente las inquietudes de los participantes.
Empezó el evento con un maravilloso día soleado y con la isla de San Simón recibiendo a los más de 40 participantes que llegamos en barco desde el puerto de Vigo atravesando la ría, en un viaje muy interesante, amenizado con la información histórica y cultura local de mano de los tripulantes. La pequeña isla con sus históricos edificios donde se podían configurar varios espacios, permitió la realización de numerosas actividades y reuniones, tanto dentro como en el exterior.
A lo largo de la jornada se pudieron realizar seis espacios abiertos donde se habló y debatió sobre los temas que se eligieron por la propia iniciativa, interés y propuestas de los asistentes, y que fueron votados y aceptados por todos y cuyos puntos a destacar se pueden consultar aquí, documento resumen elaborado de forma conjunta por los participantes: OSM, Las Calles de las Mujeres, Geoportales participativos, JS y Web GL, Inteligencia Artificial y mapas, Teledetección, estado de las Comunidades, Estándares OGC y Blockchain.
La charla plenaria que ofreció Carmen Torrecillas de la organización Civio nos mostró cómo hacer mapas y visualizaciones increíbles, gracias al gran trabajo que hacen por la transparencia y la vigilancia de los poderes públicos.
Por supuesto, además, se comentaron todo tipo de inquietudes, experiencias, proyectos y objetivos (cómo la forma de manipular un pixel en la GPU, monitoreo de cetáceos, cooperativas, Joomla, montañismo, conjuros, etc.) a lo largo de todos los momentos en los que se pudo charlar mientras se disfrutaba de los ricos manjares gallegos, con los que se amenizaron los desayunos, comida y cena en un ambiente amable y creativo. Incluso pudimos disfrutar de fantásticas experiencias de la mano de nuestros organizadores fuera de programa como un concierto de rock ( @fpsampayo) o una queimada ( @michogar) cómo no podía ser de otra manera en esta maravillosa ciudad gallega.
La organización local reservó una cena para aquellos que querían seguir compartiendo charlas y espacio. Aunque no es algo estrictamente necesario en un evento participativo como este, siempre ayuda a crear contactos y sinergias. De hecho, muchos de los asistentes, sobre todo si han tenido que venir de otras partes de la península y tienen que hacer noche en la ciudad, lo agradecieron y acudieron para cerrar de una manera festiva el encuentro.
Como conclusiones, señalar que el formato de Open Space funcionó muy bien, contando con un amplio espacio disponible lo que facilitó la organización e incluso la gente se podría haber repartido en más grupos si hubiera sido necesario. De hecho, con grupos algo más reducidos se puede trabajar mejor la participación, aunque fue en éxito con grupos de unas 20 personas. Fue de agradecer haber previsto, mediante un formulario que se hizo llegar a los asistentes, una serie previa de temas a tratar agilizando la organización de los grupos. Realmente es un formato único para crear comunidad, aprender cosas nuevas y llevarse a casa un buen número de conocimientos e ideas. Muy gratificante haber podido conocer gente que no sabía lo que era este tipo de evento y que se encuentran con una experiencia realmente satisfactoria, donde se han podido compartir conocimientos en un ambiente participativo y distendido, que ayuda realmente a contactar a personas que ya tienen experiencia con otras que pueden estar empezando.
Habrá que esperar al año que viene para volver a disfrutar de nuevo de un encuentro tan especial como este.
AgradecimientosFelicitaciones a la organización:
Micho ( @michogar), Paco ( @fpsampayo), Pablo ( @psanxiao), Carmen ( @carmen10maica) y Jorge ( @xurxosanz) por montar el evento, así como a Xeoinquedos y Ghandalf por la cobertura.
También por supuesto a los que han confiado y apoyado económicamente el evento, ya que sin ellos no hubiera sido posible llevarlo a tan buen término (por orden cronológico de participación):
Elastic; QGIS España; B’GEO; PSIG; solucions geografiques; GeoInnova; icarto.es/; Master SIG, UNIGIS Girona; geomatico; conterra; OSGeo; asefor; abtemas; Xunta de Galicia
Enlaces de interés-
Web del evento: [2023.geocamp.es]
-
Ediciones de GeocampES: [https:]]
-
Resumen del evento: [https:]]
-
@geocampes en X/Twitter: [https:]]
-
Grupo de GeoCamp - 2023 en Telegram: [https:]]
-
Geocamp2023 en Instagram:
-
-
21:34
SIG Libre Uruguay: ¡UTU presente!
sur Planet OSGeo -
21:33
SIG Libre Uruguay: sucu67
sur Planet OSGeo -
21:32
SIG Libre Uruguay: Vale la pena echarle un vistazo…
sur Planet OSGeo -
16:20
gvSIG Batoví: Repaso a los proyectos premiados (III) en el Curso–Concurso Geoalfabetización mediante la utilización de Tecnologías de la Información Geográfica
sur Planet OSGeoFinalizando este repaso a los proyectos uruguayos premiados, toca el turno al proyecto N°3 denominado Geo 7°F.
 el equipo presentando su proyecto frente a los demás equipos concursantes
El proyecto fue desarrollado por estudiantes (de 12 y 13 años) de la Escuela Técnica N°2 CME de la ciudad de Salto. La docente de referencia fue la profesora Daiana Olivera y el tutor del proyecto fue Romel Vázquez de la Universidad Central «Marta Abreu» de Las Villas (Cuba). El tema elegido fue el de las crecidas del río Uruguay y su influencia en la población de la ciudad de Salto.
 logo del proyecto
Todos los proyectos han tenido sus particularidades; en este caso se trata del primer proyecto premiado perteneciente a una Escuela Técnica, siendo éste el primer año en que participan. La evolución que ha tenido este proyecto -en los escasos 3 meses de desarrollo- ha sido fantástica.
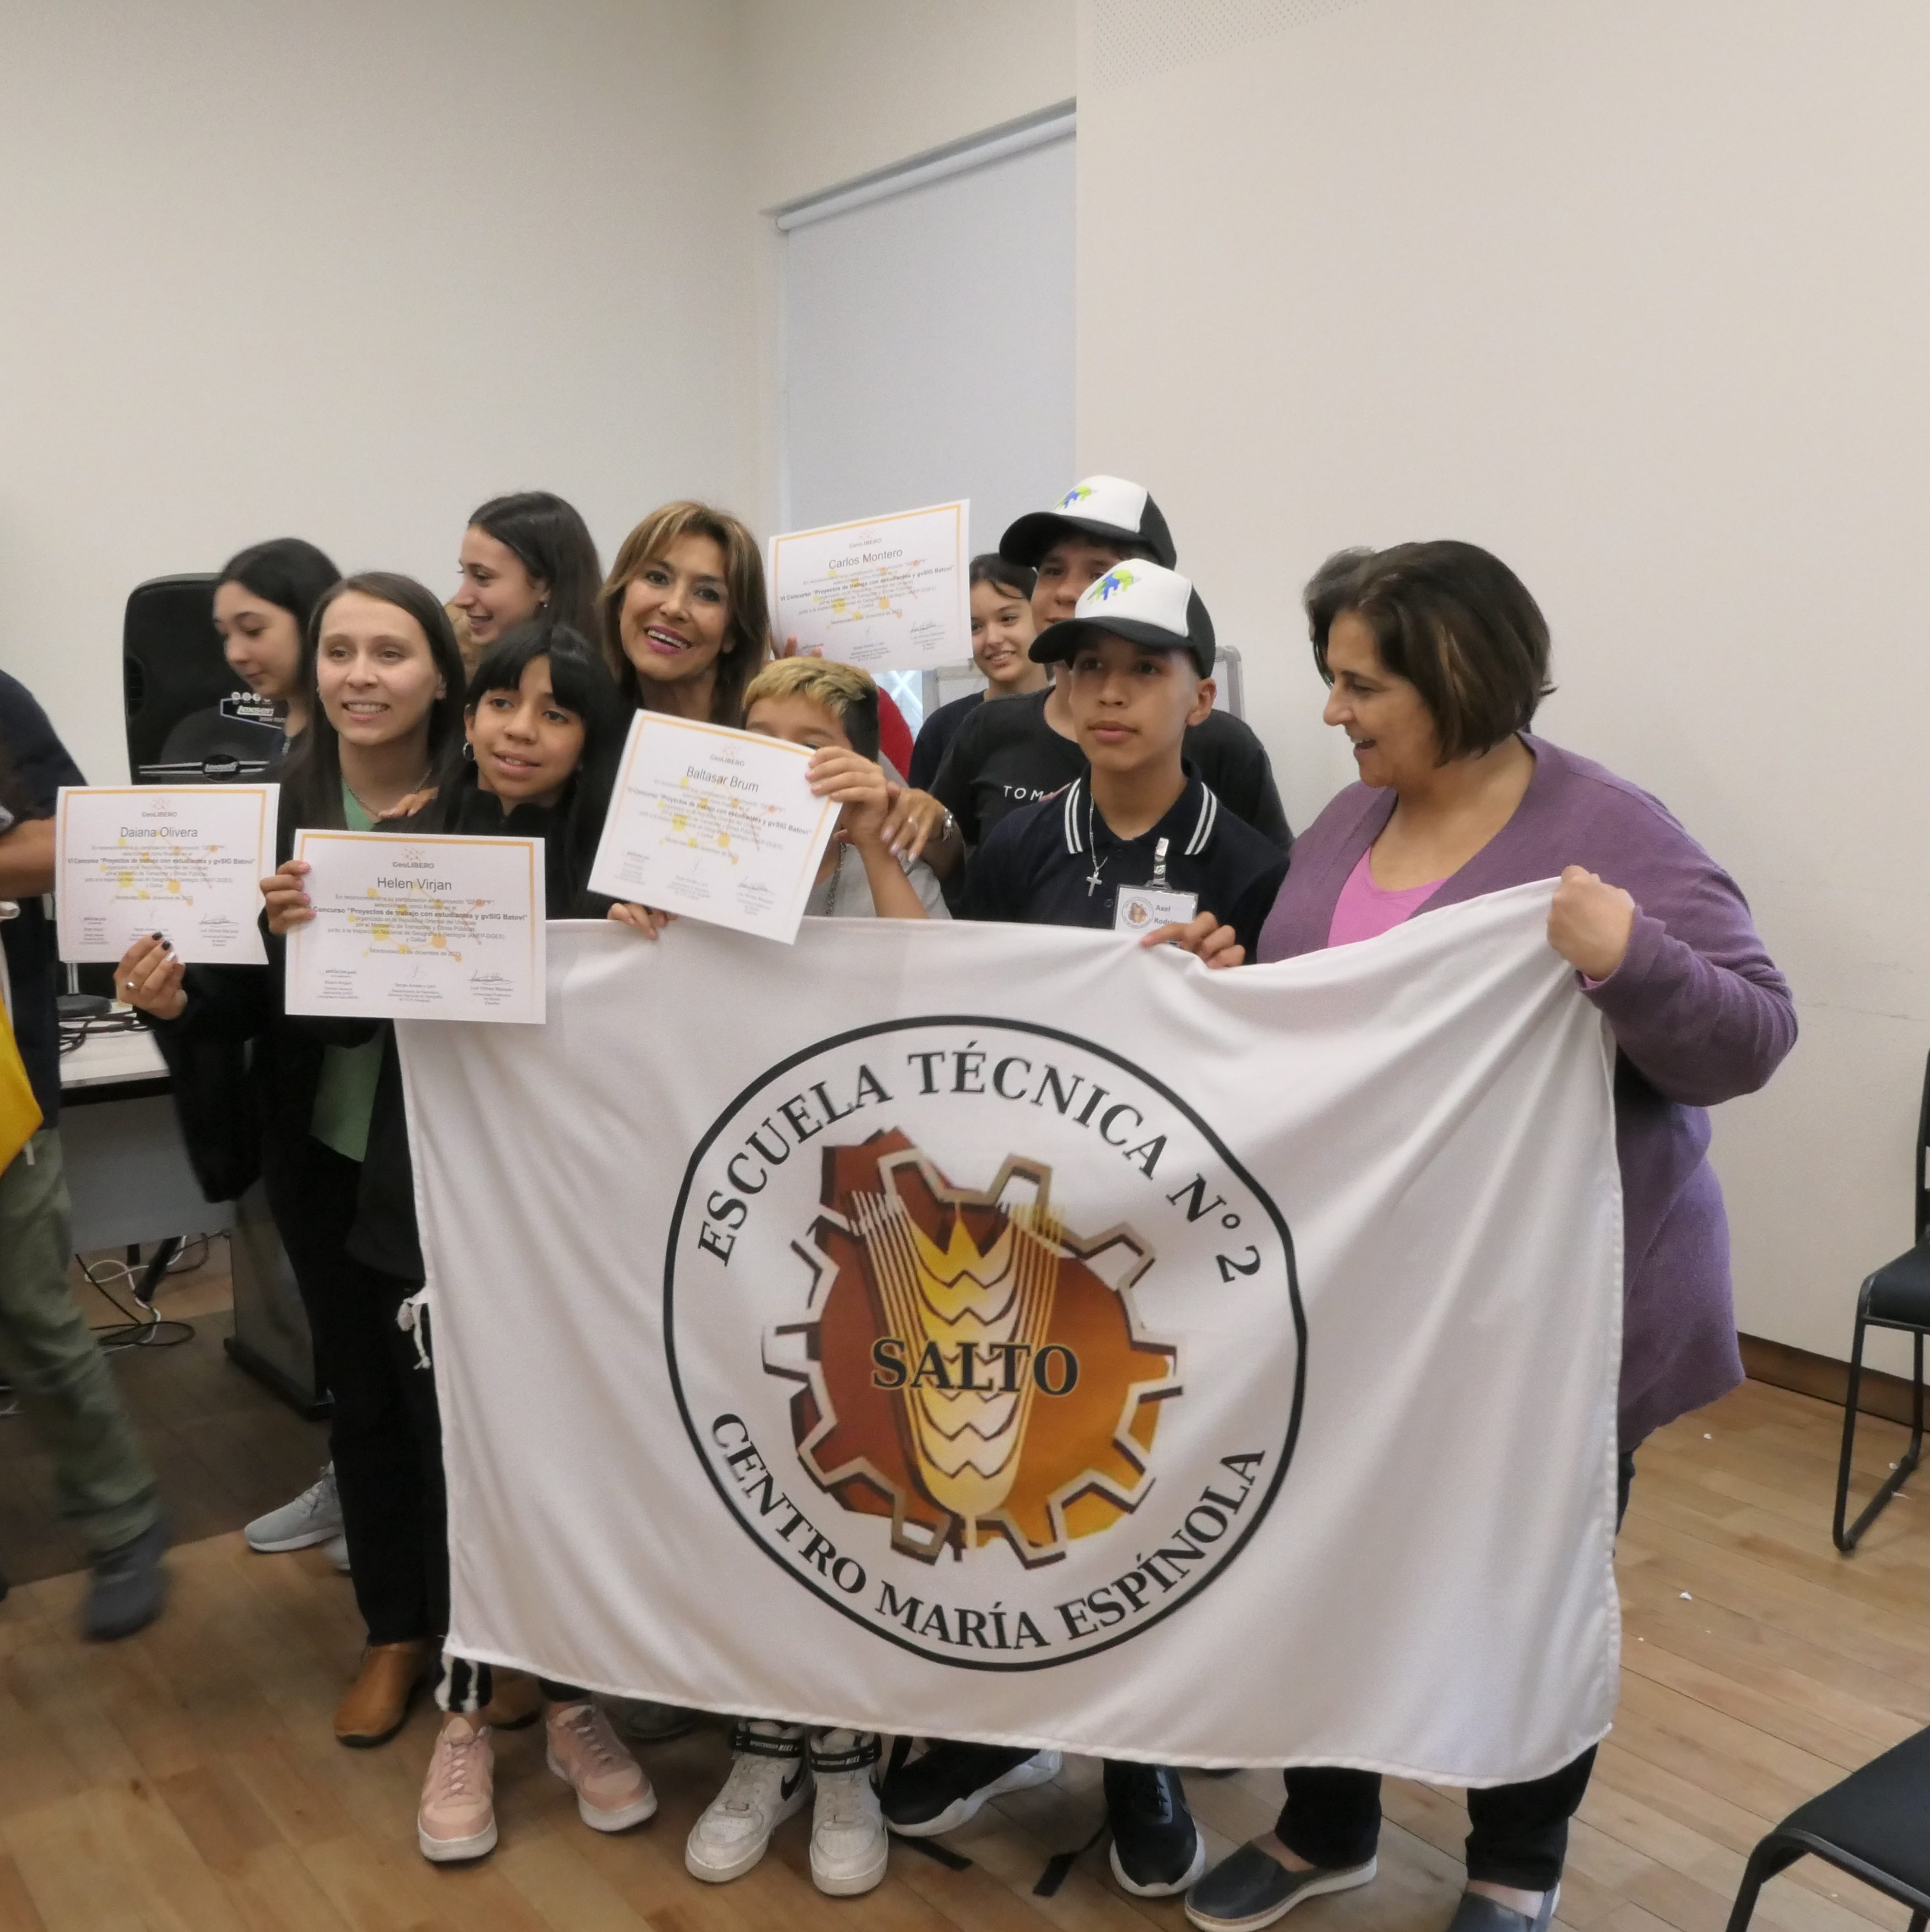 el equipo recibiendo su merecido diploma, junto a autoridades de la enseñanza
Es emocionante ver cómo cada equipo se entusiasma con sus proyectos, lo que se percibe en la jornada de cierre, a la que concurren con remeras, gorros y banderas con el logo que ellos mismos elaboraron (y algún souvenir más, como el caso de este equipo):
Pueden acceder al proyecto aquí
Queremos felicitar a todos los integrantes de equipo del Proyecto Nº3 Geo 7°F por su increíble trabajo
-
0:00
QGIS Blog: QGIS Annual General Meeting – 2023
sur Planet OSGeoDear QGIS Community,
We recently held our 2023 QGIS Annual General Meeting. The minutes of this meeting are available for all to view.
This year, we did not have PSC elections. Anita Graser will continue as Vice-Chair, I will continue to serve on the PSC as chair, and our longstanding treasurer, Andreas Neumann, will complete the board. Furthermore, Jürgen Fischer, Alessandro Pasotti, and Régis Haubourg will continue on the PSC. Last but certainly not least, the PSC is completed by our project founder, Gary Sherman, and long-term PSC member Tim Sutton, who serve on the PSC as honorary PSC members. They both set the standard for our excellent project culture, and it is great to have his continued presence.
QGIS has been growing from strength to strength, backed by a fantastic community of kind and collaborative users, developers, contributors and funders. This year, we reached another important milestone for the project’s sustainability by welcoming our first flagship sustaining member – Felt. I look forward to seeing how it continues to grow and flourish.
Rock on QGIS!
Cheers
Marco Bernasocchi (QGIS.ORG Chair)
-
17:29
gvSIG Batoví: Repaso a los proyectos premiados (II) en el Curso–Concurso Geoalfabetización mediante la utilización de Tecnologías de la Información Geográfica
sur Planet OSGeoHoy nos toca comentar el proyecto N°5 denominado Mentes en crecimiento: Estudio de la leishmaniasis en el contexto del liceo N°2 de Salto: amenazas, debilidades, fortalezas y oportunidades en la actualidad. Este proyecto merece un destaque especial pues es continuación de otro que concursó en la edición anterior (de 2022) y que también resultó premiado.
 el equipo presentando su proyecto frente a los demás equipos concursantes
El proyecto fue elaborado por estudiantes del Liceo Nº2 Dr. Antonio M. Grompone de la ciudad de Salto, siendo su docente de referencia la profesora María Patricia Leal, y su tutor Carlos Lara de la Facultad de Ciencias de la Universidad Católica de la Santísima Concepción (Chile). El tema del proyecto fue realizar un estudio descriptivo sobre las condiciones ambientales que favorecen la proliferación del vector Ludzomia Longipalpis, para promover acciones de salud tales como la promoción y prevención de la Leishmaniasis Visceral, que impacten positivamente a nivel comunitario.
 logo del proyecto
Y debemos decir que los estudiantes integrantes del equipo (de 14 y 15 años de edad) hicieron algo que parecía difícil de conseguir: mejorar lo hecho el año anterior. Se trata de un gran trabajo que destaca tanto por la cantidad como por la calidad del material producido, que trascendió ampliamente los objetivos del concurso (por ejemplo, en la invención de un repelente natural contra el flebótomo (vector de trasmisión de la leishmaniasis) y de una trampa de luz para su captura)
 trampa de luz
El equipo también realizó una página web del proyecto, algo que no era exigencia del concurso. Como en el caso anterior, recomendamos muy especialmente darle una hojeada: enlace aquí. Podrán apreciar por ustedes mismos todo lo que ha trabajado este equipo (especial atención a la sección Territorialización)
Se estarán imaginando lo difícil que lo tuvo el jurado para emitir su fallo pues el nivel ha sido muy alto, y se desarrollaron varios proyectos excelentes, los que no tienen nada que envidiar a un trabajo académico o a un estudio de una consultora.
 los estudiantes en plena tarea
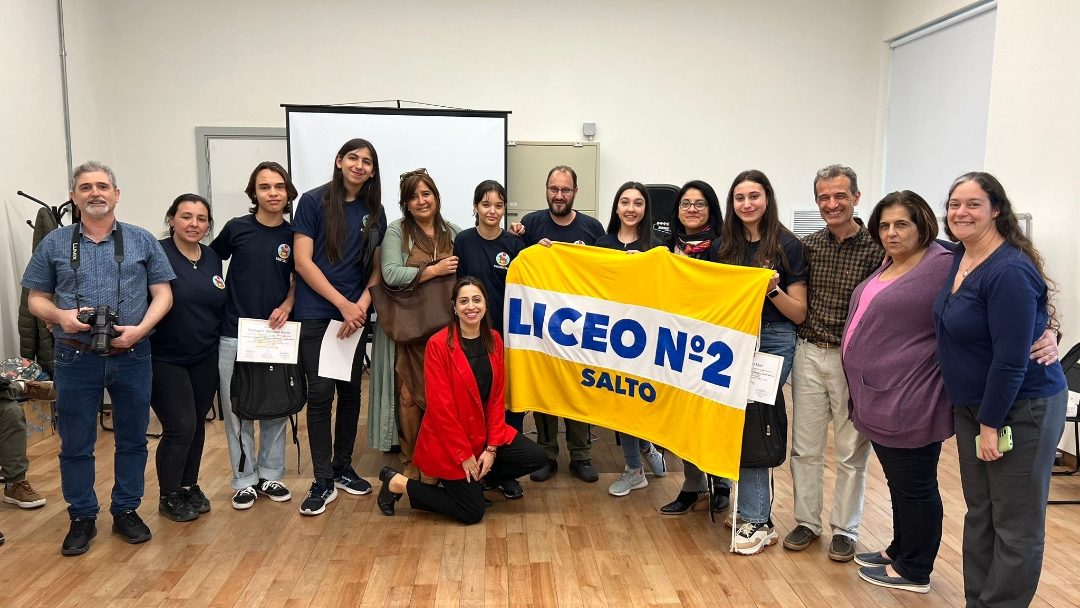 el equipo, junto a integrantes del Equipo Coordinador
Nuestras más sinceras felicitaciones al equipo del proyecto N°5 Mentes en crecimiento. Impresionante trabajo.
-
14:30
KAN T&IT Blog: Balance de Fin de Año
sur Planet OSGeoEste es el momento perfecto para reflexionar sobre los logros alcanzados y los desafíos superados en este 2023. Kan Territory & IT, líder en el ámbito de las Geosoluciones para empresas, ha vivido un año excepcional, marcado por innovaciones, participaciones inspiradoras y un compromiso continuo con la excelencia.
Este año no solo hemos mantenido la posición en la vanguardia de las tecnologías geoespaciales, sino que también hemos lanzado productos revolucionarios. Desde soluciones de mapeo más intuitivas hasta plataformas de análisis predictivo, nuestra gama de productos se ha expandido para satisfacer las crecientes demandas del mercado. Estamos emocionados por los éxitos logrados con estas nuevas herramientas, que han permitido a nuestros clientes optimizar sus operaciones y tomar decisiones más informadas.
Consideramos que establecer vínculos sólidos con la comunidad empresarial y tecnológica es fundamental para garantizar un crecimiento sostenible. En consecuencia, durante el transcurso de este año, nos involucramos de manera activa en diversas instancias de intercambio y aprendizaje, tanto a nivel nacional, como fue el caso de las Jornadas de IDERA en La Pampa, como a nivel internacional, participando en eventos destacados como la Foss4G en Kosovo y Baltimore, Big Data for Space en Austria, y el UN-GGIM América en Chile y UN-GGIM Internacional en Nueva York. En todas estas instancias, nuestro compromiso fue compartir valiosos conocimientos, experiencias y perspectivas relacionadas con las últimas tendencias en geosoluciones. Desde conferencias magistrales hasta talleres prácticos, nuestro equipo desempeñó un papel activo en fomentar un diálogo enriquecedor que ha contribuido significativamente al progreso de la industria.
Al mirar hacia atrás, estamos agradecidos por el apoyo continuo de nuestros clientes, socios y colaboradores. Cada logro de Kan Territory & IT es el resultado de un esfuerzo colectivo y de la confianza depositada en nosotros. Miramos hacia el futuro con optimismo, comprometidos a seguir innovando y ofreciendo soluciones que transformen positivamente la manera en que las empresas gestionan sus datos geoespaciales.
Queremos expresar nuestro agradecimiento a todos los que han sido parte de nuestro viaje. Que el próximo año esté lleno de nuevos horizontes, oportunidades emocionantes y éxitos compartidos. Que el 2024 sea un año de crecimiento, innovación y colaboración continua.
El equipo Kan & It
-
11:52
GeoTools Team: GeoTools 29.4 released
sur Planet OSGeo GeoTools 29.4 released The GeoTools team is pleased to announce the release of the latest maintenance version of GeoTools 29.4: geotools-29.4-bin.zip geotools-29.4-doc.zip geotools-29.4-userguide.zip geotools-29.4-project.zip This release is also available from the OSGeo Maven Repository and is made in conjunction with GeoServer -
21:23
gvSIG Batoví: Repaso a los proyectos premiados (I) en el Curso–Concurso Geoalfabetización mediante la utilización de Tecnologías de la Información Geográfica
sur Planet OSGeoHabiendo culminado una nueva edición del Curso–Concurso Geoalfabetización mediante la utilización de Tecnologías de la Información Geográfica no queríamos despedir el año sin antes comentar brevemente algunos de los proyectos que han resultado seleccionados por el jurado como finalistas del concurso.
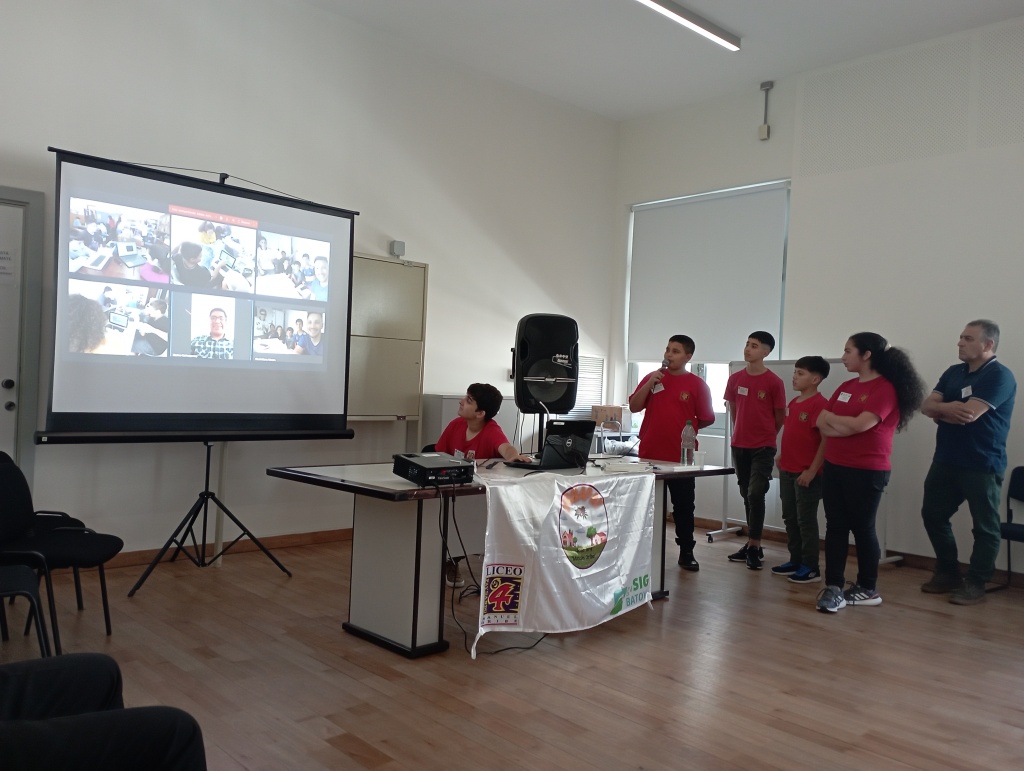 el equipo presentando su proyecto frente a los demás equipos concursantes
Comenzaremos por el que resultó ganador por Uruguay, denominado Urbapay (Proyecto N°12). Se trata de un proyecto elaborado por estudiantes de 12 y 13 años del Liceo N°4 Manuel Oribe de la ciudad de Paysandú. El profesor referente es Maximiliano Olivera y la tutoría del proyecto estuvo a cargo de Marino Carhuapoma (de IdeasG, de Perú). El proyecto trata del crecimiento urbano en parte de la ciudad, enfocado desde el punto de vista de los ODS N° 11 y 15, incluyendo propuestas de infraestructura y equipamiento urbano para la zona de estudio
Recomendamos muy especialmente pegarle un repaso a los materiales entregados, donde uno puede apreciar el nivel y la calidad obtenidos en apenas 3 meses de trabajo (échenle un vistazo, por ejemplo, a los mapas elaborados):
Como organizadores de la iniciativa no podemos quedar más que satisfechos por los resultados logrados, que nos demuestran que la idea del curso-concurso no sólo fue (y es) una excelente idea para enseñar de modo ameno, entretenido y profundo, sino que también contribuye en la formación de ciudadanía, al elaborase propuestas que no estaban en la idea inicial del proyecto, y tener éstas un impacto directo en el entorno (muchas de las propuestas que se incluyen en la entrega final terminan materializándose)
 el equipo recibiendo el reconocimiento de las autoridades de la enseñanza de Uruguay
¡Felicitaciones a todos los integrantes del equipo del proyecto N°12 Urbapay!
Continuaremos en siguientes entradas con los demás proyectos.
-
18:00
Paul Ramsey: Data Science is Getting Ducky
sur Planet OSGeoFor a long time, a big constituency of users of PostGIS has been people with large data analytics problems that crush their desktop GIS systems. Or people who similarly find that their geospatial problems are too large to run in R. Or Python.
These are data scientists or adjacent people. And when they ran into those problems, the first course of action would be to move the data and parts of the workload to a “real database server”.
This all made sense to me.
But recently, something transformative happened – Crunchy Data upgraded my work laptop to a MacBook Pro.
Suddenly a GEOS compile that previously took 20 minutes, took 45 seconds.
I now have processing power on my local laptop that previously was only available on a server. The MacBook Pro may be a leading indicator of this amount of power, but the trend is clear.
What does that mean for default architectures and tooling?
Well, for data science, it means that a program like DuckDB goes from being a bit of a curiosity, to being the default tool for handling large data processing workloads.
What is DuckDB? According to the web site, it is “an in-process SQL OLAP database management system”. That doesn’t sound like a revolution in data science (it sounds really confusing).
But consider what DuckDB rolls together:
- A column-oriented processing engine that makes the most efficient possible use of the processors in modern computers. Parallelism to ensure all CPUs are made use of, and low-level optimizations to ensure each tick of those processors pushes as much data through the pipe as possible.
- Wide ranging support for different data formats, so that integration can take place on-the-fly without requiring translation or sometimes even data download steps.
Having those things together makes it a data science power tool, and removes a lot of the prior incentive that data scientists had to move their data into “real” databases.
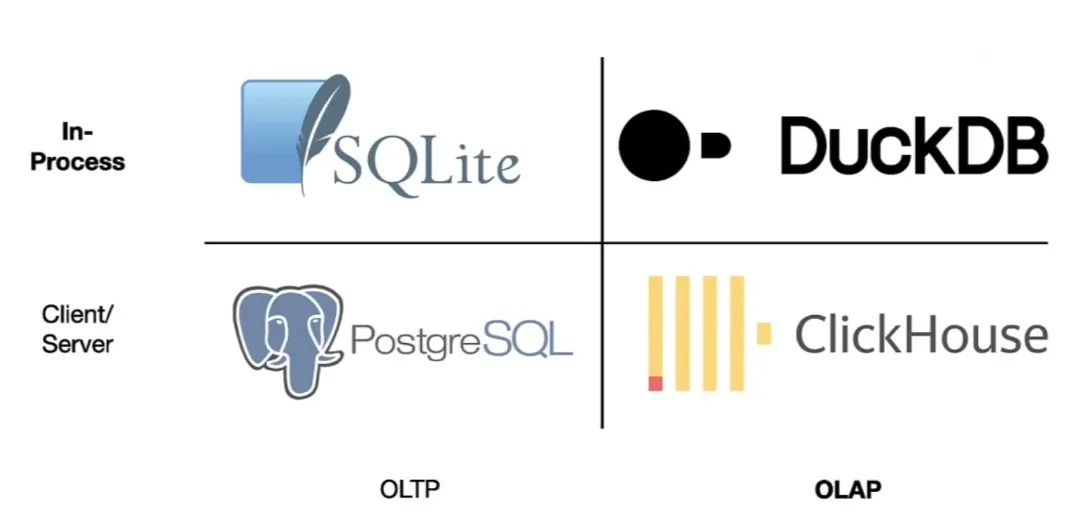
When they run into the limits of in-memory analysis in R or Python, they will instead serialize their data to local disk and use DuckDB to slam through the joins and filters that were blowing out their RAM before.
They will also take advantage of DuckDB’s ability to stream remote data from data lake object stores.
What, stream multi-gigabyte JSON files? Well, yes that’s possible, but it’s not where the action is.
The CPU is not the only laptop component that has been getting ridiculously powerful over the past few years. The network pipe that connects that laptop to the internet has also been getting both wider and lower latency with every passing year.
As the propect of streaming data for analysis has come into view, the formats for remote data have also evolved. Instead of JSON, which is relatively fluffy, and hard to efficiently filter, the Parquet format is becoming a new standard for data lakes.
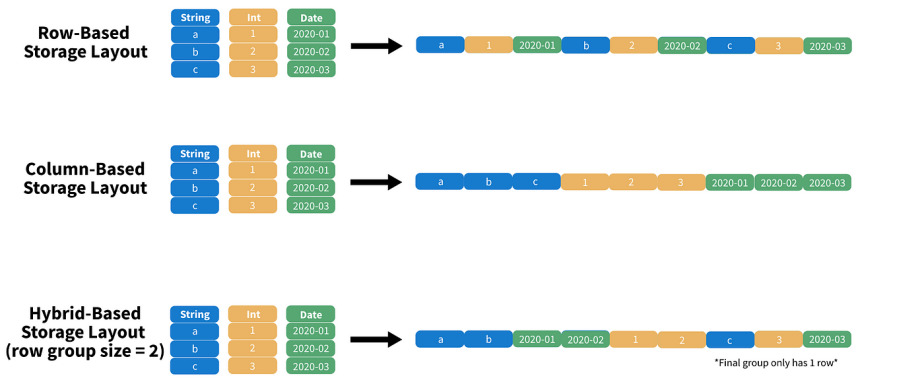
Parquet is a binary format, that organizes the data into blocks for efficient subsetting and processing. A DuckDB query to a properly organized Parquet time series file might easily pull only records for 2 of 20 columns, and 1 day of 365, reducing a multi-gigabyte download to a handful of megabytes.
The huge rise in available local computation, and network connectivity is going to spawn some new standard architectures.
Imagine a “two tier” architecture where tier one is an HTTP object store and tier two is a Javascript single page app? The COG Explorer has already been around for a few years, and it’s just such a two tier application.
(For fun, recognize that an architecture where the data are stored in an access-optimized format, and access is via primitive file-system requests, while all the smarts are in the client-side visualization software is… the old workstation GIS model. Everything old is new again.)
The technology is fresh, but the trendline is pretty clear. See Kyle Barrron’s talk about GeoParquet and DeckGL for a taste of where we are going.
Meanwhile, I expect that a lot of the growth in PostGIS / PostgreSQL we have seen in the data science field will level out for a while, as the convenience of DuckDB takes over a lot of workloads.
The limitations of Parquet (efficient remote access limited to a handful of filter variables being the primary one, as will cojoint spatial/non-spatial filter and joins) will still leave use cases that require a “real” database, but a lot of people who used to reach for PostGIS will be reaching for Duck, and that is going to change a lot of architectures, some for the better, and some for the worse.
-
10:12
GRASS GIS: Annual Report 2023
sur Planet OSGeo2023 has been an amazing year in the advancement of the GRASS GIS project, which celebrated its 40th birthday! As the year draws to a close, let’s look back at some of the achievements of the GRASS community. Community Meeting The GRASS GIS Community Meeting held at the Faculty of Civil Engineering of the Czech Technical University in Prague during the first days of June brought together users, supporters, contributors, power users and developers to celebrate, collaborate and chart the future of GRASS GIS. -
13:14
Jackie Ng: Minor change of plans
sur Planet OSGeoThere will be a slight change of plans in the MapGuide Open Source 4.0 release timeline.
Namely, the next release will not be the Release Candidate, but rather a 2nd beta release.
The main driver behind this decision is because of my intention to remove the recently introduced support for Mapbox Vector Tiles. While I initially had high hopes with this implementation, additional testing with data outside of the example Sheboygan dataset has revealed rendering issues I do not have the capability to address. Rather than ship a half-baked implementation that may never bake fully, I'd rather bow out while we still can, remove this immature implementation, and leave MVT tile generation to dedicated external tools.
A 2nd beta release will also mean that the other changes I want to get in will also have some time to bake before the Release Candidate stage.
I am hoping the 2nd beta release will be out late January in the new year.
-
2:00
GeoServer Team: GeoServer 2.23.4 Release
sur Planet OSGeoGeoServer 2.23.4 release is now available with downloads (bin, war, windows), along with docs and extensions.
This is a maintenance release of GeoServer providing existing installations with minor updates and bug fixes. GeoServer 2.23.4 is made in conjunction with GeoTools 29.4, and GeoWebCache 1.23.3.
Thanks to Peter Smythe (AfriGIS) for making this release.
Release notesImprovement:
- GEOS-11152 Improve handling special characters in the Simple SVG Renderer
- GEOS-11154 Improve handling special characters in the MapML HTML Page
- GEOS-11176 Add validation to file wrapper resource paths
- GEOS-11188 Let DownloadProcess handle download requests whose pixel size is larger than integer limits
- GEOS-11189 Add an option to throw a service exception when nearest match “allowed interval” is exceeded
- GEOS-11193 Add an option to throw an exception when the time nearest match does not fall within search limits
- GEOS-11219 Upgrade mail and activation libraries
Bug:
- GEOS-9757 Return a service exception when client provided WMS dimensions are not a match
- GEOS-11074 GeoFence may not load property file at boot
- GEOS-11184 ncwms module has a compile dependency on gs-web-core test jar
- GEOS-11190 GeoFence: align log4j2 deps
- GEOS-11196 NPE in VectorDownload if ROI not defined
- GEOS-11200 GetFeatureInfo can fail on rendering transformations that generate a different raster
- GEOS-11203 WMS GetFeatureInfo bad WKT exception for label-geometry
- GEOS-11206 Throw nearest match mismatch exceptions only for WMS
- GEOS-11223 Layer not visible in preview/capabilities if security closes the workspace, but allows access to the layer
- GEOS-11224 Platform independent binary doesn’t start properly with default data directory
For the complete list see 2.23.4 release notes.
Community UpdatesCommunity module development:
- GEOS-11209 Open ID Connect Proof Key of Code Exchange (PKCE)
- GEOS-11212 ODIC accessToken verification using only JWKs URI
Community modules are shared as source code to encourage collaboration. If a topic being explored is of interest to you please contact the module developer to offer assistance.
About GeoServer 2.23 SeriesAdditional information on GeoServer 2.23 series:
- GeoServer 2.23 User Manual
- Drop Java 8
- GUI CSS Cleanup
- Add the possibility to use fixed values in Capabilities for Dimension metadata
- State of GeoServer 2.23
- GeoServer Feature Frenzy 2023
- GeoServer used in fun and interesting ways
- GeoServer Orientation
Release notes: ( 2.23.4 | 2.23.3 | 2.23.2 | 2.23.1 | 2.23.0 | 2.23-RC1 )
-
22:59
Free and Open Source GIS Ramblings: Offline Vector Tile Package .vtpk in QGIS
sur Planet OSGeoStarting from 3.26, QGIS now supports .vtpk (Vector Tile Package) files out of the box! From the changelog:
ESRI vector tile packages (VTPK files) can now be opened directly as vector tile layers via drag and drop, including support for style translation.
This is great news, particularly for users from Austria, since this makes it possible to use the open government basemap.at vector tiles directly, without any fuss:
1. Download the 2GB offline vector basemap from [https:]]
2. Add the .vtpk as a layer using the Data Source Manager or via drag-and-drop from the file explorer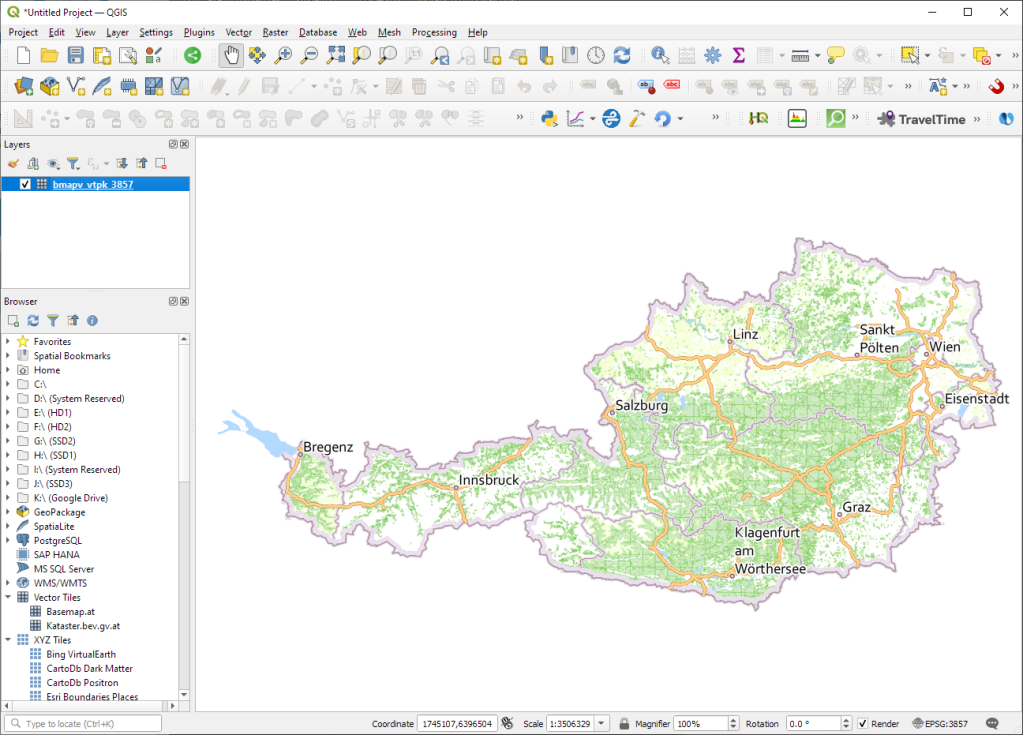
3. All done and ready, including the basemap styling and labeling — which we can customize as well: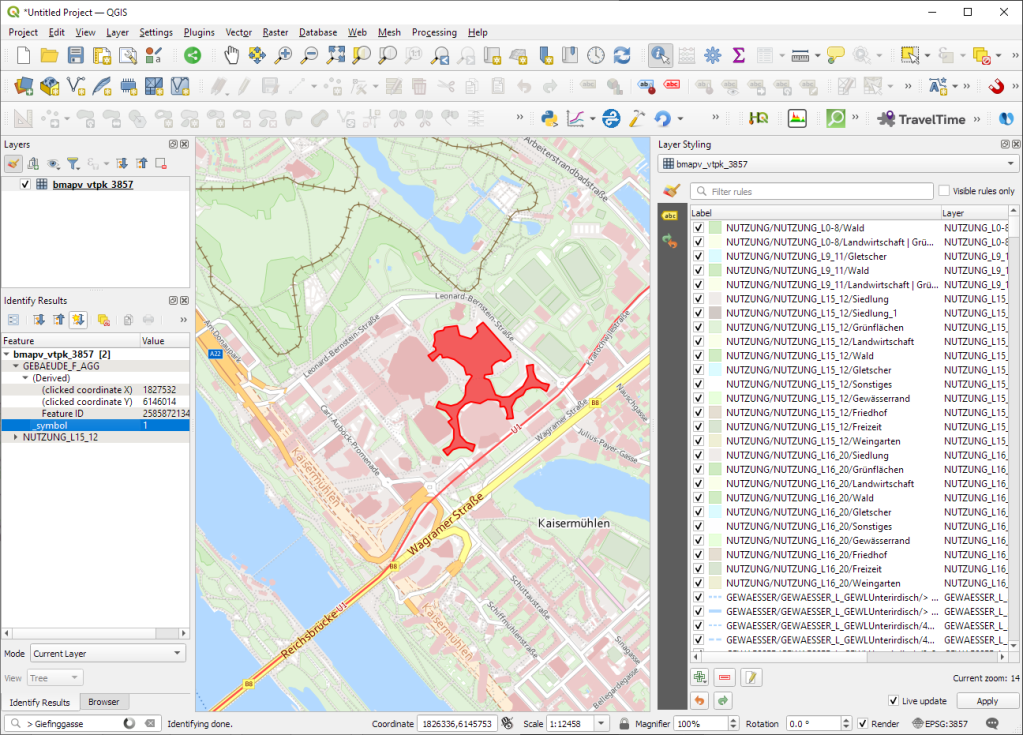

Kudos to [https:]] for bringing this new feature to my attention.
PS: And interesting tidbit from the developer of this feature, Nyall Dawson:

-
18:00
3liz: Sortie extension Lizmap 4.0.0 pour QGIS
sur Planet OSGeoNouvelles fonctionnalités sur la validation des projetsLors de la publication d'un projet avec le serveur QGIS, il existe quelques problèmes connus lorsque le serveur doit charger le projet :
- Une couche est visible dans QGIS bureautique, mais malheureusement absente dans QGIS serveur.
- Le temps de chargement par QGIS serveur du projet est trop long.
Ces problèmes peuvent avoir différentes sources :
-
Une couche invisible dans QGIS serveur :
- Est-ce que le service PostgreSQL est bien configuré côté serveur ?
- Est-ce que le fichier utilisé pour la couche (FlatGeobuf, Geotiff…) est bien accessible par le serveur avec le même chemin ?
-
Concernant le temps de chargement d'un projet, les sources sont vraiment multiples et peuvent être complexes. Certaines peuvent être simples, comme dire à QGIS d'utiliser les "métadonnées estimées" pour les couches PostgreSQL ou alors de forcer la simplification des géométries côté fournisseur de données.
Ces problèmes sont très courants, c'est pourquoi nous avons décidé d'inclure des règles dans l'extension.
Avec la dernière version de l'extension, vous pouvez commencer à avoir de nouvelles vérifications lors de l'enregistrement de votre fichier de configuration Lizmap. Vous pouvez également remarquer quelques mesures de protection, qui sont conçus pour vous aider à publier votre projet (en évitant certaines erreurs possibles du côté du serveur plus tard).
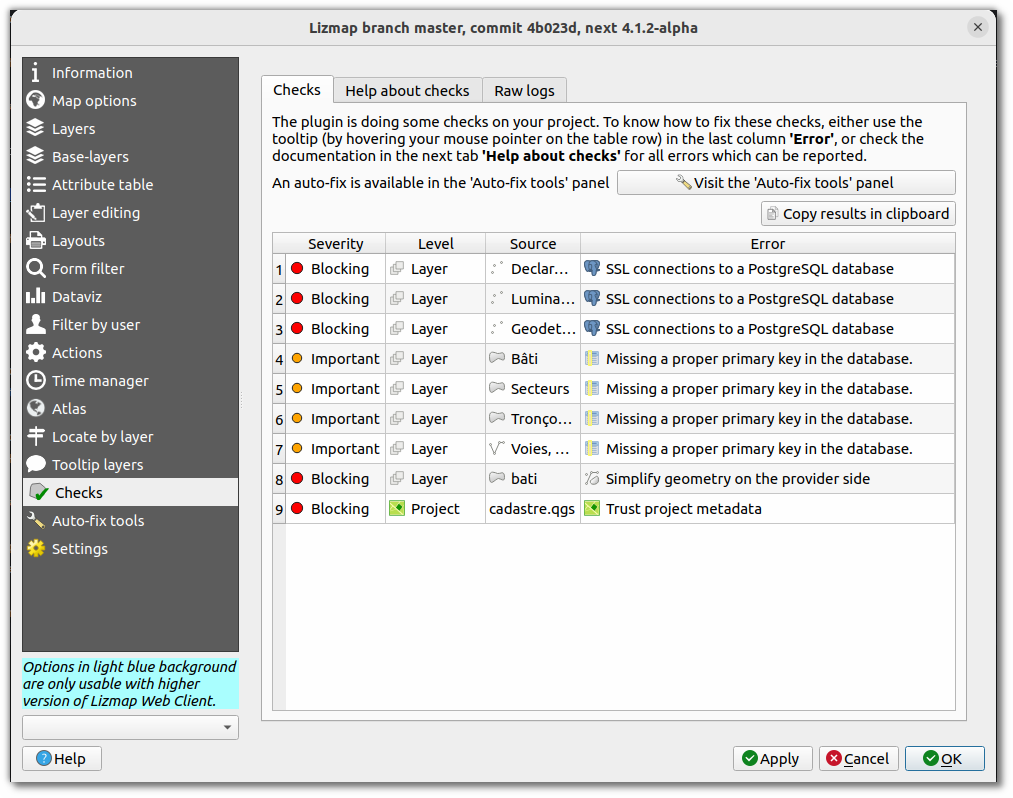
Jetons un coup d'œil rapide à ces deux nouvelles fonctionnalités.
VérificationsAvec la dernière version de l'extension Lizmap, vous pouvez remarquer un nouveau tableau lors de l'enregistrement de votre fichier de configuration.
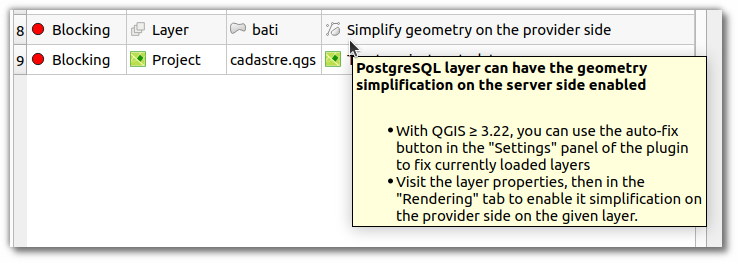
Ce tableau présente les contrôles qui ont échoué lors de la sauvegarde de la configuration.
- Toutes les vérifications sont documentées : source de l'erreur, son nom, comment corriger l'erreur et sa gravité.
- Certaines vérifications sont bloquantes. À l'heure actuelle, seules les vérifications qui prennent au maximum une minute à corriger sont bloquantes. Aujourd'hui, la plupart des règles bloquantes ont des outils pour auto-corriger l'ensemble du projet.
Vous devriez quand même vous pencher sur les autres problèmes non bloquants, car certains d'entre eux réduisent les performances du serveur QGIS. Mais comme ce n'est pas une correction "clé en main", nous n'avons pas rendu ces règles bloquantes.
Pour savoir comment résoudre le problème, passez votre souris sur la dernière colonne du tableau, une description complète apparaîtra. Ou visitez l'onglet suivant qui récapitule l'ensemble des erreurs avec les moyens pour corriger.
Nous ajouterons également de nouvelles vérifications dans les semaines à venir.
Mesure de protectionPar défaut, lors de l'installation de l'extension Lizmap sur un ordinateur, vous serez considéré comme "Débutant". Ce mode est très strict sur ce que vous pouvez faire dans votre projet QGIS. Il a été principalement conçu pour une formation à Lizmap.
Nous pensons que les utilisateurs passeront rapidement en mode "Normal", mais vous pouvez toujours modifier des paramètres dans le dernier panneau.
Ces protections sont conçues pour vous aider. Elles permettent d'éviter que certaines couches ne puissent pas s'afficher sur Lizmap Web Client.
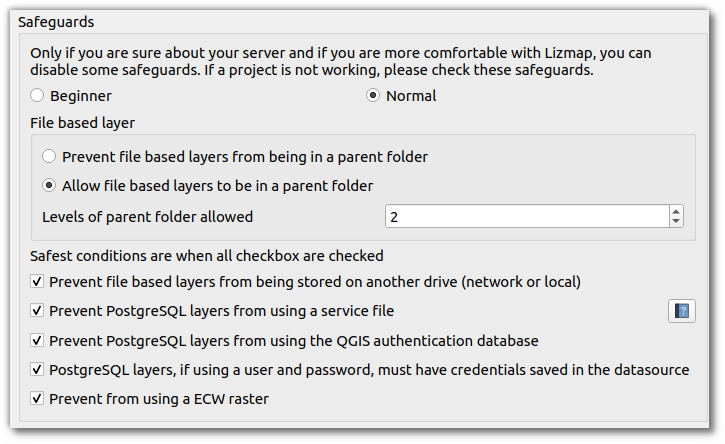
Par exemple, si vous savez que votre serveur ne supporte pas le raster ECW, vous pouvez laisser cette case cochée.
Notez que si vous êtes hébergé sur notre solution Lizmap Cloud, certaines protections sont configurées avec des valeurs par défaut. Par exemple, sur notre solution d'hébergement, le nombre maximum de dossiers parents autorisés lorsque vous ajoutez une couche basée sur un fichier est de deux dossiers.
Lorsque vous êtes en mode "normal", décochez avec précaution ces cases. Certaines d'entre elles nécessitent des étapes de configuration du côté du serveur.
Bonne mise à jour ?
Etienne Trimaille
-
18:00
3liz: Lizmap plugin 4.0.0 for QGIS Desktop
sur Planet OSGeoNew features about project validationWhen publishing a project with QGIS server, there are some known issues when the server needs to load the projet :
- A layer can be visible in QGIS desktop, but unfortunately not visible in QGIS server.
- The loading time of the project can be too long.
These issues can have different sources :
-
A layer invisible in QGIS server :
- Is the PostgreSQL service well configured on the server side ?
- Does the file used for the layer (FlatGeobuf, Geotiff…) is readable by QGIS server with the same path ?
-
About project loading time, the source of the problem can be very different and complex. In some situations, it can be easy, like asking QGIS to use "estimated metadata" for PostgreSQL layers or also to force geometry simplification on the data provider side.
These issues are very common, so we decided to include some rules in the plugin.
With the latest release of the plugin, you could start seeing some new checks when saving your Lizmap configuration file. You could also notice some safeguards, which are designed to help you to publish your project (prevent some possible errors on the server side).
Let's have a quick look to these two new features.
ChecksWith the latest version of the QGIS Lizmap plugin, you could notice a new table when saving your configuration file.
This table is a list of checks which have failed when saving the configuration.
- All checks are documented : source of error, how to fix the error and its severity
- Some checks are blocking. For now, only checks which take one minute maximum are blocking. Today, most of the blocking rules have a button to auto-fix the whole project.
You should still have a look to other non-blocking issues, as some of them might decrease QGIS server performance. But as it's not straightforward to fix, we didn't make these rules blocking.
To know how to fix, either put your mouse over the last column, a complete description will appear. Or visit the next tab "Help about checks", it's presenting all rules with some explanations how to fix them.
We will add new checks in the coming weeks.
SafeguardsBy default, when installing the Lizmap plugin on a computer, you will be considered as "Beginner". This mode is very strict about what you can do in your QGIS project. It was mainly designed for a Lizmap training.
We guess users will quickly switch to "Normal", but you can still tweak these settings in the last panel.
These safeguards are designed to help you. It will prevent some layers to maybe not be visible on Lizmap Web Client.
If you know your server doesn't support ECW raster, you can keep this checkbox ticked.
Note, if you are hosted on our Lizmap Cloud infrastructure, some safeguards are configured with some default values. For instance, on our hosting solution, the maximum of parent folder allowed when you add a file based layer is two folders.
When you are in "normal" mode, please uncheck these checkbox carefully. Some of them requires some configuration steps on the server side.
We hope you will enjoy this new version ?
Etienne Trimaille


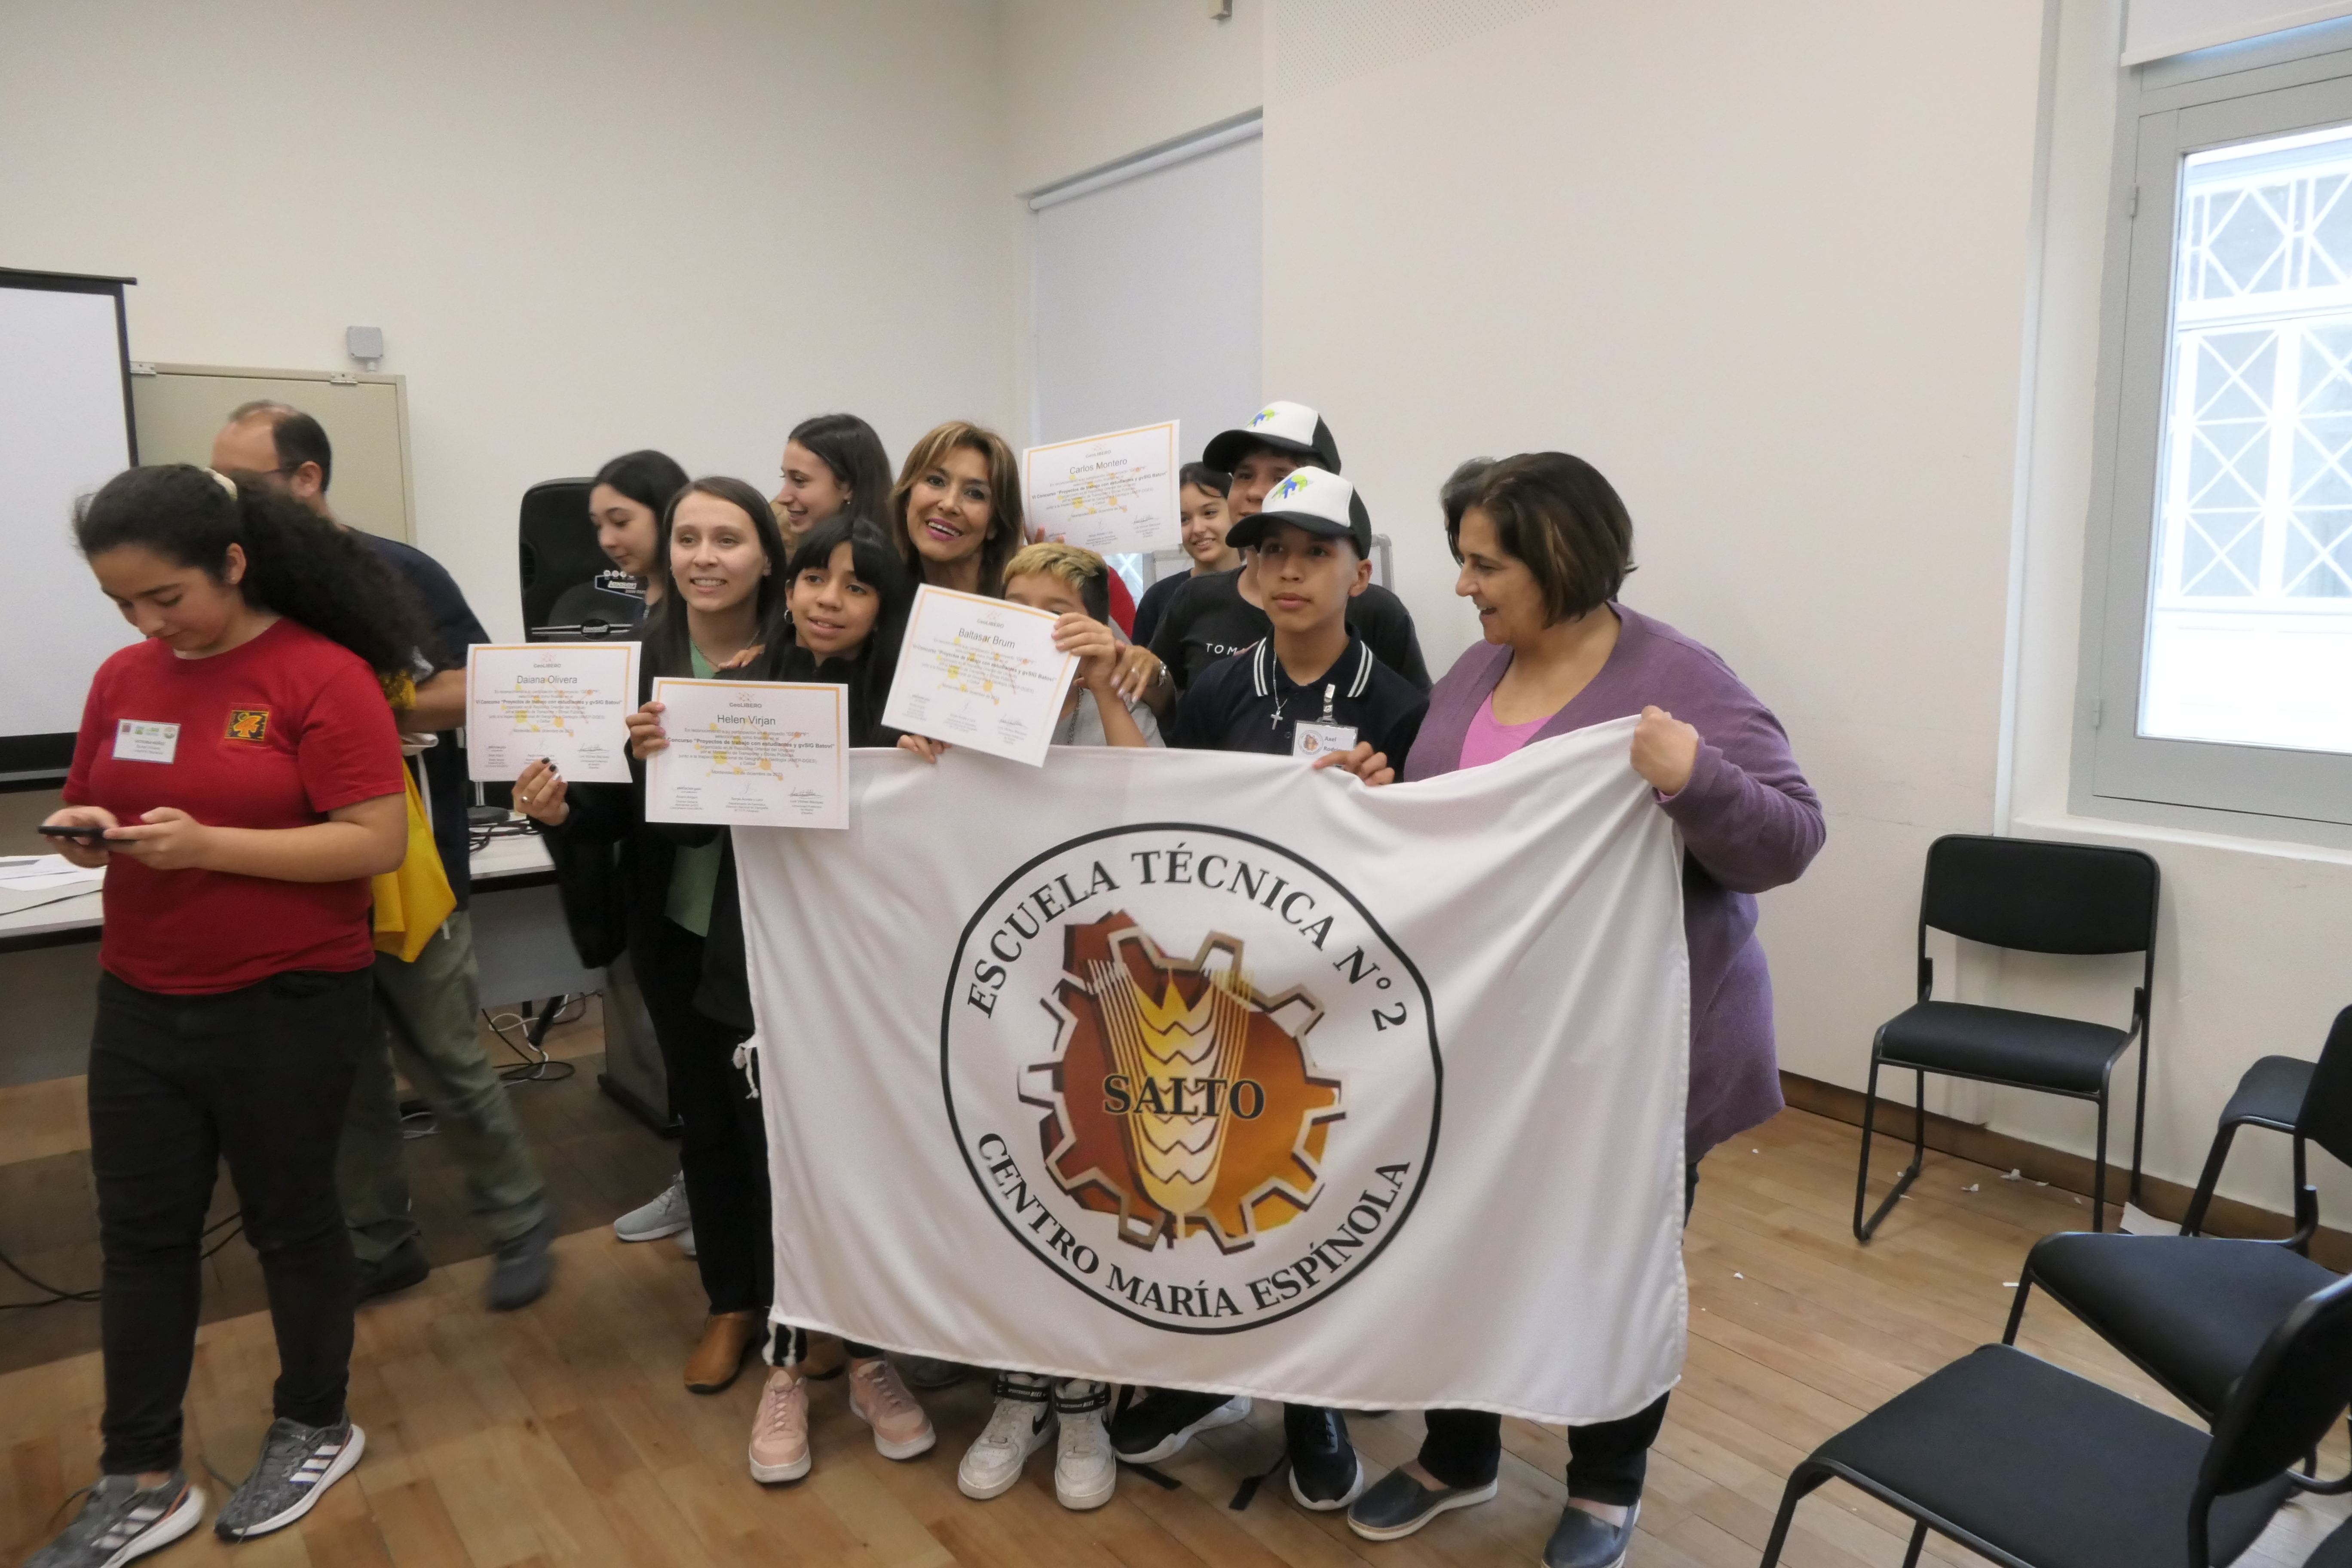
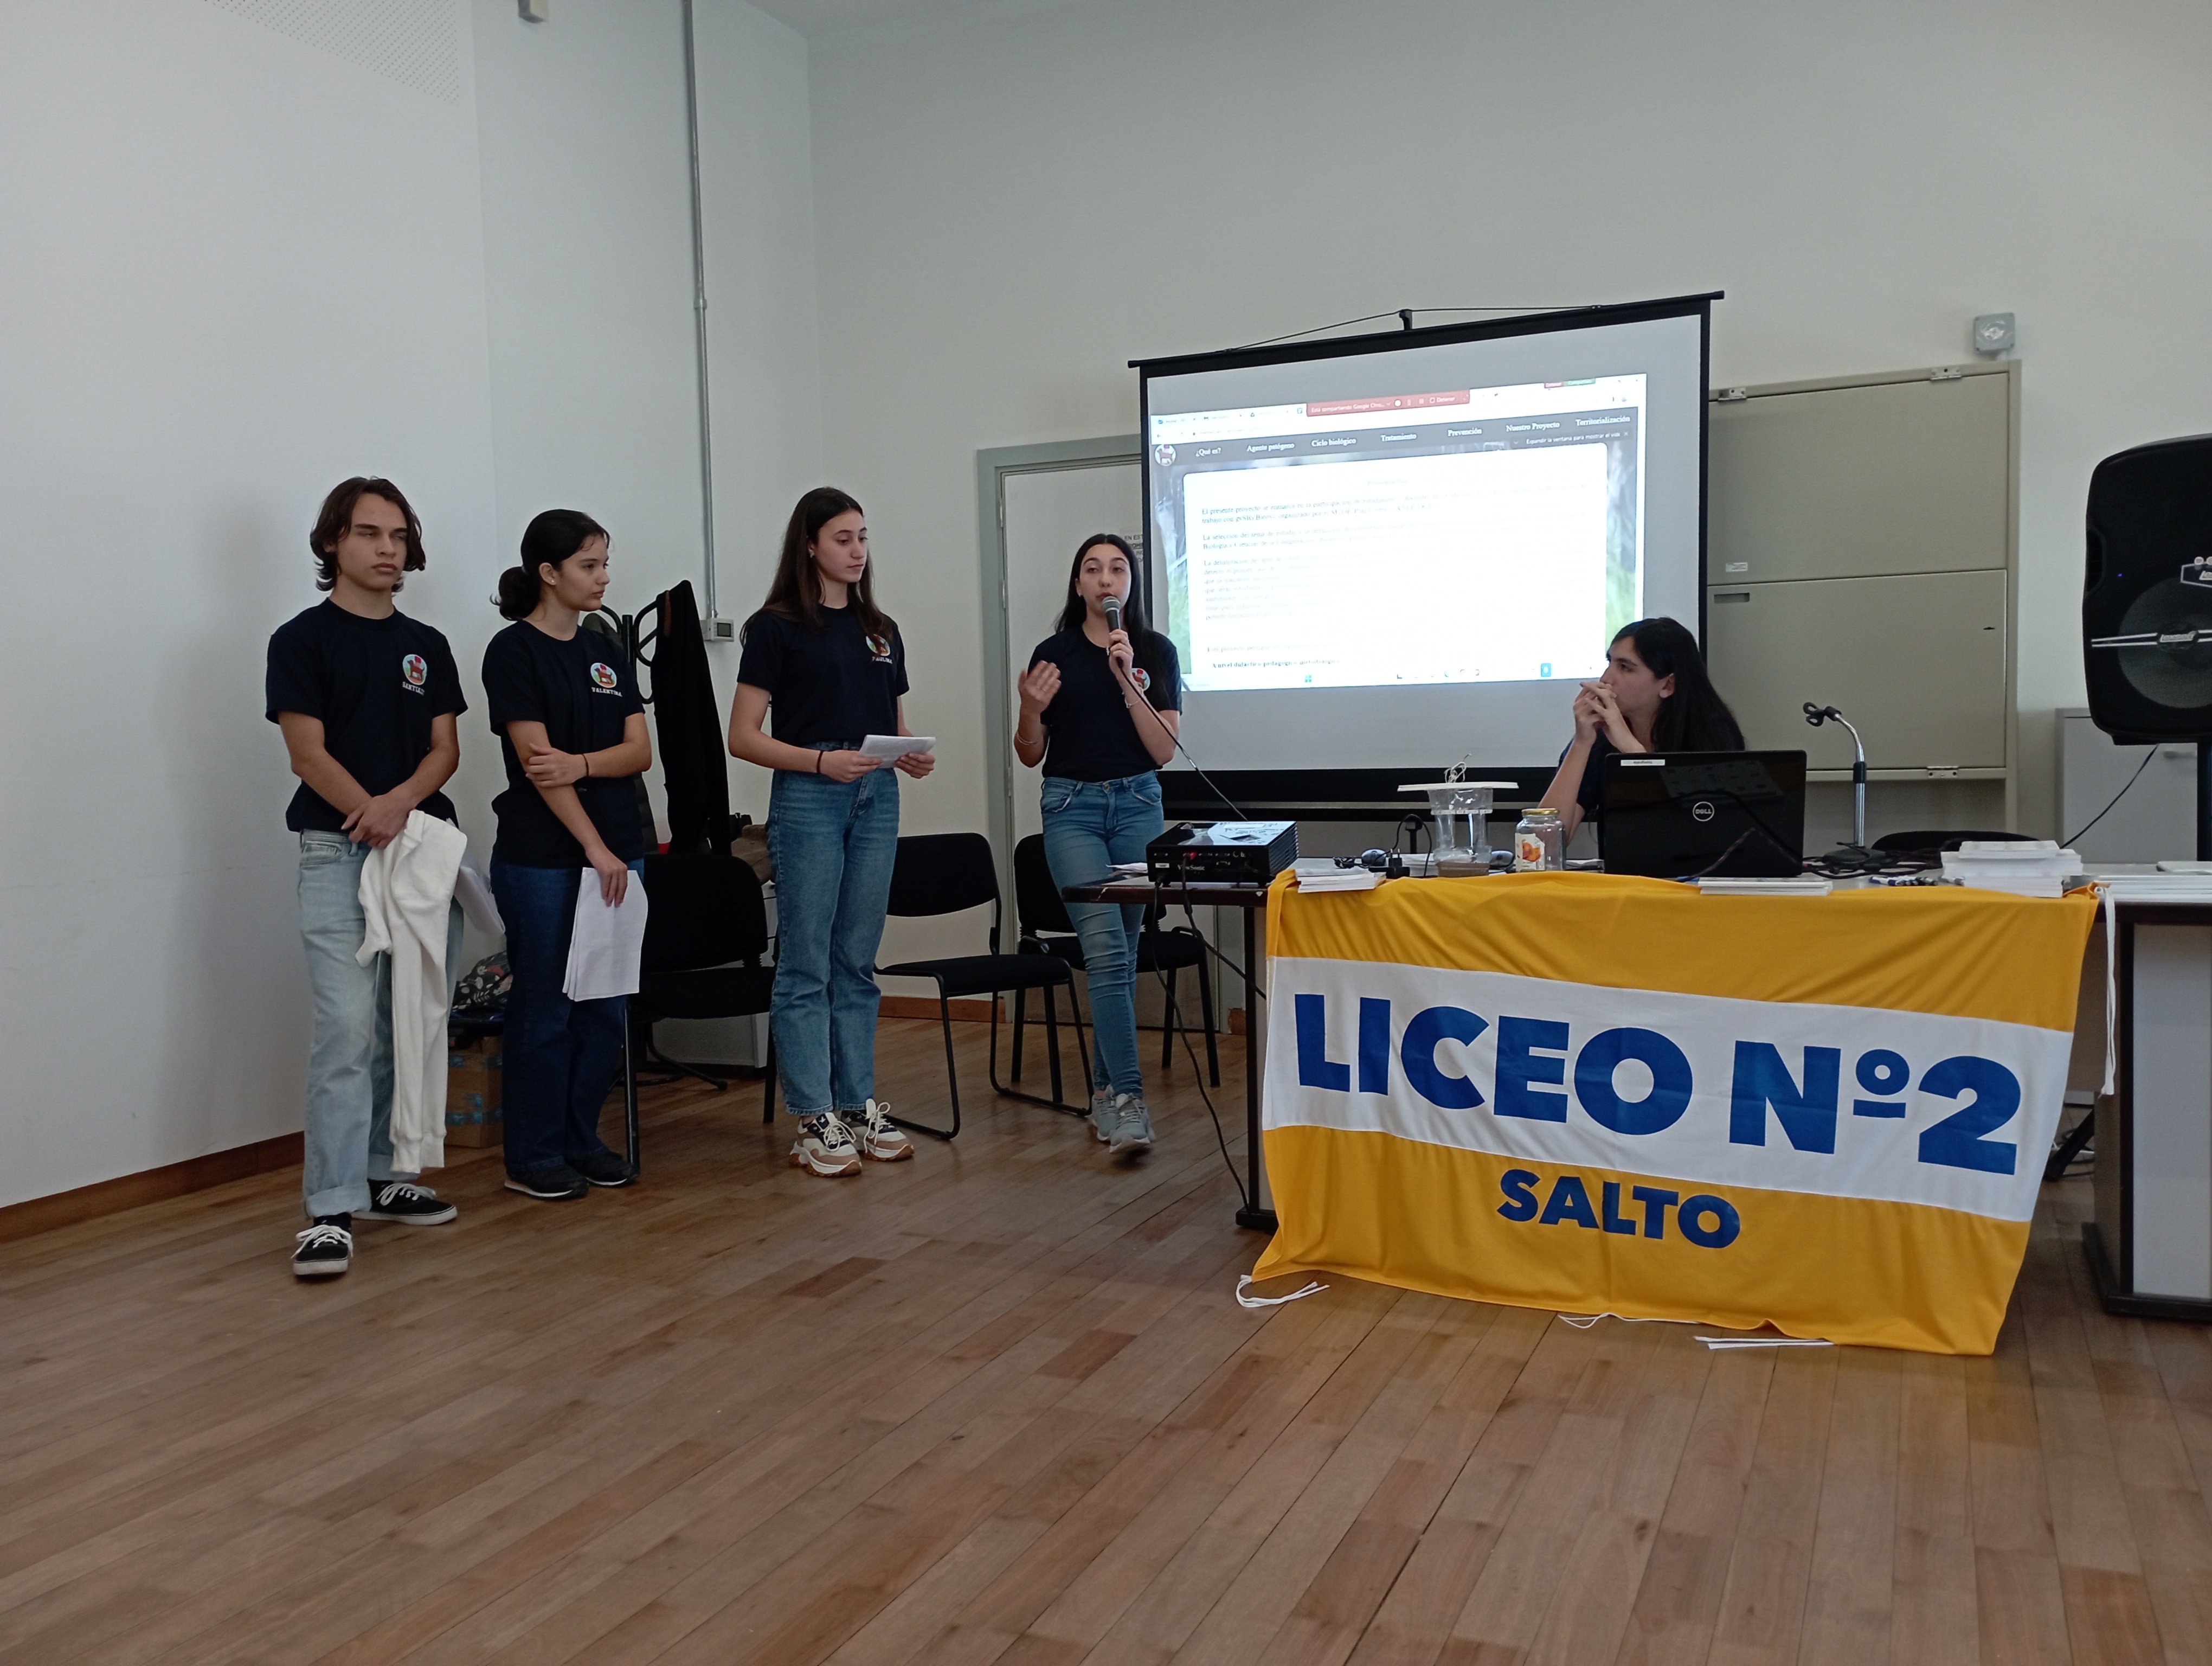


-
15:27
In Memory of Jeff Burnett
sur Open Geospatial Consortium (OGC)With great sadness, OGC announces the passing of our cherished colleague, Mr. Jeffrey Burnett of Littleton, Mass, on 28 November 2023, from cancer.
Jeff joined OGC as Vice President for Operations and Finance in April, 2000, serving as OGC’s Chief Financial Officer and member of the Board of Directors until his retirement in 2020. In the 20 years prior to joining OGC, Jeff held product management positions in the emerging imaging and high-performance computing market with Digital Equipment Corporation and the Massachusetts Computer Corporation (MASSCOMP). It was during this time that he first met and worked with the founders of OGC, who would later call upon Jeff to lead the Consortium’s senior staff to support OGC’s continued expansion.
Jeff was deeply committed to OGC and proved to be incredibly talented as the Consortium’s finance lead. Jeff constantly sought ways to improve the Consortium’s approach to the fiscal and operational intricacies of OGC‘s global mission. He approached his work with professionalism, tremendously sharp wit, and a delightfully wry sense of humor – qualities appreciated by OGC Directors, Staff, and the many Member representatives he worked with.
Jeff Burnett was a talented student and manager from the beginning of his career. Having grown up a sailor on the shores of Massachusetts Bay, Jeff was also an avid reader. He earned a bachelor’s degree in English Literature from Dartmouth College where he graduated also as a commissioned Naval officer. Upon graduation, Jeff served with honor in the U.S. Navy. A student at heart, upon returning as a reserve officer Jeff then attended Harvard University Business School where he earned his MBA. He was a patriot, a storyteller, and an avid amateur genealogist – discovering and creating lasting relationships with extended family and relatives around the world. Most importantly, Jeff was a deeply caring family man to his wife Janine, son Evan, and daughter Sarah.
This remarkable colleague and friend of OGC will be deeply missed.
A formal obituary for Jeff Burnett is online here.
The post In Memory of Jeff Burnett appeared first on Open Geospatial Consortium.
-
18:00
Paul Ramsey: How to Become a CEO
sur Planet OSGeoAs a young man, I had a lot of ambition to climb the greasy pole, to get to the “top” of this heap we call a “career”, and as time went on I started doing little explorations of the career histories of people who made it to that apex corporate title, the “CEO”.

It is worth doing this because, by and large, our society is run by people who either have been CEOs or who have come very close. Pull lists of boards of both private and public institutions and you will see a lot of people who have ascended to the top of large institutions before moving into governance. These are the people who determine the direction of our society, by and large.
And how have they gotten there? Through a surprisingly small number of routes, that are all highly path dependent.
If you spend some time exploring the employment histories of corporate leaders, you’ll find really just a couple archetypes.
The Long-term Corporate ClimberBy far the most common pattern is for a future CEO to find an entry- or mid-level position in a large organization, and then work at that one organization for 15 to 25 years, ascending the ranks.
Once they get to just below the CEO, they either leap to a CEO position at another firm, or finally ascend to the CEO position of their originating organization.
- Darren Woods, CEO of ExxonMobile, spent 25 years working his way to the top of Exxon.
- Ginny Rometty, former CEO of IBM, spent 25 years working her way to the top of IBM.
- Jim Farley, CEO of Ford, actually did his important climbing (from entry level to upper management) over 17 years at Lexus, then spent another 13 years at Ford completing the climb to CEO through a sequence of high level regional jobs.
- David Hutchens the CEO of our local gas utility, spent 26 years climbing the rungs of Tuscon Electric.
I was spurred to write about this topic today when I learned that EDB has a new CEO (what?!), Kevin Dallas, who (wait for it), spent 24 years climbing the greasy pole at Microsoft, before being tapped for his first CEO gig in 2020.
Speaking of Microsoft, even corporate leadership savant Satya Nadella started as an entry level engineer in Microsoft, taking the CEO slot in 2014 after 22 years of slogging upwards.
In the main, the way to become a CEO (of a large organization) is to get yourself a job in a large organization early in your career, so you can accumulate the experience and contacts necessary to be considered a viable candidate later in your career.
The path dependence is kind of obvious. If you spend your early career on something else, by the time you get into a large organization you will be starting too far down the heirarchy to reach the top before your career tapers off.
To many, the surprising thing about these career profiles is how rarely there are mid-career jumps between corporations. Probably this is because people under-estimate the power of social networks.
Your reputation for “getting things done”, the density of people who find you charming, the employees and hangers on who benefit from your rise in the organization, they are all highest in one place: the place you already work. Moving laterally in mid-career to a new organization instantly resets your accumulated social capital to zero.
The Founder or Early HireOne exception to the rule is the founder of a company that grows to a scale sufficient to be considered comparable to existing institutions.

This is, as you can imagine, quite rare.
In the “wow that’s insane” founder category: Bill Gates, Steve Jobs, Mark Zuckerberg, Sara Blakely.
Or the “locally known but still huge” founder category: Ryan Holmes (Hootsuite), Chip Wilson (Lululemon), Stewart Butterfield (Slack, Flickr), James Pattison (Pattison Group), Dennis Washington (Seaspan).
In the tech space, there’s also a lot of early hires, who necessarily progressed quite quickly through the “ranks” as the company they had lucked into exploded in size.
- Erik Schmidt, who rode Sun Microsystems rocket to senior management before finding CEO roles at Novell and Google.
- Steve Balmer, who… do I need to even say?
- Sundar Pichai, who joined Google in 2004 and held on to become CEO as the founders burned out.
This is an interesting third category, which is difficult to join, but is very much real – knowing people who will elevate you early on.
-
Like, former Treasury Secretary Tim Geithner had on the one hand, a kind of conventional “grind it out” career working his way up the ranks of the senior federal civil service. But on the other hand, the roles he was in, right from the start were quite high level. How did he manage that? He was recommended to his first job out of college at Kissinger Associates, by the Dean of his faculty at Johns Hopkins. From there he met lots of powerful people who would vouch for his brilliance, and away he went. Now, it surely helped that he was brilliant! But, the connections were necessary too.
-
I checked out the career history of Jamie Dimon, CEO of JP Morgan, expecting to find a long slog at a major financial institution, but it turns out Dimon got an early boost into leadership, through his connection to Sandy Weill, who recruited him to American Express. And how did Weill know Dimon? Dimon’s mother knew Weill and got Dimon hired for a summer job with him. Again, it surely helped that Dimon was sharp as a tack! But, without his mom…

In lots of cases, this category is fully subsumed in the first. Anyone who grinds up a corporate heirarchy will find boosters and mentors who will in turn help them get ahead. Often a senior leader gets a lot of help from a talented junior and they ascend the heirarchy in parallel. Being the “assistant to the President” might make you officially lower on the totem pole than the CFO, but unofficially and in terms of career advancement… that can be another story altogether.
Advice?Despite my long-time desire to climb the greasy pole, I have never worked for an instution large enough to have any serious opportunities to climb, and have finally achieved a zen calm about career. By and large my career has been something that happened to me, not something I planned, and that colors my perceptions a lot.
First jobs lead to first connections, and first connections determine what paths open up as you move on to second and third jobs. Path dependence in career progression is huge. Probably the most important moment is early career, getting into an institution or industry that is poised for growth and change.

It’s possible to rise in an older, established institutions, but my impression is that it’s more of a knife fight. I don’t think the alternate universe Steve Balmer who started in sales at IBM would have risen to be a CEO.
Far and away the most important thing you can amass, at any career stage, is connections. Take every opportunity to meet new people, and find people and topics that stimulate your curiosity. If what you are doing is boring or unpleasant, it’s never going to matter what your title is, or how high up the pole you are.
-
23:45
Free and Open Source GIS Ramblings: Hi ‘Geocomputation with Python’
sur Planet OSGeoToday, I want to point out a blog post over at
In this post, Jakub Nowosad introduces our book “Geocomputation with Python”, also known as geocompy. It is an open-source book on geographic data analysis with Python, written by Michael Dorman, Jakub Nowosad, Robin Lovelace, and me with contributions from others. You can find it online at [https:]]
-
18:00
Paul Ramsey: Keynote @ FOSS4G NA 2023
sur Planet OSGeoPreparing the keynote for FOSS4G North America this year felt particularly difficult. I certainly sweated over it.
- Audience was a problem. I wanted to talk about my usual thing, business models and economics, but the audience was going to be a mash of people new to the topic and people who has seen my spiel multiple times.
- Length was a problem. Out of an excess of faith in my abilities, the organizers gave me a full hour long slot! That is a very long time to keep people’s attention and try to provide something interesting.
The way it all ended up was:
- Cadging some older content from keynotes about business models, to bring new folks up to speed.
- Mixing in some only slightly older content about cloud models.
- Adding in some new thoughts about the way everyone can work together to make open source more sustainable (or at least less extractive) over the long term.
Here’s this year’s iteration.
The production of this kind of content is involved. The goal is to remain interesting over a relatively long period of time.
I have become increasingly opinionated about how to do that.
- No freestyling. Blathering over bullet points is unfair to your audience. The aggregate time of an audience of 400 is very large. 5 minutes of your “um” and “ah” translates into 33 hours of dead audience time.
- Get right to it. No mini-resume, no talking about your employer (unless you are really sneaky about it, like me ?), this is about delivering ideas and facts that are relevant to the audience. Your introducer can handle your bona fides.
- Have good content. The hardest part! (?) Do you have something thematic you can bookend the start and end with? Are there some interesting facts that much of the audience does not know yet? Are there some unappreciated implications? This is, presumably, why you were asked to keynote, so hopefully not too, too hard. This is the part that I worry over the most, because I really have no faith that what I have to say is actually going be interesting to an audience, no matter how much I gussy it up.
- Work from a text. The way to avoid blather is to know exactly what you are going to say. At 140 words-per-minute speaking pace, a 55 minute talk is 7700 words, which coincidentally (not) is exactly how long my keynote text is.
- Write a speech, not an article. You will have to say all those words! Avoid complicated sentence constructions. Keep sentences short. Take advantage of parallel constructions to make a point, drive a narrative, force a conclusion. (see?) Repeat yourself. Repeat yourself.
- Perform, don’t read. Practice reading out loud. Get used to leaving longer gaps and get comfortable with silence. Practice modulating your voice. Louder, softer. Faster, slower. Drop. The. Hammer. Sometimes. Watch a gifted speaker like Barack Obama deliver a text. He isn’t ad libbing, he’s performing a prepared text. See what he does to make that sound spontaneous and interesting.
- Visuals as complements, not copies. Your slides should complement and amplify your content, not recapitulate it. In the limit, you could do all-text slides, which just give the three-word summary of your current main point. (This classic Lessig talk is my favourite example.)
- Visuals as extra channel. Keep changing up the visual. Use the slide notes space to get a feel for how long each slide should be up. (Hint, about 50 words on average.) Keeping slide duration low also helps in terms of using the per-slide speaker notes as low-end teleprompter (increase notes font size! reduce slide preview size!) from which you deliver your performance.
I originally started scripting talks because it allowed me to smooth out the quality of my talks. With a script, it wasn’t a crapshoot whether I had a good ad lib delivery or a bad one, I had a nice consistent level. From there, leveraging up to take advantage of the format to increase the talk quality was a natural step. Speakers like Lessig and Damian Conway remain my guide posts.
If you liked the keynote video and want to use the materials, the slides are available here under CC BY.
-
10:35
gvSIG Team: gvSIG Batoví 2023, éxitos de llevar la geomática a la educación secundaria
sur Planet OSGeo -
18:53
gvSIG Batoví: Curso–Concurso Geoalfabetización mediante la utilización de Tecnologías de la Información Geográfica: cierre
sur Planet OSGeo
Con enorme alegría anunciamos el cierre de una edición más (la sexta) del Curso–Concurso Geoalfabetización mediante la utilización de Tecnologías de la Información Geográfica.
¿De qué se trata todo esto? Es la culminación de una iniciativa que nace en 2010 para desarrollar gvSIG Batoví.

¿Y qué es gvSIG Batoví? Es un SIG (Sistema de Información Geográfica) aplicado a entornos educativos, con destino al Ceibal (proyecto para Uruguay de la iniciativa OLPC/OneLaptopPerChild), y en base al software libre de origen español gvSIG
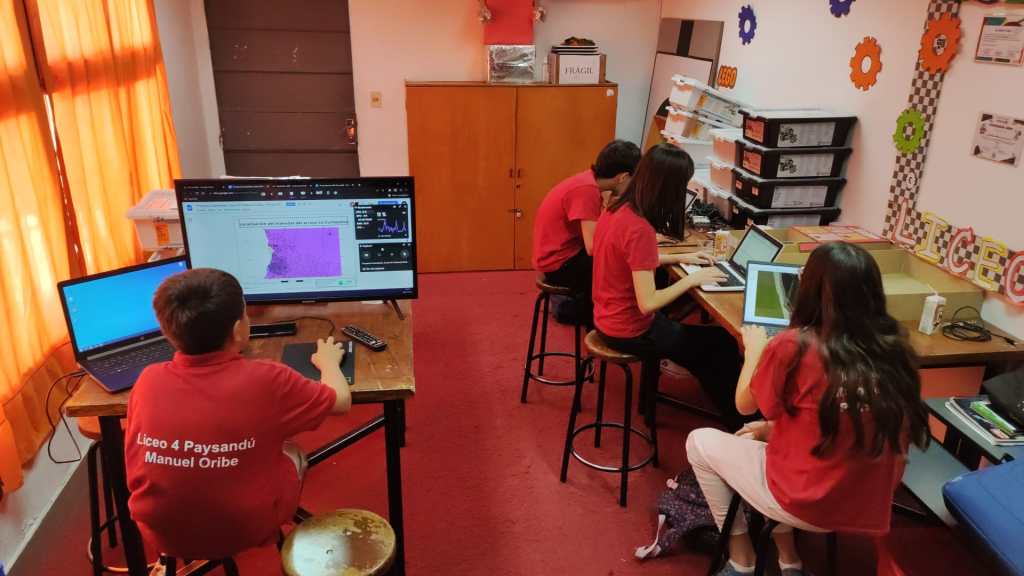 estudiantes utilizando gvSIG Batoví en las aulas
¿Por qué hacer ésto? Se trata de una iniciativa de la Dirección Nacional de Topografía (Ministerio de Transporte y Obras Públicas/MTOP-Uruguay) como aporte a la enseñanza desde un área de su conocimiento. La Dir. Nac. de Topografía promueve y es parte de la IDEuy (Infraestructura de Datos Espaciales de Uruguay), a la vez que desarrolla y es responsable del Geoportal del MTOP.

¿Cómo nace? Se firma un convenio entre el MTOP, Ceibal y la Asociación gvSIG (año 2011) para adaptar gvSIG a los dispositivos de Ceibal, obteniendo una primera versión en agosto de 2012.
A partir de ahí se plantea una amplia Estrategia de Sostenibilidad:


- difusión internacional: presentaciones en numerosos congresos, artículos en publicaciones extranjeras, participación en proyectos académicos mundiales, exposición en hall de sede de las Naciones Unidas (Nueva York), invitación a ser parte de GeoForAll (Comité de divulgación educativa de la Open Source Geospatial Foundation/OSGeo)
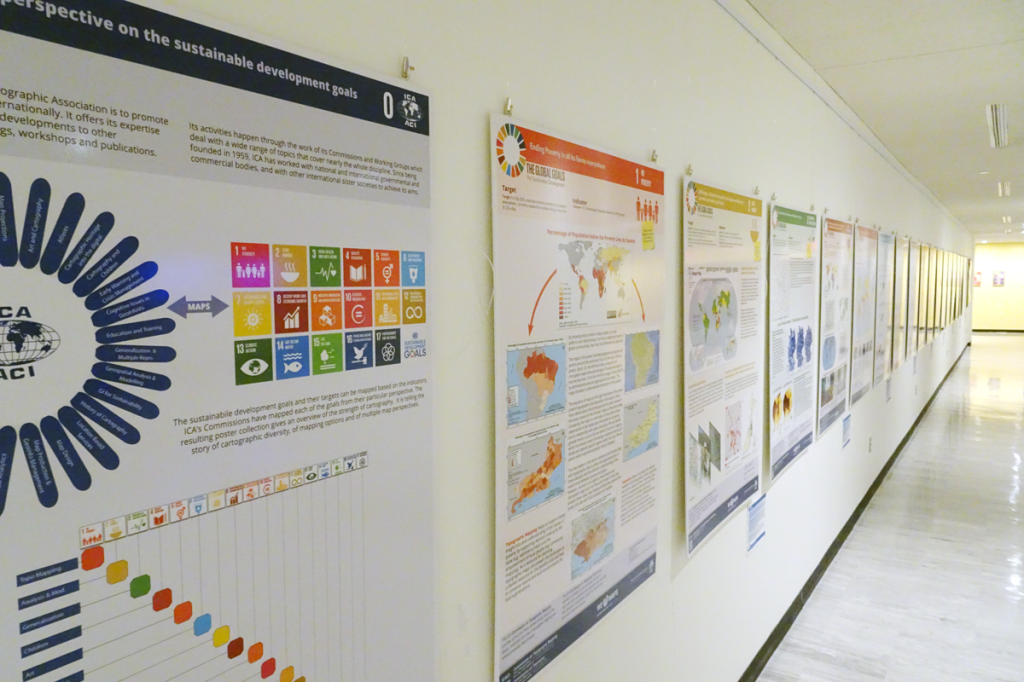 exposición de posters en las Naciones Unidas (Nueva York) en ocasión del International Map Year
- talleres nacionales a maestros, profesores, estudiantes de profesorado, estudiantes liceales
- talleres internacionales: España. Perú, Costa Rica
El punto culminante de esta estrategia de sostenibilidad es precisamente el Curso – Concurso Geoalfabetización mediante la utilización de Tecnologías de la Información Geográfica:
- se trata de una iniciativa de cobertura nacional, para grupos de estudiantes -con profesores referentes- de liceos públicos de todo el país
- debido a su impacto fuera de fronteras, se incluye a partir de 2022 la participación de extranjeros
- es organizado por ANEP-DGES (Administración Nacional de Educación Pública-Dirección Nacional de Educación Secundaria), Ceibal y Dir. Nac. de Topografía; en 2023 participa también la Universidad Politécnica de Madrid, colaborando la Gobernación de Cundinamarca (Colombia)
- la primera edición se lleva a cabo en 2017
- este año se desarrolló la sexta edición, siendo la primera vez que participan equipos de otros países de la región (en particular Colombia)
- etapas de la iniciativa:
- lanzamiento: convocatoria a docentes de enseñanza media para participar de una instancia de capacitación y luego en una competición entre proyectos desarrollados por equipos de estudiantes de enseñanza media liderados por un docente
- reclutamiento de tutores para el seguimiento de cada proyecto (hasta 2019 éstos eran estudiantes de las carreras de Cartografía y Agrimensura -UdelaR; a partir de 2021 participan como tutores integrantes de diferentes universidades iberoamericanas del proyecto GeoLIBERO)
- capacitación para docentes y tutores en modalidad b-learning (plataforma + talleres presenciales en todo el país; a partir de 2021, motivados por los cambios impuestos por la pandemia del Covid-19, los talleres son virtuales; a partir de 2022 la capacitación se ofrece también para participantes extranjeros)
- a quienes culminan satisfactoriamente la capacitación se los invita a presentar propuestas de proyectos para participar del concurso
- el Equipo Coordinador sugiere ajustes a dichas propuestas y su traducción a un proyecto
- durante 3 meses aproximadamente, los equipos desarrollan sus proyectos, con espacios virtuales particulares para cada uno en plataforma (para intercambios con tutores y Equipo Coordinador, entrega de materiales solicitados, foros para dudas, preguntas, consultas, comentarios)
- a mitad de tiempo los equipos realizan entregas parciales, presentando avance de cada proyecto y recibiendo la devolución del equipo coordinador y tutores
- al culminar, los equipos defienden sus proyectos ante el jurado, mediante videoconferencia
- luego de las defensas, se procede a emitir el fallo por parte del jurado (a partir de 2021 conformado por referentes expertos internacionales)
- como broche de todo el proceso se realiza un evento de cierre, organizado por Ceibal, en el cual todos los participantes comparten sus proyectos con el resto; se entregan los premios y certificados y se realiza una evaluación general de lo realizado
- reconocimiento internacional: los equipos finalistas reciben un diploma de GeoLIBERO
- videos:
? [https:]]
? [https:]]
? [https:]]
? proyecto premiado en edición 2021: [https:]] - entrevistas:
? [https:]]
? [https:]]
En la edición 2023 resultaron finalistas los siguientes proyectos:
- por Uruguay
- Título: Geo 7°F; Institución: Escuela Técnica N°2 CME; Localidad: Salto; Docente de referencia: Daiana Olivera; Tutor: Romel Vázquez
- Título: Mentes en crecimiento; Institución: Liceo Nº2 Dr. Antonio M. Grompone; Localidad: Salto; Docente de referencia: María Patricia Leal; Tutor: Carlos Lara
- Título: Urbapay; Institución: Liceo Nª4 Manuel Oribe; Localidad: Paysandú; Docente de referencia: Maximiliano Olivera; Tutor: Marino Carhuapoma
- por Colombia
- Título: Turismo, Desarrollo y Medio Ambiente en Choachí; Institución: IED Ignacio Pescador; Localidad: Choachí; Docente de referencia: Astrid Corredor; Tutor: Neftalí Sillero
- Título: Conectando con el Agua: Georreferenciando El «Páramo de Guerrero» en Subachoque y su Importancia Hídrica; Institución: IED La Pradera; Localidad:Subachoque; Docente de referencia: Sandra Milena Diaz Vargas; Tutor: Antoni Pérez Navarro
- Título: Mapeando nuestro territorio: Tabio; Institución: IEDInstituto Tecnico Comercial Jose de San Martin; Localidad: Tabio; Docente de referencia: John Castrillón; Tutor: Nadia Chaer
 evento de cierre Concurso Proyectos con Estudiantes y gvSIG Batoví 2023
Los proyectos ganadores resultaron los siguientes:
- por Uruguay: proyecto Urbapay
- por Colombia: proyecto Turismo, Desarrollo y Medio Ambiente en Choachí
Actuaron como tutores:
- Neftalí Sillero, Faculdade de Ciências da Universidade do Porto (Portugal)
- Carlos Lara, Facultad de Ciencias de la Universidad Católica de la Santísima Concepción (Chile)
- Marino Carhuapoma, IdeasG (Perú)
- Romel Vázquez, Universidad Central «Marta Abreu» de Las Villas (Cuba)
- Ramon Alejandro Claro Torres, Universidad Central «Marta Abreu» de Las Villas (Cuba)
- A/P Nadia Chaer, Comunidad gvSIG Uruguay (Uruguay)
- Antoni Pérez Navarro, profesor de los Estudios de Informática, Multimedia y Telecomunicación, Universitat Oberta de Catalunya (España)
Los integrantes del jurado fueron:
- Álvaro Anguix – Director de la Asociación gvSIG (España)
- Dr. Luis Manuel Vilches Blázquez – Universidad Politécnica de Madrid (España)
- Efraín Castro – Secretaría de Educación/Gobernación de Cundinamarca (Colombia)
- Prof. Julio A. Rodríguez Vaucher – ANEP/DGETP
- Dr. Gustavo Bentancor– Ceibal
- Insp. Mónica Canaveris – ANEP/DGES
- Sergio Acosta y Lara – DNTop/MTOP
Queremos destacar la calidad de la totalidad de los proyectos presentados, todas excelentes y variadas propuestas, que no hacen más que demostrarnos lo acertada de la iniciativa (el jurado la tuvo muy difícil…). Los trabajos realizados realmente no tienen nada que envidiar a muchos trabajos académicos o los realizados por consultorías. Cada año (y este no ha sido la excepción) muchos proyectos logran impactos tangibles en las comunidades: cambio de recorridos y de frecuencias del transporte colectivo como resultado del análisis y diagnóstico hecho por los estudiantes, pedidos de alcaldes a los estudiantes para asistirlos en la confección de mapas para la Administración, ayuda en la toma de decisiones para una mejor gestión de los residuos de una comunidad, etc., etc. Como se resaltó en el evento de cierre del pasado jueves 7 de diciembre: la iniciativa no sólo contribuye a una mejor capacitación académica de los estudiantes; también ayuda a formar mejores ciudadanos.
 socialización de proyectos
 equipo ganador Uruguay
 equipo ganador Colombia
Desde el Equipo Coordinador queremos volver a agradecer a todas y todos los que nos han apoyado y colaborado con esta iniciativa: a Natalia Pardo, Stephanie Veleda y Daniel Varsi del MTOP (una vez más, un enorme gracias por toda su dedicación, apoyo y por estar siempre en todas); a las y los tutores: un enorme placer haber contado con ustedes; a los integrantes del jurado: nos sentimos muy honrados por su participación; a Martina Bailón, Agostina Bernasconi, Patricia Castell, Carinna Balsamo y Paola Vilar del Plan Ceibal (gracias por su invalorable asistencia); a Álvaro Anguix (coordinador de la red GeoLIBERO), Mario Carrera y toda la Asociación gvSIG (gracias a su incansable apoyo es que este proyecto es posible); a Luis Vilches por su gran apoyo y coordinación internacional, y a todas las autoridades de las instituciones involucradas (nacionales y extranjeras) que han decidido continuar apoyando esta iniciativa, la que continúa creciendo.
-
16:12
From GIS to Remote Sensing: Semi-Automatic Classification Plugin major update: version 8.2.0
sur Planet OSGeoThe Semi-Automatic Classification Plugin (SCP) has been updated to version 8.2.0 which is focused on the download of new products.This function requires Remotior Sensus to be updated at least to version 0.2.01, which also includes several new products from the Microsoft Planetary Computer. Microsoft Planetary Computer is a platform developed by Microsoft to foster environmental sustainability and Earth science through a Data Catalog, a JupyterHub and several other tools.In this case, Remotior Sensus connects to the Data Catalog to search and download images available from Microsoft Planetary Computer, such as the Landsat archive, MODIS, and Sentinel-2.
Read more » -
23:33
Free and Open Source GIS Ramblings: Mapping relationships between Neo4j spatial nodes with GeoPandas
sur Planet OSGeoPreviously, we mapped neo4j spatial nodes. This time, we want to take it one step further and map relationships.
A prime example, are the relationships between GTFS StopTime and Trip nodes. For example, this is the Cypher query to get all StopTime nodes of Trip 17:
MATCH
    (t:Trip  {id: "17"})
    <-[:BELONGS_TO]-
    (st:StopTime)
RETURN st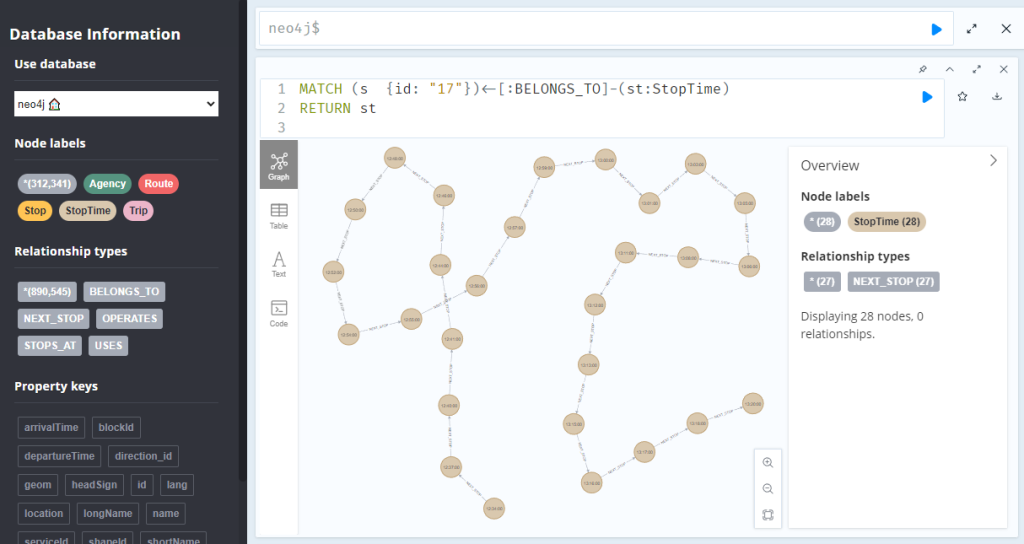
To get the stop locations, we also need to get the stop nodes:
MATCH
    (t:Trip {id: "17"})
    <-[:BELONGS_TO]-
    (st:StopTime)
    -[:STOPS_AT]->
    (s:Stop)
RETURN st ,s
Adapting our code from the previous post, we can plot the stops:
from shapely.geometry import Point

QUERY = """MATCH (
    t:Trip {id: "17"})
    <-[:BELONGS_TO]-
    (st:StopTime)
    -[:STOPS_AT]->
    (s:Stop)
RETURN st ,s
ORDER BY st.stopSequence
"""

with driver.session(database="neo4j") as session:
    tx = session.begin_transaction()
    results = tx.run(QUERY)
    df = results.to_df(expand=True)
    gdf = gpd.GeoDataFrame(
        df[['s().prop.name']], crs=4326,
        geometry=df["s().prop.location"].apply(Point)
    )

tx.close()
m = gdf.explore()
m
Ordering by stop sequence is actually completely optional. Technically, we could use the sorted GeoDataFrame, and aggregate all the points into a linestring to plot the route. But I want to try something different: we’ll use the NEXT_STOP relationships to get a DataFrame of the start and end stops for each segment:
QUERY = """
MATCH (t:Trip {id: "17"})
   <-[:BELONGS_TO]-
   (st1:StopTime)
   -[:NEXT_STOP]->
   (st2:StopTime)
MATCH (st1)-[:STOPS_AT]->(s1:Stop)
MATCH (st2)-[:STOPS_AT]->(s2:Stop)
RETURN st1, st2, s1, s2
"""

from shapely.geometry import Point, LineString

def make_line(row):
    s1 = Point(row["s1().prop.location"])
    s2 = Point(row["s2().prop.location"])
    return LineString([s1,s2])

with driver.session(database="neo4j") as session:
    tx = session.begin_transaction()
    results = tx.run(QUERY)
    df = results.to_df(expand=True)
    gdf = gpd.GeoDataFrame(
        df[['s1().prop.name']], crs=4326,
        geometry=df.apply(make_line, axis=1)
    )

tx.close()
gdf.explore(m=m)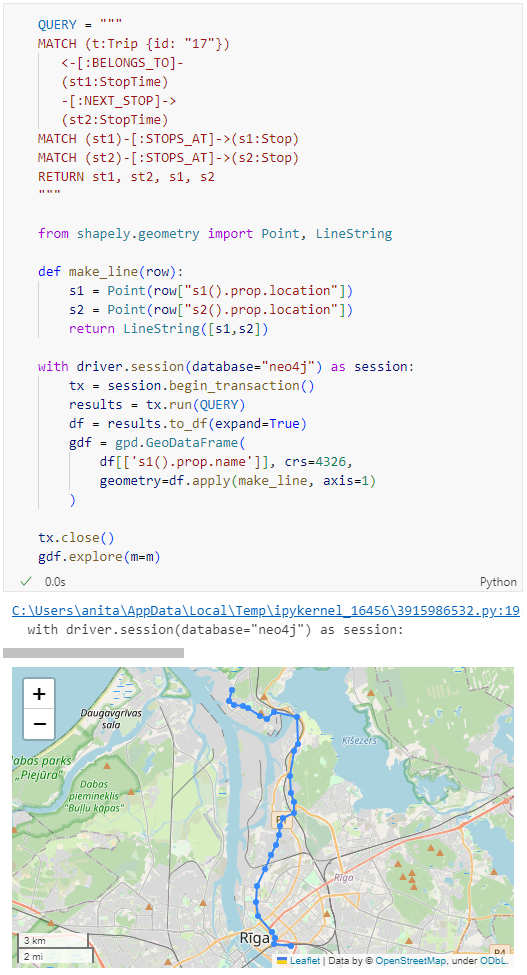
Finally, we can also use Cypher to calculate the travel time between two stops:
MATCH (t:Trip {id: "17"})
   <-[:BELONGS_TO]-
   (st1:StopTime)
   -[:NEXT_STOP]->
   (st2:StopTime)
MATCH (st1)-[:STOPS_AT]->(s1:Stop)
MATCH (st2)-[:STOPS_AT]->(s2:Stop)
RETURN st1.departureTime AS time1,
   st2.arrivalTime AS time2,
   s1.location AS geom1,
   s2.location AS geom2,
   duration.inSeconds(
      time(st1.departureTime),
      time(st2.arrivalTime)
   ).seconds AS traveltime
As always, here’s the notebook: [https:]]
-
18:42
From GIS to Remote Sensing: Semi-Automatic Classification Plugin update: version 8.1.7
sur Planet OSGeoThe Semi-Automatic Classification Plugin (SCP) has been updated to version 8.1.7 which solves a few bugs and adds the options to download Sentinel-2 images from the Copernicus Data Space Ecosystem.
Read more » -
20:18
GeoSolutions: DoDIIS 2023 Portland, OR – GeoSolutions USA, Innovation, and Emerging Technology
sur Planet OSGeoYou must be logged into the site to view this content.
-
4:58
BostonGIS: PostGIS Day 2023 Summary
sur Planet OSGeoPostGIS Day 2023 videos came out recently. PostGIS Day conference is always my favorite conference of the year because you get to see what people are doing all over the world, and it always has many many new tricks for using PostgreSQL and PostGIS family of extensions you had never thought of. Most importantly it's virtual, which makes it much easier for people to fit in their schedules than an on site conference. We really need more virtual conferences in the PostgreSQL community. Many many thanks to Crunchy Data for putting this together again, in particular to Elizabeth Christensen who did the hard behind the scenes work of corraling all the presenters and stepping in to give a talk herself, and my PostGIS partner in development Paul Ramsey who did the MC'ing probably with very little sleep, but still managed to be very energetic. Check out Elizabeth's summary of the event. Many of her highlights would have been mine too, so I'm going to skip those.
Continue reading "PostGIS Day 2023 Summary" -
20:50
GeoTools Team: State of GeoTools 30.1
sur Planet OSGeoJody Garnett here to share a presentation from FOSS4G Asia 2023 on the State of GeoTools 30.1. It has been nine years since our last "State of GeoTools" presentation in FOSS4G 2014 Portland; however this was just a lighting talk and is devoted to recent updates. I would like to the event organizers, and my employer GeoCat for the opportunity to speak on behalf of the GeoTools project. -
2:00
Camptocamp: Innovations and Standards in Geospatial
sur Planet OSGeoPièce jointe: [télécharger]
At Camptocamp, we are deeply committed to the heart of the open source communities, not just to spur innovation but also to integrate the needs of our clients and partners. -
13:36
Jorge Sanz: MSF Mapathon at Universitat de València
sur Planet OSGeoLast week for the first time since the pandemic I attended a Mapathon in person. With the geomaticblog.net retired, this is my first geospatial post on my own website ?. What’s a mapathon? For those that don’t know the term, a mapathon is a gathering of volunteers to do some remote mapping with the objective of improve the cartography of an area of the world that does not have a proper map.


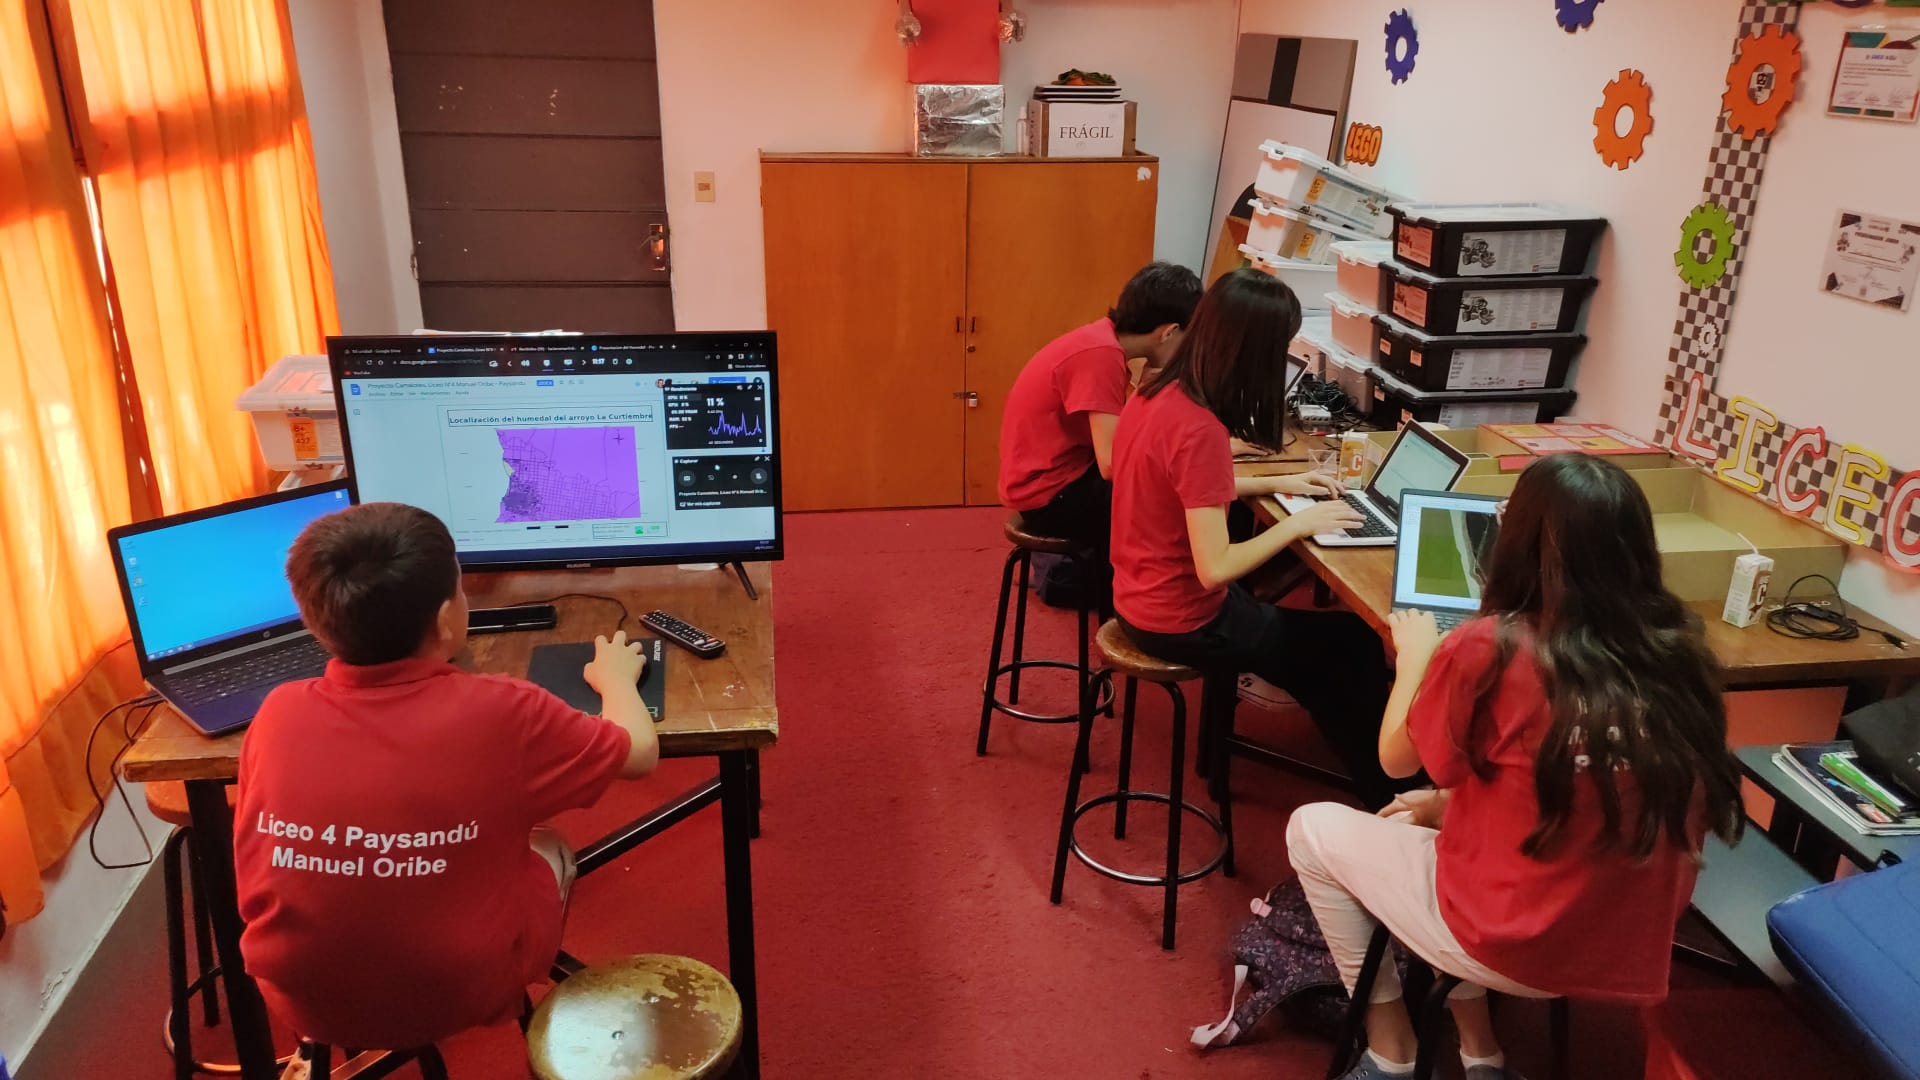


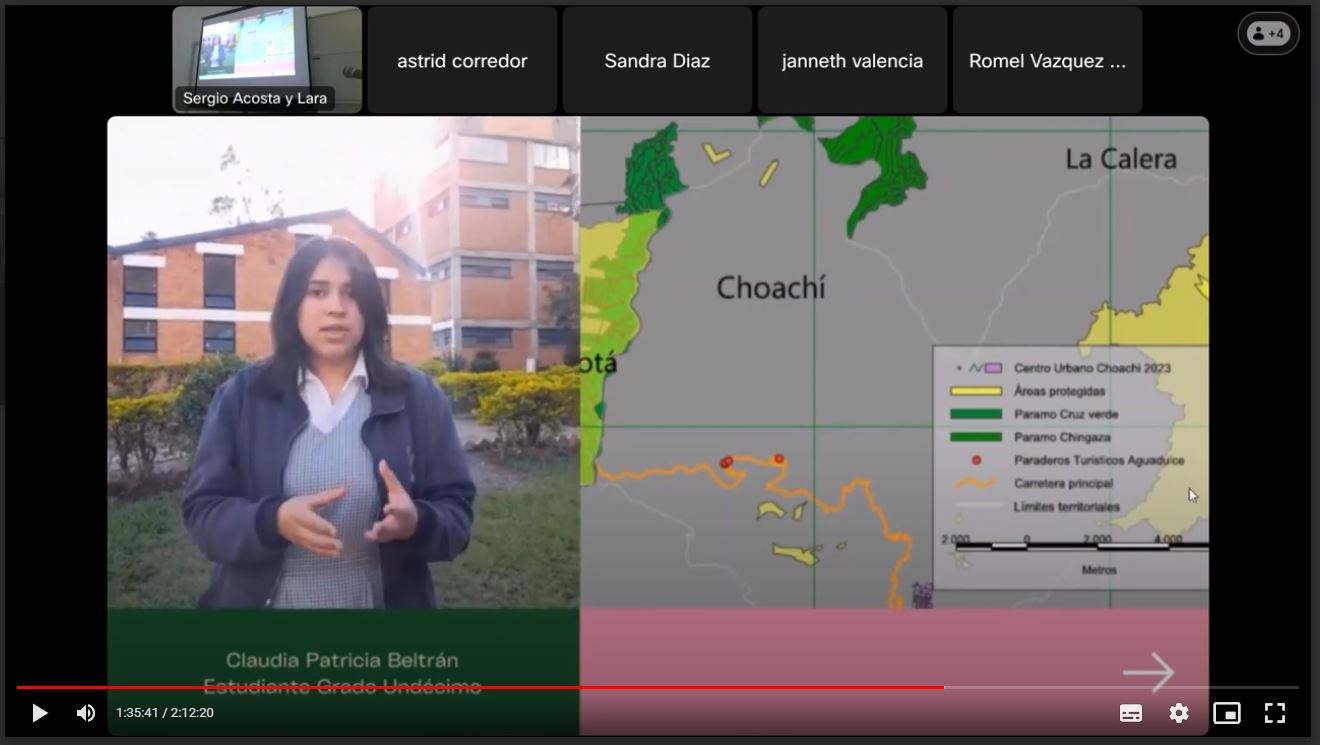


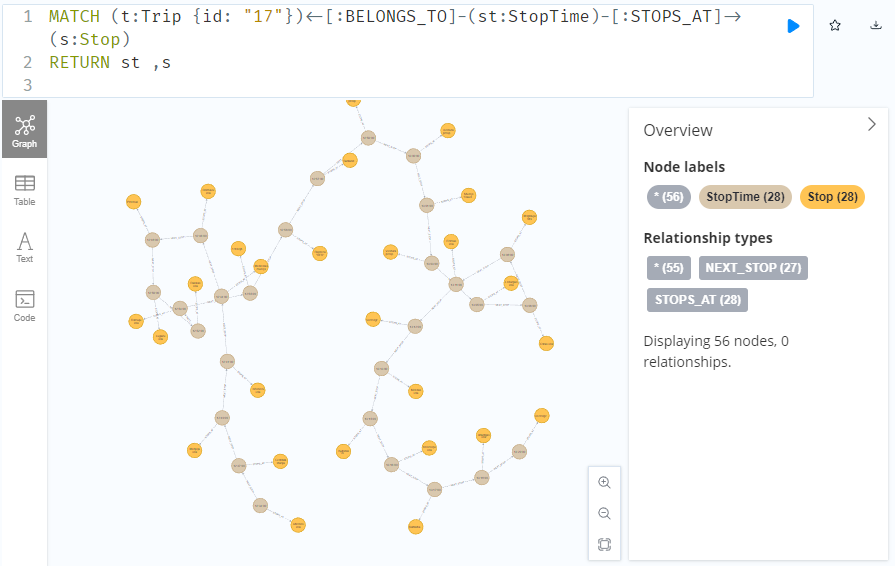


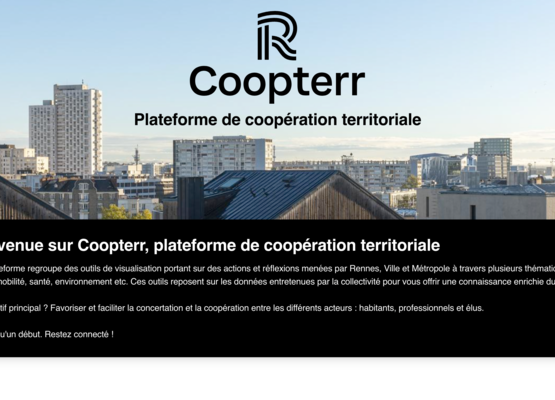
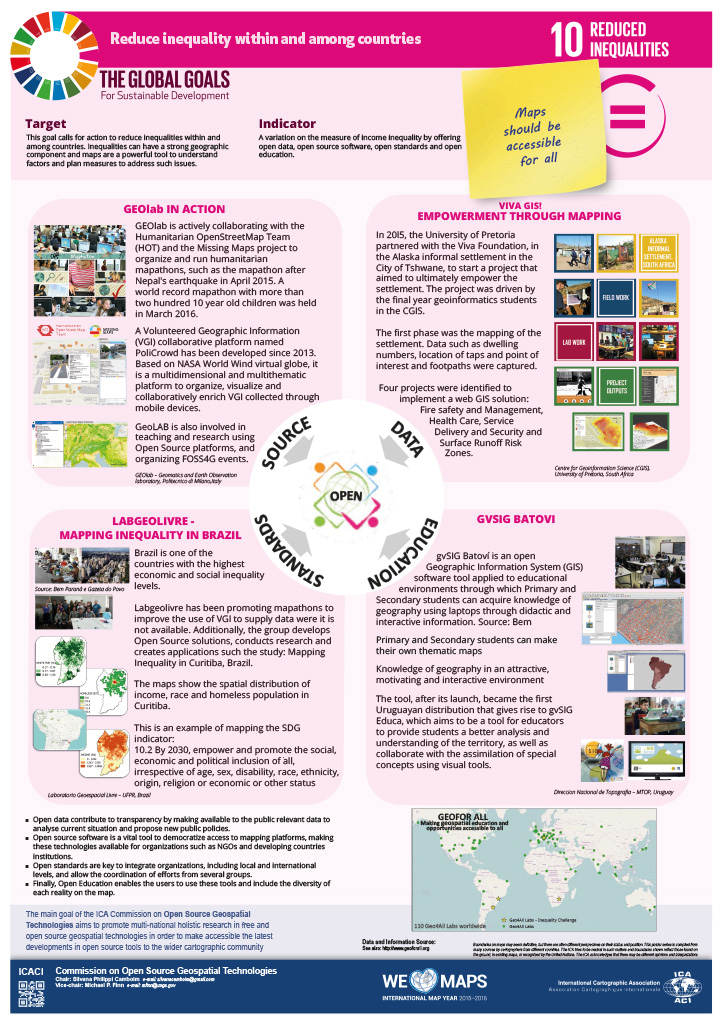