
Vous pouvez lire le billet sur le blog La Minute pour plus d'informations sur les RSS !
Canaux
4011 éléments (9 non lus) dans 54 canaux
 Dans la presse
(2 non lus)
Dans la presse
(2 non lus)
-
 Cybergeo
-
Revue Internationale de Géomatique (RIG)
-
SIGMAG & SIGTV.FR - Un autre regard sur la géomatique
(2 non lus)
-
Mappemonde
-
Imagerie Géospatiale
-
Toute l’actualité des Geoservices de l'IGN
-
arcOrama, un blog sur les SIG, ceux d ESRI en particulier
-
arcOpole - Actualités du Programme
-
Géoclip, le générateur d'observatoires cartographiques
-
Blog GEOCONCEPT FR
Toile géomatique francophone
(7 non lus)
-
Géoblogs (GeoRezo.net)
-
Conseil national de l'information géolocalisée
-
 Geotribu
(1 non lus)
Geotribu
(1 non lus) -
Les cafés géographiques
-
UrbaLine (le blog d'Aline sur l'urba, la géomatique, et l'habitat)
-
Icem7
-
Séries temporelles (CESBIO)
(2 non lus)
-
Datafoncier, données pour les territoires (Cerema)
-
Cartes et figures du monde
-
SIGEA: actualités des SIG pour l'enseignement agricole
-
Data and GIS tips
-
Neogeo Technologies
(1 non lus)
-
ReLucBlog
-
L'Atelier de Cartographie
-
My Geomatic
-
archeomatic (le blog d'un archéologue à l’INRAP)
-
Cartographies numériques
-
Veille cartographie
-
Makina Corpus (1 non lus)
-
Oslandia
(2 non lus)
-
Camptocamp
-
Carnet (neo)cartographique
-
Le blog de Geomatys
-
GEOMATIQUE
-
Geomatick
-
CartONG (actualités)

Géomatique anglophone
-
sur gvSIG Team: Inventario turístico georreferenciado del Pla de Mallorca adaptado a la Normativa (UNE 178503)
Publié: 4 July 2023, 7:57am CEST

Como parte de uno de los proyectos que estamos abordando con la Suite gvSIG, la IDE turística de la Mancomunidad del Pla de Mallorca, hemos realizado un inventario turístico en el que se ha partido de datos existentes y se ha realizado labor de toma de datos en campo (con gvSIG Mapps). La novedad de dicho inventario es que es pionero en la adopción de la Norma UNE 178503 para representar las distintas capas de datos georrefenciados.
La UNE 178503:2022 “Semántica aplicada a destinos turísticos inteligentes”, define una semántica base que permite representar la información relevante en la que se conforma el destino turístico (destino turístico, recursos turísticos dentro del destino, experiencias de viaje), asegurando la interoperabilidad de sus plataformas turísticas y de la ciudad y el territorio entre sí y con desarrollos de terceros.
Esta adopción de la Norma ha conllevado un trabajo previo de análisis de datos existentes y de la propia Norma permitiendo, entre otras cosas, identificar posibles términos que no están incluidos en la norma UNE 178503:2022 o campos que no aplican a las características de la Mancomunidad. De este modo se ha conseguido una adopción y adaptación a la realidad particular del destino del Pla de Mallorca que ha acabado reflejado en el modelo de datos de la Infraestructura de Datos Espaciales.
Por tanto, este proyecto ha conllevado llevar la interoperabilidad de datos geográficos turísticos un paso más allá, tanto en servicios de acceso (WMS, WMTS. WFS) como en semántica y modelo de datos.
En breve os contaremos más sobre el proyecto y compartiremos la IDE/Geoportal resultante, donde podréis consultar el inventario. Todo ello desarrollado con gvSIG Online para la publicación de datos, gvSIG Mapps para la toma de datos y gvSIG Desktop para el tratamiento de datos.
-
sur SourcePole: FOSS4G 2023 Prizren
Publié: 4 July 2023, 2:00am CEST
FOSS4G is the annual global event of free and open source geographic technologies and open geospatial data hosted by OSGeo. In 2023 it took place in Prizren, Kosovo.
-
sur GeoServer Team: GeoServer at FOSS4G 2023
Publié: 4 July 2023, 2:00am CEST
The GeoServer team was pleased to attend FOSS4G 2023 last week (26 June - 2 July 2023) in Prizren, Kosovo!
FOSS4G 2023 was put on this year by the Open Source Geospatial Foundation (OSGeo) and the regional Free Libre Open Source Software Kosova (FLOSSK) organization. The local organizing committee worked very hard to make everyone feel welcome and well cared for. Thank you for hosting everyone, we had a great time.
GeoServer content:
- State of GeoServer 2.23
- GeoServer Feature Frenzy 2023
- GeoServer used in fun and interesting ways
- GeoServer Orientation
- Getting Started with GeoServer (Workshop)
GeoServer community content:
- FOSS4G 2023 (GeoCat Blog)
- GeoSolutions presence at FOSS4G 2023 in Prizren (Kosovo) (GeoSolutions Blog)
- Many additional presentations featured GeoServer and showcased its capabilities.
When videos are provided of the event we will update this post with links.
FOSS4G Code sprint
Prizren (Kosovo)We also had our first scheduled codesprint on refactoring org.opengis package. The foss4g sprint was a fact-finding mission to establish the scope of work and confirm time frame and budget.
- The activity was successful in that we were able to change from org.opengis to org.geotools.api and write a script to update GeoWebCache and GeoServer projects.
- GeoServer has some difficulties as gs-printing and gs-geofence-server include the work of external projects which will require assistance.
The work is scheduled for the Bolsena Codesprint 2023 ahead of the GeoServer 2.24.0 release cycle.
For more information see OpenGIS Harmonization at OSGeo. If you are in a position to provide sponsorship, or in-kind participation, this activity could use your support.
-
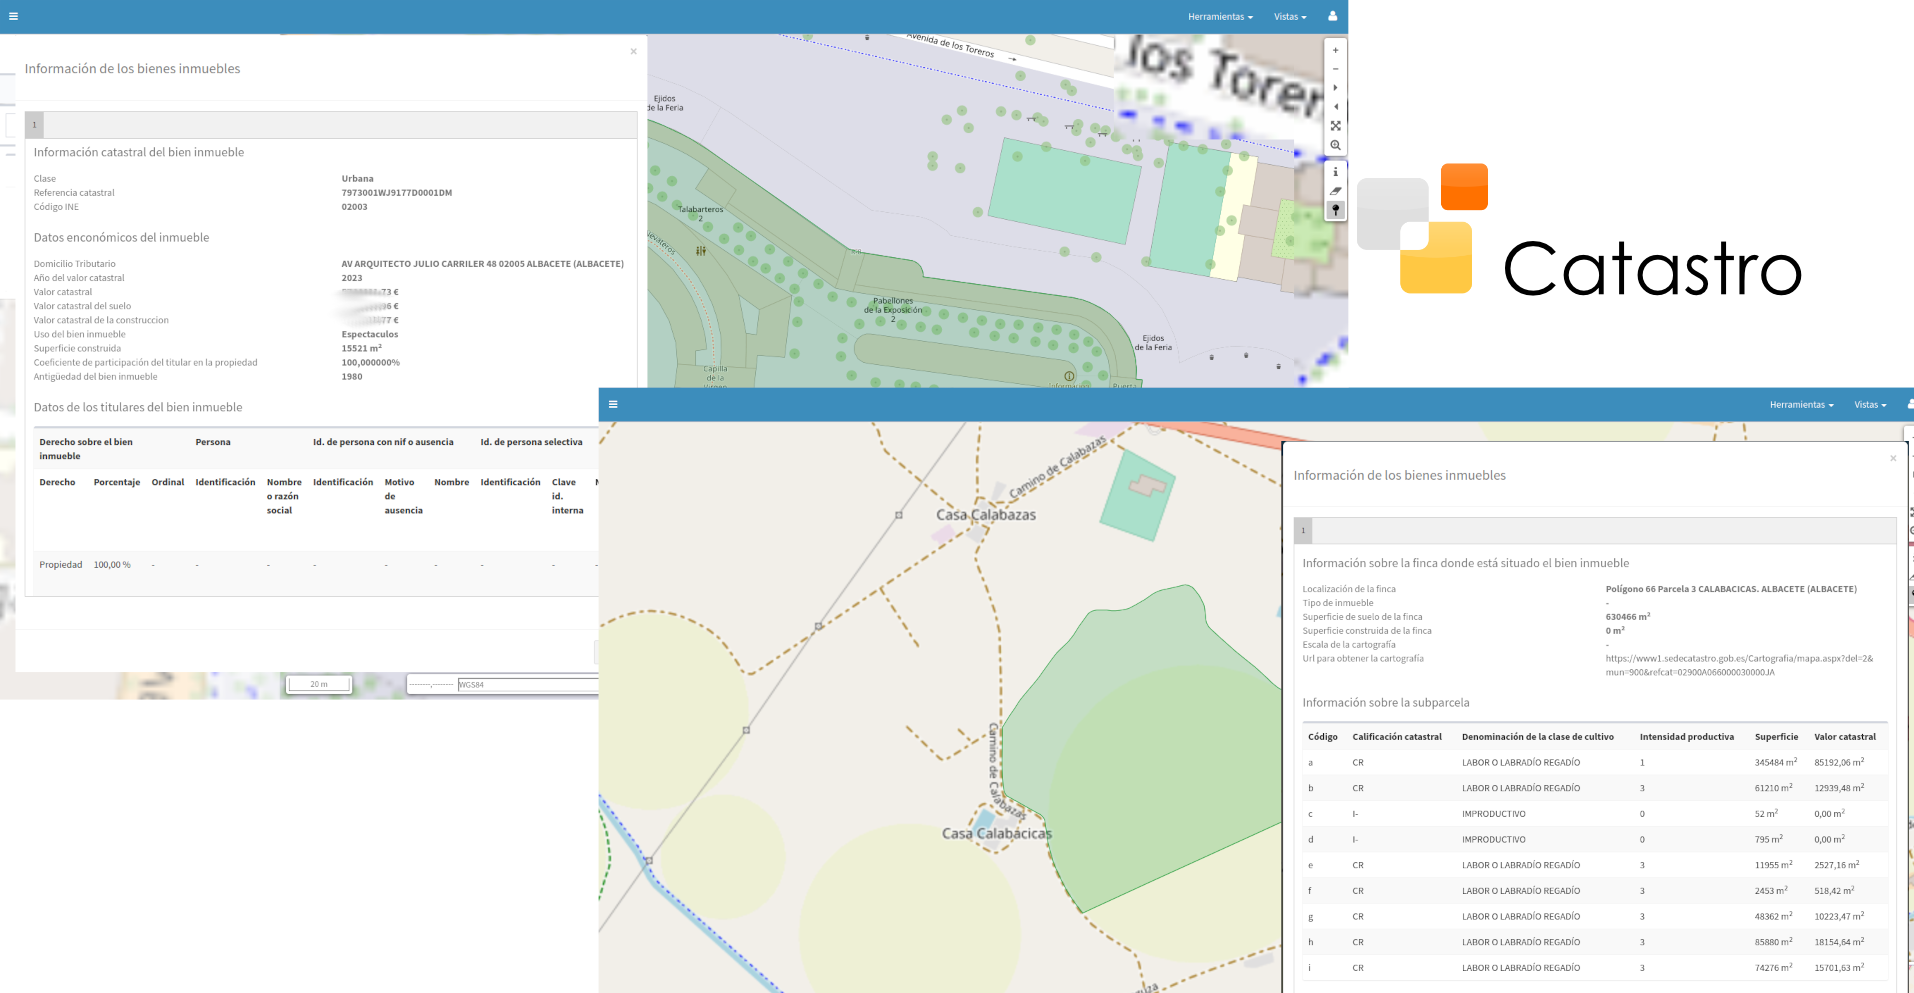
sur gvSIG Team: Acceso a datos protegidos de Catastro con gvSIG Online
Publié: 3 July 2023, 8:25am CEST
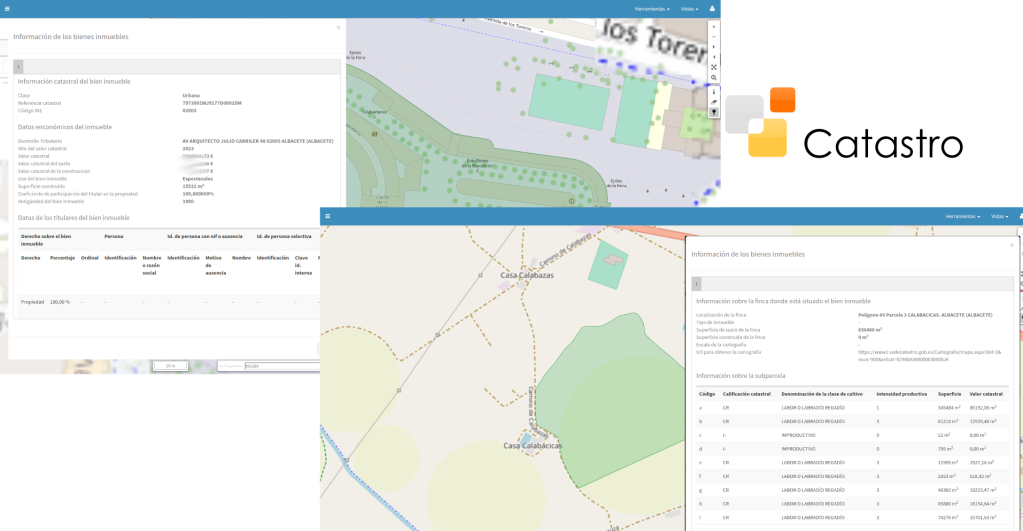
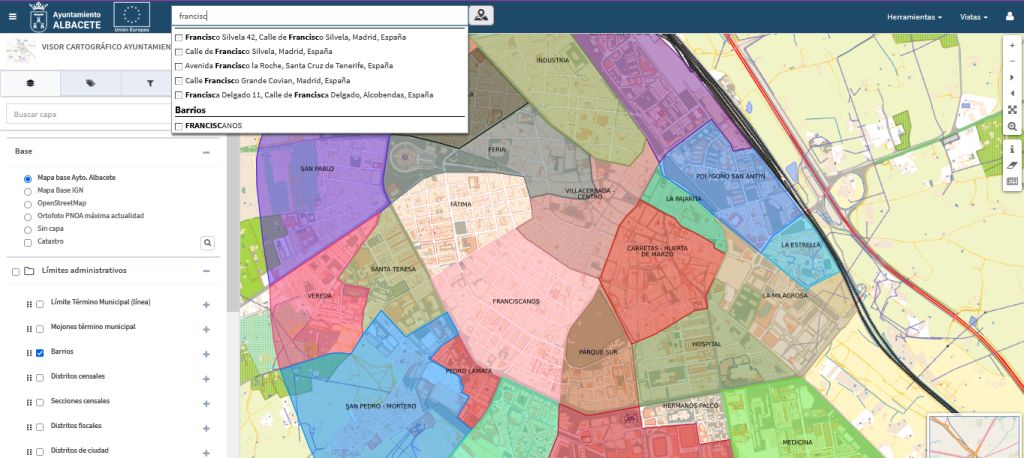
Uno de los desarrollos que se ha realizado para la Infraestructura de Datos Espaciales del Ayuntamiento de Albacete es el relativo a la consulta de datos protegidos de Catastro. Una herramienta innovadora y que gvSIG Online añade a las cada vez más numerosas utilidades que tiene disponibles.
Por supuesto, si hablamos de datos protegidos, a esta funcionalidad solo tendrá acceso el personal del Ayuntamiento que disponga de los permisos correspondientes.
La utilidad y ventaja de esta funcionalidad es fácilmente entendible. Desde cualquier geoportal (de uso interno, claro) que tenga habilitada esta herramienta, una persona con permisos de acceso podrá consultar cualquier parcela – urbana o rústica – y acceder no solo a los datos públicos que proporciona la Sede Electrónica del Catastro sino también a los datos protegidos. Este tipo de consultas son necesarias y habituales en determinados procesos de gestión municipal, especialmente en algunos departamentos como Patrimonio.
Otro motivo más para apostar por gvSIG Online. Y van…
-
sur From GIS to Remote Sensing: Semi-Automatic Classification Plugin v.8 Release Date
Publié: 3 July 2023, 1:15am CEST
I am glad to announce that the new version of the Semi-Automatic Classification Plugin (SCP) for QGIS will be released in October 2023.
This new version will improve the capabilities of SCP, based on a completely new Python processing framework that is Remotior Sensus, developed for image classification, machine learning and GIS spatial analyses.
For any comment or question, join the Facebook group or GitHub discussions about the Semi-Automatic Classification Plugin.

-
sur Is it too hot for the Tour de France?
Publié: 1 July 2023, 10:26am CEST par Keir Clarke
Broadcaster RTBF has published a detailed examination of how global heating is affecting the Tour de France. In Blowing Hot on the Big Loop RTBF uses vintage photographs, historical climate data and rider accounts to explore the effect of climate change on the world's greatest cycle race.In last year's Tour de France the rider Alexis Vuillermoz collapsed from heat stroke at the end of the ninth -
sur You Don't Know Africa
Publié: 30 June 2023, 8:46am CEST par Keir Clarke
Let's face it your geographical knowledge of African countries is woefully inadequate. If you had to identify the location of Burkina Faso on a map you would probably end up pointing to the Philippines. Well it's time to change that. Today you are going to improve your knowledge of Africa and have fun while doing so. You Don't Know Africa is a collection of three online map games which will
-
sur gvSIG Team: Geoportal de especies exóticas invasoras en Uruguay con gvSIG Online
Publié: 30 June 2023, 8:10am CEST
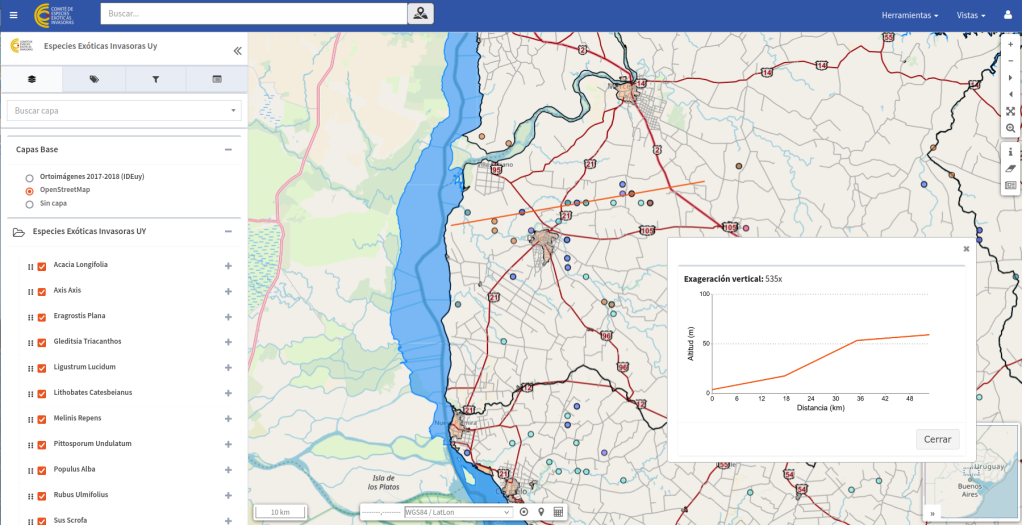
Los que nos vais siguiendo ya tendréis claro que los geoportales realizados con gvSIG Online tienden a infinito. Cada día surgen nuevos geoportales de las numerosas y crecientes organizaciones que lo tienen implementado. Una de las IDE (Infraestructuras de Datos Espaciales) de referencia donde se utiliza gvSIG Online es la de Uruguay. Aunque inicialmente se pensó para utilizarse para un único geoportal, el propio de la IDE que recopila la información básica del país, poco a poco se han ido generando más y más geoportales – unos públicos, otros muchos privados – para gestionar y divulgar información geográfica de todo tipo (catastral, estadística, sanitaria,… ).
Hoy os compartimos uno de los geoportales públicos, en este caso de temática medioambiental, y que permite consultar la distribución de las especies exóticas invasoras en Uruguay. El geoportal cuenta con las principales herramientas ya disponibles en la IDE, algunas de interés para evaluar la distribución de estas especies como es el cálculo de perfiles longitudinales.
Podéis acceder al geoportal aquí: Geoportal
-
sur Marco Bernasocchi: QField background tracking
Publié: 29 June 2023, 11:54am CEST
Years ago, the QField community and its users showed their love for their favourite field app by supporting a successful crowdfunding to improve camera handling.
Since then, OPENGIS.ch has continued to lead the development of QField with the regular support of sponsors. We couldn’t be prouder of the progress we have made, with plenty of new features added in every major release. This includes major improvements to positioning including location tracking, integration of external GNSS receivers through not only Bluetooth but TCP/UDP and serial port connections, accuracy indicator and constraints, and most recently sensors reading to list a few.
We are now calling for the community to help further better QField and unlock an important milestone: background location tracking service.
Pledge now Main goal: background location tracking on Android – 25’000€
Currently, QField requires users to keep their devices’ screen on and have the app in the foreground to keep track of the device’s positioning location. On mobile devices, this can drain batteries faster than many would want to, in environments where charging options are limited.
This crowdfunding aims at removing this constraint and allow QField – via a background service – to constantly keep tracking location even while the device is suspended (i.e., when the screen is turned off / locked).
To achieve this, a significant amount of work is required as the positioning framework on Android will need to be relocated to a dedicated background service. Recent work we’ve done adding a background service to synchronize captured image attachments in QFieldCloud projects armed us with the assurances that we can achieve our goal while giving us an appreciation of the large amount of work needed.
Some of the benefitsRunning out of battery is the nightmare of most field surveyors. By moving location tracking to a background service, users will be able to improve their battery life considerably and keep focusing on their tasks even if it involves switching to a different app.
Furthermore, while OPENGIS.ch ninjas remain busy squashing reported QField crashes all year long, there will always be unexpected scenarios leading to abrupt app shutdowns, such as third-party apps, systems running out of battery, etc. To address this, the background service framework will also act as a safeguard to avoid location data loss when QField unexpectedly shuts down and offer users means to recover that data upon re-opening QField.
Stretch goal 1: background navigation audio feedback 5’000€The second stretch goal builds onto QField’s nice fly-to-point navigation system. If the QField community meets this threshold, a new background navigation audio feedback informing users in the field of their proximity to their target will be implemented.
The audio feedback will use text-to-speech technology to state the distance to target in meters for a given time or distance interval.
Stretch goal 2: iOS 15’000€The main goal will cover the Android implementation only. Due to being a very low level work we will have to replicate the work for each platform we support. If we reach stretch goal 2 we will also implement this for iOS.
Pledge now:In case you do not see the embedded form you can open it directly here.
Thanks for supporting our crowdfunding and keep an eye on our blog for updates on the status.

-
sur The True Cost of Climate Change
Publié: 29 June 2023, 9:47am CEST par Keir Clarke
This week the World Resources Institute (WRI) and the University of Maryland announced that 4.1m hectares of primary rainforest was destroyed around the world in 2022. In reporting this news many media outlets compared the amount of rainforest lost last year as being equivalent to the size of Switzerland. This got me thinking about how often the scale of natural disasters (such as hurricanes
-
sur gvSIG Team: Geoportal y APP para gestión y consulta del Plan de Infraestructuras Turísticas de Canarias con la Suite gvSIG
Publié: 29 June 2023, 7:50am CEST
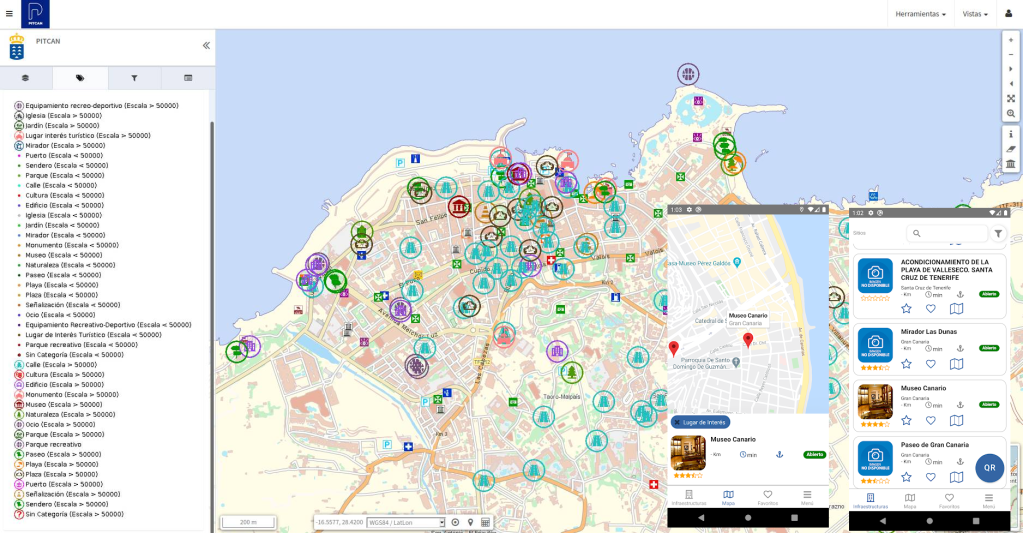
El Gobierno de Canarias tenía la necesidad de poder gestionar a nivel interno el Plan de Infraestructuras Turísticas de Canarias (PITCAN) y, de cara a los ciudadanos, dotarles de una app para consulta.
El PITCAN es un plan impulsado por la Dirección General de Infraestructuras Turísticas del Gobierno de Canarias. Se trata de una base de datos abierta, dinámica y flexible de infraestructuras turísticas, a modo de relación de actuaciones priorizadas.
Para dar solución a estas necesidades se ha implementado gvSIG Online, como plataforma para gestionar todas la información georreferenciada relativa al PITCAN y que, por ejemplo, incluye funcionalidades para generar informes automáticos en distintos formatos. Por otro lado, se ha desarrollado una app integrada con gvSIG Online y basada en gvSIG Mapps con herramientas orientadas a facilitar las consultas a los ciudadanos y visitantes interesados en el Plan de Infraestructuras Turísticas de Canarias.
Por si queréis echarle un vistazo, la app la tenéis disponible tanto para iOS como para Android.
Google Play: [https:]]
App Store: [https:]]

-
sur The 2023 Best Cities for Cycling
Publié: 28 June 2023, 10:13am CEST par Keir Clarke
According to PeopleForBikes Minneapolis is the best large U.S. for cycling. Every year PeopleForBikes ranks the best places to cycle in the United States. This year, using its own 'Bicycle Network Analysis' (BNA) PeopleForBikes rated the quality of the cycling networks in 1,484 U.S. cities. This year Minneapolis made significant improvements to its cycling infrastructure becoming the best large
-
sur gvSIG Team: Planes locales de quemas (PLQ) con gvSIG Online
Publié: 28 June 2023, 8:00am CEST

El Plan Local de Quemas (PLQ) es una normativa reguladora fundamental en la gestión del uso cultural del fuego que se aplica en la Comunidad Valenciana, existiendo normativas similares en otras comunidades autónomas.
Los PLQ están orientados, principalmente, a minimizar los riesgos de incendios forestales. Regulan actividades tradicionales que requieren el uso del fuego como la quema de restos de poda, quema de matorrales, quema de márgenes de cultivo, uso del ahumador en actividades apícolas, etc.
Estos Planes Locales de Quemas tienen una clara componente territorial, estableciendo zonas de riesgos que establecen las limitaciones para realizar quemas en las distintas parcelas de un municipio.
Cada vez son más los municipios que implantan gvSIG Online como su solución para gestionar toda la información territorial. Con gvSIG Online es extremadamente sencillo generar un geoportal con el Plan Local de Quemas.
Os traemos 3 ejemplos de 3 municipios que tienen un geoportal público con el PLQ:

-
sur The End of the Rainforest
Publié: 27 June 2023, 3:32pm CEST par Keir Clarke
Last year we destroyed an area of rainforest equivalent to the size of Switzerland. According to a new report by the World Resources Institute (WRI) and the University of Maryland 4.1m hectares of primary rainforest was chopped down in 2022. This was a 10% increase on the previous year. According to the report the two countries with the most tropical forest, Brazil and the Democratic Republic -
sur Geoengineering Planet Earth
Publié: 27 June 2023, 9:35am CEST par Keir Clarke
The Geoengineering Map shows the locations of over 1,700 geoengineering experiments taking place around the world. The mapped projects include experiments involving weather modification, carbon capture, and solar radiation management.In response to global heating some governments and companies have proposed tackling climate change through large-scale manipulations of Earth's ecology. The
-
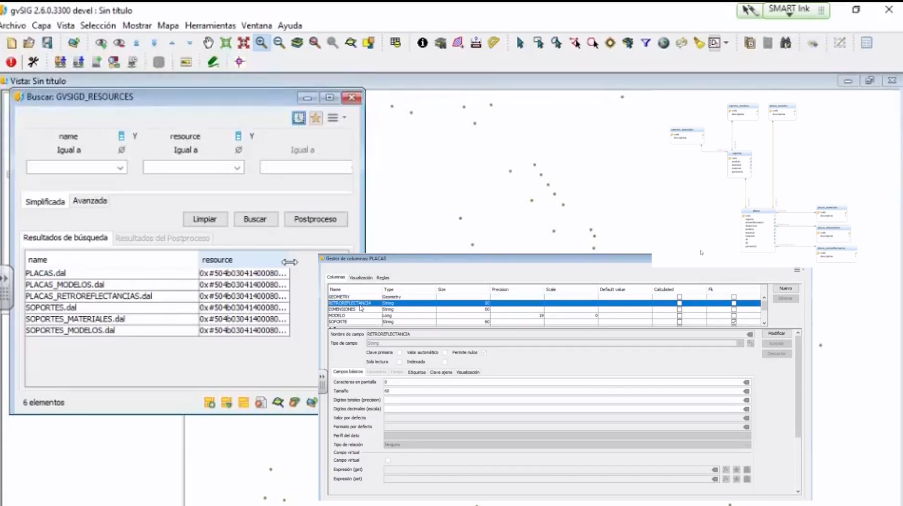
sur gvSIG Team: Curso-taller: Preparación de modelos de datos y fichas de búsqueda en gvSIG
Publié: 27 June 2023, 8:21am CEST

Hoy traemos la grabación de un curso-taller al que todos los que trabajáis con datos con dimensión geográfica deberíais echarle un vistazo (y dos, y tres… ). gvSIG Desktop dispone en sus últimas versiones de un conjunto de herramientas muy potentes para trabajar con modelos de datos. Lo dicho, no os lo perdáis…
-
sur QGIS Blog: QGIS Grant Programme 2023 Results
Publié: 26 June 2023, 8:32pm CEST
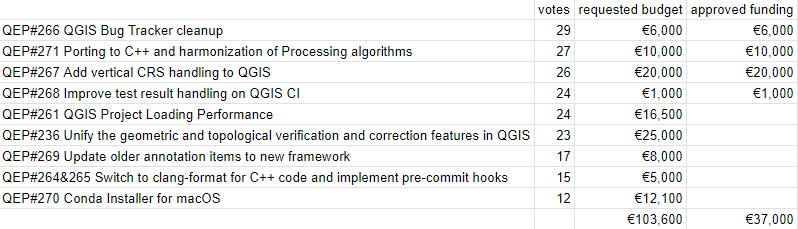
We are extremely pleased to announce the 4 winning proposals for our 2023 QGIS.ORG grant programme:
- QEP#266 QGIS Bug Tracker cleanup
- QEP#271 Porting to C++ and harmonization of Processing algorithms
- QEP#267 Add vertical CRS handling to QGIS
- QEP#268 Improve test result handling on QGIS CI
Funding for the programme was sourced by you, our project donors and sponsors! Note: For more context surrounding our grant programme, please see: QGIS Grants #8: Call for Grant Proposals 2023.
The QGIS.ORG Grant Programme aims to support work from our community that would typically not be funded by client/contractor agreements. This means that we did not accept proposals for the development of new features. Instead proposals focus on infrastructure improvements and polishing of existing features.
Voting to select the successful projects was carried out by our QGIS Voting Members. Each voting member was allowed to select up to 6 proposals. The full list of votes are available here (on the first sheet). The following sheets contain the calculations used to determine the winner (for full transparency). The table below summarizes the voting tallies for the proposals:

A couple of extra notes about the voting process:
- Voting was carried out based on the technical merits of the proposals and the competency of the applicants to execute on these proposals.
- No restrictions were in place in terms of how many proposals could be submitted per person / organization, or how many proposals could be awarded to each proposing person / organization.
- Voting was ‘blind’ (voters could not see the existing votes that had been placed).
We received 35 votes from 20 community representatives and 15 user group representatives.
On behalf of the QGIS.ORG project, I would like to thank everyone who submitted proposals for this call!
-
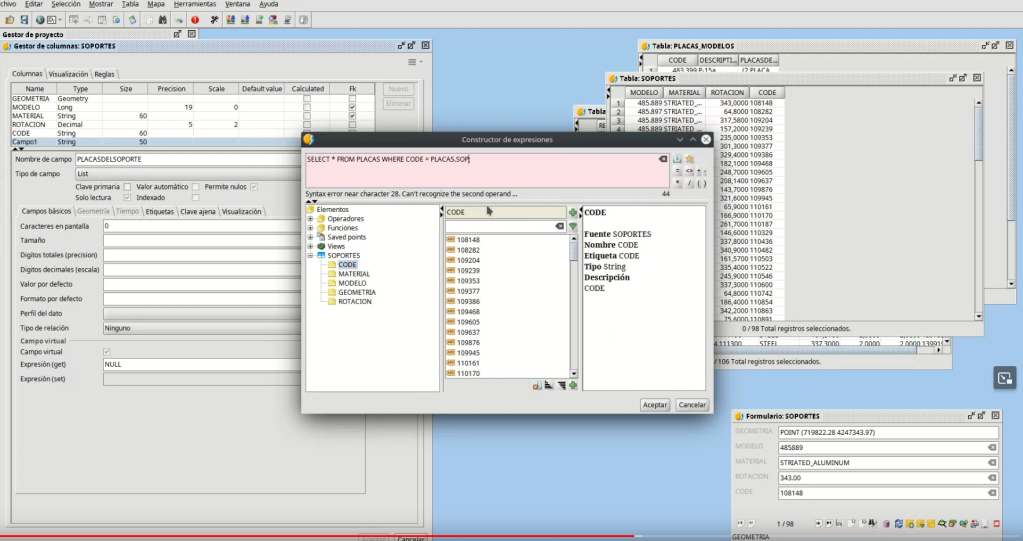
sur gvSIG Team: Geocoder of gvSIG Online. Versatility and power in address searches.
Publié: 26 June 2023, 8:20am CEST

The geocoding plugin of gvSIG Online is a powerful and versatile tool that allows us to search for places and locate them on the map. At the user level, its operation is extremely simple. Once the search string is entered, a list of possible candidates is displayed. At the administration level, the most interesting feature is that we can configure and add as many providers/geocoders as we need.
Of course, the plugin offers functionality for both forward geocoding (locating a place based on a search string) and reverse geocoding (finding the address by marking a position on the map).
From the administration panel, in the list of search providers, you can assign a category (to group the results of that provider under a separator) and assign an icon that will mark each of the suggested locations. Then, depending on the characteristics of each provider, different parameters may be required for them to function. Examples of providers include Nominatim from OpenStreetMap, Google Maps, custom layers such as points of interest or street data, etc.
The plugin has very interesting options, such as configuring and establishing the priority order in which the results obtained from each of the providers used in the searches will be displayed.
And, of course, it is possible to configure custom providers for each territory, as we have done in various projects. Examples include Cartociudad in Spain or the Geocoder of the IDE in Uruguay.
-
sur gvSIG Team: Geocoder de gvSIG Online. Versatilidad y potencia en las búsquedas de direcciones.
Publié: 26 June 2023, 8:14am CEST
El plugin de geocodificación (geocoder) de gvSIG Online es una herramienta potente y versátil que nos permite buscar lugares y ubicarlos en el mapa. A nivel de usuario su funcionamiento es extremadamente simple, una vez introducida la cadena de búsqueda nos aparece un listado con los posibles candidatos. A nivel de administración, lo más interesante, es que podemos configurarlo y agregar tantos proveedores/geocodificadores como necesitemos.
Por supuesto el plugin dispone de funcionalidad tanto de geocodificación directa (la localización de una ubicación mediante una cadena de búsqueda) como geocodificación inversa (averiguar la dirección marcando una posición en el mapa).
Desde la parte de administración, en la lista de proveedores de búsqueda se les puede indicar una categoría (para englobar los resultados de ese proveedor bajo un separador) y se les puede asignar un icono que marcará cada una de las sugerencias propuestas . Luego, según las características de cada uno, se requerirán unos parámetros u otros para que puedan funcionar. Ejemplos de proveedores: Nominatim de OpenStreetMap, Google Maps, capas propias de – por ejemplo – puntos de interés o callejero, etc.
El plugin tiene opciones muy interesantes, como configurar y establecer el orden de prioridad en el que se mostrarán los resultados obtenidos de cada uno de los proveedores utilizados en las búsquedas.
Y, por supuesto, se pueden configurar proveedores propios de cada territorio, como así hemos realizado en diversos proyectos. Ejemplos: Cartociudad en España o el Geocoder de la IDE de Uruguay.


-
sur Where Do Refugees Go?
Publié: 26 June 2023, 8:13am CEST par Keir Clarke
Last year 35.5 million people (equivalent to over half the population of the UK) were forced to flee their homes and find refuge elsewhere. For World Refugee Day Al Jazeera took a closer look at where refugees come from and where they go. Visualizing the Global Flow of 35 Million Refugees is illustrated with two interactive maps: one showing the countries where refugees originated from last year,
-
sur GRASS GIS: GRASS GIS 8.3.0 released
Publié: 24 June 2023, 5:42pm CEST
What’s new in a nutshell The GRASS GIS 8.3.0 release provides more than 360 changes compared to the 8.2 branch. This new minor release brings in many fixes and improvements in GRASS GIS modules and the graphical user interface (GUI) which now has the single window layout by default. Some of the most relevant changes include: support for parallelization in three raster modules, new options added to several temporal modules, and substantial clean-up of g.
-
sur Discovering the Dissolution
Publié: 24 June 2023, 10:51am CEST par Keir Clarke
I live near Abbey Road in East London. The road is named for Langthorne Abbey, which used to be one of the largest Cistercian abbeys in England. At the beginning of the 16th Century the abbey owned most of the land in East London. It also owned a number of local mills and controlled a number of local industries including brewing, shearing, weaving, tannery and farming. Then came the Dissolution
-
sur The 2023 OGC Tiling Interfaces Code Sprint – How it went!
Publié: 23 June 2023, 3:08pm CEST par Simon Chester
On June 12-14, 2023, OGC held its 2023 Tiling Interfaces Code Sprint at OGC Strategic Member NGA’s Moonshot Labs in St. Louis, Missouri. The code sprint focused on a select set of Application Programming Interface (API), database, and encoding standards related to map tiles. An API is a standard set of documented functions that expose the capabilities supported or data offered by an application, or service to other applications.
OGC code sprints are collaborative and inclusive events that support the development and refinement of open standards by providing software developers the time and space to focus on projects that implement the standards.
By experimenting with emerging ideas in the context of geospatial standards, OGC code sprints help improve interoperability of existing standards by experimenting with new extensions or profiles, and building or enhancing software products to implement the standards.
In addition, the sprints’ mentor streams provide developers with a helping hand when learning how to use the standards and projects so that they can build a working understanding of them that will last beyond the duration of the sprint.
The mentor stream at the Tiling Interfaces Code Sprint included three entry-level tutorials that used practical use-cases to introduce participants to the standards. One tutorial focused on how to serve vector tiles using the OGC API – Tiles standard, while another focused on compliance testing, and the third provided an overview of a web-based product that implements several OGC standards.
The 2023 OGC Tiling Interfaces Code Sprint focused on the following Standards and specifications:
- OGC API – Tiles: An approved Standard that specifies building blocks for creating Web APIs that support the retrieval of geospatial information as tiles.
- OGC API – Maps: A candidate Standard that specifies building blocks for serving spatially referenced and dynamically rendered electronic maps and charts.
- Changesets API: A prototype specification based on outcomes from OGC Testbed-15 that provides the foundation for a ‘Transactional Tiles API Extension’ for OGC API – Tiles.
- Vector Tiles Extension to GeoPackage: A prototype extension of the OGC GeoPackage Standard to support the use of vector tiles.
- Variable Width Tile Matrix: A grid suited for the whole globe that keeps the data in a geographic Coordinate Reference System.
- Web Map Tile Service (WMTS): The popular OGC Standard that specifies a web service that can serve map tiles of spatially referenced data using tiled images with predefined content, extent, and resolution. The OGC WMTS Standard is the base standard for the WMTS profiles of the US National System for GEOINT (NSG) and the Defense Geospatial Information Working Group (DGIWG).
At its peak, the code sprint had 50 concurrent active users participating remotely across multiple channels on the code sprint’s online platform. In-person participation saw a dozen participants from NGA, OGC, US Army Geospatial Center, UK Defence Science & Technology Laboratory (Dstl), Universitat Autònoma de Barcelona (CREAF), Pixalytics Ltd., Compass, FlightSafety International, and University of Maryland.
Screenshots of a selection of applications deployed for the code sprint are shown below.
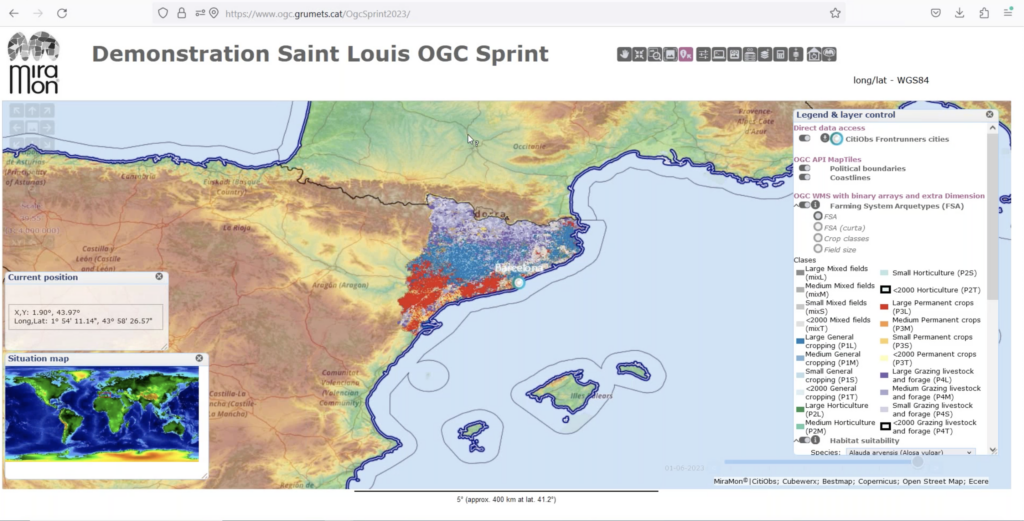 Figure 1 (click to enlarge)
Figure 1 is a screenshot of the MiraMon browser accessing multiple OGC-compliant services and APIs deployed by CREAF and other participants.
 Figure 2 (click to enlarge)
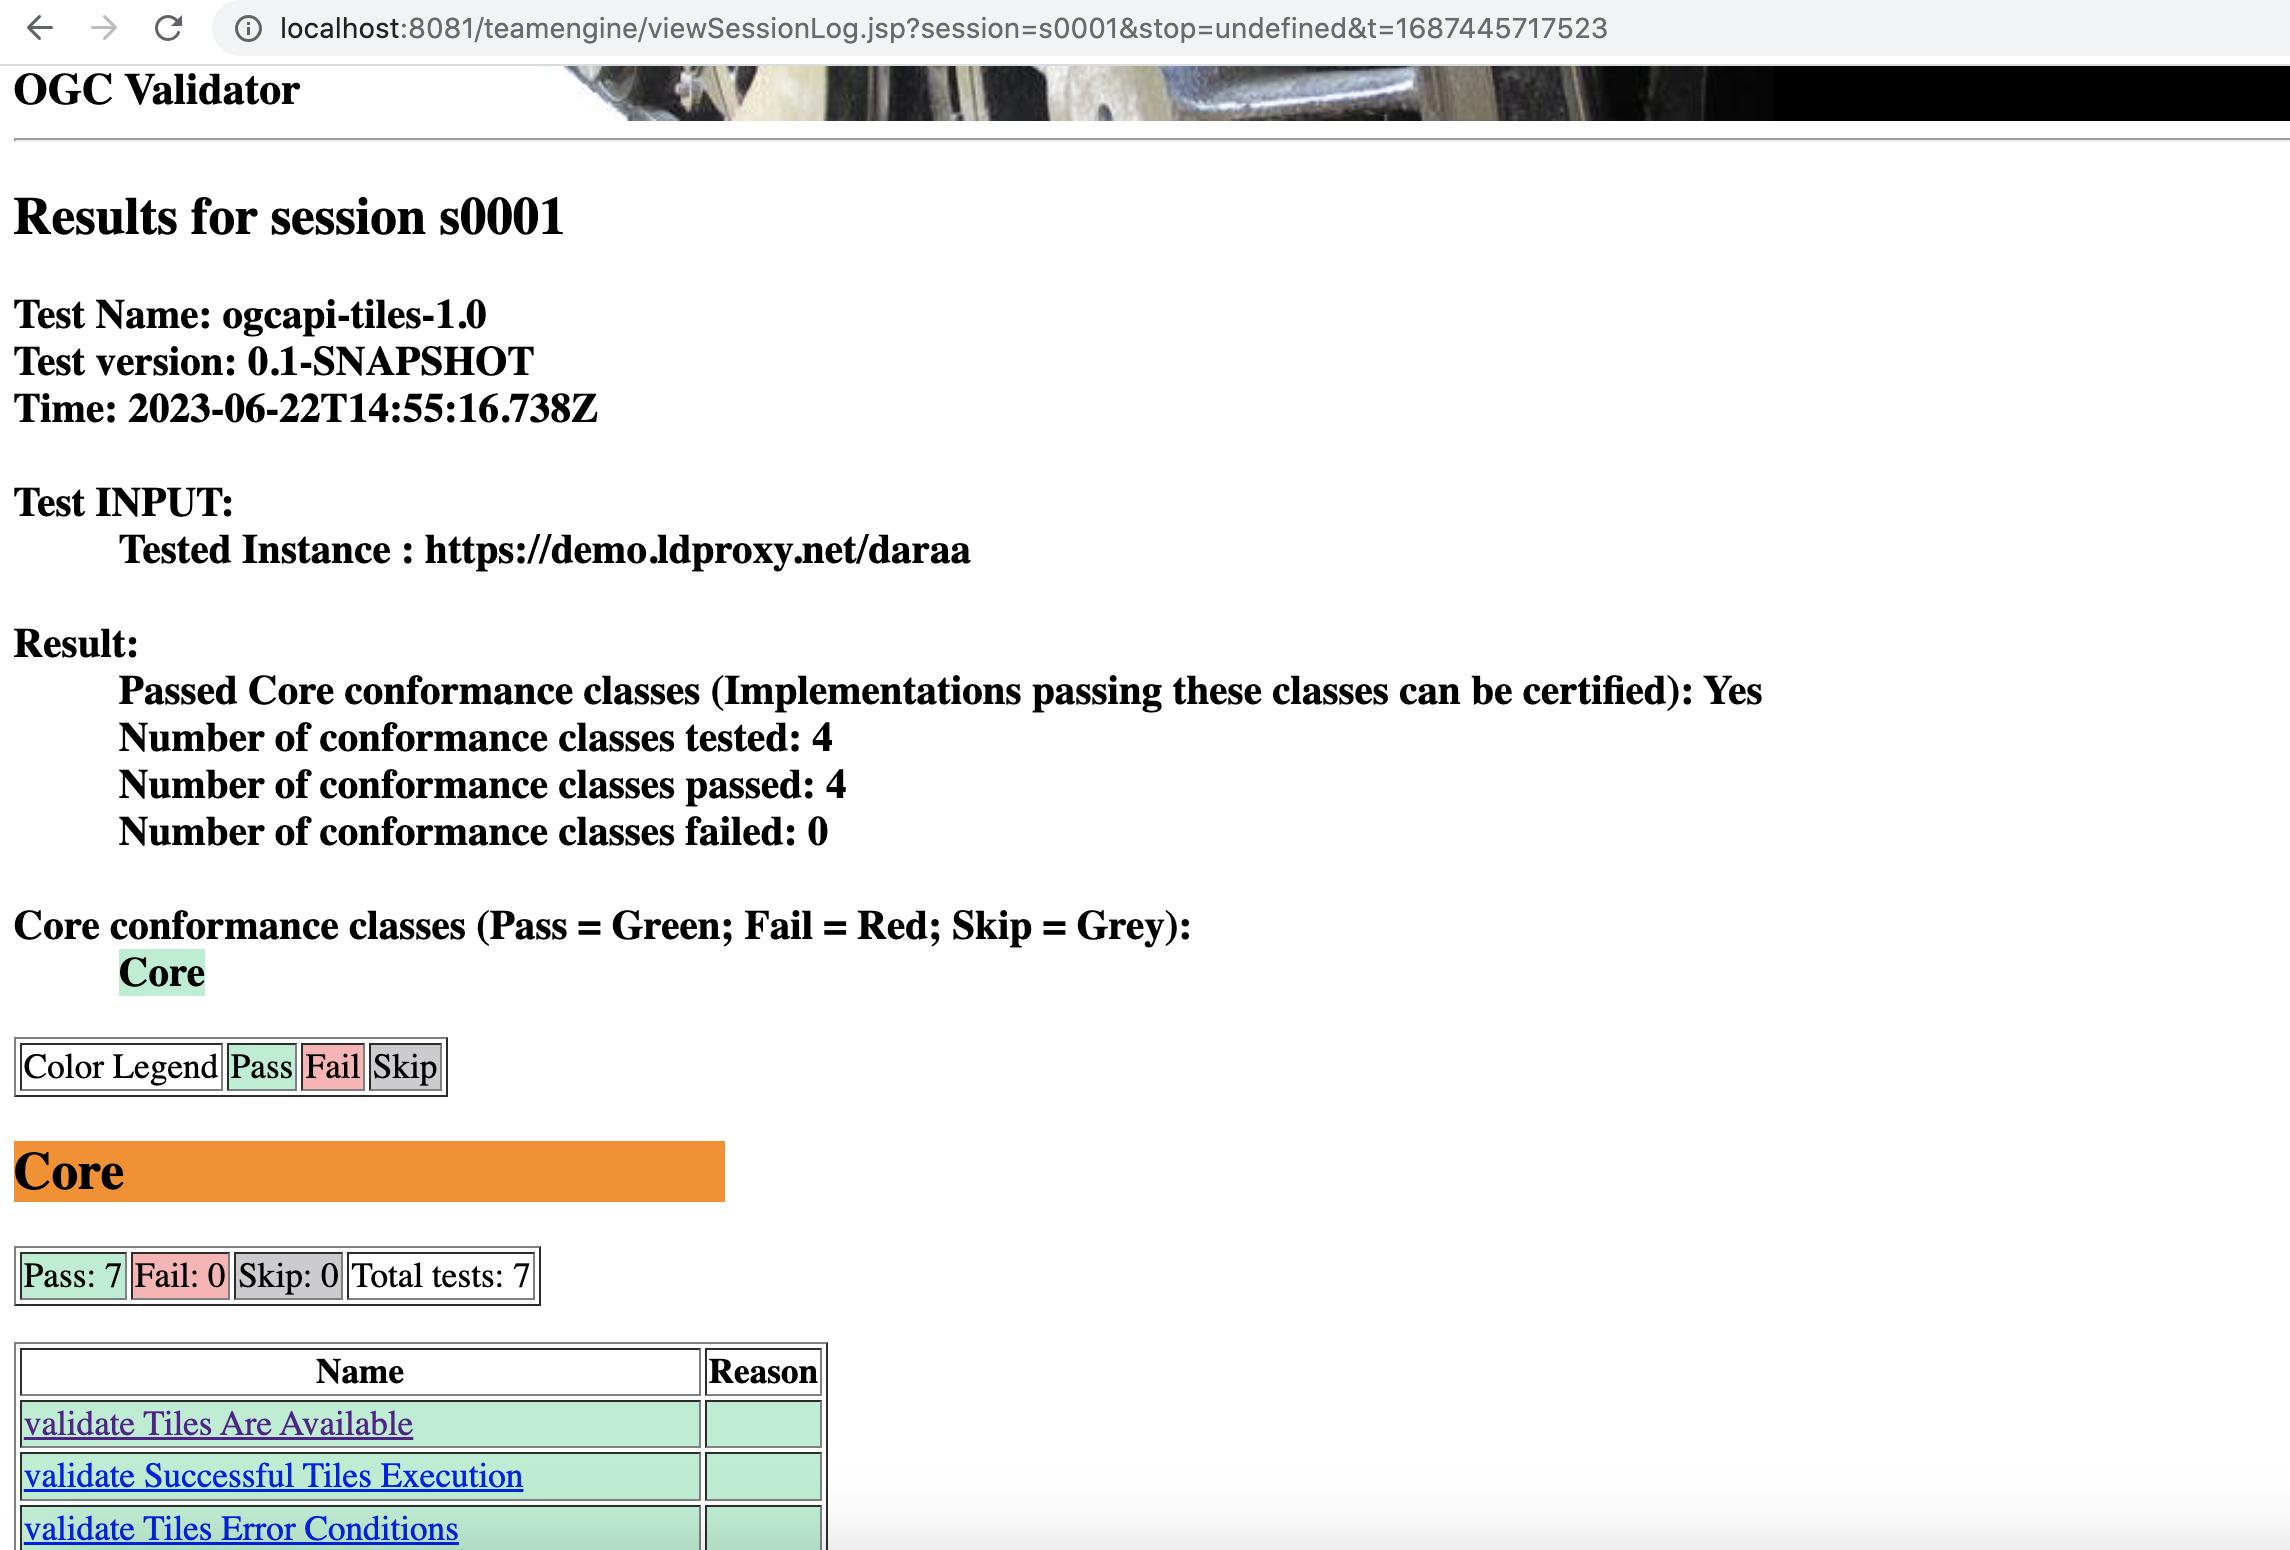
Figure 2 is a screenshot of TEAM Engine, the open source software used by the OGC Validator, presenting test results for a specific implementation of OGC API – Tiles.
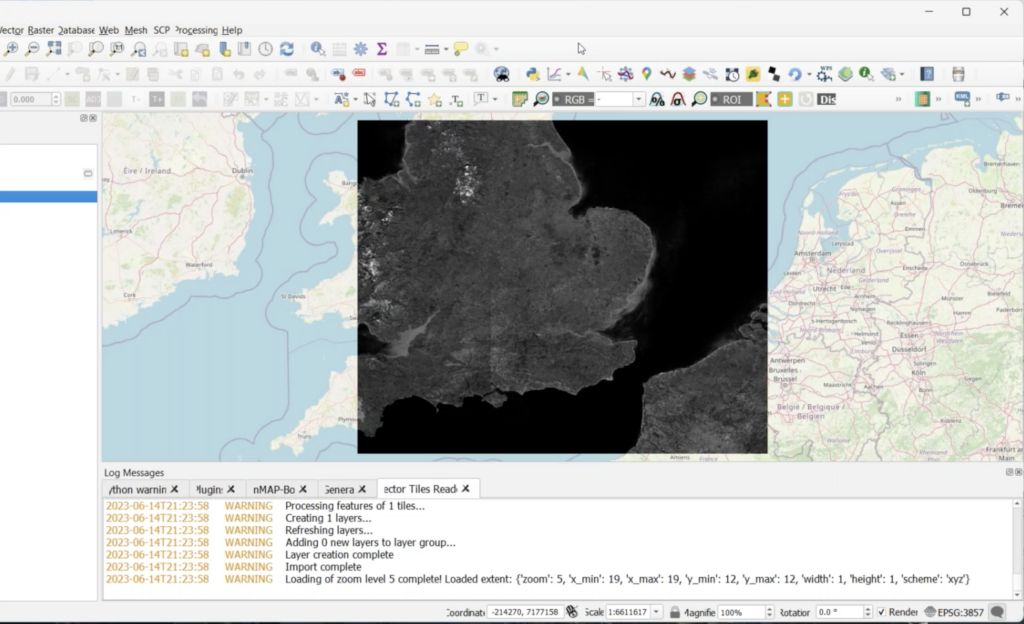 Figure 3 (click to enlarge)
Figure 3 is a screenshot of the open source QGIS Desktop GIS with GDAL embedded to enable import and display of map tiles and vector tiles.
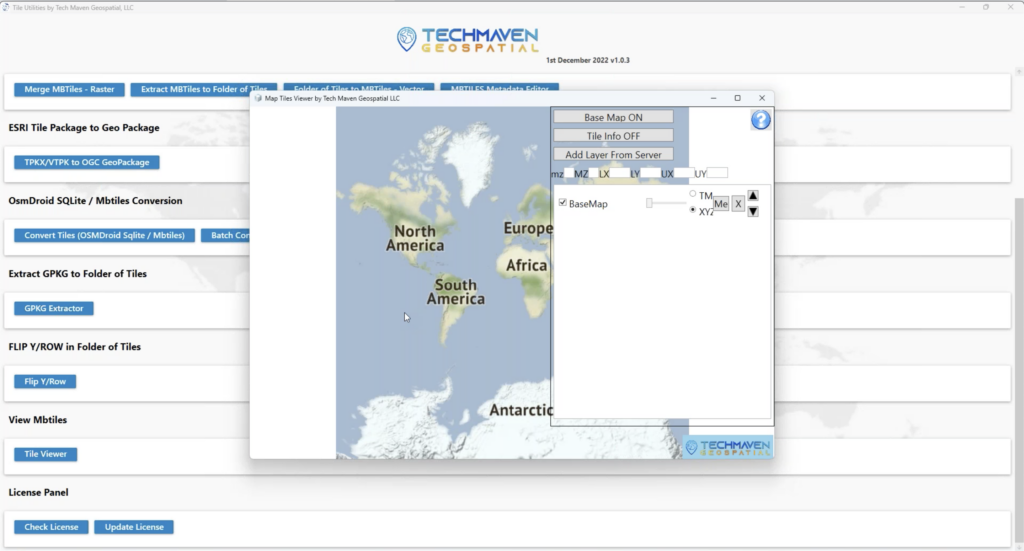 Figure 4 (click to enlarge)
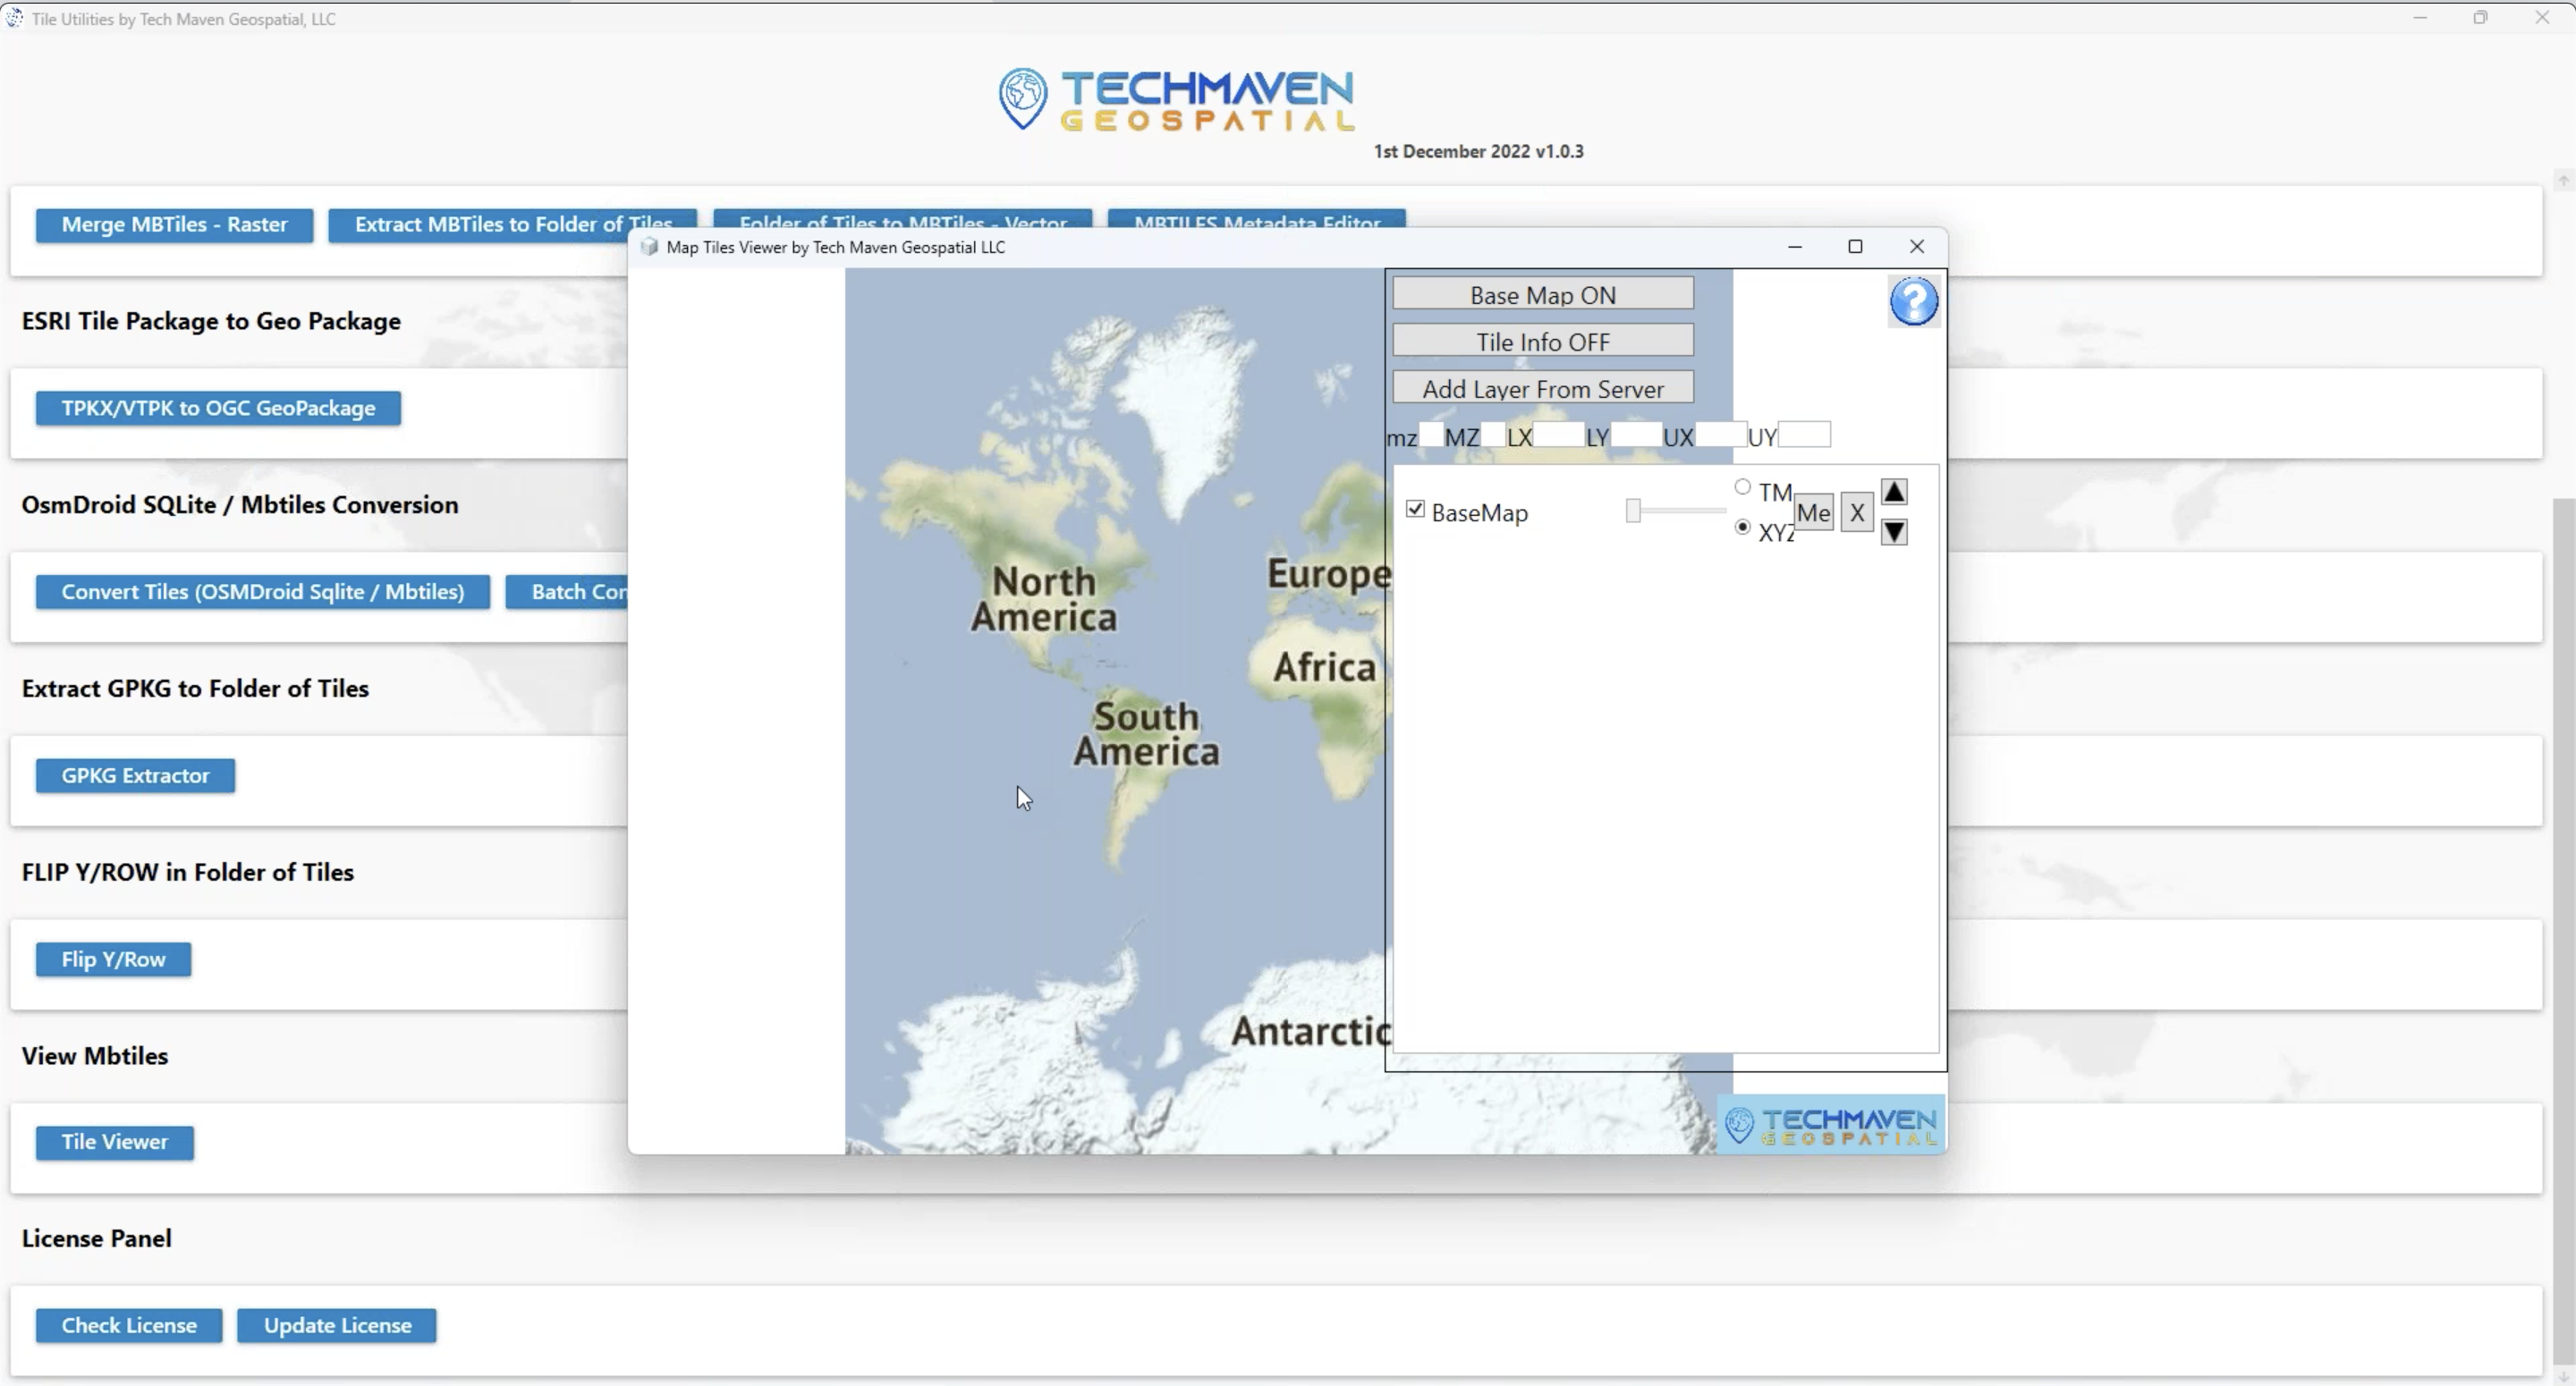
Figure 4 is a Map Tiles viewer by Tech Maven Geospatial.
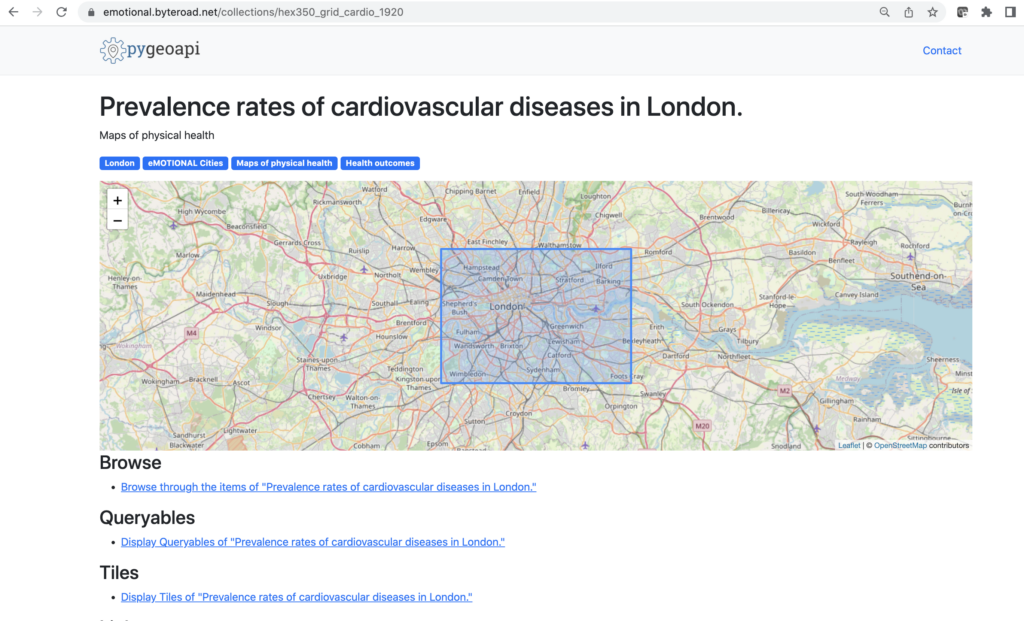 Figure 5 (click to enlarge)
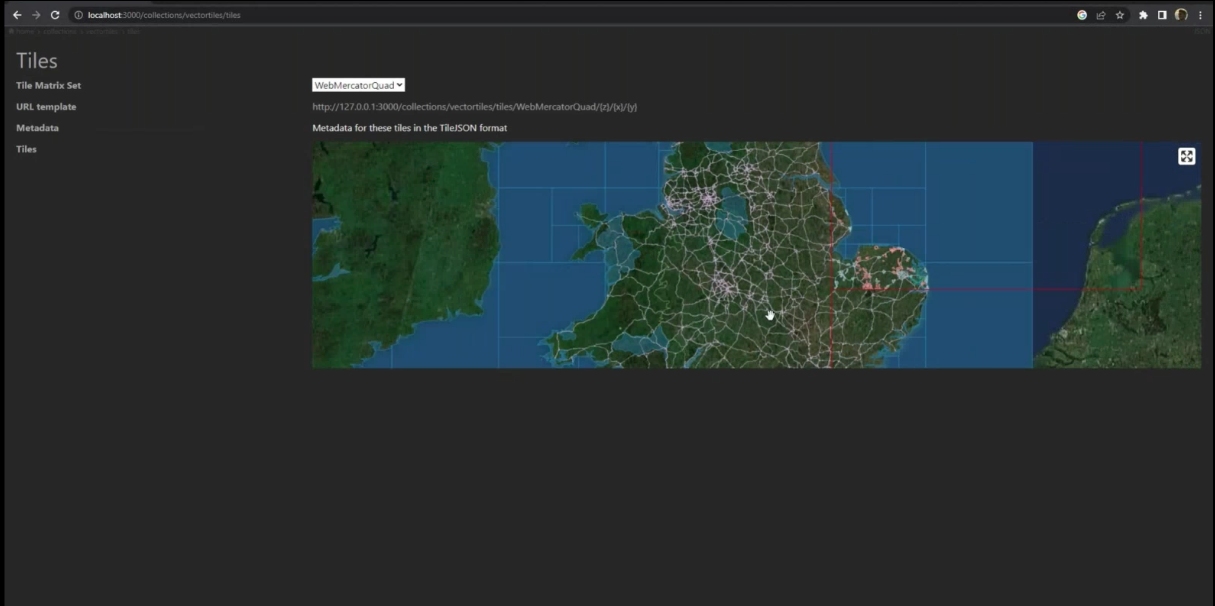
Figure 5 is a screenshot of the pygeoapi application enabled to support OGC API – Tiles.
 Figure 6 (click to enlarge)
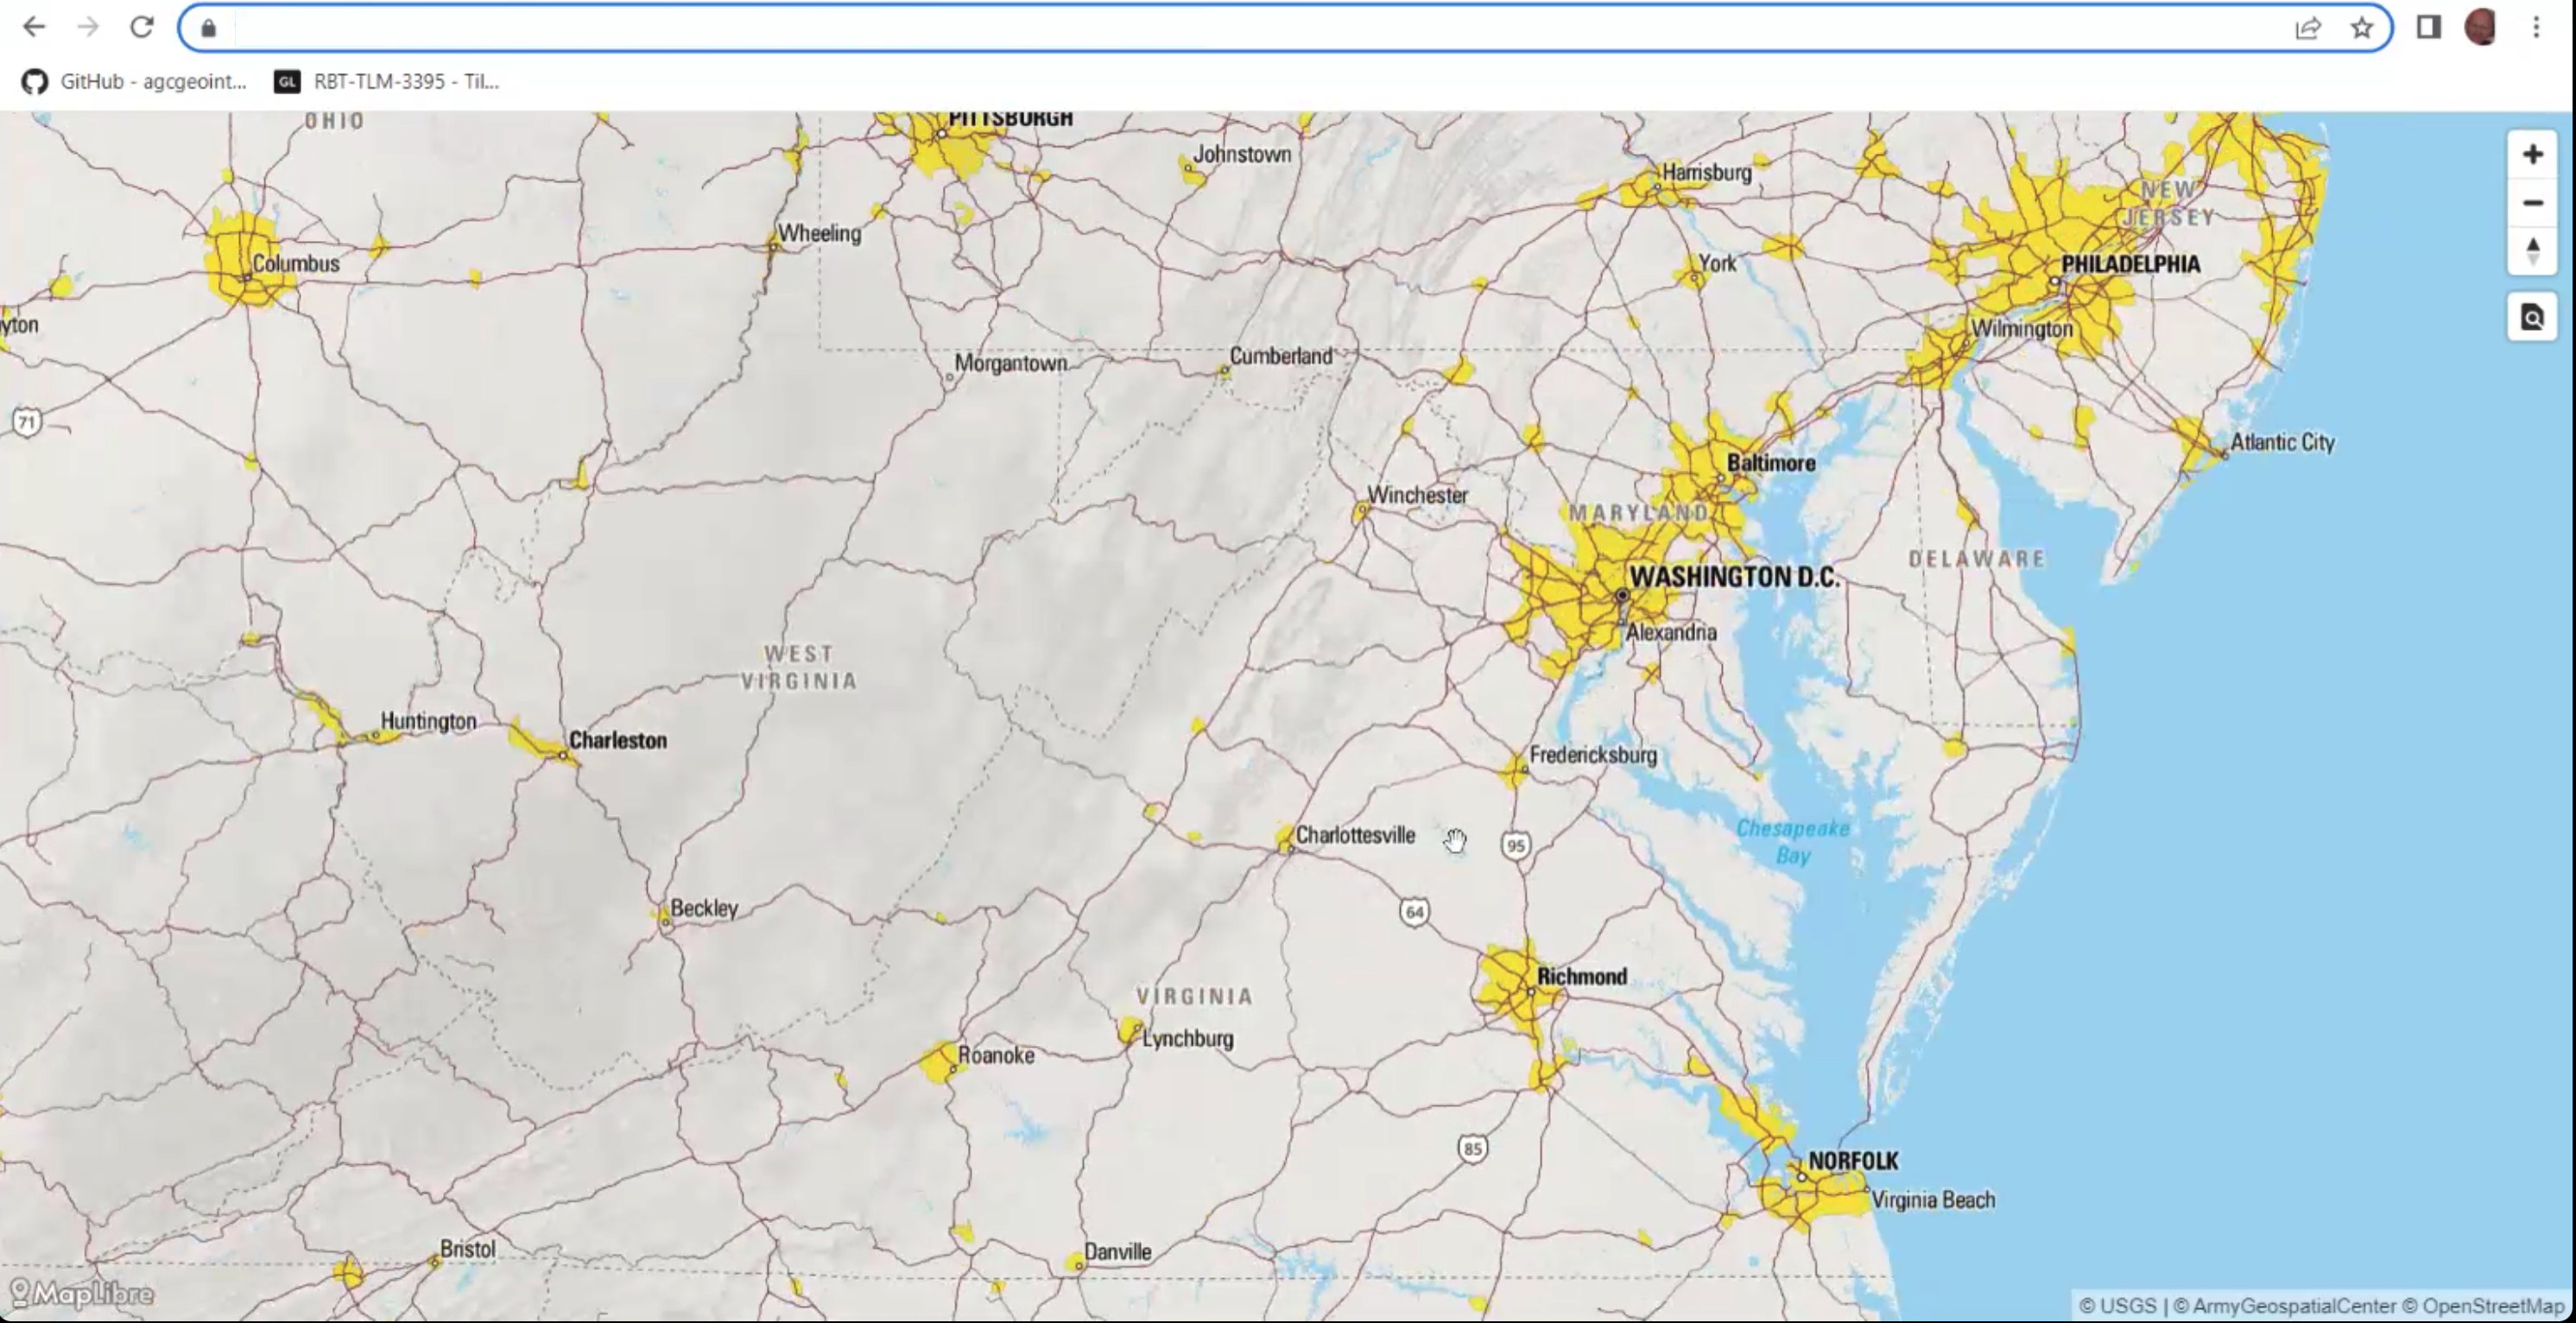
During the code sprint, personnel from the US Army Geospatial Center (AGC) presented the Releasable Basemap Tiles (RBT) product which has been in development at AGC (Figure 6). The presentation enabled participants to identify an approach for how QGIS and GDAL could support workflows that involve the downloading of vector tiles and map tiles from an OGC API and the storage of the tiles in a GeoPackage.
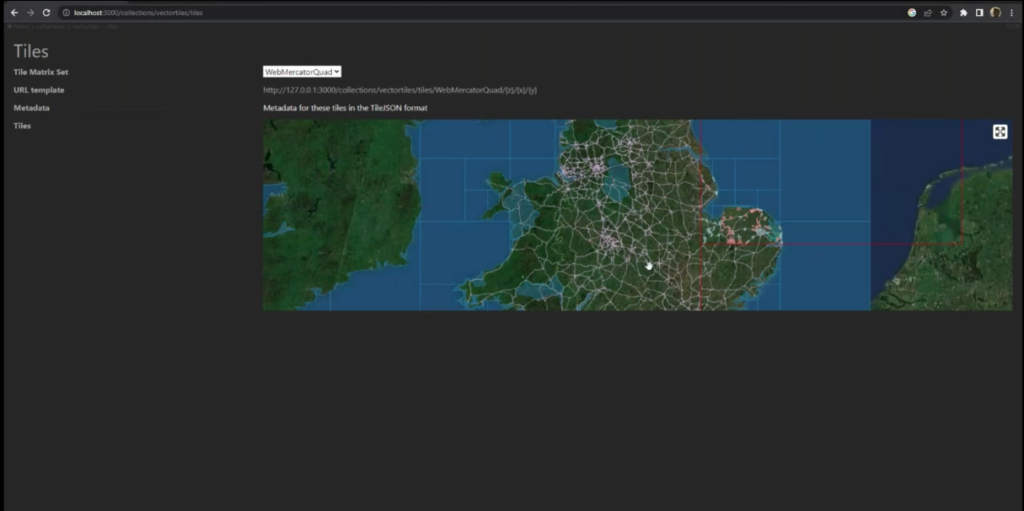 Figure 7 (click to enlarge)
Contains OS data © Crown copyright and database right 2023.Figure 7 shows a map created by KORTxyz from the vector tiles distribution of the Ordnance Survey Zoomstack product and accessed through an OGC API – Tiles interface.
What did we learn?The following are some of the lessons learned during the code sprint, and recorded by participants on the final day of the code sprint.
There is a need for further developer guidance documents for implementing OGC API – Tiles, particularly with regard to the placement on tileset resources. Such guidance should include clarification on the handling of relation types such as ‘conformance’ that can be represented as simple string literals and also as URLs.
There is a need to make sure there exists a well-documented user journey for people that want to use OGC API – Tiles through QGIS. For example, documentation to take a beginner from their first line of code to a more advanced stage.
Although some work has been done on vector tiles within OGC, more work is needed to advance the specification towards becoming an OGC Standard. Some of the work that could be carried out includes, for example, development of a Best Practice document. RBT could provide a foundation for such a Best Practice.
For future code sprints, it may be necessary to introduce participants to the basics of the specifications that are in focus for the code sprint ahead of the event. Further, it would be helpful to participants such as students to have specific instructions to help participants prepare for the code sprint.
Conclusions and RecommendationsThe code sprint met all of its objectives and achieved its goal of supporting the implementation of open geospatial standards within the developer community. Furthermore, the code sprint provided an environment for development and testing of prototype implementations of open standards and a starting point for developers to learn about the draft and approved standards, as well as their implementations.
The participants identified the following recommendations at the conclusion of the code sprint:
- A future code sprint that includes the OGC CDB Standard should examine how vector tiles could be embedded in such a data store.
- AGC is interested in how the World Mercator coordinate reference system (reference EPSG:3395) could support vector tiles in a GeoPackage. The question for future experimentation is whether this could be specified so that it can be implemented by any developer.
- The application of OGC API – Tiles in partitioning and indexing content from an implementation of the OGC SensorThings API standard and the OGC API – Connected Systems candidate standard could be explored in a future code sprint.
- An initiative to develop content for the OGC e-learning resource and the OGC Compliance Program could help improve interoperability between implementations of OGC Standards.
- Although OGC API – Tiles is an approved standard, there is some work to do around addressing interoperability issues in the different implementations (see for instance this Issue on the OSGeo gdal GitHub.
To learn more about – and participate in – future OGC Code Sprints, visit the OGC Code Sprints webpage or sign up to the OGC Events Newsletter.
The post The 2023 OGC Tiling Interfaces Code Sprint – How it went! appeared first on Open Geospatial Consortium.


-
sur OTB Team: OTB release 8.1.2
Publié: 23 June 2023, 2:55pm CEST
Dear OTB community, We are happy to announce that OTB version 8.1.2 has been released! Ready to use binary packages are available on the package page of the website: You can also use the official docker image It is also possible to checkout the branch with git: git clone [https:] OTB -b release-8.1 The documentation […]
-
sur The Solar Eclipse Simulator
Publié: 23 June 2023, 10:18am CEST par Keir Clarke
Next year on April 8 2024 there will be total solar eclipse in the United States. The path of totality will cross Mexico, the United States, and Canada, and will be about 115 miles wide. If you are within the path of totality, you will see the Sun completely blocked out by the Moon for about two minutes. If you want to preview what the solar eclipse might look like for different locations then
-
sur gvSIG Team: Inventario de empresas y vertidos en áreas industriales con gvSIG Online
Publié: 23 June 2023, 7:57am CEST

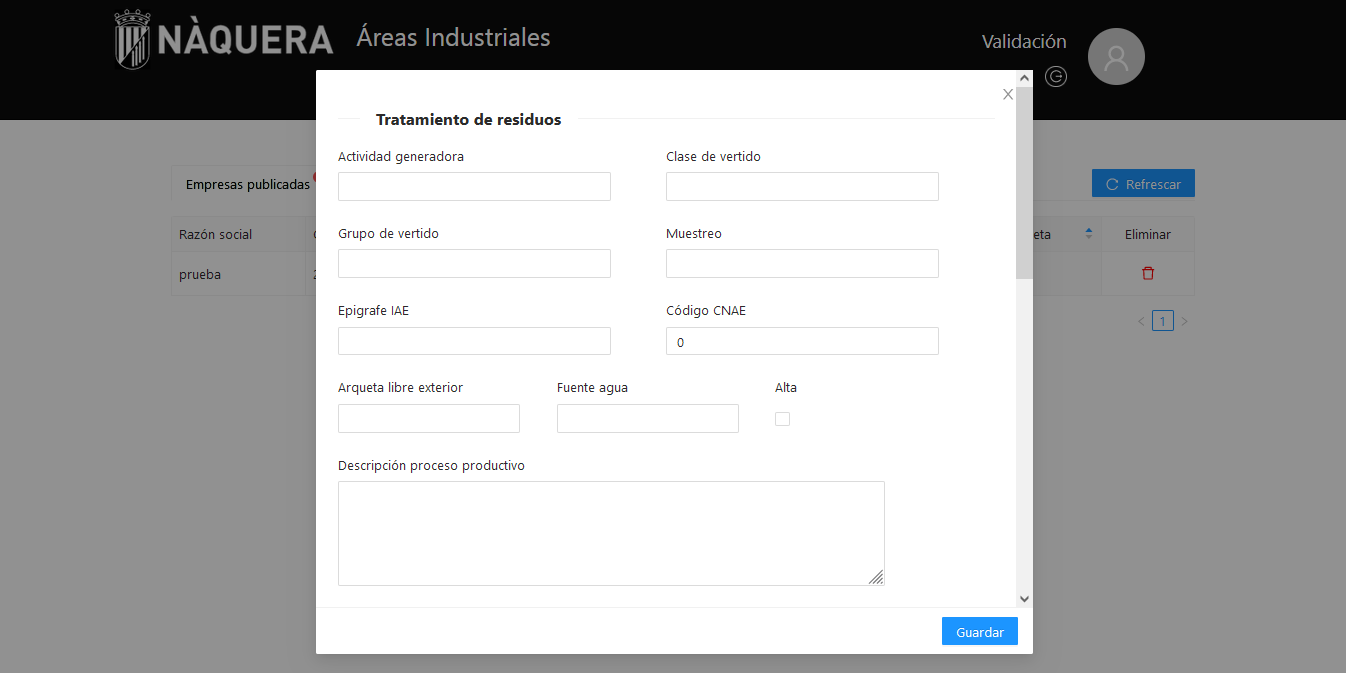
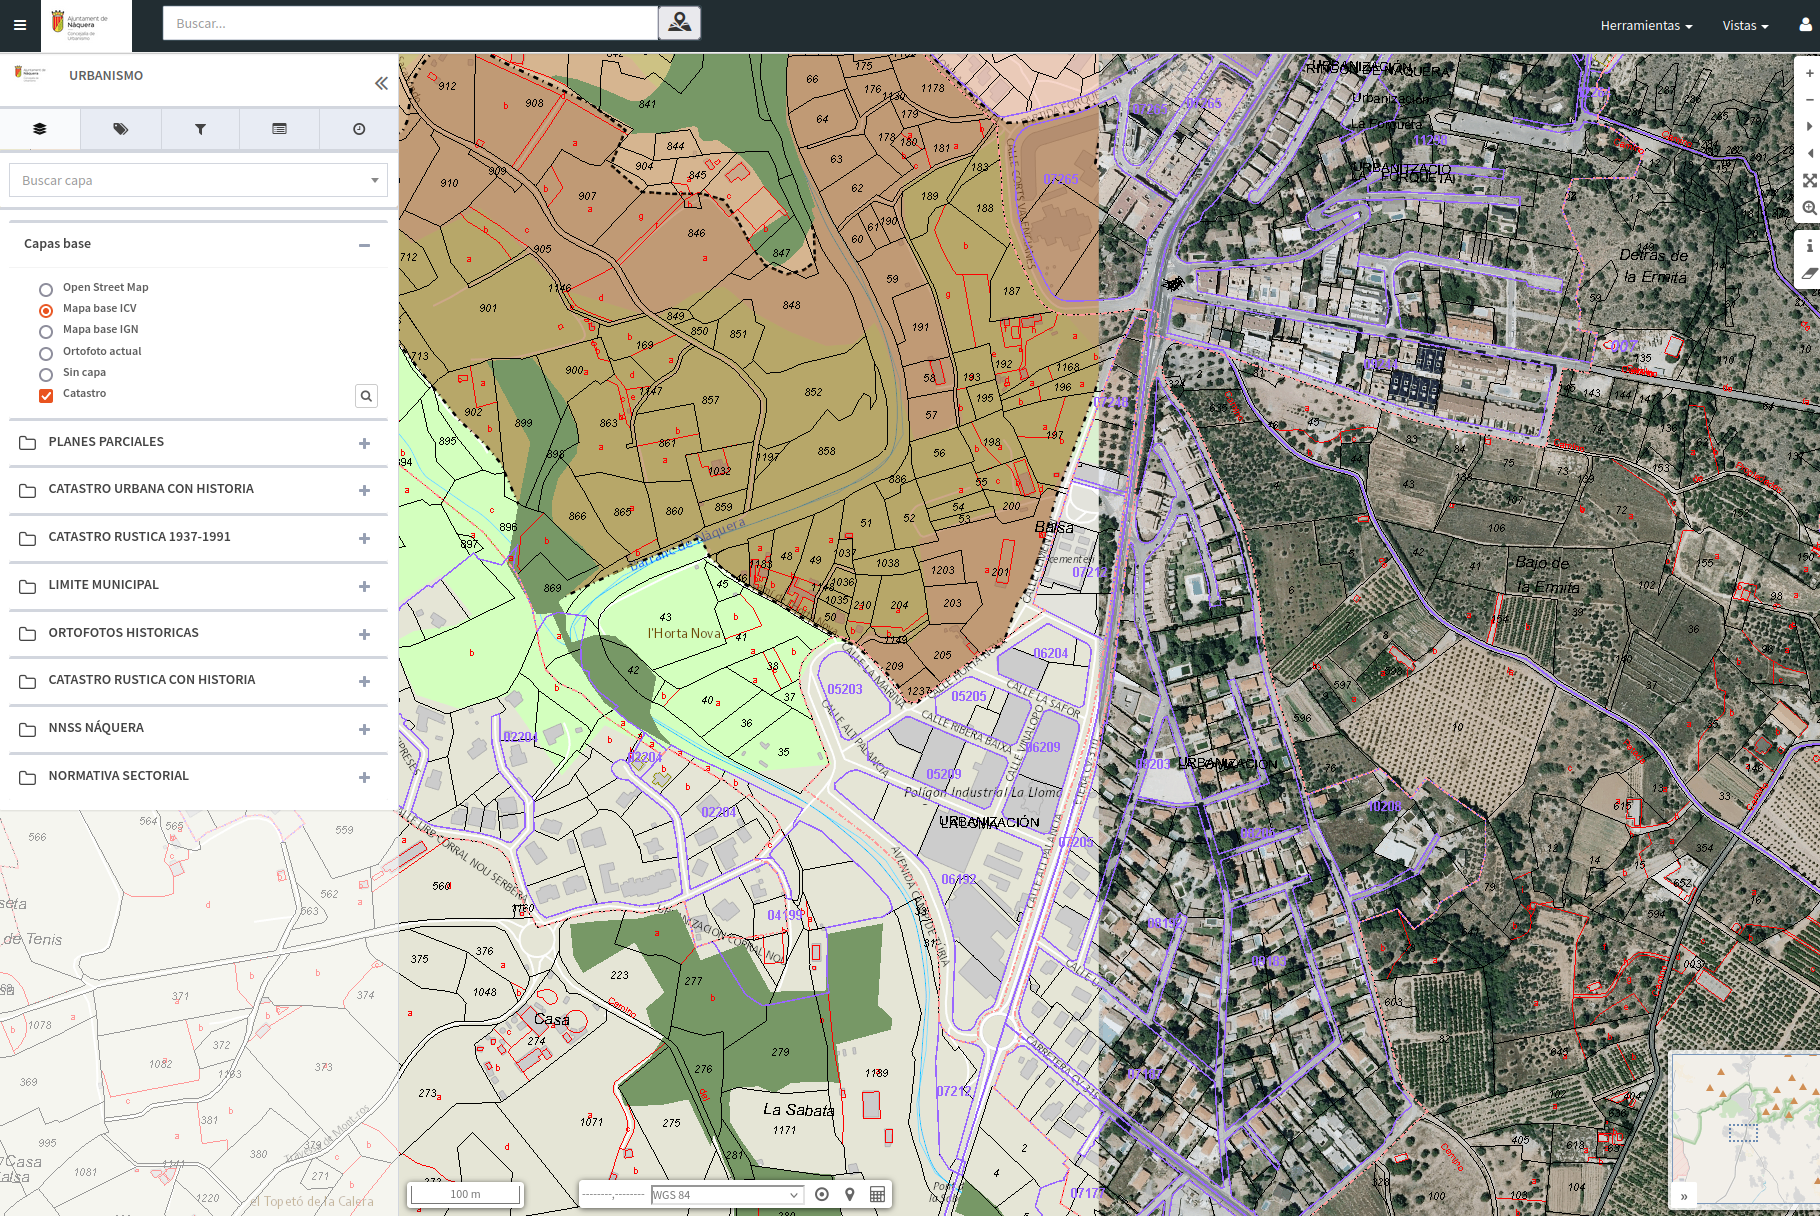
Para el Ayuntamiento de Náquera se ha desarrollado un conjunto de herramientas, integradas con gvSIG Online con el objetivo de llevar a cabo la creación y gestión del inventario georreferenciado de las empresas ubicadas en las áreas industriales del municipio.
La herramienta web sirve para la captación de información de empresas (sector de actividad, volumen de negocio, número de empleados, características de los residuos, tomas de agua, salidas de emergencias…) situadas en los polígonos industriales y para su integración en un visor de mapas de gvSIG Online con la geolocalización de dichas empresas.
Parte de la información es introducida por las propias empresas mediante diversas herramientas desarrolladas con este objetivo. Por otro lado, el sistema dispone de opciones de validación de la información para los técnicos municipales. Además, la solución desarrollada también posee funcionalidad para gestionar el registro de empresas, de forma que puedan acceder al sistema y modificar sus datos.
Después de la introducción de los datos y validación por parte del Ayuntamiento la herramienta genera una capa que permite consultar las fichas de empresas registradas en la herramienta web desde el geoportal de áreas industriales de Nàquera. Al pulsar en el mapa, se muestra la información básica de la empresa, teniendo la opción de consultar la ficha completa de cada una de las empresas.
Por otro lado, la herramienta permite consultar los diferentes sectores de empresas por actividad, activando o no la visibilidad de cada sector, de todos los sectores o de aquellos que se seleccionen.
Del mismo modo que se rellenan los datos de la ficha de empresa, existe la opción de rellenar la información correspondiente a una ficha de control de vertidos. Estas fichas de control de vertidos pueden ser consultadas desde el geoportal de áreas industriales, siempre con acceso restringido. Cada empresa está asignada a Estaciones de Muestreo, de forma que cuando se detecta una incidencia en una estación de muestreo se pueden listar todas las empresas vinculadas a dicha estación de muestreo.
Un ejemplo más de como gvSIG Online se ha convertido en una solución idónea para gestionar la información de un municipio, en este caso de sus áreas industriales.


-
sur OGC proud to create European Innovation Events and Open Knowledge
Publié: 22 June 2023, 3:00pm CEST par Simon Chester
The Open Geospatial Consortium (OGC) is proud to co-organize and sponsor upcoming European Innovation Events such as Data Week Leipzig 2023. The Location Innovation Academy continues to grow and support Open Knowledge.
Data Week Leipzig 2023 will run next week, June 26-30, 2023, in Leipzig, Germany, and online. OGC will present its new OGC European Innovation Days event and more at the event. Data Week Leipzig is an innovative networking and exchange event that highlights scientific, economic, and social perspectives of data and its use, and where industry, citizens, science, and public authorities can enter into dialogue. Special topics of Data Week Leipzig 2023 are Semantic Interoperability, the European Green Deal, NetZero Cities, sustainable, resilient development, and the Location Innovation Academy (see below). Digital strategies will be presented and discussed from the European to the local Leipzig City level. The event will be streamed to viewers worldwide.
Findings of the AD4GD (All Data for Green Deal) and GeoE3 Projects will be included in the topics of Monday’s European Innovation Day at Data Week. Several sessions on Data Spaces, Digital Twins, and Urban Planning will be held across Monday and Tuesday, while Wednesday will offer several workshops on Semantic Interoperability and the new “OGC Rainbow” environment – which represents the state-of-the-art in enabling semantic interoperability.
The Growing Location Innovation Academy
Starting as a hub for the distribution of knowledge and skills related to the publication and use of location-based information, the Location Innovation Academy is expanding its horizons and finding a larger audience, with a view to provide the foundation for the future OGC Academy. The Academy was presented during last week’s Open Data & Open Knowledge Workshop, hosted by GEO. The workshop emphasized the importance of open knowledge and open academies that provide not just information but also grow students’ ability to correctly interpret the available information to support better and more informed decision-making.Don’t miss the hybrid hands-on session providing detailed insights about the Location Innovation Academy during the European Innovation Days at Data Week Leipzig 23 on Tuesday June 27 @ 17:00 CEST.
 Learn more at academy.ogc.org
GeoE3 recently published a blog post entitled “Interested in new technologies of data services?” that outlines the free Data Service Management course offered by the Location Innovation Academy. The course teaches students everything they need to know about OGC API standards and how they can be implemented to manage geospatial data services more efficiently. This course and others offered by the Academy address the need, identified during GeoE3, to lower the barrier of entry for new users of APIs.
More information on the academy and the courses offered is available on GeoE3’s Location Innovation Academy information page. The Location Innovation Academy is hosted by OGC at academy.ogc.org.
For information and registration for the European Innovation Days, including the Semantic Interoperability and Location Innovation Academy sessions, see the Data Week Leipzig 23 website. For other events see the GeoE3 events and OGC events webpages.
The post OGC proud to create European Innovation Events and Open Knowledge appeared first on Open Geospatial Consortium.
-
sur GeoSolutions: Information about latest alleged GeoServer security vulnerabilities
Publié: 22 June 2023, 11:54am CEST
You must be logged into the site to view this content.
-
sur A Year of Wildfires
Publié: 22 June 2023, 10:20am CEST par Keir Clarke
NASA has released an animated map which shows the locations of active fires around the world over the last one and half years. The map Active Fires As Observed by VIIRS, 2022-Present uses observations from the Visible Infrared Imaging Radiometer Suite (VIIRS) to show the locations of active fires on Earth for every day from Jan 5th 2022 to 21st June 2023. VIIRS uses instruments on
-
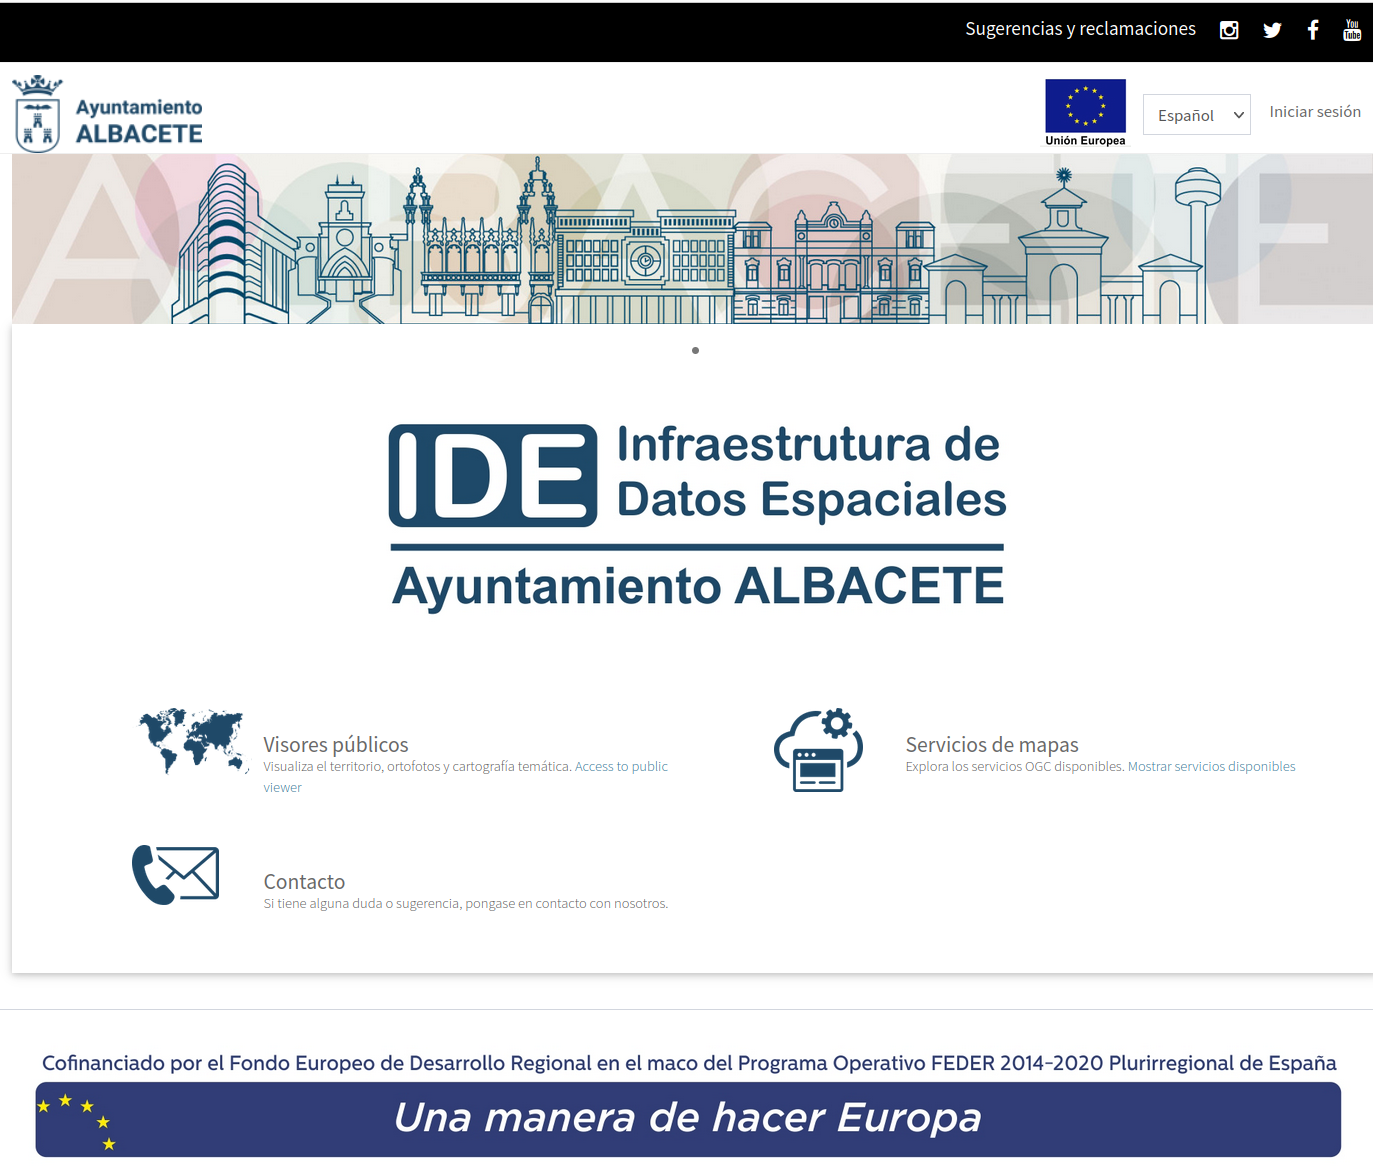
sur gvSIG Team: Infraestructura de Datos Espaciales de Albacete. La Suite gvSIG como solución a la gestión integral de la información geográfica municipal
Publié: 22 June 2023, 8:08am CEST

El proyecto de implantación de la IDE de Albacete merece más de un post, por su ambición y resultados. De momento comenzamos compartiendo una presentación del alcance y trabajo desarrollado para convertir la Suite gvSIG en la solución a la gestión integral de la información geográfica municipal.
Algunos apuntes antes de dejaros con la presentación… se ha utilizado el control de versiones de gvSIG Desktop para las actividades de edición multiusuario de la información cartográfica, se ha incorporado gvSIG Mapps como herramienta de toma de datos en campo integrada con gvSIG Online, se ha realizado la integración con el gestor de expedientes SEGEX de SEDIPUALBA, se ha desarrollado una herramienta de localización y ruteo para el cementerio municipal, plantillas varias para impresión, integración con el padrón – ahora georreferenciado -, adaptación a RT de Inspire, un completo y versátil geocoder, acceso a Catastro con datos protegidos a nivel interno,…
El proyecto de implantación de la IDE de Albacete es un ejemplo para cualquier administración local que quiera poner en marcha una solución similar. Un ejemplo, también, de por qué la tecnología gvSIG se ha convertido en un referente en el sector de la geomática.
Podéis acceder al portal de la IDE de Albacete aquí: [https:]]
Presentación del proyecto:
-
sur gvSIG Team: Implantación de la Infraestructura de Datos Espaciales de Alzira. Proyectos en gvSIG Online
Publié: 21 June 2023, 8:01am CEST
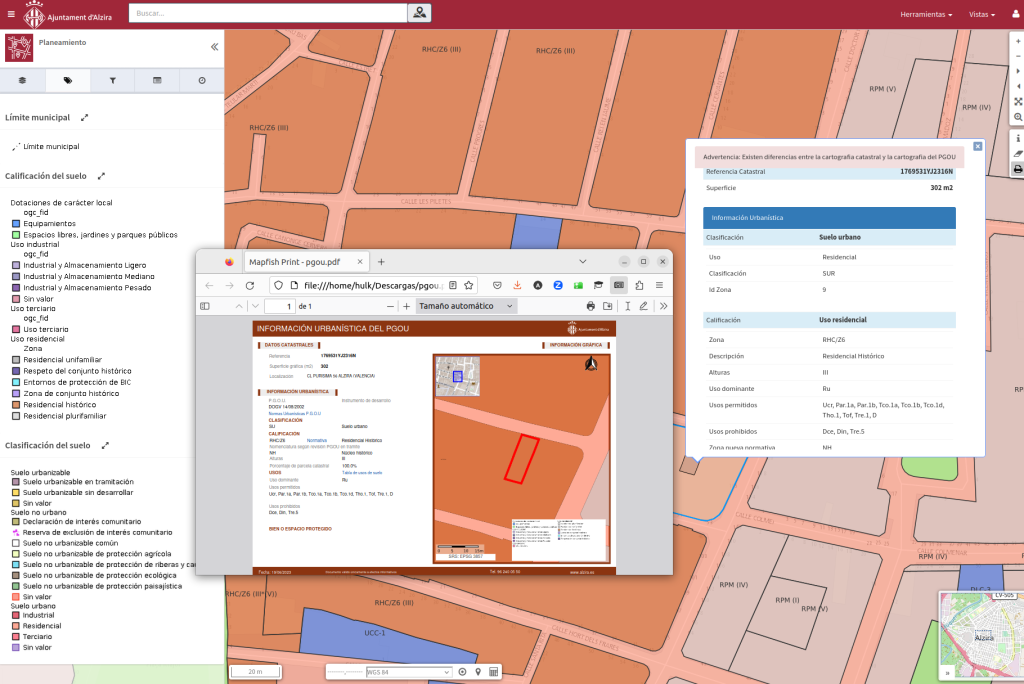
El Ayuntamiento de Alzira es otra más de la administraciones locales que ha apostado por la Suite gvSIG como la tecnología base para poner en marcha su Infraestructura de Datos Espaciales. Un proyecto que, más allá de todos los visores de mapas internos, en poco tiempo ha permitido publicar diversos geoportales como los de planeamiento, infraestructuras, plan local de quemas, etc.
Es interesante reseñar que además de la propia IDE montada con gvSIG Online, se ha integrado gvSIG Mapps para la toma de datos en campo y el gestor de expedientes de Indenova. Entre los desarrollos a medida, destaca el proceso que permite generar de forma automática la cédula urbanística.
Podéis acceder a los distintos visores públicos aquí: [https:]]
Presentación del proyectos:
-
sur GeoSolutions: GeoNode 4.1.0 is out!
Publié: 20 June 2023, 1:04pm CEST
You must be logged into the site to view this content.

-
sur The Kessler Syndrome
Publié: 20 June 2023, 10:07am CEST par Keir Clarke
Steve Wozniak and a host of other Silicon Valley luminaries have launched a new company called Privateer, whose mission is to track and map space debris in Earth's orbit. In 1978 NASA scientist Donald J. Kessler published a paper which argued that if the number of satellites in Low Earth Orbit reached a certain critical level, then even a small collision could create enough debris to cause a
-
sur gvSIG Team: Infraestructura de Datos Espaciales de Náquera con gvSIG Online
Publié: 20 June 2023, 7:50am CEST

Compartimos la presentación de la IDE del Ayuntamiento de Náquera, administración local de una población de 7.500 habitantes ubicada en el Parque Natural de la Sierra de Calderona y que multiplica su población en temporada estival. Pese a ser una administración local pequeña dispone de una gran cantidad y variedad de información geográfica que necesita gestionar.
La implementación de una IDE con gvSIG Online les ha permitido cambiar una situación de partida con información no catalogada, no compartida, duplicada, con dificultad para actualizar… por un sistema interoperable, organizado, estandarizado que facilita tanto la gestión interno como aporta un nuevo mecanismo para transmitir la información a los ciudadanos y visitantes del municipio.
-
sur iCarto Blog: Creating a Shareable QGIS Project with PostgreSQL/PostGIS Connections
Publié: 19 June 2023, 5:41pm CEST
One of the numerous features offered by QGIS is the ability to save our projects. We can store all the specific configurations, layers, styles, analyses, and other aspects in a file, allowing us to return to that point at any time. This is particularly useful when dealing with complex project organization. This functionality is also very helpful for collaborative work, as we can exchange projects with other team members.
However, when creating a project for sharing, certain aspects need to be taken into account, such as including connections to a database. In this article, we will discuss some interesting key points for accomplishing this.
Database Connections in QGIS Projects: The Recommended ApproachMost of the time, when creating a QGIS project with PostgreSQL/PostGIS layers, the data connection details are directly written, including storing the password in plain text within the project.
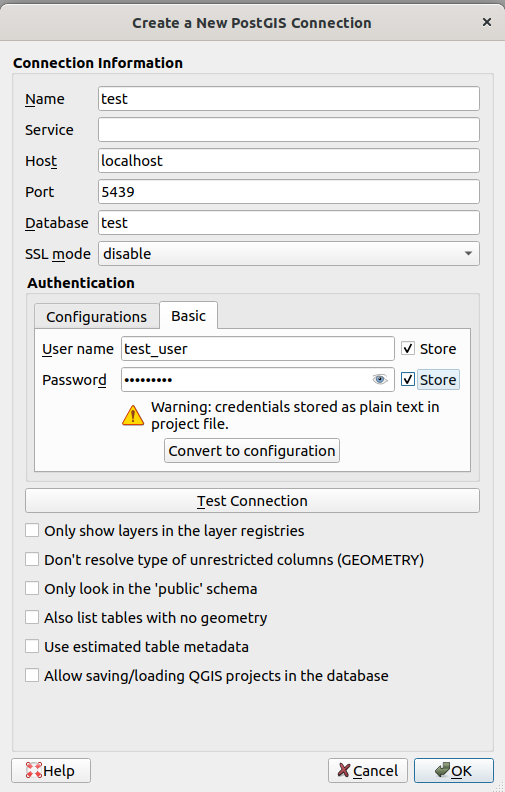
When done this way, within the project file created by QGIS with .qgz/.qgs extension, there will be a line like this:
<datasource>dbname='test' host=localhost port=5439 user='test_user' password='test_user' sslmode=disable key='id' srid=4326 type=Point checkPrimaryKeyUnicity='0' table="public"."cities" (geom)</datasource>This approach creates several problems when it comes to deploying the project or sharing it with others:
- Usernames and passwords need to be shared among several people, making it impossible to establish logical individual or group permissions.
- If we don’t hardcode the username and password, every person using the project will have to enter the data each time.
- Passwords are stored in plain text.
- If the server needs to be changed, for example, from a testing environment to a production one, the project needs to be modified.
- …
Although there are some ways to improve this situation, such as using
.pgpass, using the Authentication Manager, or using custom embedded scripts within the project, they are not the best options and have issues.The best approach, or at least the one we can recommend based on our experience, is to associate the connection details with an identifier (a pre-agreed name) and establish the connection in QGIS using the same identifier.
PostgreSQL allows achieving this through the Connection Service File. It is a text file located in Linux at
~/.pg_service.confand in Windows at%APPDATA%\postgresql\.pg_service.conf, and it would look like this:[test] host=localhost port=5439 dbname=test user=test_user password=test_user sslmode=disable # Avoid hardcode the password in prod [production] host=my.production.server port=5432 dbname=my_project user=my_userIn QGIS, the connection would be established like this:
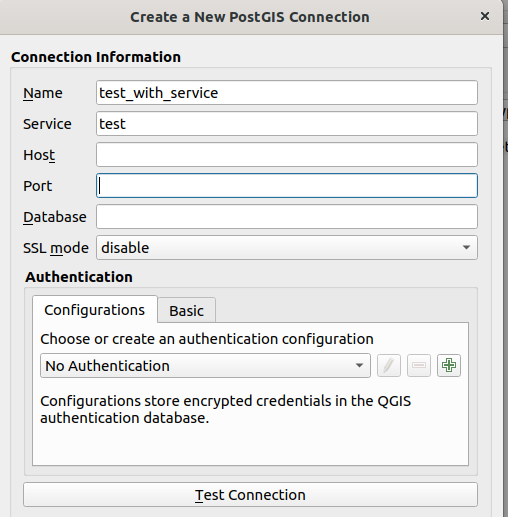
Here, you only need to fill in the connection name and the service name, which will be our identifier (the text within the brackets) in the
.pg_service.conffile. This is explained in more detail in the QGIS documentation.The advantages of using connections with an identifier are clear and solve the aforementioned problems. One person can prepare the project locally, and then, when moving to production, they only need to send the project and indicate the connection name and parameters that the rest of the team should fill in the
.pg_service.conffile.Furthermore, since this file is directly managed by libpq, the standard PostgreSQL client library used by 99% of applications, this strategy will work with any other client that needs to use that database connection, not just QGIS.
For example, in console commands:
ogrinfo PG:"service=test" cities
psql service=test
or in QGIS scripts:
layer = QgsVectorLayer("service=test table=cities (geom)", "Cities", "postgres")
QgsProject.instance().addMapLayer(layer)
The Service File allows defining numerous parameters, and few of them are mandatory. For instance, if we don’t define the password, any application using
libpqwill execute a normal workflow to try to discover it: searching in thePGPASSWORDvariable, checking the existence of the.pgpassfile, or directly prompting us to provide it.La entrada Creating a Shareable QGIS Project with PostgreSQL/PostGIS Connections se publicó primero en iCarto.
-
sur GeoTools Team: GeoTools 28.4 Released
Publié: 19 June 2023, 10:42am CEST
The GeoTools team is pleased to share the availability GeoTools 28.4: geotools-28.4-bin.zip geotools-28.4-doc.zip geotools-28.4-userguide.zip geotools-28.4-project.zip This release is also available from the OSGeo Maven Repository and is made in conjunction with GeoServer 2.22.4. Release notes - GeoTools - 28.4 Bug GEOT-7266 WMTSCapabilities throws NPE for missing title GEOT-7345 WFS -
sur gvSIG Team: La Unión Europea avanza en la regulación de la Inteligencia Artificial
Publié: 19 June 2023, 8:47am CEST

La Inteligencia Artificial (IA) es una tecnología innovadora con el potencial de transformar diversas industrias y mejorar la vida de las personas. En su búsqueda por regular esta tecnología y garantizar su uso responsable, la Unión Europea ha propuesto el primer marco normativo de la UE para la IA, como parte de su estrategia digital.
Esta regulación no solo tiene implicaciones generales, sino que también afecta a campos específicos, como la geomática. En este contexto, en gvSIG estamos analizando distintas posibilidades para integrar tecnologías de IA en la Suite gvSIG.
La combinación de la geomática y la IA promete avances notables en la toma de decisiones basada en datos, la gestión del territorio y el análisis espacial.
La regulación de la IA en la UE sienta un precedente a nivel mundial y muestra el compromiso de la Unión Europea de liderar en el desarrollo y uso responsable de esta tecnología. Esta regulación también se aplica a proyectos como gvSIG. El futuro ya está aquí.
Más información: [https:]]
-
sur gvSIG Team: The European Union advances in the regulation of Artificial Intelligence
Publié: 19 June 2023, 8:33am CEST

Artificial Intelligence (AI) is an innovative technology with the potential to transform various industries and improve people’s lives. In its quest to regulate this technology and ensure its responsible use, the European Union has proposed the first regulatory framework for AI in the EU as part of its digital strategy.
This regulation not only has general implications but also affects specific fields such as geomatics. In this context, at gvSIG, we are exploring different possibilities to integrate AI technologies into the gvSIG Suite. The combination of geomatics and AI promises remarkable advancements in data-driven decision-making, land management, and spatial analysis.
The regulation of AI in the EU sets a global precedent and demonstrates the European Union’s commitment to lead in the development and responsible use of this technology. This regulation also applies to projects like gvSIG. The future is already here.
More information: [https:]]


-
sur Staring at the Moon
Publié: 19 June 2023, 7:59am CEST par Keir Clarke
NASA's Daily Moon Guide is a new interactive map to help you observe the moon on any day of the year. The map shows you what you can see on the moon today with the unaided eye, with binoculars or with a telescope, taking into account the current phase of the moon.The Daily Moon Guide automatically shows you the current phase of the moon. So, for example, tonight you won't see much of the moon
-
sur GeoServer Team: GeoServer 2.22.4 Release
Publié: 19 June 2023, 2:00am CEST
GeoServer 2.22.4 release is now available with downloads ( bin, war, windows) , along with docs and extensions.
This is a maintenance release of GeoServer providing existing installations with minor updates and bug fixes.
GeoServer 2.22.4 is made in conjunction with GeoTools 28.4.
Thanks to Peter Smythe (AfriGIS) and Jody Garnett (GeoCat) for making this release. This is Peter’s first time making a GeoServer release and we would like to thank him for volunteering.
Release notesNew Feature:
- GEOS-10949 Control remote resources accessed by GeoServer
Improvement:
- GEOS-10973 DWITHIN delegation to mongoDB
Bug:
- GEOS-8162 CSV Data store does not support relative store paths
- GEOS-10906 Authentication not sent if connection pooling activated
- GEOS-10936 YSLD and OGC API modules are incompatible
- GEOS-10969 Empty CQL_FILTER-parameter should be ignored
- GEOS-10975 JMS clustering reports error about ReferencedEnvelope type not being whitelisted in XStream
- GEOS-10980 CSS extension lacks ASM JARs as of 2.23.0, stops rendering layer when style references a file
- GEOS-10981 Slow CSW GetRecords requests with JDBC Configuration
- GEOS-10993 Disabled resources can cause incorrect CSW GetRecords response
- GEOS-10994 OOM due to too many dimensions when range requested
- GEOS-10998 LayerGroupContainmentCache is being rebuilt on each ApplicationEvent
- GEOS-11015 geopackage wfs output builds up tmp files over time
- GEOS-11024 metadata: add datetime field type to feature catalog
Task:
- GEOS-10987 Bump xalan:xalan and xalan:serializer from 2.7.2 to 2.7.3
- GEOS-11008) Update sqlite-jdbc from 3.34.0 to 3.41.2.2
- GEOS-11010 Upgrade guava from 30.1 to 32.0.0
- GEOS-11011 Upgrade postgresql from 42.4.3 to 42.6.0
- GEOS-11012 Upgrade commons-collections4 from 4.2 to 4.4
- GEOS-11018 Upgrade commons-lang3 from 3.8.1 to 3.12.0
- GEOS-11020 Add test scope to mockito-core dependency
Sub-task:
- GEOS-10989 Update spring.version from 5.2.23.RELEASE to 5.2.24.RELEASE
For the complete list see 2.22.4 release notes.
About GeoServer 2.22 SeriesAdditional information on GeoServer 2.22 series:
- GeoServer 2.22 User Manual
- Update Instructions
- Metadata extension
- CSW ISO Metadata extension
- State of GeoServer (FOSS4G Presentation)
- GeoServer Beginner Workshop (FOSS4G Workshop)
- Welcome page (User Guide)
Release notes: ( 2.22.4 | 2.22.3 | 2.22.2 | 2.22.1 | 2.22.0 | 2.22-RC | 2.22-M0 )
-
sur GRASS GIS: Developing and updating GRASS GIS addons
Publié: 18 June 2023, 11:12pm CEST
The r.mblend experience In 2017, I had the opportunity to implement a DEM blending algorithm that had been theorised earlier by my colleague João Leitão. It was somewhat natural to develop it as a GRASS add-on, since I have long relied on it for map algebra and other geo-spatial computations. That is how the r.mblend add-on was born. Five years passed without me committing again to r.mblend. In the meantime many important things changed, GRASS version 8 was released and code management moved from SVN to git/GitHub. -
sur Tom Kralidis: new pygeoapi podcast with MapScaping
Publié: 18 June 2023, 2:25pm CEST
For those interested in pygeoapi, the project was recently featured on MapScaping (available on Apple Podcasts, Google Podcasts, Stitcher and Spotify). The MapScaping folks were great to work with and I’d like to thank them for making this happen and asking all the right questions. Enjoy! pygeoapi – A Python Geospatial Server -
sur gvSIG Team: El Mapa Sanitario, una herramienta para la planificación y ordenación en salud: El caso de Mauritania
Publié: 18 June 2023, 10:00am CEST
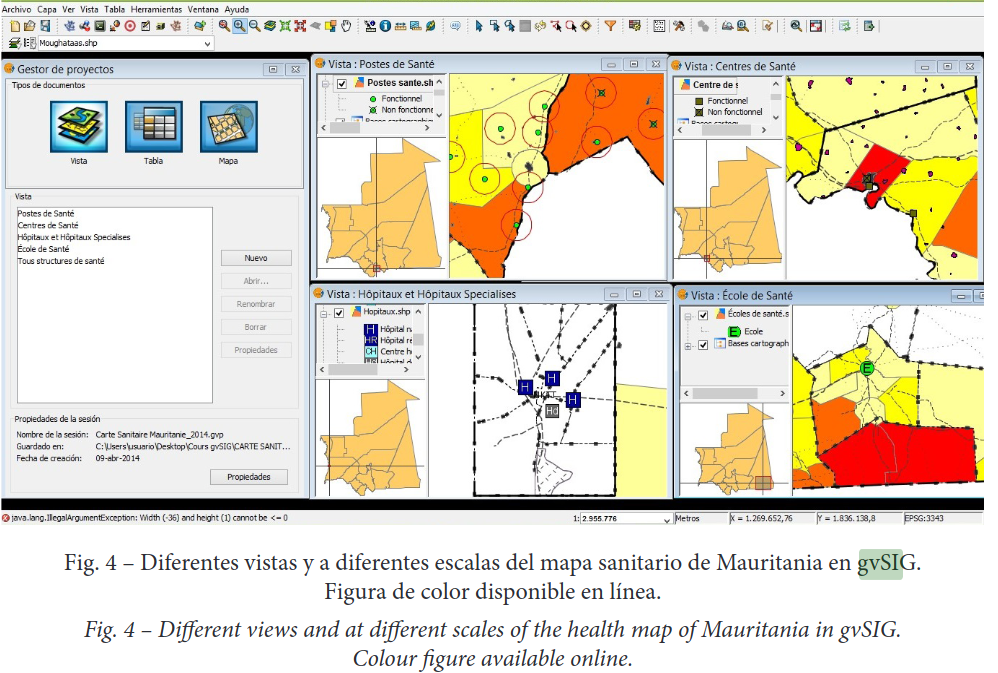
Los llamados mapas de salud son un instrumento para la promoción, democratización y derecho a la información pública sobre salud. También han sido utilizados para contextualizar y focalizar las desigualdades en el sector de la salud pública y otros sectores relacionados. Os traemos un artículo que tiene como objetivo explicar la elaboración del mapa sanitario de Mauritania y su valor en la planificación y reorganización de la oferta de servicios de salud en todos los niveles de la pirámide sanitaria del país, con el fin de responder a las crecientes demandas de información generadas por diversas organizaciones, pero principalmente por el sector sanitario mauritano.
Los sistemas de información geográfica fueron un apoyo importante para este trabajo… y el software seleccionado para elaborarlo fue gvSIG Desktop.
El artículo, disponible en castellano, lo podéis encontrar aquí: [https:]]

-
sur AI Street View Hallucinations
Publié: 17 June 2023, 11:42am CEST par Keir Clarke
I have been a huge admirer of OpenStreetMap Haiku for a number of years. OpenStreetMap Haiku is a clever map that can write a short poem about any location in the world based on the OpenStreetMap data for that location. Share your location with OpenStreetMap Haiku and it will generate a unique haiku using data gleaned from OpenStreetMap using Overpass Turbo. I thought that it might be interesting
-
sur gvSIG Team: Comparación de información catastral antigua y actual con gvSIG Desktop
Publié: 17 June 2023, 9:03am CEST

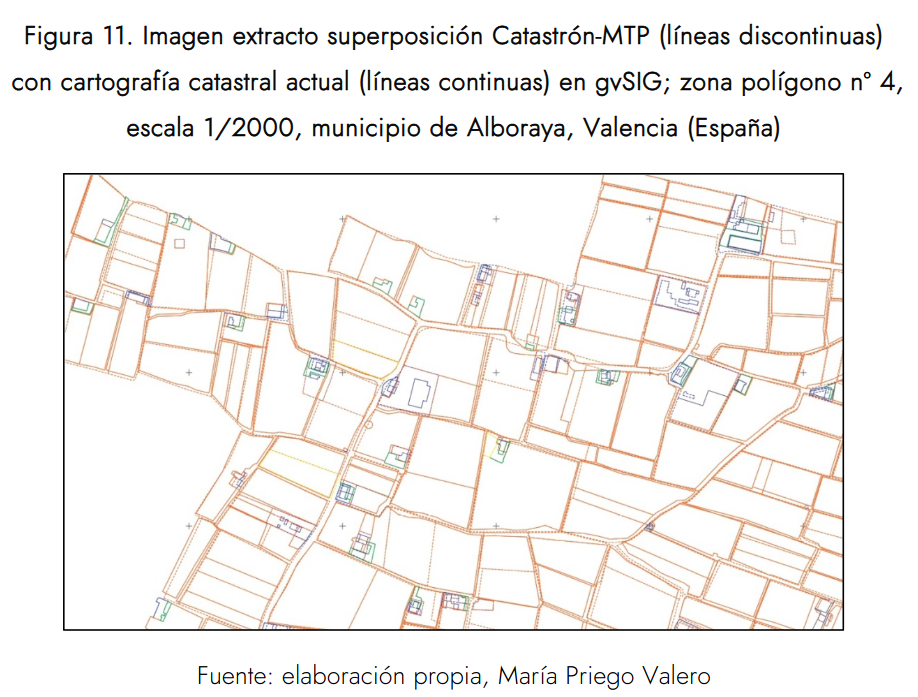
En un artículo recientemente publicado en el Boletín de la Asociación Española de Geografía se muestra el uso de gvSIG para detectar los cambios en los usos del suelo-tipos de cultivo desde 1930 a la actualidad.
Título: Cartografía antigua catastral para la detección de cambios de cultivo: los mapas topográficos parcelarios de Alboraya (1930–2013)
Artículo disponible en abierto: [https:]]
-
sur The History of Latin America
Publié: 16 June 2023, 9:39am CEST par Keir Clarke
The Latin American Political History Map is an animated map which attempts to visualize the ever changing history of Latin American politics, by revealing the political leanings of Latin American countries (and the USA) over the course of over 200 years. I've been following the heated debate on Twitter around this map with some interest this morning. Many of the perceived problems with the map
-
sur gvSIG Team: Curso-Taller de trabajo con modelos de datos de gvSIG Desktop
Publié: 16 June 2023, 8:49am CEST
Las pasadas Jornadas Internacionales de gvSIG contaban en su programa con un taller de trabajo con modelos de datos de gvSIG Desktop.
La grabación del taller no está disponible, pero sí un vídeo previo que grabamos de preparación del taller y que hemos decidido compartir por si es de utilidad.
Es un mini-curso de 1 hora de duración que os puede servir para ir más allá de lo habitual en el manejo de datos en un SIG. Muy recomendable a poco que manejéis modelos de datos algo complejos.
Talleres con formación tan avanzada no son tan habituales ni fáciles de acceder… así que mi recomendación es que no os lo perdáis:

-
sur AI Map Search
Publié: 15 June 2023, 10:18am CEST par Keir Clarke
I am trying to keep track of developments in the use of artificial intelligence in mapping. At the moment the most interesting experiments seem to involve using AI to help answer geospatial queries. This is leading to some interesting maps which use AI to map answers to users' queries. Over the last few months I've been reading with interest on Twitter how developers have been using AI models (
-
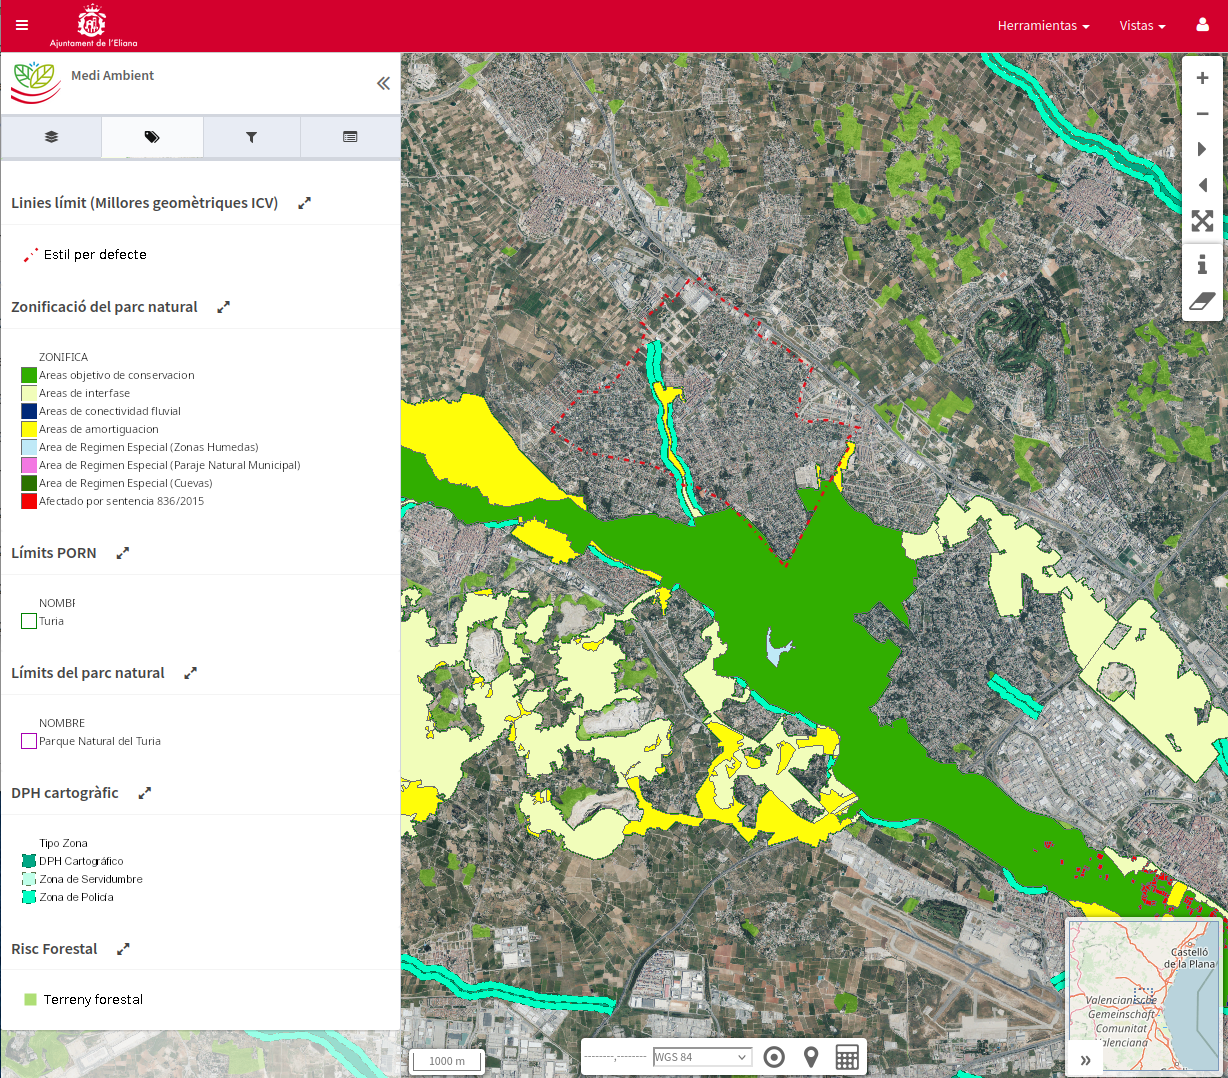
sur gvSIG Team: Geoportales públicos de L’Eliana
Publié: 15 June 2023, 8:40am CEST

Uno de los ayuntamientos que acaba de sumarse al cada vez más numeroso conjunto de administraciones locales que tienen su IDE con gvSIG Online es el de L’Eliana. Otro ejemplo más de cómo no solo las grandes ciudades pueden disponer de soluciones y tecnologías avanzadas para gestionar su información con dimensión geográfica.
De partida, más allá del número creciente de geoportales privados y orientados a la gestión interna, hay ya cuatro visores de mapas públicos disponibles, cada uno impulsado desde su departamento correspondiente:
- Medio Ambiente. Permite la consulta del “Plan de ordenación de los recursos naturales (PORN)” del Parque Natural del Túria y de la cartografía de riesgos, tanto de inundaciones como forestal.
- Urbanismo. Podemos acceder, entre otras capas, a información como la clasificación y calificación urbanística o al catálogo de bienes y espacios protegidos del municipio.
- Servicios Municipales. Disponible para consulta información tan relevante como los servicios de saneamiento, distribución de agua y luminarias.
- Deportes. Cartografía de rutas saludables.
La página web principal es:
Y podéis acceder a los primeros geoportales públicos publicados en:
-
sur Camptocamp: SwitzerlandMobility - a new website with a unique map and content features
Publié: 15 June 2023, 2:00am CEST
Pièce jointe: [télécharger]
For the new version of their website, SwitzerlandMobility wanted to create a unique concept of classical information mashed up with geographic information on maps.
-
sur OGC CEO Dr. Nadine Alameh receives 24th Annual Women in Technology Leadership Award
Publié: 14 June 2023, 3:00pm CEST par Simon Chester
The Open Geospatial Consortium (OGC) is pleased to announce that OGC CEO, Dr. Nadine Alameh, has received the 24th Annual Women in Technology Leadership Award in the Non-Profit and Academia category, which honors women who demonstrate exemplary leadership traits and have achieved success in a non-profit organization or educational institution.
The Women in Technology’s Annual Leadership Awards seek to “recognize and honor female leaders whose achievements, mentorship and contributions to the community align with the WIT mission of advancing women in technology from the classroom to the boardroom” by honoring and celebrating female professionals who have found success in entrepreneurial, STEM, government, and corporate industries while inspiring colleagues, partners, and their community.
“These awards are a cornerstone of the WIT mission to advance women in technology from the classroom to the boardroom,” said Amber Hart, President of WIT and the Co-Owner/Founder, The Pulse of GovCon, in a press release for the awards. “Recognizing the success of these women provides a vision for current and future leaders of what is possible with determination and focus and highlights the role of mentorship and sponsorship in building a successful and meaningful career.”
In the nomination letter for the award, Chair of the OGC Board, Jeff Harris, Vice Chair, Prashant Shukle, and Board member, Zaffar Sadiq Mohamed-Ghouse, said that the OGC board nominated Nadine for her “outstanding global leadership of the Open Geospatial Consortium and its 500 members through a period of profound change.
“When Nadine assumed the role of Chief Executive Officer, she articulated a new vision and role for the OGC – one where it had to be relevant at the speed of change. To that end, she has worked tirelessly in pursuit of this vision as she mobilized some of the world’s largest technology companies, developed and developing national governments, and small- and medium-sized businesses and startups. That she delivered in a not-for-profit entity and with a steely resolve to ensure the global public interest – not only speaks of the scale of her achievements but also its impact on the global public good.”
The 24th Annual Leadership Awards were presented at a Gala on Thursday, May 18, 2023, at the Hyatt Regency in Reston, VA, USA.
The post OGC CEO Dr. Nadine Alameh receives 24th Annual Women in Technology Leadership Award appeared first on Open Geospatial Consortium.
-
sur gvSIG Team: Un vistazo a la Infraestructura de Datos Espaciales de Cullera (IDE)
Publié: 14 June 2023, 8:21am CEST

La IDE de Cullera se inició en el área de urbanismo, pero rápidamente se ha extendido a todas las áreas y departamentos municipales. En la actualidad cuenta con decenas de geoportales internos y una serie de visores de mapas públicos, donde consultar información relevante para los ciudadanos y visitantes del municipio.
Con este post vamos a iniciar una serie de artículos en los que os iremos presentando distintas Infraestructuras de Datos Espaciales implantadas con gvSIG Online, que se está convirtiendo en la solución de referencia para IDEs con software libre.
Vamos a repasar solo algunos de los geoportales públicos:
- Turismo: Es el geoportal principal que recopila información relativa al turismo. Agrupa un extenso conjunto de información como oferta hotelera, puntos y zona de Wi-Fi, gastronomía, museos, rutas y sendas turísticas, playas,…
- Movilidad y transporte: Permite consultar información relativa a movilidad como estacionamientos, carriles bici, líneas de autobús, puntos de carga eléctrica,…
- Deportes: Este geoportal está orientado a mostrar los recorridos de diferentes eventos deportivos como la Volta a peu a Cullera, el triatlón, la San Silvestre,…
- Agricultura y actividades cinegéticas: Contiene información de usos del suelo, bancos de tierras,…
- Servicios municipales: Visor de mapas con información de dotaciones municipales como centros sanitarios, bibliotecas, instalaciones deportivas, centros de enseñanza,…
- Playas: ahora que se acerca la temporada estival aquí se puede encontrar información tan interesante como playas accesibles, infraestructuras, banderas azules…
- Urbanismo: el inicio de la IDE, con toda la información típica de este tipo de geoportales relativa al urbanismo (calificación y clasificación) y catastro. Es interesante destacar que tiene normativa urbanística asociada a los elementos geográficos.
- Y más geoportales públicos: infraestructuras, medio ambiente y cambio climático, gestión de residuos, ciudadanía, arqueología, sanidad, fiestas y comercio. Y siguen creciendo…
La dirección de la página principal de la IDE de Cullera es:
El principal contenido de la IDE, además de los servicios de mapas, son sus geoportales. En el siguiente enlace se pueden visualizar todos los visores de mapas actualmente disponibles:
También es interesante hacer referencia a que gvSIG Online permite generar “Vistas compartidas” que no son más que URLs que permiten compartir una configuración concreta de un geoportal, en la que hay una serie de capas visibles o invisibles por defecto e, incluso, un determinado encuadre (zona o territorio del municipio visible al entrar).
Desde la web de turismo del Ayuntamiento de Cullera, accesible en el enlace [https:]] hay vistas compartidas en distintas secciones de esta web: playas, rutas naturales, monumentos… todas estas vistas compartidas enlazan con distintas configuraciones del geoportal de Turismo que forma parte de la IDE.
Por último, para acabar, indicar que entre las mejoras previstas para los próximos meses está la integración con el gestor de expedientes (SEGEX de Sedipualba) y la incorporación de gvSIG Mapps como app para toma de datos en campo.

-
sur The June Deportations
Publié: 14 June 2023, 7:49am CEST par Keir Clarke
In 1939 the Soviet Union entered into a non-aggression pact with Nazi Germany. In addition to the agreement to not attack each over the Molotov-Ribbentrop Pact included the Secret Protocol. In this protocol Germany and the Soviet Union effectively divided up Europe among themselves, deciding which countries they would allow the other to invade.Soon after the signing of the Molotov-Ribbentrop
-
sur GeoSolutions: GeoSolutions presence at FOSS4G 2023 in Prizren (Kosovo)
Publié: 13 June 2023, 5:48pm CEST
You must be logged into the site to view this content.
-
sur Chronotube
Publié: 13 June 2023, 3:00pm CEST par Keir Clarke
NYC Subwaysheds visualizes how far you can get in "40 minutes from each subway station in New York City". Hover over a subway station on this map and an isochrone layer shows the accessible areas around that station in ten minute intervals (traveling by subway and by foot).Mapbox's Chris Whong was inspired to make the map by the ever popular Chronotrains map. Chronotrains visualizes the travel -
sur Where You Can't Afford to Live
Publié: 13 June 2023, 9:38am CEST par Keir Clarke
The Guardian has published an interactive map which visualizes where you can't afford to live or rent in the UK. Unfortunately the newspaper has mistakenly mistitled the map Find out where you can afford to buy or rent in Great Britain rather than the presumably intended 'Find out where you can't afford to buy or rent in Great Britain'.The Guardian map allows you to enter your annual salary to
-
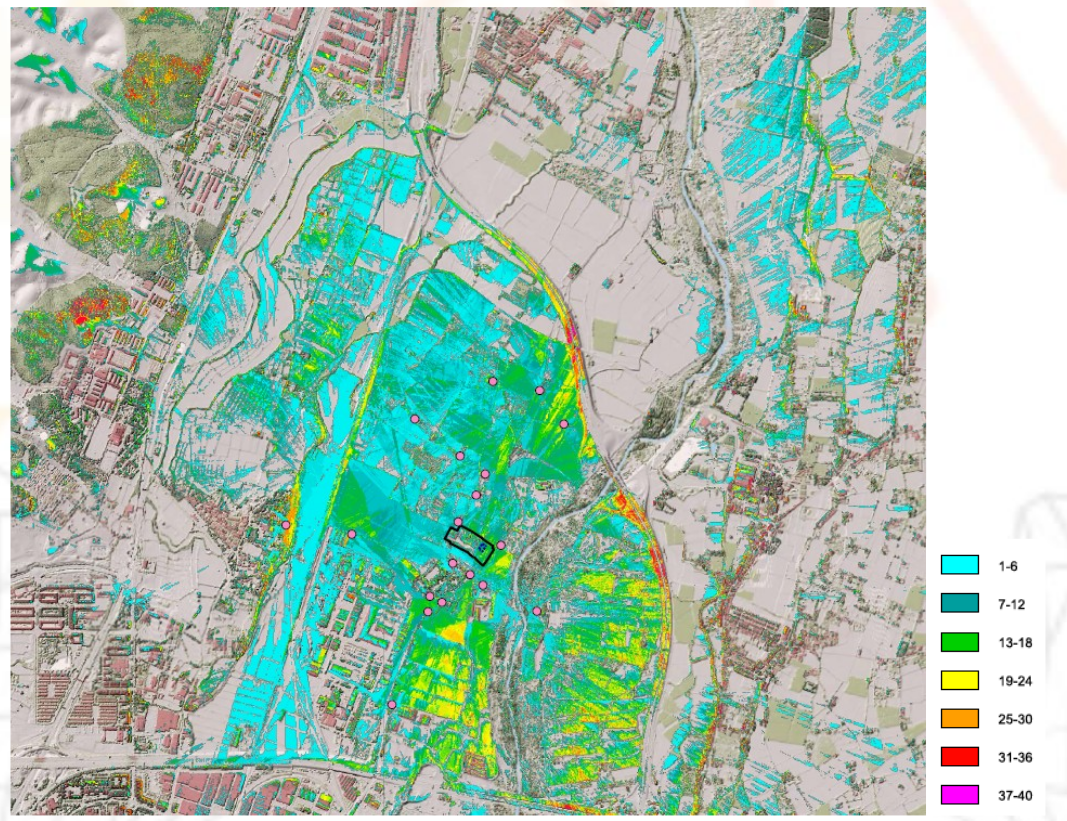
sur gvSIG Team: gvSIG Desktop aplicado al riesgo de impacto paisajístico
Publié: 13 June 2023, 8:11am CEST

Hoy os traemos una presentación de la empresa Geoscan, una consultora con muchos años de experiencia en áreas como la de la ingeniería geológica y el medio ambiente. En este caso nos muestran el uso de gvSIG Desktop para analizar el impacto paisajístico de las instalaciones de una empresa de producción y comercialización de semillas.
-
sur OPENGIS.ch: Unterstützung für WMTS im QGIS Swiss Locator
Publié: 13 June 2023, 7:42am CEST

Das QGIS swiss locator Plugin erleichtert in der Schweiz vielen Anwendern das Leben dadurch, dass es die umfangreichen Geodaten von swisstopo und opendata.swiss zugänglich macht. Darunter ein breites Angebot an GIS Layern, aber auch Objektinformationen und eine Ortsnamensuche.
Dank eines Förderprojektes der Anwendergruppe Schweiz durfte OPENGIS.ch ihr Plugin um eine zusätzliche Funktionalität erweitern. Dieses Mal mit der Integration von WMTS als Datenquelle, eine ziemlich coole Sache. Doch was ist eigentlich der Unterschied zwischen WMS und WMTS?
WMS vs. WMTSZuerst zu den Gemeinsamkeiten: Beide Protokolle – WMS und WMTS – sind dazu geeignet, Kartenbilder von einem Server zu einem Client zu übertragen. Dabei werden Rasterdaten, also Pixel, übertragen. Ausserdem werden dabei gerenderte Bilder übertragen, also keine Rohdaten. Diese sind dadurch für die Präsentation geeignet, im Browser, im Desktop GIS oder für einen PDF Export.
Der Unterschied liegt im T. Das T steht für “Tiled”, oder auf Deutsch “gekachelt”. Bei einem WMS (ohne Kachelung) können beliebige Bildausschnitte angefragt werden. Bei einem WMTS werden die Daten in einem genau vordefinierten Gitternetz — als Kacheln — ausgeliefert.
Der Hauptvorteil von WMTS liegt in dieser Standardisierung auf einem Gitternetz. Dadurch können diese Kacheln zwischengespeichert (also gecached) werden. Dies kann auf dem Server geschehen, der bereits alle Kacheln vorberechnen kann und bei einer Anfrage direkt eine Datei zurückschicken kann, ohne ein Bild neu berechnen zu müssen. Es erlaubt aber auch ein clientseitiges Caching, das heisst der Browser – oder im Fall von Swiss Locator QGIS – kann jede Kachel einfach wiederverwenden, ganz ohne den Server nochmals zu kontaktieren. Dadurch kann die Reaktionszeit enorm gesteigert werden und flott mit Applikationen gearbeitet werden.
Warum also noch WMS verwenden?
Auch das hat natürlich seine Vorteile. Der WMS kann optimierte Bilder ausliefern für genau eine Abfrage. Er kann Beispielsweise alle Beschriftungen optimal platzieren, so dass diese nicht am Kartenrand abgeschnitten sind, bei Kacheln mit den vielen Rändern ist das schwieriger. Ein WMS kann auch verschiedene abgefragte Layer mit Effekten kombinieren, Blending-Modi sind eine mächtige Möglichkeit, um visuell ansprechende Karten zu erzeugen. Weiter kann ein WMS auch in beliebigen Auflösungen arbeiten (DPI), was dazu führt, dass Schriften und Symbole auf jedem Display in einer angenehmen Grösse angezeigt werden, währenddem das Kartenbild selber scharf bleibt. Dasselbe gilt natürlich auch für einen PDF Export.
Ein WMS hat zudem auch die Eigenschaft, dass im Normalfall kein Caching geschieht. Bei einer dahinterliegenden Datenbank wird immer der aktuelle Datenstand ausgeliefert. Das kann auch gewünscht sein, zum Beispiel soll nicht zufälligerweise noch der AV-Datensatz von gestern ausgeliefert werden.
Dies bedingt jedoch immer, dass der Server das auch entsprechend umsetzt. Bei den von swisstopo via map.geo.admin.ch publizierten Karten ist die Schriftgrösse auch bei WMS fix ins Kartenbild integriert und kann nicht vom Server noch angepasst werden.
Im Falle von QGIS Swiss Locator geht es oft darum, Hintergrundkarten zu laden, z.B. Orthofotos oder Landeskarten zur Orientierung. Daneben natürlich oft auch auch weitere Daten, von eher statischer Natur. In diesem Szenario kommen die Vorteile von WMTS bestmöglich zum tragen. Und deshalb möchten wir der QGIS Anwendergruppe Schweiz im Namen von allen Schweizer QGIS Anwender dafür danken, diese Umsetzung ermöglicht zu haben!
Der QGIS Swiss Locator ist das schweizer Taschenmesser von QGIS. Fehlt dir ein Werkzeug, das du gerne integrieren würdest? Schreib uns einen Kommentar!
-
sur The Map of Roman Amphitheaters
Publié: 12 June 2023, 11:17am CEST par Keir Clarke
Roman Amphitheaters is an interactive map of Roman amphitheaters built in Europe and northern Africa during the long reign of the Roman Empire. The map has been created using Sebastian Heath's Roman amphitheaters data.The amphitheater markers on the map are sized by capacity. Select an amphitheater on the map and an information window opens providing details on the amphitheaters's capacity,
-
sur Lutra consulting: Webinar: Processing LiDAR data in QGIS 3.32
Publié: 12 June 2023, 11:00am CEST
Join this webinar to learn more about the new features in QGIS to process LiDAR data:
Date: Monday, June 26, 2023 at 14:00 GMT
Duration: 30 minutes + 15 minutes Q&A session
Speaker: Martin Dobias, CTO at Lutra Consulting with more than 15 years of QGIS development experience
Description
Point clouds are an increasingly popular data type thanks to the decreasing cost of their acquisition through lidar surveys and photogrammetry. On top of that, more and more national mapping agencies release high resolution point cloud data (spanning large areas and consisting of billions of points), unlocking many new use cases.
This webinar will summarize the latest QGIS release 3.32 and the addition of tools for point cloud analysis right from QGIS Processing toolbox: clip, filter, merge, export to raster, extract boundaries and more - all backed by PDAL library that already ships with QGIS, without having to rely on third party proprietary software.
This work was made possible by the generous donations to our crowdfunding.
-
sur gvSIG Team: Control de versiones y edición de cartografía multiusuario con software libre
Publié: 12 June 2023, 8:01am CEST

Uno de los desarrollos más avanzados que han llegado a gvSIG Desktop es su control de versiones, VCSGIS, y que lo ha convertido en una herramienta fundamental para resolver las problemáticas de edición avanzada a las que el software libre no tenía respuesta.
En esta presentación podréis conocer qué es VCSGIS y todo lo que permite hacer


-
sur Global Sunlight Chart
Publié: 10 June 2023, 10:32am CEST par Keir Clarke
The ShadeMap: Direct Sunlight Chart is an interactive map which can calculate the number of hours of direct sunlight for any location on Earth. Unlike traditional sun charts, this map actually accounts for shadows cast by buildings and terrain. If a tall building or mountain blocks out the sun for part of the day this is taken into account in the sunlight chart for that location. The
-
sur GeoSolutions: GeoSolutions at WAGIS 2023 in Tacoma, WA 14-15 June
Publié: 9 June 2023, 5:48pm CEST
You must be logged into the site to view this content.
-
sur America's Pink Migration Banana
Publié: 9 June 2023, 10:41am CEST par Keir Clarke
The San Francisco Chronicle has published a fascinating map which visualizes net migration in US counties. On this map counties which have seen a net loss in migration are shown in pink and those that have seen a net gain are shown in blue. The map therefore provides a great overview of where Americans are moving to and from.The Where People are Moving map reveals a pink banana running down the
-
sur gvSIG Team: Plataforma de información geográfica del Estado de Tocantins, Brasil
Publié: 9 June 2023, 7:56am CEST
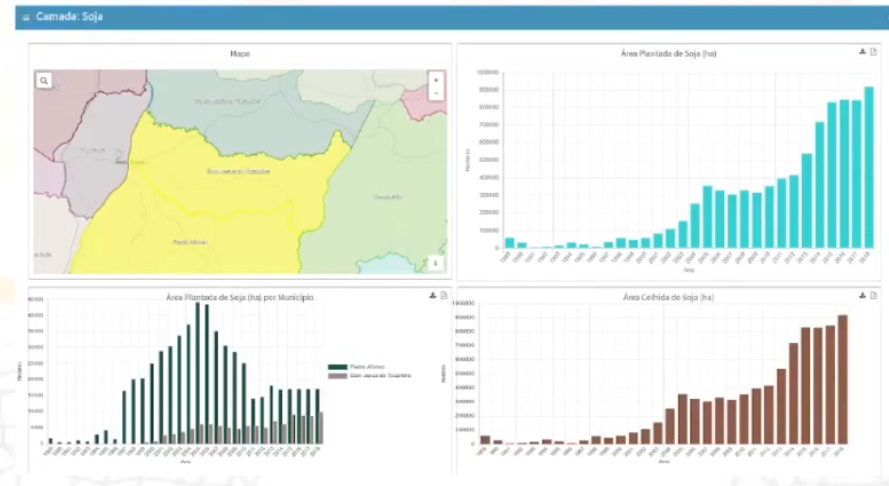
Os traemos la presentación de otro interesante proyecto de implantación de gvSIG Online, en este caso en el Estado de Tocantins (Brasil) y que ha permitido publicar numerosas capas de información geográfica, estructurada en diversos geoportales.
De este proyecto, además, destacamos el desarrollo de herramientas en gvSIG Online para la generación de dashboards o cuadros de mandos.
-
sur Lutra consulting: Virtual Point Clouds (VPC)
Publié: 8 June 2023, 4:00pm CEST
As a part of our crowdfunding campaign we have introduced a new method to handle a large number of point cloud files. In this article, we delve into the technical details of the new format, rationale behind our choice and how you can create, view and process virtual point cloud files.
RationaleLidar surveys of larger areas are often multi-terabyte datasets with many billions of points. Having such large datasets represented as a single point cloud file is not practical due to the difficulties of storage, transfer, display and analysis. Point cloud data are therefore typically stored and distributed split into square tiles (e.g. 1km x 1km), each tile having a more manageable file size (e.g. ~200 MB when compressed).
Tiling of data solves the problems with size of data, but it introduces issues when processing or viewing an area of interest that does not fit entirely into a single tile. Users need to develop workflows that take into account multiple tiles and special care needs to be taken to deal with data near edges of tiles to avoid unwanted artefacts in outputs. Similarly, when viewing point cloud data, it becomes cumbersome to load many individual files and apply the same symbology.
Here is an example of several point cloud tiles loaded in QGIS. Each tile is styled based on min/max Z values of the tile, creating visible artefacts on tile edges. The styling has to be adjusted for each layer separately:
Virtual Point Clouds
In the GIS world, many users are familiar with the concept of virtual rasters. A virtual raster is a file that simply references other raster files with actual data. In this way, GIS software then treats the whole dataset comprising many files as a single raster layer, making the display and analysis of all the rasters listed in the virtual file much easier.
Borrowing the concept of virtual rasters from GDAL, we have introduced a new file format that references other point cloud files - and we started to call it virtual point cloud (VPC). Software supporting virtual point clouds handles the whole tiled dataset as a single data source.
At the core, a virtual point cloud file is a simple JSON file with .vpc extension, containing references to actual data files (e.g. LAS/LAZ or COPC files) and additional metadata extracted from the files. Even though it is possible to write VPC files by hand, it is strongly recommended to create them using an automated tool as described later in this post.
On a more technical level, a virtual point cloud file is based on the increasingly popular STAC specification (the whole file is a STAC API ItemCollection). For more details, please refer to the VPC specification that also contains best practices and optional extensions (such as overviews).
Virtual Point Clouds in QGISWe have added support for virtual point clouds in QGIS 3.32 (released in June 2023) thanks to the many organisations and individuals who contributed to our last year’s joint crowdfunding with North Road and Hobu. The support in QGIS consists of three parts:
- Create virtual point clouds from a list of individual files
- Load virtual point clouds as a single map layer
- Run processing algorithms using virtual point clouds
Those who prefer using command line tools, PDAL wrench includes a build_vpc command to create virtual point clouds, and all the other PDAL wrench commands support virtual point clouds as the input.
Using Virtual Point CloudsIn this tutorial, we are going to generate a VPC using the new Processing algorithm, load it in QGIS and then generate a DTM from terrain class. You will need QGIS 3.32 or later for this. For the purpose of this example, we are using the LiDAR data provided by the IGN France data hub.
In QGIS, open the Processing toolbox panel, search for the Build virtual point cloud (VPC) algorithm ((located in the Point cloud data management group):
VPC algorithm in the Processing toolbox
In the algorithm’s window, you can add point cloud layers already loaded in QGIS or alternatively point it to a folder containing your LAZ/LAS files. It is recommended to also check the optional parameters:
-
Calculate boundary polygons - QGIS will be able to show the exact boundaries of data (rather than just rectangular extent)
-
Calculate statistics - will help QGIS to understand ranges of values of various attributes
-
Build overview point cloud - will also generate a single “thinned” point cloud of all your input data (using only every 1000th point from original data). The overview point cloud will be created next to the VPC file - for example, for mydata.vpc, the overview point cloud would be named mydata-overview.copc.laz
VPC algorithm inputs, outputs and options
After you set the output file and start the process, you should end up with a single VPC file referencing all your data. If you leave the optional parameters unchecked, the VPC file will be built very quickly as the algorithm will only read metadata of input files. With any of the optional parameters set, the algorithm will read all points which can take some time.
Now you can load the VPC file in QGIS as any other layer - using QGIS browser, Data sources dialog in QGIS or by doing drag&drop from a file browser. After loading a VPC in QGIS, the 2D canvas will show boundaries of individual files - and as you zoom in, the actual point cloud data will be shown. Here, a VPC loaded together with the overview point cloud:
Virtual point cloud (thinned version) generated by the VPC algorithm
Zooming in QGIS in 2D map with elevation shading - initially showing just the overview point, later replaced by the actual dense point cloud:
VPC output on 2D: displaying details when zooming in
In addition to 2D maps, you can view the VPC in a 3D map windows too:
If the input files for VPCs are not COPC files, QGIS will currently only show their boundaries in 2D and 3D views, but processing algorithms will work fine. It is however possible to use the Create COPC algorithm to batch convert LAS/LAZ files to COPC files, and then load VPC with COPC files.
It is also worth noting that VPCs also work with input data that is not tiled - for example, in some cases the data are distributed as flightlines (with lots of overlaps between files). While this is handled fine by QGIS, for the best performance it is generally recommended to first tile such datasets (using the Tile algorithm) before doing further display and analysis.
Processing Data with Virtual Point CloudsNow that we have the VPC generated, we can run other processing algorithms. For this example, we are going to convert the ground class of the point cloud to a digital terrain model (DTM) raster. In the QGIS Processing toolbox, search for Export to raster algorithm (in the Point cloud conversion group):
VPC layer can be used as an input to the point cloud processing algorithm
This will use the Z values from the VPC layer and generate a terrain raster based on a user defined resolution. The algorithm will process the tiles in parallel, taking care of edge artefacts (at the edges, it will read data also from the neighbouring tiles). The output of this algorithm will look like this:
Converting a VPC layer to a DTM
The output raster contains holes where there were no points classified as ground. If needed for your use case, you can fill the holes using Fill nodata algorithm from GDAL in the Processing toolbox and create a smooth terrain model for your input Virtual Point Cloud layer:
Filling the holes in the DTM
Virtual point clouds can be used also for any other algorithms in the point cloud processing toolbox. For more information about the newly introduced algorithms, please see our previous blog post.
All of the point cloud algorithms also allow setting filtering extent, so even with a very large VPC, it is possible to run algorithms directly on a small region of interest without having to create temporary point cloud files. Our recommendation is to have input data ready in COPC format, as this format provides more efficient access to data when spatial filtering is used.
Streaming Data from Remote Sources with VPCsOne of the very useful features of VPCs is that they work not only with local files, but they can also reference data hosted on remote HTTP servers. Paired with COPCs, point cloud data can be streamed to QGIS for viewing and/or processing - that means QGIS will only download small portions of data of a virtual point cloud, rather than having to download all data before they could be viewed or analysed.
Using IGN’s lidar data provided as COPC files, we have built a small virtual point cloud ign-chambery.vpc referencing 16 km2 of data (nearly 700 million points). This VPC file can be loaded in QGIS and used for 2D/3D visualisation, elevation profiles and processing, with QGIS handling data requests to the server as necessary. Processing algorithms only take a couple of seconds if the selected area of interest is small (make sure to set the “Cropping extent” parameter of algorithms).
All this greatly simplifies data access to point clouds:
-
Data producers can use very simple infrastructure - a server hosting static COPC files together with a single VPC file referencing those COPC files.
-
Users can use QGIS to view and process point cloud data as a single map layer, with no need to download large amounts of data, QGIS (and PDAL) taking care of streaming data as needed.
We are very excited about the opportunities that virtual point clouds are bringing to users, especially when combined with COPC format and access from remote servers!
Thanks again to all contributors to our crowdfunding campaign - without their generous support, this work would not have been possible.
Contact us if you would like to add more features in QGIS to handle, analyse or visualise lidar data.

-
sur Dr. Jeff de La Beaujardiere receives OGC Lifetime Achievement Award
Publié: 8 June 2023, 3:00pm CEST par Simon Chester
The Open Geospatial Consortium (OGC) is excited to announce that Dr. Jeff de La Beaujardiere has been selected as the latest recipient of the OGC Lifetime Achievement Award. The announcement was made last night during the Executive Dinner in the U.S. Space & Rocket Center at the 126th OGC Member Meeting in GeoHuntsville, AL.
Jeff has been selected for the award due to his long standing leadership, commitment, and support for the advancement and uptake of standards used for the dissemination of Earth Science information.
“I’m so happy that Jeff has been selected to receive the OGC Lifetime Achievement Award,” said OGC CEO, Dr. Nadine Alameh. “Jeff is more than a champion for standards, more than an OGC Gardels award winner, and more than the WMS editor and promoter: Jeff is a role model for many of us in geospatial circles, and has directly and indirectly influenced generations of interoperability enthusiasts to collaborate, to innovate, and to solve critical problems related to our Earth. From OGC and myself, I offer our congratulations and thank Jeff for his technical work – and for being such an inspiration to so many!”
For more than 25 years, Jeff’s support of open standards and OGC’s FAIR mission has improved access to Earth science information for countless users and decision-makers around the globe. Since 1995, Jeff has focused on improving public access to scientific data by pushing for it to be discoverable, accessible, documented, interoperable, citable, curated for long-term preservation, and reusable by the broader scientific community, external users, and decision-makers.
In the OGC community, Jeff is best known as the Editor of the OGC Web Map Service (WMS) Specification: a joint OGC/ISO Standard that now supports access to millions of datasets worldwide. OGC WMS was the first in the OGC Web Services suite of Standards and is the most downloaded Standard from OGC. But most importantly, the OGC WMS Standard truly revolutionized how geospatial data is shared and accessed over the web.
Jeff was also a major contributor to other OGC Standards, including the OGC Web Services Architecture, the OGC Web Map Context, OGC Web Terrain Service, and OGC Web Services Common.
Jeff’s journey with Standards – and his engagement with OGC – started back in 1998 when NASA was leading the effort to implement the Digital Earth program. At that time, Jeff championed interoperability standards as fundamental to realizing the Digital Earth vision. As part of his journey, he has provided leadership to the Geospatial Applications and Interoperability (GAI) Working Group of the U.S. Federal Geographic Data Committee and to the OGC Technical Committee.
In 2002 and 2003, Jeff served as Portal Manager for Geospatial One-Stop, a federal electronic government initiative. He led a team of experts in defining the requirements, architecture, and competitive solicitation for a Portal based on open standards and led an OGC interoperability initiative in developing and demonstrating a working implementation. This was a fast-paced, high-stakes effort involving many companies and agencies building on what today is the OGC Collaborative Solution & Innovation Program.
Jeff has received several awards for his leadership and impact in the many communities that he has participated in throughout his career, including the 2013 OGC Kenneth D. Gardels Award, the 2023 ESIP President’s Award, and the 2003 Falkenberg Award at AGU which honors “a scientist under 45 years of age who has contributed to the quality of life, economic opportunities, and stewardship of the planet through the use of Earth science information and to the public awareness of the importance of understanding our planet.”
With this lifetime achievement award, OGC recognizes and celebrates Jeff’s lifetime of service, and his steadfast support of FAIR geospatial information for the benefit of open science, and society.
The post Dr. Jeff de La Beaujardiere receives OGC Lifetime Achievement Award appeared first on Open Geospatial Consortium.
-
sur QGIS Blog: Plugin Update May 2023
Publié: 8 June 2023, 9:35am CEST
In May 22 new plugins that have been published in the QGIS plugin repository.
Here’s the quick overview in reverse chronological order. If any of the names or short descriptions piques your interest, you can find the direct link to the plugin page in the table below the screenshot.
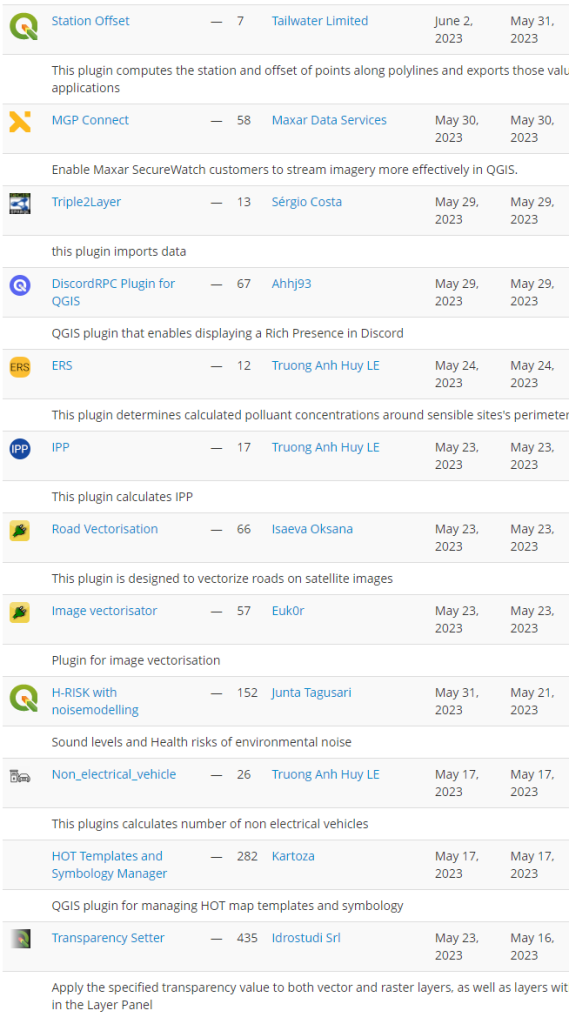

Station Offset This plugin computes the station and offset of points along polylines and exports those values to csv for other applications MGP Connect Enable Maxar SecureWatch customers to stream imagery more effectively in QGIS. Triple2Layer this plugin imports data DiscordRPC Plugin for QGIS QGIS plugin that enables displaying a Rich Presence in Discord ERS This plugin determines calculated polluant concentrations around sensible sites’s perimeters IPP This plugin calculates IPP Road Vectorisation This plugin is designed to vectorize roads on satellite images Image vectorisator Plugin for image vectorisation H-RISK with noisemodelling Sound levels and Health risks of environmental noise Non_electrical_vehicle This plugins calculates number of non electrical vehicles HOT Templates and Symbology Manager QGIS plugin for managing HOT map templates and symbology Transparency Setter Apply the specified transparency value to both vector and raster layers, as well as layers within the selected groups in the Layer Panel DBGI Creates geopackages that match the requirements for the DBGI project StyleLoadSave Load or Save active vector layer style PixelCalculator Interactively calculate the mean value of selected pixels of a raster layer. GISTDA sphere basemap A plugin for adding base map layers from GISTDA sphere platform ( [https:]] ). Adjust Style Adjust the style of a map with a few clicks instead of altering every single symbol (and symbol layer) for many layers, categories or a number of label rules. A quick way to adjust the symbology of all layers (or selected layers) consistantly, to check out how different colors / stroke widths / fonts work for a project, and to save and load styles of all layers – or even to apply styles to another project. With one click, it allows to: adjust color of all symbols (including color ramps and any number of symbol layers) and labels using the HSV color model (rotate hue, change saturation and value); change line thickness (i.e. stroke width of all symbols / symbol borders); change font size of all labels; replace a font family used in labels with another font family; save / load the styles of all layers at once into/from a given folder. APLS This plugin performs Average Path Length Similarity qaequilibrae Transportation modeling toolbox for QGIS QGPT Agent QGPT Agent is LLM Assistant that uses openai GPT model to automate QGIS processes FuzzyJoinTables Join tables using min Damerau-Levenshtein distance Chandrayaan-2 IIRS Generates reflectance from Radiance data of Imaging Infrared Spectrometer sensor of Chandrayaan 2

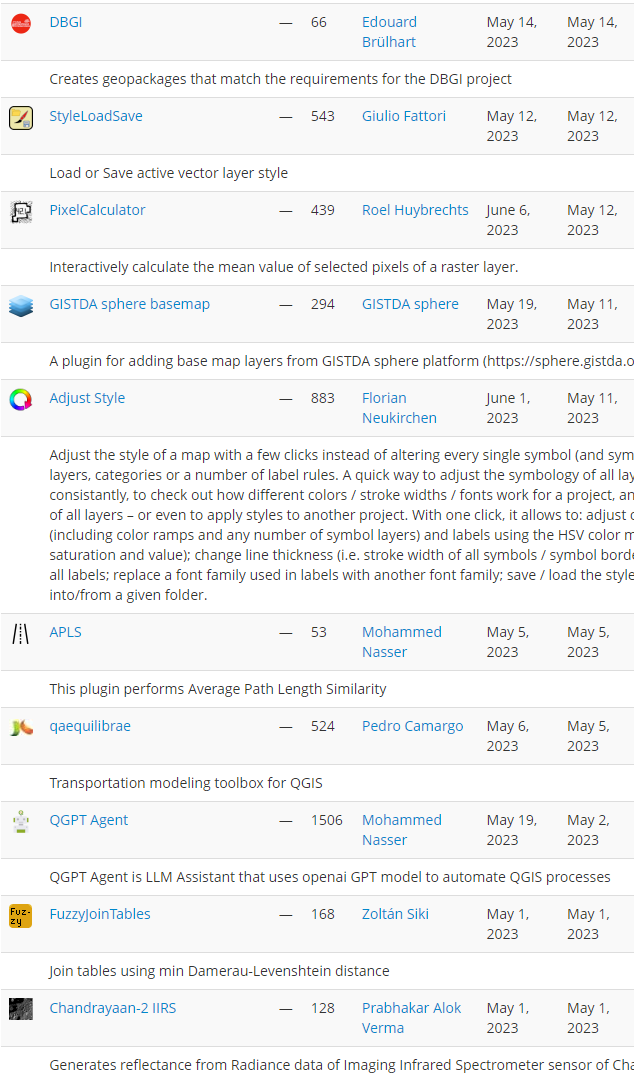
-
sur The Privatisation of East Germany
Publié: 8 June 2023, 9:16am CEST par Keir Clarke
After the reunification of Germany in 1990 the German Democratic Republic established an agency in order to privatise East German enterprises. The Treuhandanstalt (Trust Institution) was tasked with overseeing the sale of over 8,500 state-owned companies. Under communism nearly half of all East Germans worked for the state or for state-run companies. Privatising all East German enterprises
-
sur gvSIG Team: GeoETL de la plataforma gvSIG Online: Automatizar transformaciones de datos
Publié: 8 June 2023, 7:59am CEST
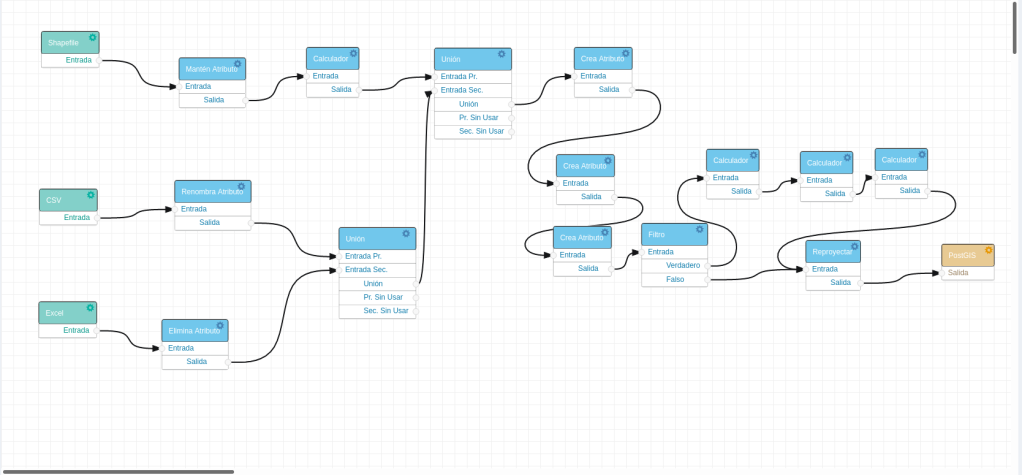
Una mejora considerable de gvSIG Online respecto a otros productos del mercado es su ETL. Gracias a su ETL, gvSIG Online podrá realizar integraciones con otras fuentes de datos de forma ágil y sin necesidad de desarrollo.
ETL es un plugin que se utiliza para automatizar tareas de transformaciones de datos, ya sean repetitivas o no, de manera que no sea necesario la manipulación de los datos a través de código. De esta manera, cualquier usuario es capaz de hacer una manipulación de los datos (geométricamente o no) o una homogeneización de datos que provengan de diferentes orígenes y formatos.
Esto es posible gracias a un canvas que representará gráficamente el proceso de transformación de los datos de una manera fácil e intuitiva.
Si queréis conocer todo el potencia de GeoETL, no os perdáis el vídeo:

-
sur Wildfires & Smoke Pollution
Publié: 7 June 2023, 8:42am CEST par Keir Clarke
Wildfires in Quebec and Nova Scotia are causing high levels of unhealthy air conditions across much of eastern Canada and the northeastern United States. Over 400 fires were reported to be burning in Canada on Tuesday evening resulting in smoke pollution and dangerous levels of particulate matter 2.5 over large areas.FireSmoke Canada has an interactive smoke forecast map which provides
-
sur gvSIG Team: Conociendo gvSIG Mapps
Publié: 7 June 2023, 8:02am CEST

Todo el mundo conoce gvSIG Desktop, el origen de el catálogo de soluciones que denominamos Suite gvSIG. Cada vez más organizaciones de todo el mundo están implantando gvSIG Online como su plataforma de gestión de datos espaciales y geoportales. Y, aunque menos conocido, crece el número de entidades que usan gvSIG Mapps… bien como app para toma de datos en campo, bien como apps desarrolladas con su framework.
¿Queréis saber más? Os contamos qué es realmente gvSIG Mapps:
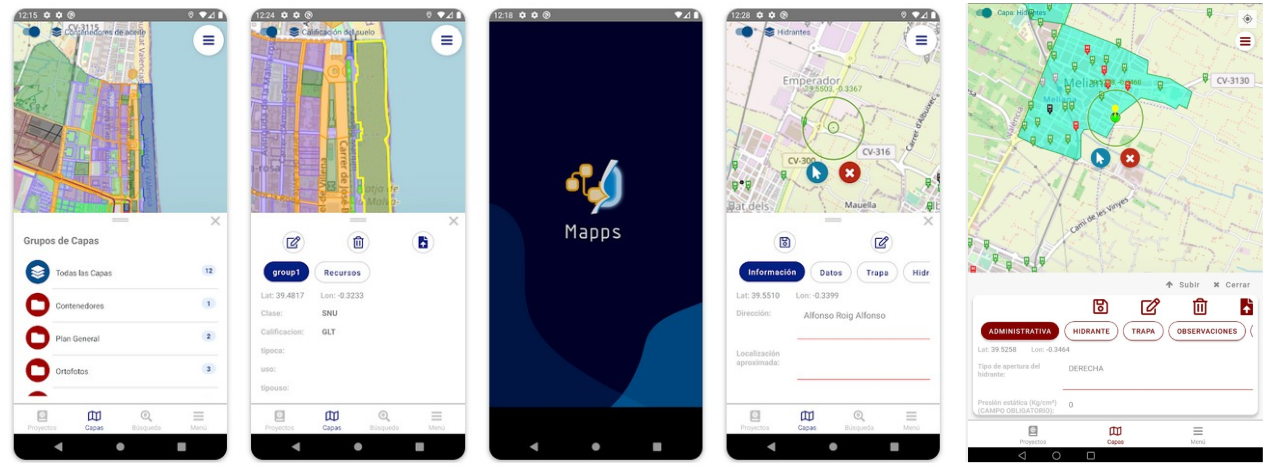
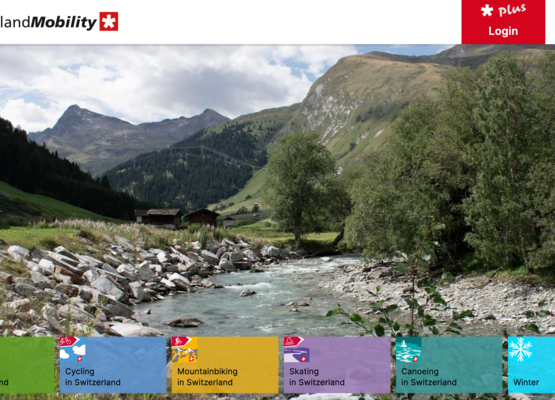
-
sur A GIS Degree
Publié: 30 April 2022, 10:59pm CEST par dovecaramelphobos94903
My son decided to change majors from biodesign to GIS. I had a short moment when I almost told him not to bring all this on himself but then thought differently. I could use my years of experience to help him get the perfect degree in GIS and get a great job and still do what he wants.

He’s one semester into the program so he really hasn’t taken too many classes. There has been the typical Esri, SPSS and Google Maps discussion, but nothing getting into the weeds. Plus he’s taking Geography courses as well so he’s got that going for him. Since he’s at Arizona State University, he’s going through the same program as I did, but it’s a bit different. When I was at ASU, Planning was in the Architectural College. Now it’s tied with Geography in a new School of Geographical Sciences & Urban Planning.
I have to be honest, this is smart, I started my GIS career working for a planning department at a large city. The other thing I noticed is a ton of my professors are still teaching. I mean how awesome is that? I suddenly don’t feel so old anymore.

I’ve stayed out of his classes for the past semester in hopes that he can form his own thoughts on GIS and its applicability. I probably will continue to help him focus on where to spend his electives (more Computer Science and less History of the German Empire 1894-1910). He’s such a smart kid, I know he’s going to do a great job and he was one who spent time in that Esri UC Kids Fair back when I used to go to the User Conference. Now he could be getting paid to use Esri software or whatever tool best accomplishes his goals.
I plan to show him the Safe FME Minecraft Reader/Writer.
-
sur A GIS Degree
Publié: 30 April 2022, 10:59pm CEST par James
My son decided to change majors from biodesign to GIS. I had a short moment when I almost told him not to bring all this on himself but then thought differently. I could use my years of experience to help him get the perfect degree in GIS and get a great job and still do what he wants.

He’s one semester into the program so he really hasn’t taken too many classes. There has been the typical Esri, SPSS and Google Maps discussion, but nothing getting into the weeds. Plus he’s taking Geography courses as well so he’s got that going for him. Since he’s at Arizona State University, he’s going through the same program as I did, but it’s a bit different. When I was at ASU, Planning was in the Architectural College. Now it’s tied with Geography in a new School of Geographical Sciences & Urban Planning.
I have to be honest, this is smart, I started my GIS career working for a planning department at a large city. The other thing I noticed is a ton of my professors are still teaching. I mean how awesome is that? I suddenly don’t feel so old anymore.

I’ve stayed out of his classes for the past semester in hopes that he can form his own thoughts on GIS and its applicability. I probably will continue to help him focus on where to spend his electives (more Computer Science and less History of the German Empire 1894-1910). He’s such a smart kid, I know he’s going to do a great job and he was one who spent time in that Esri UC Kids Fair back when I used to go to the User Conference. Now he could be getting paid to use Esri software or whatever tool best accomplishes his goals.
I plan to show him the Safe FME Minecraft Reader/Writer.
-
sur GIS and Monitors
Publié: 25 October 2021, 7:15pm CEST par dovecaramelphobos94903
If there is one constant in my GIS career, it is my interest in the monitor I’m using. Since the days of being happy for a “flat screen” Trinitron monitor to now with curved flat screens, so much has changed. My first GIS Analyst position probably had the worst monitor in the history of monitors. I can’t recall the name but it had a refresh rate that was probably comparable what was seen in the 1960s. It didn’t have great color balance either, so I ended up printing out a color swatch pattern from ArcInfo and taped it on my wall so I could know what color was what.
 I stared for years at this monitor. No wonder I need reading glasses now!
Eventually I moved up in the world where I no longer got hand-me-down hardware and I started to get my first new equipment. The company I worked for at the time shifted between Dell and HP for hardware, but generally it was dual 21″ Trinitron CRTs. For those who are too young to remember, they were the size of a small car and put off enough heat and radiation to probably shorten my life by 10 year. Yet, I could finally count on them being color corrected by hardware/software and not feel like I was color blind.
 It wasn’t sexy but it had a cool look to it. You could drop it flat to write on it like a table.
Over 11 years ago, I was given a Wacom DTU-2231 to test. You can read more about it on that link but it was quite the monitor. I guess the biggest change between now and then is how little that technology took off. I guess if you asked me right after you read that post in 2010 what we’d be using in 2020, I would have said such technology would be everywhere. Yet we don’t see stylus based monitor much at all.
These days my primary monitor is a LG UltraFine 24″ 4k. I pair it with another 24″ 4K monitor that I’ve had for years. Off to the other side is a generic Dell 24″ monitor my company provided. I find this setup works well for me, gone are the days where I had ArcCatalog and ArcMap open in two different monitors. Alas two of the monitors are devoted to Outlook and WebEx Teams, just a sign of my current work load.
I’ve always felt that GIS people care more about monitors than most. A developer might be more interested in a Spotify plugin for their IDE, but a GIS Analyst care most about the biggest, brightest and crispest monitor they can get their hands on. I don’t always use FME Workbench these days, but when I do, it is full screen on the most beautiful monitor I can have. Seems perfect to me.
-
sur GIS and Monitors
Publié: 25 October 2021, 7:15pm CEST par James
If there is one constant in my GIS career, it is my interest in the monitor I’m using. Since the days of being happy for a “flat screen” Trinitron monitor to now with curved flat screens, so much has changed. My first GIS Analyst position probably had the worst monitor in the history of monitors. I can’t recall the name but it had a refresh rate that was probably comparable what was seen in the 1960s. It didn’t have great color balance either, so I ended up printing out a color swatch pattern from ArcInfo and taped it on my wall so I could know what color was what.
 I stared for years at this monitor. No wonder I need reading glasses now!
Eventually I moved up in the world where I no longer got hand-me-down hardware and I started to get my first new equipment. The company I worked for at the time shifted between Dell and HP for hardware, but generally it was dual 21″ Trinitron CRTs. For those who are too young to remember, they were the size of a small car and put off enough heat and radiation to probably shorten my life by 10 year. Yet, I could finally count on them being color corrected by hardware/software and not feel like I was color blind.
 It wasn’t sexy but it had a cool look to it. You could drop it flat to write on it like a table.
Over 11 years ago, I was given a Wacom DTU-2231 to test. You can read more about it on that link but it was quite the monitor. I guess the biggest change between now and then is how little that technology took off. I guess if you asked me right after you read that post in 2010 what we’d be using in 2020, I would have said such technology would be everywhere. Yet we don’t see stylus based monitor much at all.
These days my primary monitor is a LG UltraFine 24″ 4k. I pair it with another 24″ 4K monitor that I’ve had for years. Off to the other side is a generic Dell 24″ monitor my company provided. I find this setup works well for me, gone are the days where I had ArcCatalog and ArcMap open in two different monitors. Alas two of the monitors are devoted to Outlook and WebEx Teams, just a sign of my current work load.
I’ve always felt that GIS people care more about monitors than most. A developer might be more interested in a Spotify plugin for their IDE, but a GIS Analyst care most about the biggest, brightest and crispest monitor they can get their hands on. I don’t always use FME Workbench these days, but when I do, it is full screen on the most beautiful monitor I can have. Seems perfect to me.
-
sur Are Conferences Important Anymore?
Publié: 13 July 2021, 5:00pm CEST par dovecaramelphobos94903
Hey SOTM is going on, didn’t even know. The last SOTM I went to was in 2013 which was a blast. But I have to be honest, not only did this slip my mind, none of my feeds highlighted it to me. Not only that, apparently Esri is having a conference soon. (wait for me to go ask Google when it is) OK, they are having it next week. I used to be the person who went to as much as I could, either through attending or invited to keynote. The last Esri UC I went to was in 2015, 6 years ago. As I said SOTM was in 2013. FOSS4G, 2011. I had to look up, the last conference that had any GIS in it was the 2018 Barcelona Smart City Expo.
So with the world opening back up, or maybe not given whatever greek letter variant we are dealing with right now, I’ve started to think about what I might want to attend and the subject matter. At the end of the day, I feel like I got more value out of the conversations outside the convention center than inside. So probably where I see a good subset of smart people hanging out. That’s why those old GeoWeb conferences that Ron Lake put on were so amazing. Meeting a ton of smart people and enjoying the conversations, rather than reading Powerpoint slides in a darkly lit room.
Hopefully we can get back to that, just need to keep my eye out.
-
sur Are Conferences Important Anymore?
Publié: 13 July 2021, 5:00pm CEST par James
Hey SOTM is going on, didn’t even know. The last SOTM I went to was in 2013 which was a blast. But I have to be honest, not only did this slip my mind, none of my feeds highlighted it to me. Not only that, apparently Esri is having a conference soon. (wait for me to go ask Google when it is) OK, they are having it next week. I used to be the person who went to as much as I could, either through attending or invited to keynote. The last Esri UC I went to was in 2015, 6 years ago. As I said SOTM was in 2013. FOSS4G, 2011. I had to look up, the last conference that had any GIS in it was the 2018 Barcelona Smart City Expo.
So with the world opening back up, or maybe not given whatever greek letter variant we are dealing with right now, I’ve started to think about what I might want to attend and the subject matter. At the end of the day, I feel like I got more value out of the conversations outside the convention center than inside. So probably where I see a good subset of smart people hanging out. That’s why those old GeoWeb conferences that Ron Lake put on were so amazing. Meeting a ton of smart people and enjoying the conversations, rather than reading Powerpoint slides in a darkly lit room.
Hopefully we can get back to that, just need to keep my eye out.
-
sur Unreal and Unity are the new Browsers
Publié: 12 April 2021, 5:57pm CEST par dovecaramelphobos94903
Someone asked me why I hadn’t commented on Cesium and Unreal getting together. Honestly , no reason. This is big news honestly. HERE, where I work, is teaming up with Unity to bring the Unity SDK and the HERE SDK to automotive applications. I talk about how we used Mapbox Unity SDK at Cityzenith (though I have no clue if they still are). Google and Esri have them too. In fact both Unreal and Unity marketplaces are littered with data sources you can plug in.
 HERE Maps with Unity
This is getting at the core of what these two platforms could be. Back in the day we had two browsers, Firefox and Internet Explorer 6. Inside each we had many choices of mapping platforms to use. From Google and Bing to Mapquest and Esri. In the end that competition to make the best API/SDK for a mapping environment drove a ton of innovation. What Google Maps looks like and does in 2021 vs 2005 is amazing.
This brings up the key as to what I see happening here. We’ll see the mapping companies (or companies that have mapping APIs) deliver key updates to these SDK (which today are pretty limited in scope) because they have to stay relevant. Not that web mapping is going away at any point, but true 3D world and true Digital Twins require power that browsers cannot provide even in 2021. So this rush to become the Google Maps of 3D engines is real and will be fun to watch.
Interesting in that Google is an also-ran in the 3D engine space, so there is so much opportunity for the players who have invested and continue to invest in these markets without Google throwing unlimited R&D dollars against it. Of course it only takes on press release to change all that so don’t bet against Google.
-
sur Unreal and Unity are the new Browsers
Publié: 12 April 2021, 5:57pm CEST par James
Someone asked me why I hadn’t commented on Cesium and Unreal getting together. Honestly , no reason. This is big news honestly. HERE, where I work, is teaming up with Unity to bring the Unity SDK and the HERE SDK to automotive applications. I talk about how we used Mapbox Unity SDK at Cityzenith (though I have no clue if they still are). Google and Esri have them too. In fact both Unreal and Unity marketplaces are littered with data sources you can plug in.
 HERE Maps with Unity
This is getting at the core of what these two platforms could be. Back in the day we had two browsers, Firefox and Internet Explorer 6. Inside each we had many choices of mapping platforms to use. From Google and Bing to Mapquest and Esri. In the end that competition to make the best API/SDK for a mapping environment drove a ton of innovation. What Google Maps looks like and does in 2021 vs 2005 is amazing.
This brings up the key as to what I see happening here. We’ll see the mapping companies (or companies that have mapping APIs) deliver key updates to these SDK (which today are pretty limited in scope) because they have to stay relevant. Not that web mapping is going away at any point, but true 3D world and true Digital Twins require power that browsers cannot provide even in 2021. So this rush to become the Google Maps of 3D engines is real and will be fun to watch.
Interesting in that Google is an also-ran in the 3D engine space, so there is so much opportunity for the players who have invested and continue to invest in these markets without Google throwing unlimited R&D dollars against it. Of course it only takes on press release to change all that so don’t bet against Google.
-
sur Arrays in GeoJSON
Publié: 6 April 2021, 1:00pm CEST par dovecaramelphobos94903
So my last post was very positive. I figured out how to relate the teams that share a stadium with the stadium itself. This was important because I wanted to eliminate the redundant points that were on top of each other. For those who don’t recall, I have an example in this gist:

Now I mentioned that there were issues displaying this in GIS applications and was promptly told I was doing this incorrectly:
An array of <any data type> is not the same as a JSON object consisting of an array of JSON objects. If it would have been the first, I'd have pointed you (again) to QGIS and this widget trick [https:]] .
— Stefan Keller (@sfkeller) April 4, 2021If you click on that tweet you’ll see basically that you can’t do it the way I want and I have to go back to the way I was doing it before:
Unfortunately, the beat way is to denormalise. Redundant location in many team points.
— Alex Leith (@alexgleith) April 4, 2021I had a conversation with Bill Dollins about it and he sums it up susinctly:
I get it, but “Do it this way because that’s what the software can handle” is an unsatisfying answer.
So I’m stuck, I honestly don’t care if QGIS can read the data, because it can. It just isn’t optimal. What I do care about is an organized dataset in GeoJSON. So my question that I can’t get a definitive answer, “is the array I have above valid GeoJSON code?”. From what I’ve seen, yes. But nobody wants to go on record as saying absolutely. I could say, hell with it I’m moving forward but I don’t want to go down a dead end road.
-
sur Arrays in GeoJSON
Publié: 6 April 2021, 1:00pm CEST par James
So my last post was very positive. I figured out how to relate the teams that share a stadium with the stadium itself. This was important because I wanted to eliminate the redundant points that were on top of each other. For those who don’t recall, I have an example in this gist:

Now I mentioned that there were issues displaying this in GIS applications and was promptly told I was doing this incorrectly:
An array of <any data type> is not the same as a JSON object consisting of an array of JSON objects. If it would have been the first, I'd have pointed you (again) to QGIS and this widget trick [https:]] .
— Stefan Keller (@sfkeller) April 4, 2021If you click on that tweet you’ll see basically that you can’t do it the way I want and I have to go back to the way I was doing it before:
Unfortunately, the beat way is to denormalise. Redundant location in many team points.
— Alex Leith (@alexgleith) April 4, 2021I had a conversation with Bill Dollins about it and he sums it up susinctly:
I get it, but “Do it this way because that’s what the software can handle” is an unsatisfying answer.
So I’m stuck, I honestly don’t care if QGIS can read the data, because it can. It just isn’t optimal. What I do care about is an organized dataset in GeoJSON. So my question that I can’t get a definitive answer, “is the array I have above valid GeoJSON code?”. From what I’ve seen, yes. But nobody wants to go on record as saying absolutely. I could say, hell with it I’m moving forward but I don’t want to go down a dead end road.
-
sur GeoJSON Ballparks as JSON
Publié: 2 April 2021, 9:42pm CEST par dovecaramelphobos94903
In a way it is good that Sean Gillies doesn’t follow me anymore. Because I can hear his voice in my head as I was trying to do something really stupid with the project. But Sheldon helps frame what I should be doing with what I was doing:
tables? what the? add , teams:[{name:"the name", otherprop: …}, {name:…}] to each item in the ballparks array and get that relational db BS out of your brain
— Sheldon (@tooshel) April 2, 2021Exactly! What the hell? Why was I trying to do something so stupid when the while point of this project is baseball ballparks in GeoJSON. Here is the problem in a nutshell and how I solved it. First off, let us simply the problem down to just one ballpark. Salt River Fields at Talking Stick is the Spring Training facility for both the Arizona Diamondbacks and the Colorado Rockies. Not only that, but there are Fall League and Rookie League teams playing there. Probably even more that I still haven’t researched. Anyway, GeoJSON Ballparks looks like this today when you just want to see that one stadium.
 Let’s just say I backed myself in this corner by starting by only having MLB ballparks, none of which at the time of the project were shared between teams.
It’s a mess right? Overlapping points, so many opportunities to screw up names. So my old school thought was just create a one-to-many relationship between the GeoJSON points and some external table. Madness! Seriously, what was I thinking? Sheldon is right, I should be doing a JSON array for the teams. Look how much nicer it all looks when I do this!
 Look how nice that all is? So easy to read and it keeps the focus on the ballparks.
As I said in the earlier blog post.
The problem now is so many teams, especially in spring training, minor leagues and fall ball, share stadiums, that in GeoJSON-Ballparks, you end up with multiple dots on top of each other. No one-to-many relationship that should happen.”
The project had pivoted in a way I hadn’t anticipated back in 2014 and it was a sure a mess to maintain. So now I can focus on fixing the project with the Minor League Baseball realignment that went on this year and get an updated dataset in Github very soon.
One outcome of doing this nested array is that many GIS tools don’t understand how to display the data. Take a look at geojson.io:

geojson.io compresses the array into one big JSON-formatted string. QGIS and Github do this also. It’s an issue that I’m willing to live with. Bill Dollins shared the GeoJSON spec with me to prove the way I’m doing is correct:
3.2.  Feature Object
   A Feature object represents a spatially bounded thing.  Every Feature
   object is a GeoJSON object no matter where it occurs in a GeoJSON
   text.
   o  A Feature object has a "type" member with the value
      "Feature".
   o  A Feature object has a member with the name
      "geometry".  The value of the geometry member SHALL
      be either a Geometry object as defined above or, in
      the case that the Feature is unlocated, a JSON
      null value.
   o  A Feature object has a member with the name
      "properties".  The value of the properties member is
      an object (any JSON object or a JSON null value).
ANY JSON OBJECT! So formatting the files this way is correct and the way it should be done. I’m going to push forward on cleaning up GeoJSON Ballparks and let the GIS tools try and catch up.
-
sur GeoJSON Ballparks and MLB Minor League Realignment
Publié: 7 March 2021, 10:15pm CET par dovecaramelphobos94903
**UPDATE** – See the plan.
Boy, where to start? First, for those who haven’t been following, this happened over the winter.
Major League Baseball announced on Friday (February 12, 2021) a new plan for affiliated baseball, with 120 Minor League clubs officially agreeing to join the new Professional Development League (PDL). A full list of Major League teams and their new affiliates, one for each level of full-season ball, along with a complex league (Gulf Coast and Arizona) team, can be found below.
 Minor League Baseball
What does that mean? Well for GeoJSON Ballparks basically every minor league team is having a modification to it. At a minimum, the old minor league names have changed. Take the Pacific Coast League that existed for over 118 years is now part of Triple-A West which couldn’t be a more boring name. All up and down the minor leagues, the names now just reflect the level of minor league the teams are. And some teams have moved from AAA to Single A and all around.
I usually wait until Spring Training is just about over to update the minor league teams but this year it almost makes zero sense. I’ve sort of backed myself into a spatial problem, unintended when I started. Basically, the project initially was just MLB teams and their ballparks. The key to that is that the teams drove the dataset, not the ballparks even though the title of the project clearly said it was. As long as nobody shared a ballpark, this worked out great. The problem now is so many teams, especially in spring training, minor leagues and fall ball, share stadiums, that in GeoJSON-Ballparks, you end up with multiple dots on top of each other. No one-to-many relationship that should happen.
So, I’m going to use this minor league realignment to fix what I should have fixed years ago. There will be two files in this dataset moving forward. One GeoJSON file of the locations of a ballpark and then a CSV (or other format) file containing the teams. Then we’ll just do the old fashioned relate between the two and the world is better again.
I’m going to fork GeoJSON-Ballparks into a new project and right the wrongs I have done against good spatial data management. I’m finally ready to play centerfield!
-
sur I’m Here at HERE
Publié: 22 February 2021, 5:46pm CET par dovecaramelphobos94903
Pièce jointe: [télécharger]
Last Tuesday I started at HERE Technologies with the Professional Services group in the Americas. I’ve probably used HERE and their legacy companies data and services for most of my career so this is a really cool opportunity to work with a mobile data company.
I’m really excited about working with some of their latest data products including Premier 3D Cities (I can’t escape Digital Twins).
Digital Twins at HERE -
sur Digital Twins and Unreal Engine
Publié: 17 November 2020, 6:36pm CET par dovecaramelphobos94903
I’ve had a ton of experience with Unity and Digital Twins but I have been paying attention to Unreal Engine. I think the open nature of Unity is probably more suited for the current Digital Twin market, but competition is so important for innovation. This project where Unreal Engine was used to create a digital clone of Adelaide is striking but the article just leaves me wanting for so much more.
A huge city environment results in a hefty 3D model. Having strategies in place to ease the load on your workstation is essential. “Twinmotion does not currently support dynamic loading of the level of detail, so in the case of Adelaide, we used high-resolution 3D model tiles over the CBD and merged them together,” says Marre. “We then merged a ring of low-resolution tiles around the CBD and used the lower level of detail tiles the further away we are from the CBD.”
Well, that’s how we did it at Cityzenith. Tiles are the only way to have the detail one needs in these 3D worlds and one that geospatial practitioners are very used to dealing with their slippy maps. The eye-candy that one sees in that Adelaide project is amazing. Of course, scaling one city out is hard enough but doing so across a country or the globe is another. Still, this is an amazing start.
Seeing Epic take Twinmotion and scale it out this way is very exciting because as you can see from that video above, it really does look photorealistic.
But this gets at the core of where Digital Twins have failed. It is so very easy to do the above, crate an amazing looking model of a city, and drape imagery across it. It is a very different beast to actually create a Digital Twin where these buildings are not only linked up to external IoT devices and services but they should import BIM models and generalize as needed. They do so some rudimentary analysis of shadows which is somewhat interesting, but this kind of stuff is so easy to do and there are so many tools to do it that all this effort to create a photorealistic city seems wasted.
I think users would trade photorealistic cities for detailed IoT services integration but I will watch Aerometrex continue to develop this out. Digital Twins are still stuck in sharing videos on Vimeo and YouTube, trying to create some amazing realistic city when all people want is visualization and analysis of IoT data. That said, Aerometrex has done an amazing job building this view.
-
sur Moving Towards a Digital Twin Ecosystem
Publié: 10 November 2020, 9:01pm CET par dovecaramelphobos94903
Smart Cities really start to become valuable when they integrate with Digital Twins. Smart Cities do really well with transportation networks and adjusting when things happen. Take, for example, construction on an important Interstate highway that connects the city core with the suburbs causes backups and a smart city can adjust traffic lights, rail, and other modes of transportation to help adjudicate the problems. This works really well because the transportation system talk to each other and decisions can be made to refocus commutes toward other modes of transportation or other routes. But unfortunately, Digital Twins don’t do a great job talking to Smart Cities.
 Photo by Victor Garcia on Unsplash
A few months ago I talked about Digital Twins and messaging. The idea that:
Digital twins require connectivity to work. A digital twin without messaging is just a hollow shell, it might as well be a PDF or a JPG. But connecting all the infrastructure of the real world up to a digital twin replicates the real world in a virtual environment. Networks collect data and store it in databases all over the place, sometimes these are SQL-based such as Postgres or Oracle, and other times they are simple as SQLite or flat-file text files. But data should be treated as messages back and forth between clients.
This was in the context of a Digital Twin talking to services that might not be hardware-based, but the idea stands up for how and why a Digital Twin should be messaging the Smart City at large. Whatever benefits a Digital Twin gains from an ecosystem that collects and analyzes data for decision-making those benefits become multiplied when those systems connect to other Digital Twins. But think outside a group of Digital Twins and the benefit of the Smart City when all these buildings are talking to each other and the city to make better decisions about energy use, transportation, and other shared infrastructure across the city or even the region (where multiple Smart Cities talk to each other).
 When all these buildings talk to each other, they can help a city plan, grow and evolve into a clean city.
What we don’t have is a common data environment (CDE) that cities can use. We have seen data sharing on a small scale in developments but not on a city-wide or regional scale. To do this we need to agree on model standards that allow not only Digital Twins to talk to each other (Something open like Bentley’s iTwin.js) and share ontologies. Then we need that Smart City CDE where data is shared, stored, and analyzed at a large scale.
One great outcome of this CDE is all this data can be combined with City ordinances to give tools like Delve from Sidewalk Labs even more data to create their generative design options. Buildings are not a bubble in a city and their impacts on the city extend out beyond the boundaries of the parcel they are built on. That’s what so exciting about this opportunity, manage assets in a Digital Twin on a micro-scale, but share generalized data about those decisions to the city at large which then can share them with other Digital Twins.

And lastly, individual Smart Cities aren’t bubbles either. They have huge impacts on the region or even the country that they are in. If we can figure out how to create a national CDE, one that covers a country as diverse as the United States, we can have something that can even benefit the world at large. Clean cities are the future and thinking about them on a small scale will only result in the gentrification of affluent areas and leave less well areas behind. I don’t want my children to grow up in a world like that and we have the processes in place to ensure that they have a better place than use to grow up in.
-
sur Quilting "Golden Light"
Publié: 14 December 2014, 2:45am CET par Aluminum Loaf
After the success of the first experiment with printing one of my mom's photographs on fabric and quilting it last July (see Quilting Fuchsia), we selected seven more images and had those printed at Spoonflower's largest possible size (about 27 x 40 inches without distorting the image). I've since shipped and carried those pieces of fabric all around the United States and even into Canada, twice. Two weeks ago, I finally managed to find the time to sit down and start to quilt again—truly one of my very favourite/favorite activities.
This is the resulting quilt that I created from the photograph "Golden Light" by Elizabeth Root Blackmer (you can see the original image in the middle of her Frozen gallery at BrootPhoto.com). The image is bubbles of air trapped in the ice of a frozen pond.
First of all, I had to find a fabric store. I was staying at my house in Nova Scotia when I finally found the time to quilt, and although I have spent extended periods of time here at the house over the past seven years (I took over the family home), I had never tried to find a place to source fabric here. I mentioned to my farming neighbour/neighbor that I need to ask his wife about a place to get fabric, and he looked at me like I was utterly obtuse. He said something along the lines of: "Everyone goes to Avonport Discount Fabric Centre over in Avonport, up behind the school—how do you not know that?" LOL.
So I asked a few more people over the next few days as I finished up my stack of work-work, and every single person (male and female) said the same thing: go there! So I did. Well, it doesn't look like much from the outside, and it shares a big dirt parking lot with the used auto parts store next door, so I was reasonably skeptical, but oh, what an epic pleasure this place is. Fantastic materials, ample supplies, helpful staff, great prices, and generally, like so many places here in Nova Scotia, a meeting place for friends and family. I've been back quite a number of times since; it's just down the road from my house—not ten minutes away!Anyway, I found the most perfect backing fabric and thread for my project at this lovely store, and had a few wonderful quilting-related conversations with the ladies there while I wandered around looking at everything.
For some odd reason, I decided to use the dining table as my quilting space (but it's just me here this time, so I'm not in anyone's way). It might seem odd, given that I made myself a quilting area in another room, but this space is always warm, and that space doesn't need to be heated, so I ended up out here. By the time this quilt was done, five of the six chairs had been moved away from the table to give me access to all sides of the quilt.
And here is the original printed image.
I started by quilting the ice bubbles with gold thread and used a twisty stitch-line within each circle to make them stand out as separate elements. You can see the backing fabric here as well, a delicious mottled teal.
Then I quilted the darker section in the upper-right quadrant with a brown top thread. I used the diagonal line that runs through the image as the dividing line between the two sections of parallel stitching, and eyeballed the entire quilt from that one line. Teal thread was used for every stitch on the back of the quilt.
I used a variegated thread for the rest of the straight lines. Again, with teal thread on the back.
Quilting so many straight lines was exhausting, but I found my rhythm after a while.
You can really see how the variegated thread looks on the binding. I used three lines of it on the binding to make this element really stand out.
I had to go back to the fabric store to find a suitable edge fabric to use for the binding, but then I found a bias tape that was the perfect colour/color, so I used that.
And here's what the back looks like.
And here it is on the bed in one of the guest rooms ... I go in and visit it often, as I take stretch breaks from work-work and think about which image I'll quilt next ...
I only had one major blooper that I had to reëngineer with this quilt. Oh, and what a drag it was! My camera apparently couldn't register so much teal, so it displayed it as greyish/grayish, but even so, there's the epic snaggle of thread. Ugh.
And here are the test scraps that I used during this project. I can't imagine throwing them out unless I have a record of what they look like. It's that, or staple them into my diary, and that gets cumbersome.