
Vous pouvez lire le billet sur le blog La Minute pour plus d'informations sur les RSS !
Canaux
7062 éléments (529 non lus) dans 56 canaux
 Dans la presse
(390 non lus)
Dans la presse
(390 non lus)
-
 Cybergeo
(323 non lus)
Cybergeo
(323 non lus) -
Revue Internationale de Géomatique (RIG)
-
SIGMAG & SIGTV.FR - Un autre regard sur la géomatique
(6 non lus)
-
Mappemonde
(60 non lus)
-
Dans les algorithmes
(1 non lus)
Du côté des éditeurs
(19 non lus)
-
Imagerie Géospatiale
-
Toute l’actualité des Geoservices de l'IGN
(15 non lus)
-
arcOrama, un blog sur les SIG, ceux d ESRI en particulier (4 non lus)
-
arcOpole - Actualités du Programme
-
Géoclip, le générateur d'observatoires cartographiques
-
Blog GEOCONCEPT FR
Toile géomatique francophone
(91 non lus)
-
Géoblogs (GeoRezo.net) (5 non lus)
-
Conseil national de l'information géolocalisée
(11 non lus)
-
Évènements – Afigéo
-
 Geotribu
-
Les cafés géographiques
(5 non lus)
-
UrbaLine (le blog d'Aline sur l'urba, la géomatique, et l'habitat)
-
Icem7
-
Séries temporelles (CESBIO)
(2 non lus)
-
Datafoncier, données pour les territoires (Cerema)
-
Cartes et figures du monde
-
SIGEA: actualités des SIG pour l'enseignement agricole
-
Data and GIS tips
-
Neogeo Technologies
-
ReLucBlog
-
L'Atelier de Cartographie
-
My Geomatic
-
archeomatic (le blog d'un archéologue à l’INRAP)
-
Cartographies numériques
-
Veille cartographie
-
Makina Corpus (1 non lus)
-
Oslandia
(2 non lus)
-
Camptocamp
(51 non lus)
-
Carnet (neo)cartographique
-
GEOMATIQUE
-
Le blog de Geomatys
(2 non lus)
-
Geomatick
-
CartONG (actualités)
-
Afigéo
(12 non lus)
Géomatique anglophone
(19 non lus)

Planet OSGeo
-
sur OTB Team: Look back on the OTB Users Days 2024
Publié: 5 December 2024, 10:55am CET
The OTB Users Days 2024 were held on November 21th and 22th at Artilect Fablab in Toulouse. Thanks to everyone who attended the event! Plenary Talks On Thursday several talks were given on various subjects: On Friday morning, we had a presentation of the PLUTO portal (video) Brainstorming session On Thursday and Friday afternoons, we […] -
sur Fernando Quadro: WebGIS para monitoramento de Terras Indígenas
Publié: 4 December 2024, 2:00pm CET
Terras indígenas, como a tribo Alto Turiaçu no Maranhão, enfrentam ameaças crescentes de incêndios florestais. Para ajudar na proteção dessas áreas, a Jéssica Uchoa criou uma aplicação WebGIS que monitora focos de incêndio e analisa seus impactos com dados geoespaciais em tempo real e históricos.
 Como funciona:
 FIRMS (NOAA-21) Realizar o monitoramento de focos de incêndio em tempo real (últimas 24h); Sentinel-2: Análise de cicatrizes de queimadas com imagens de alta resolução; MIRBI: Identificação de pontos ativos de incêndio; Camadas do IBGE: Fornece a localização de territórios indígenas, ajudando na orientação e no planejamento das análises.
Você pode acessar uma versão do WebGIS no seguinte link: [https:]
Gostou desse post? Conte nos comentários

Fonte: webgis.tech
Instagram: [https:]]
LinkedIn: [https:]] -
sur Mappery: Cité de l’espace
Publié: 4 December 2024, 12:00pm CET

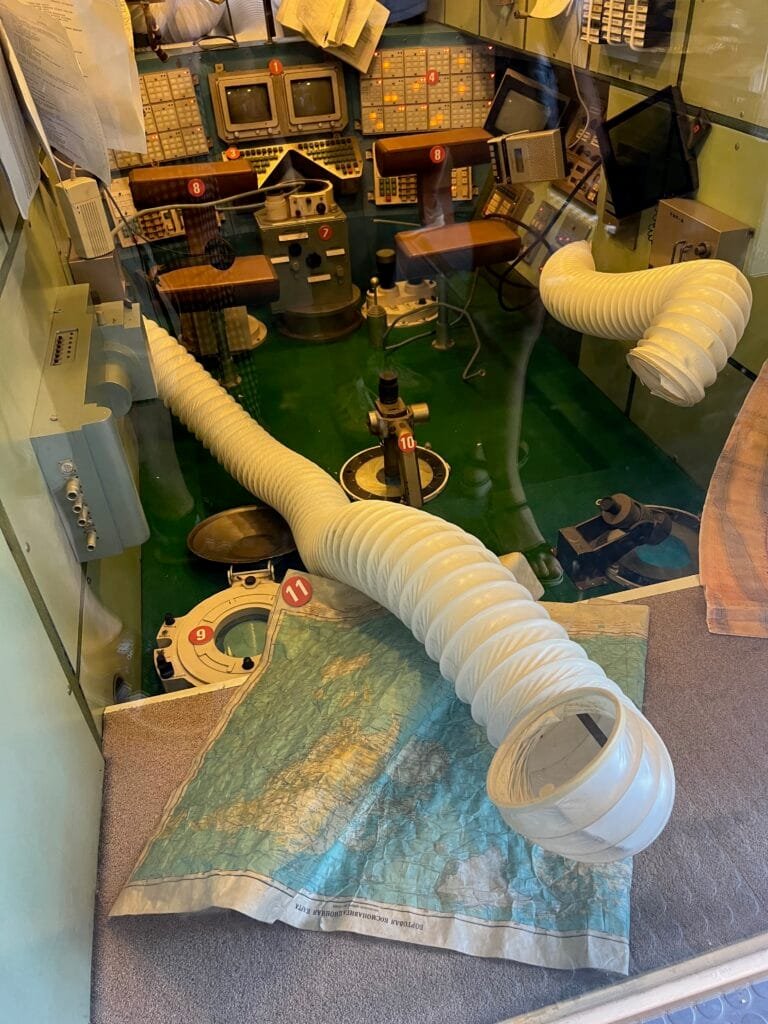
Camille found a map in a Mir space station module displayed at the Cité de l’espace, Toulouse, France.
-
sur Camptocamp: Camptocamp and IGN Partnership Wins 2024 Acteurs du Libre Award for Best Public-Private Collaboration
Publié: 4 December 2024, 2:00am CET
Pièce jointe: [télécharger]
We’re delighted to announce that Camptocamp, alongside our partner IGN (Institut National de l'Information Géographique et Forestière), has been awarded the prestigious 2024 Acteurs du Libre Prize in the category of Best Public-Private Collaboration. -
sur Fernando Quadro: Segredos para desenvolver seu WebGIS
Publié: 3 December 2024, 8:18pm CET
Você está enfrentando problemas no desenvolvimento do seu WebGIS?
Deixe-me poupar algum tempo da sua frustração, pois você pode estar cometendo alguns erros comuns:
 Pular direto para a codificação sem um roteiro
Seguir tutoriais que só fazem sentido se você já tiver conhecimento dos termos do WebGIS
Tentar construir ferramentas sem entender o fluxo de dados no WebGIS
Perder tempo “ajustando” ferramentas sem ter a mínima ideia de onde o código deveria ficarParece familiar?
Vou te contar alguns “segredos” para o desenvolvimento do seu WebGIS:
 Entenda o fluxo de dados e os termos essenciais
Saiba exatamente quais elementos de programação são essenciais
Domine o uso das bibliotecas WebGIS para obter exatamente o que precisavaGostou desse post? Conte nos comentários
Fonte: webgis.tech
Instagram: [https:]]
LinkedIn: [https:]] -
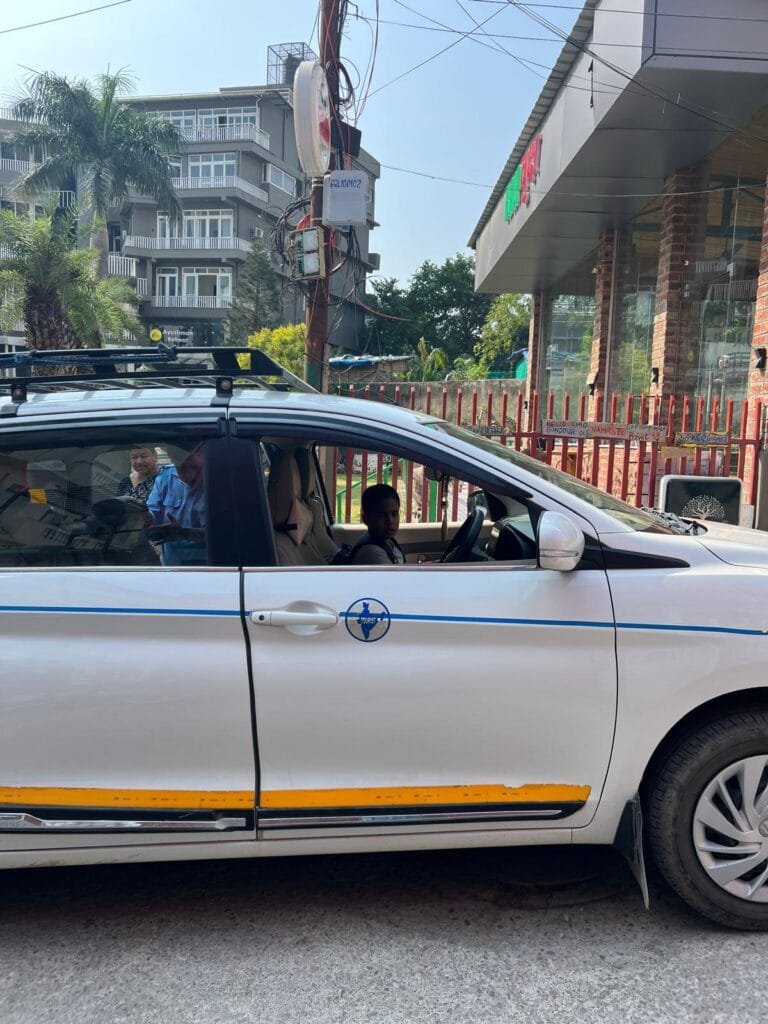
sur Mappery: Indian Taxi
Publié: 3 December 2024, 11:00am CET
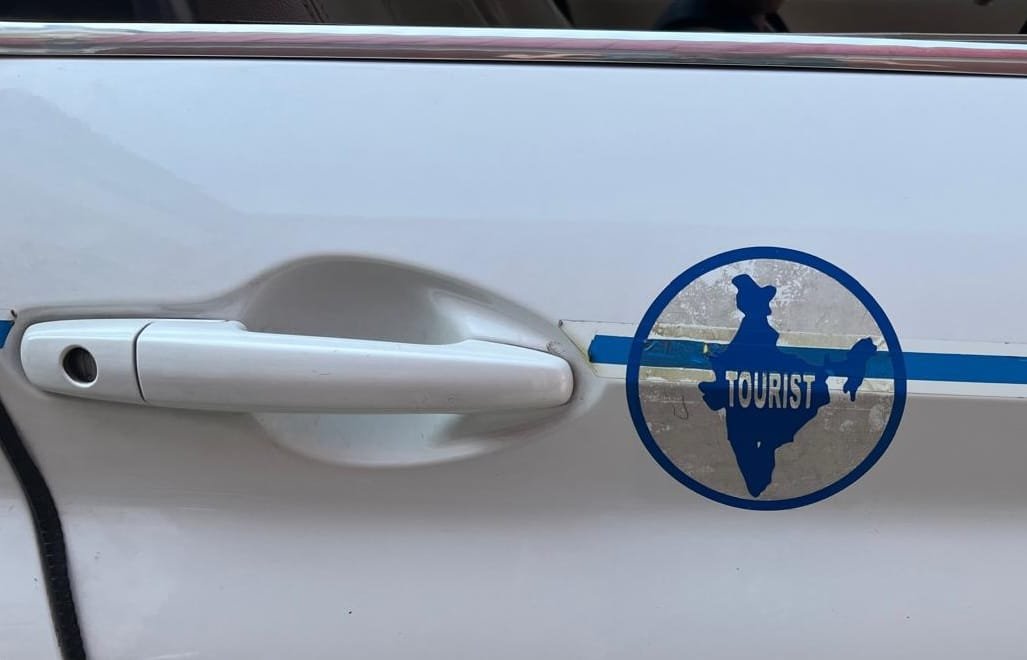

Elizabeth spotted this Map in the Wild on her travels in India
-
sur Camptocamp: Exploring Innovation: Camptocamp at Open Source Experience 2024
Publié: 3 December 2024, 2:00am CET
Pièce jointe: [télécharger]
As a committed contributor to the Open Source Ecosystem, we look forward to presenting two talks that highlight how these technologies address real-world challenges and drive meaningful solutions. -
sur Mappery: Slovenia beer map
Publié: 2 December 2024, 12:00pm CET
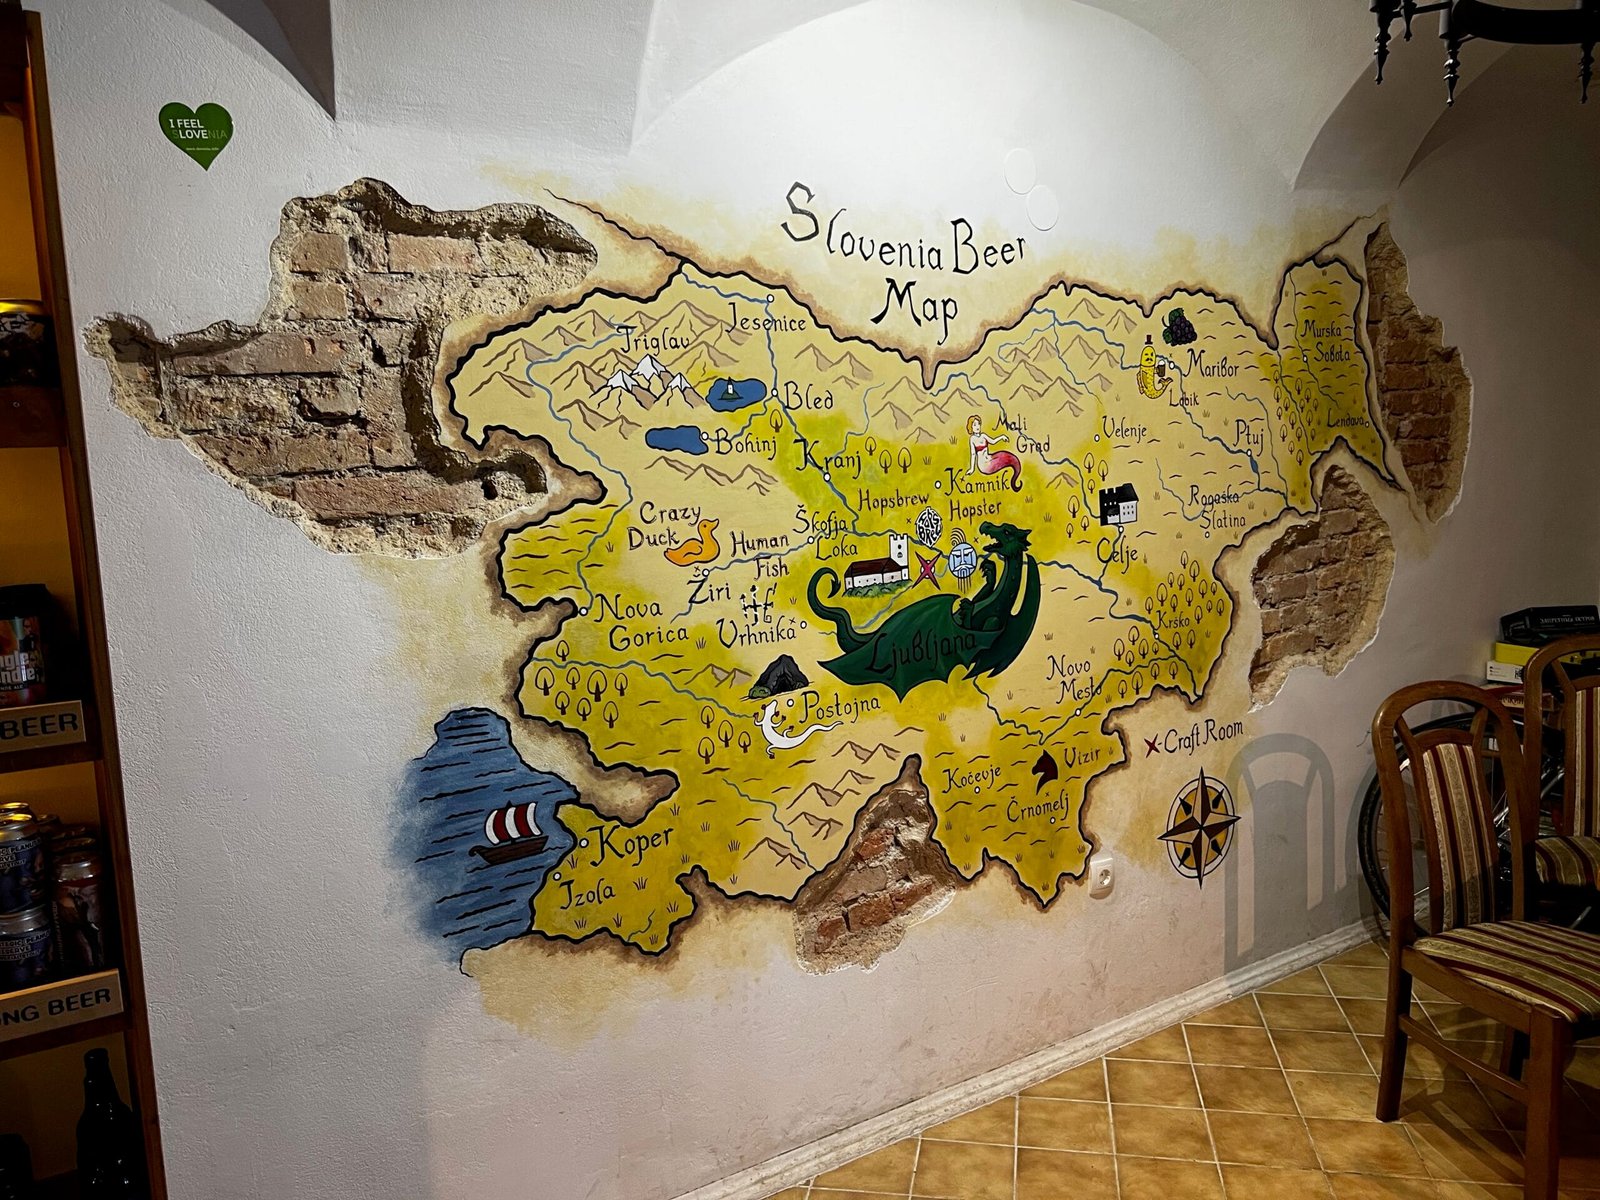

I found this map while visiting a craft beer place named Craft Room, in Ljubljana, Slovenia
-
sur BostonGIS: PostGIS Day 2024 Summary
Publié: 2 December 2024, 12:59am CET
PostGIS Day yearly conference sponsored by Crunchy Data is my favorite conference of the year because it's the only conference I get to pig out on PostGIS content and meet fellow passionate PostGIS users pushing the envelop of what is possible with PostGIS and by extension PostgreSQL. Sure FOSS4G conferences do have a lot of PostGIS content, but that content is never quite so front and center as it is on PostGIS day conferences. The fact it's virtual means I can attend in pajamas and robe and that the videos come out fairly quickly and is always recorded. In fact the PostGIS Day 2024 videos are available now in case you wanted to see what all the fuss is about.
Continue reading "PostGIS Day 2024 Summary" -
sur Mappery: Christmas season begins
Publié: 1 December 2024, 11:00am CET

Raremaps.com (Barry Ruderman) spotted the Christmas decoration at Heceta Head Lighthouse on the Oregon Coast
-
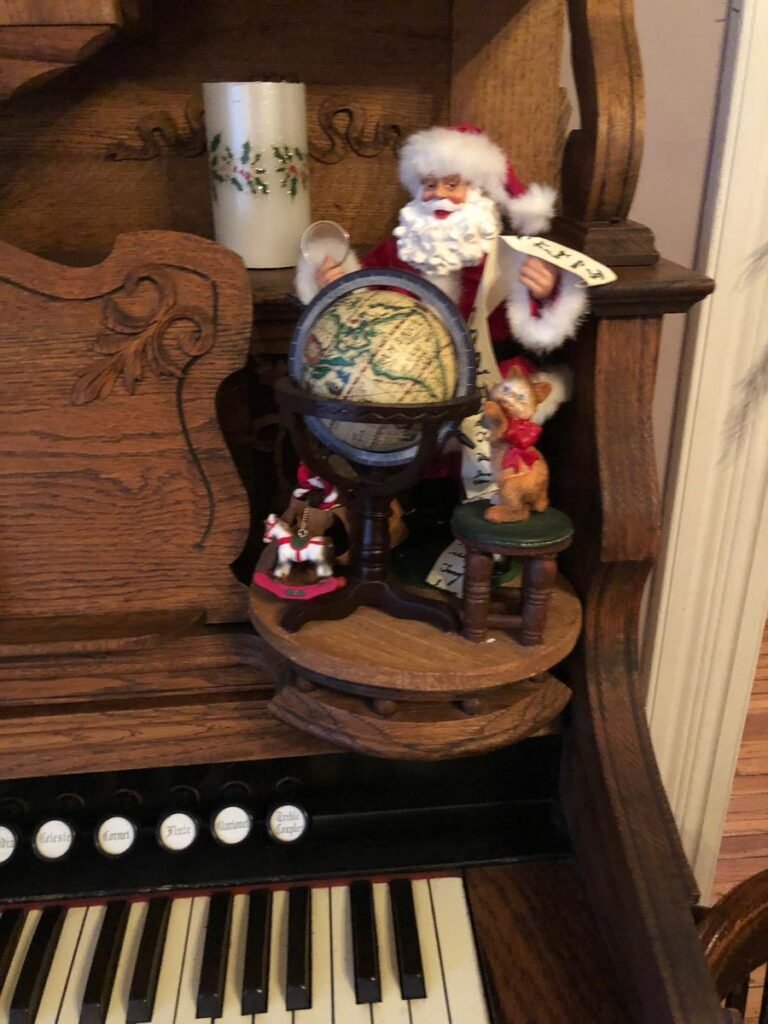
sur Mappery: Wait, is it Halloween?
Publié: 30 November 2024, 12:00pm CET
Pièce jointe: [télécharger]
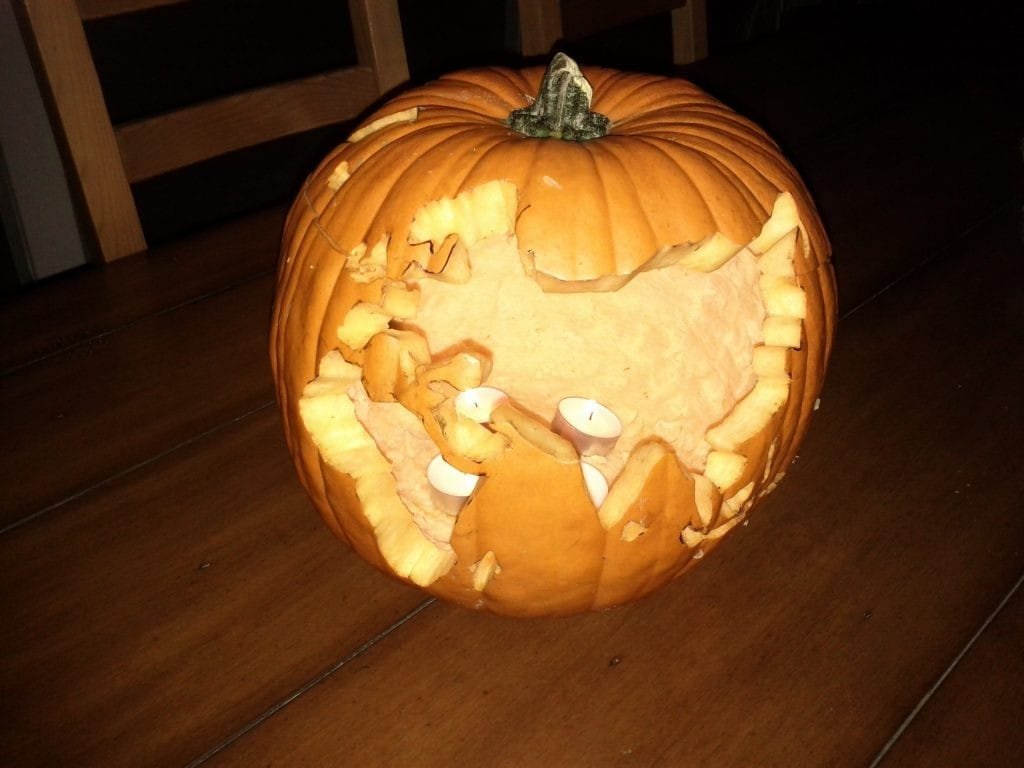
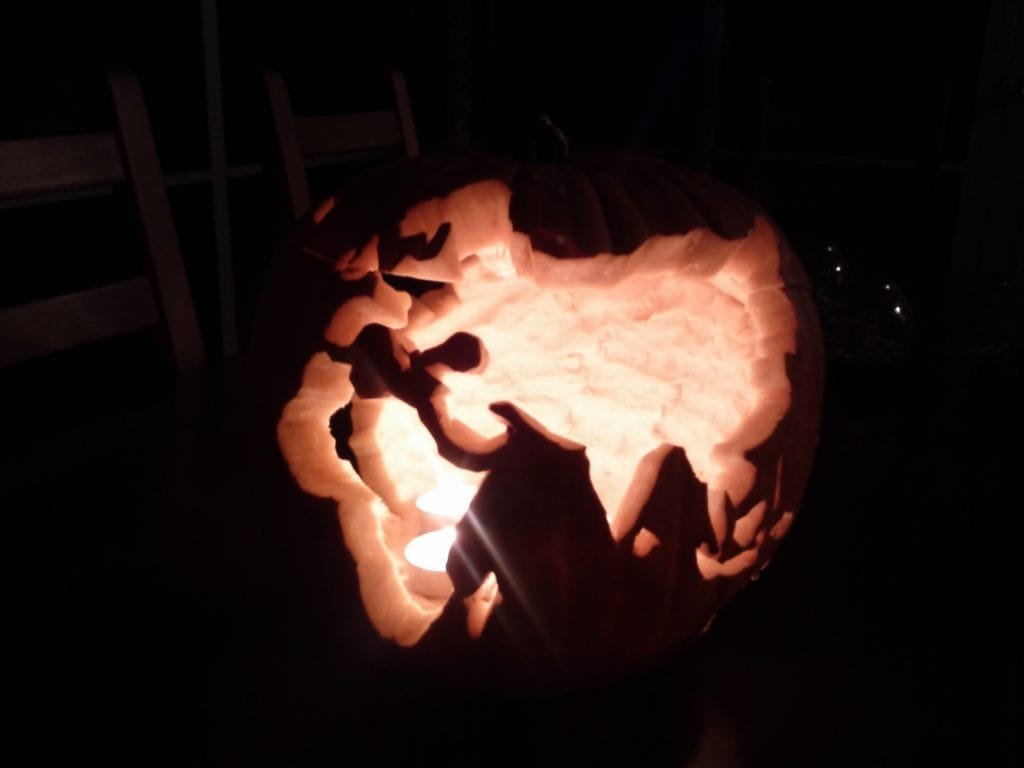
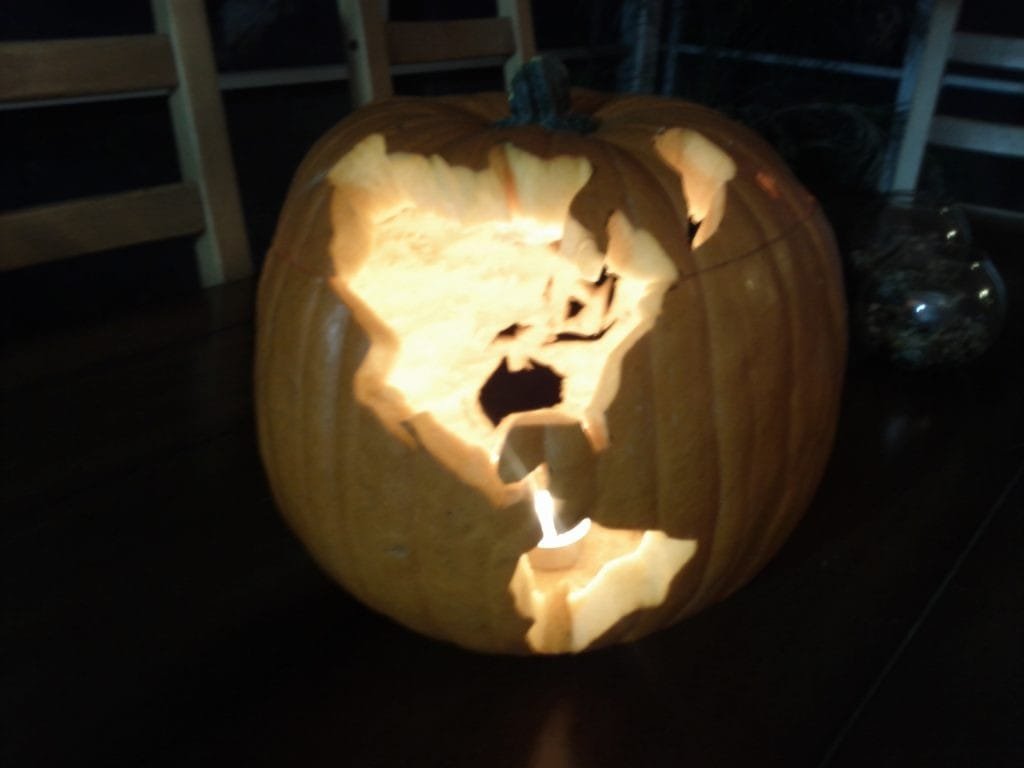
Ken Field once carved a pumpkin, but, of course, it was a globe. It was from Halloween a few years ago.
-
sur Mappery: Franklin D. Roosevelt Presidential Library and Museum
Publié: 29 November 2024, 12:00pm CET
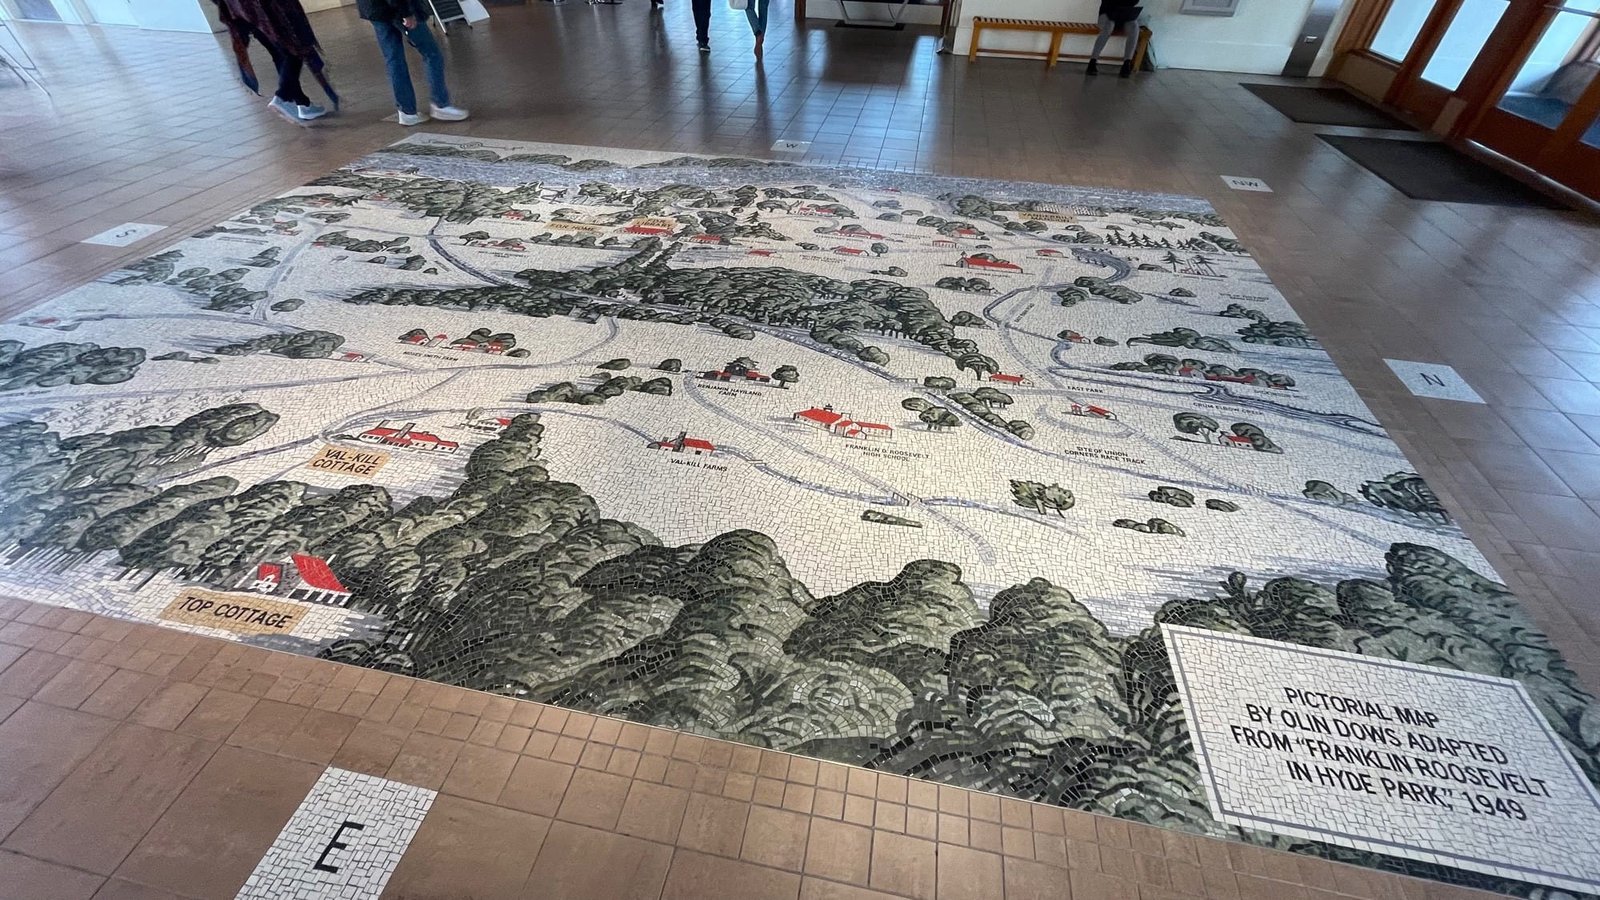
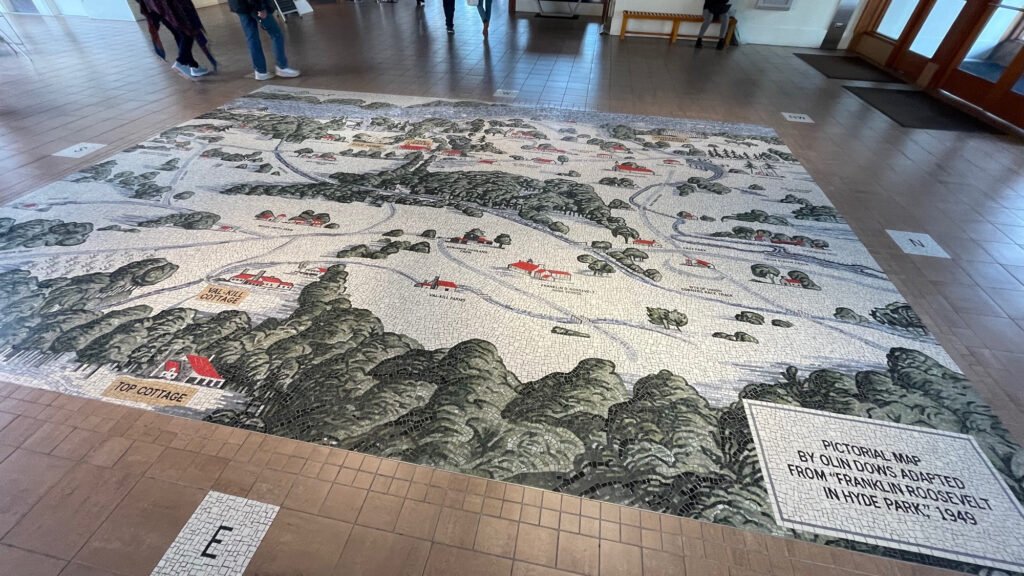
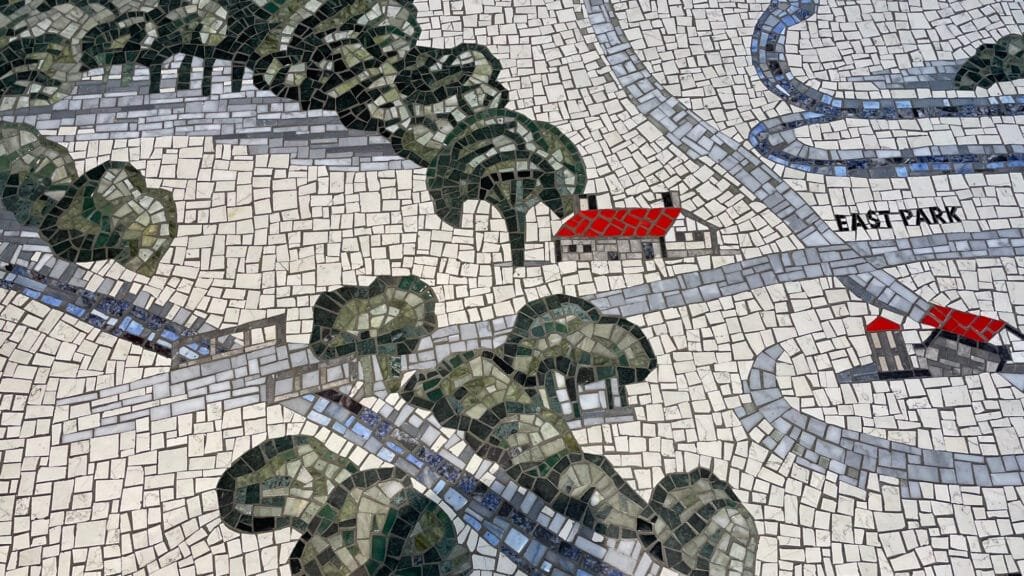
?Rick Lederer-Barnes shared this photos from the Franklin D. Roosevelt Presidential Library and Museum
-
sur Mappery: WGS84
Publié: 28 November 2024, 12:00pm CET
Pièce jointe: [télécharger]

Javier Jimenez Shaw shared this mappy licence plate
-
sur geomatico: Geomatico ya es socio de QGIS España
Publié: 27 November 2024, 3:37pm CET
En Geomatico creemos firmemente en la colaboración como motor para impulsar la innovación y la excelencia en nuestro sector. Por ello, hemos decidido asociarnos a QGIS España, una organización que comparte nuestra pasión por los sistemas de información geográfica (SIG) y el código abierto. Esta alianza refuerza nuestro compromiso con el uso de herramientas accesibles y de alta calidad para ofrecer soluciones geoespaciales avanzadas a nuestros clientes.
Esta asociación nos permitirá estar más conectados con la comunidad de usuarios y desarrolladores de QGIS en España, lo que abre nuevas oportunidades de aprendizaje, intercambio de conocimientos y participación en iniciativas conjuntas. Estamos convencidos de que trabajar de la mano con QGIS España no solo beneficiará a nuestros proyectos actuales, sino que también contribuirá al desarrollo del ecosistema SIG a nivel nacional.

Nuestra asociación con QGIS España también refleja nuestra visión de contribuir activamente al desarrollo de la tecnología SIG open source en el ámbito nacional. Al formar parte de esta comunidad, no solo apoyamos una herramienta clave en nuestro sector, sino que también fomentamos el avance de soluciones de código abierto que promueven la sostenibilidad y la accesibilidad tecnológica.
-
sur Mappery: Florentine Map Window
Publié: 27 November 2024, 11:00am CET

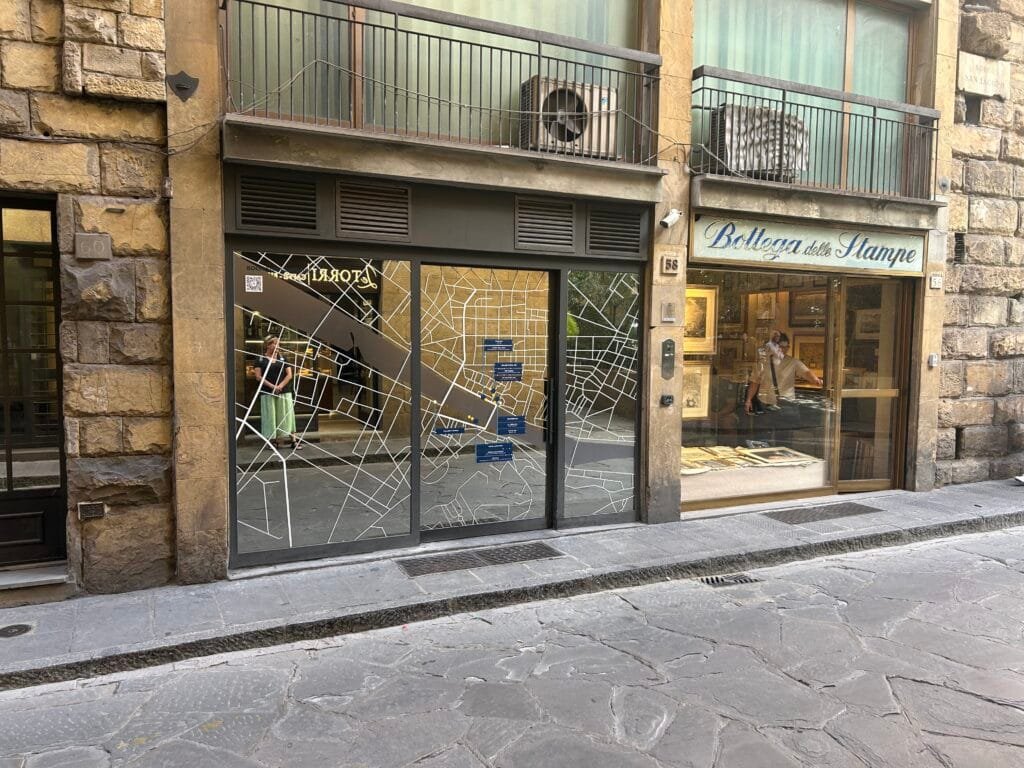
David Sherren said “I spotted this rather attractive office window in the Borgo San Jacopo, Florence, promoting a collection of hotels. As a bonus, there were some nice maps for sale at the print dealer next door.”
I’m a bit confused by some of the writing being on the inside of the window.
-
sur Mappery: At York Station
Publié: 26 November 2024, 12:00pm CET

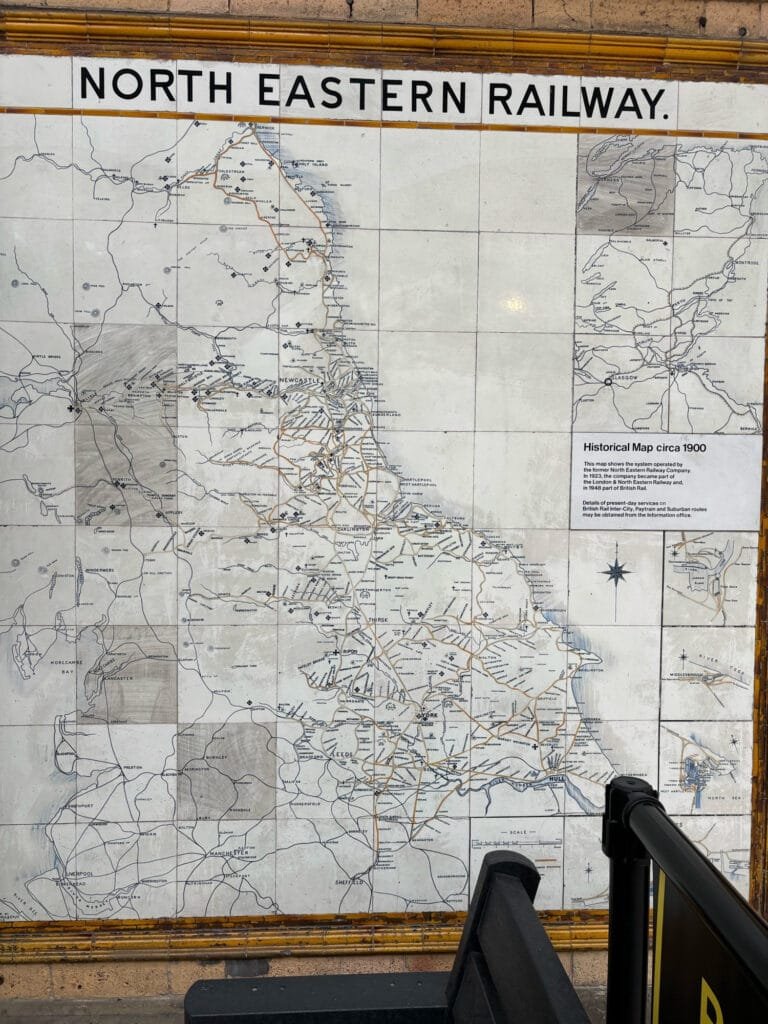
Photo from Doug Greenfield
-
sur Mappery: Global incarceration rates
Publié: 25 November 2024, 12:00pm CET
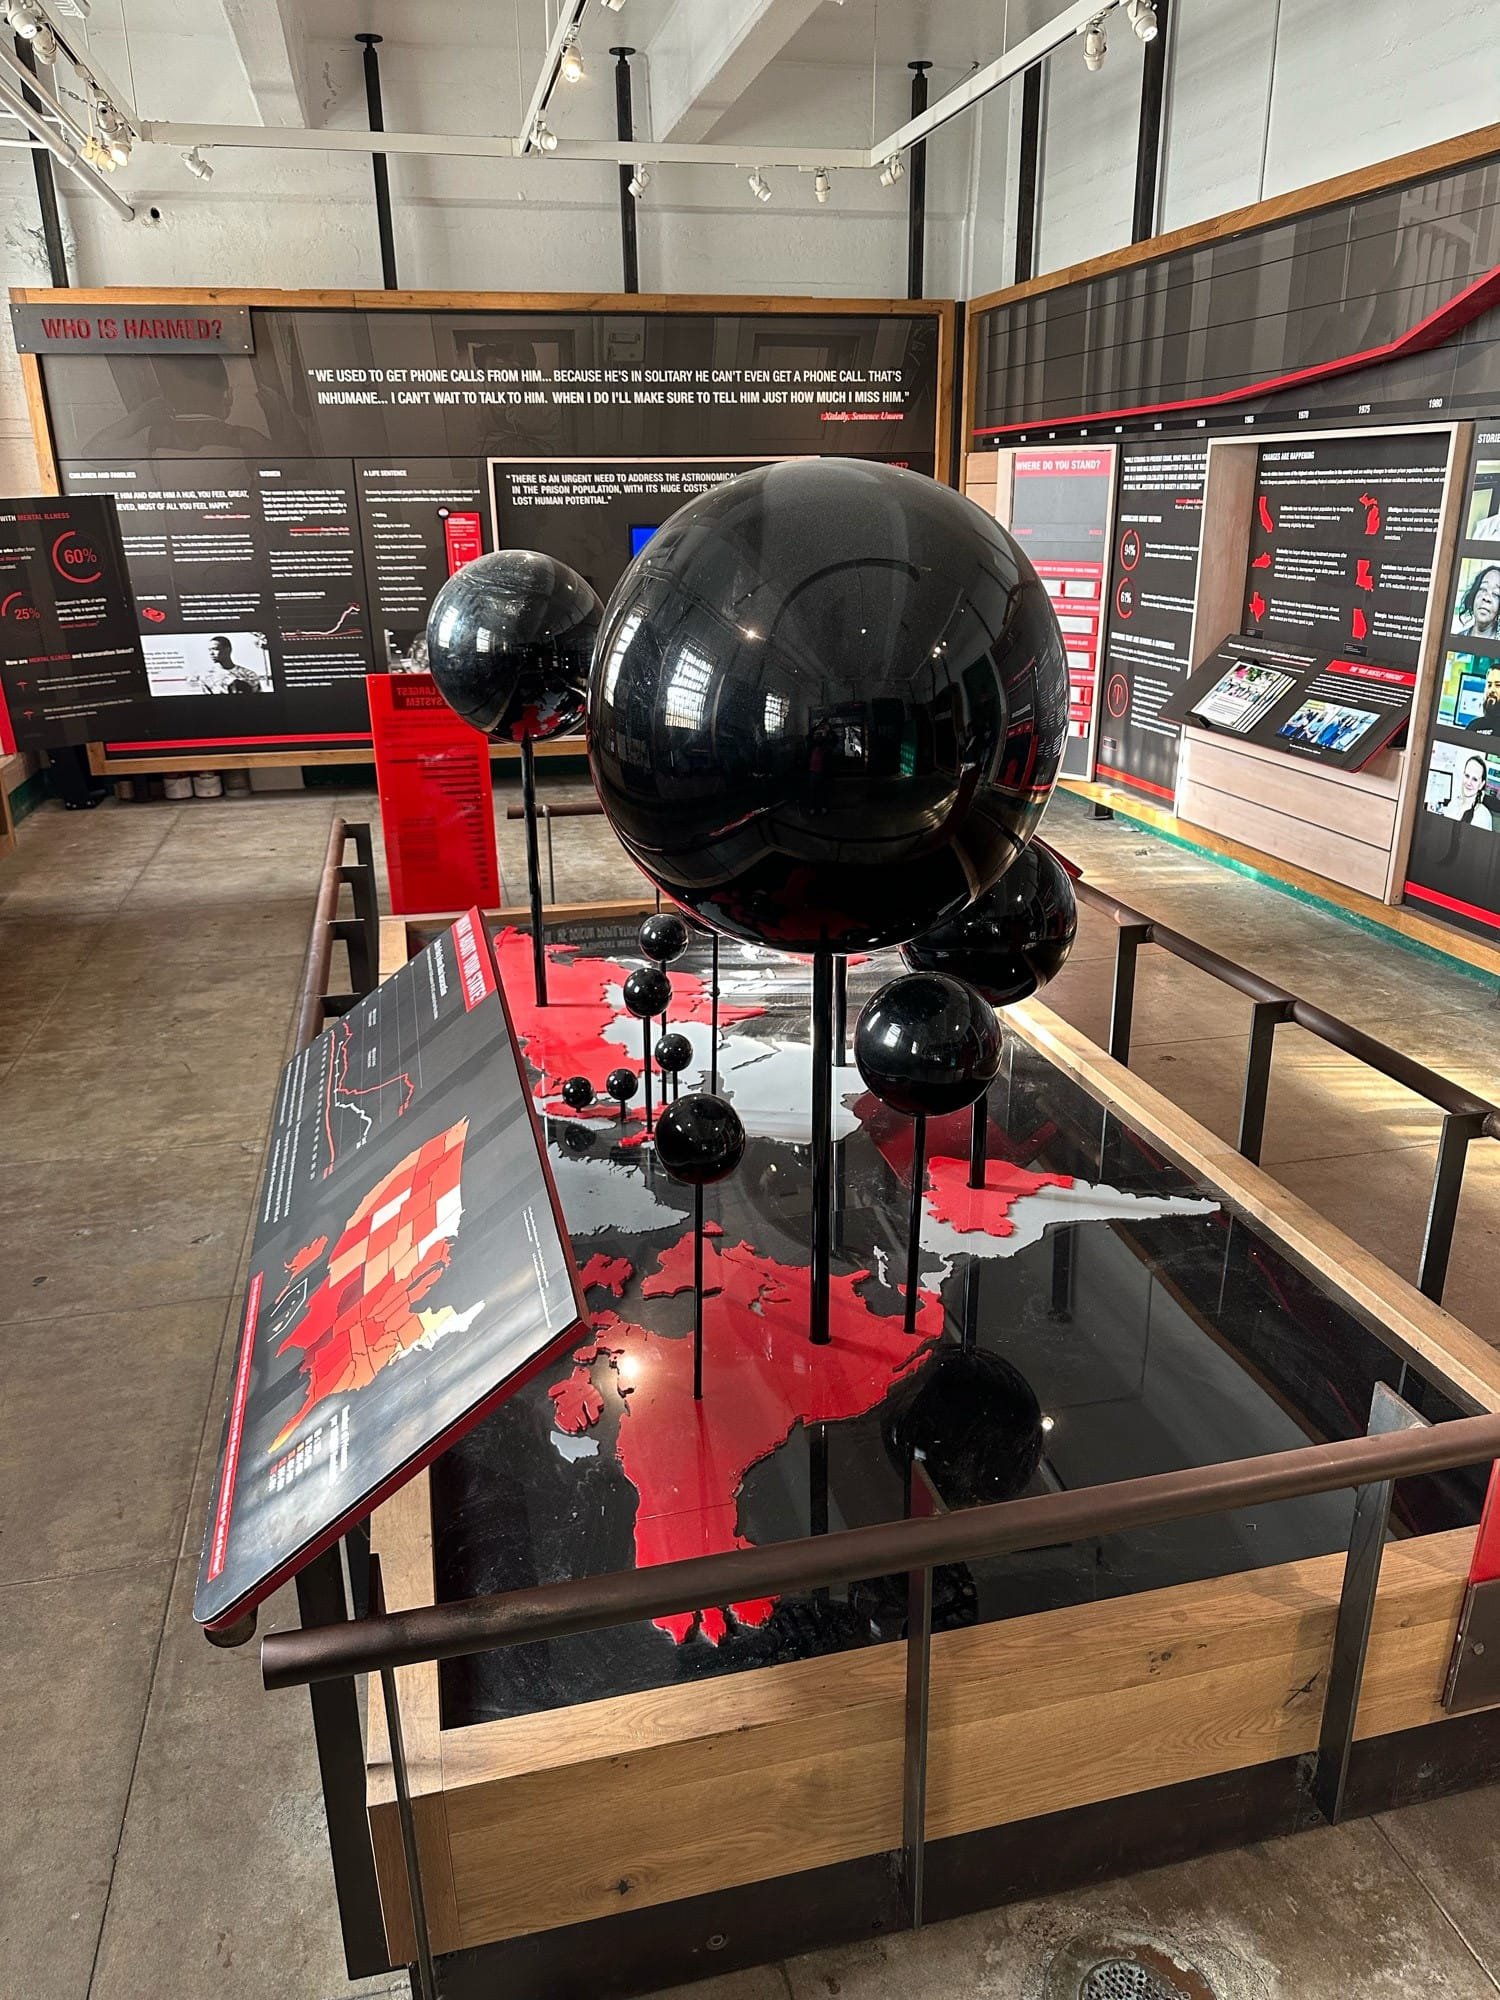

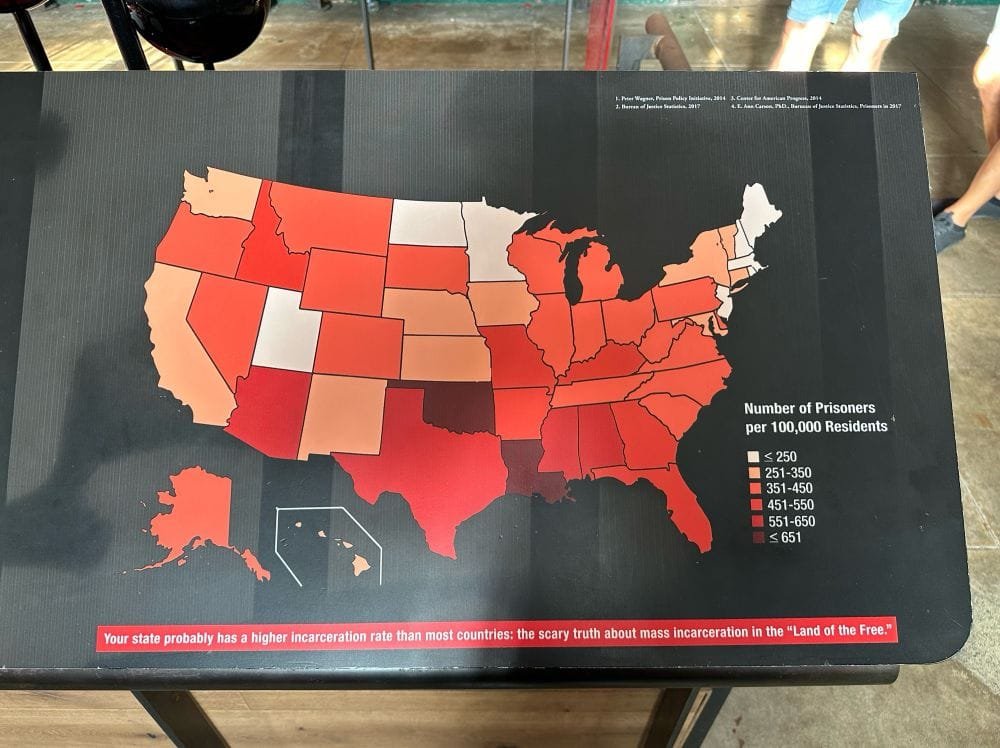
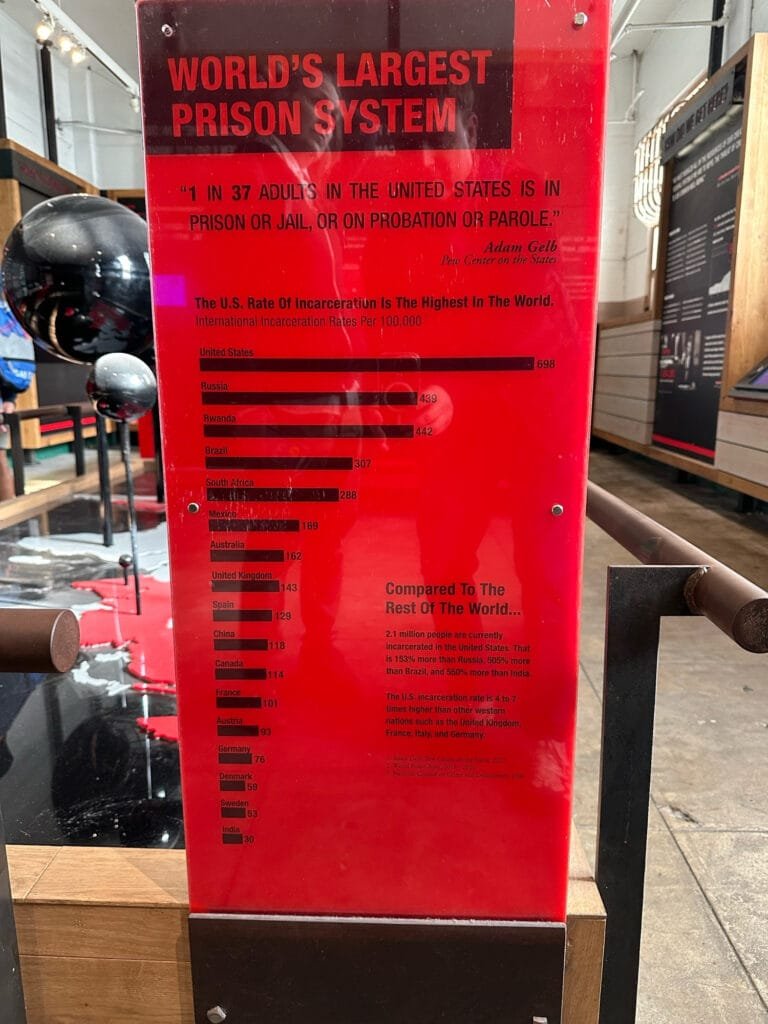
Robert Simmon comments on the Global incarceration rates displayed in Alcatraz: “The Park Service is doing a great job of having a point of view with an almost purely data-driven design”.
-
sur From GIS to Remote Sensing: Tutorial: Download Sentinel-2 data and calculate the NDVI in Python using Remotior Sensus
Publié: 24 November 2024, 4:21pm CET
 This post is about Remotior Sensus, a Python package that allows for the processing of remote sensing images and GIS data.In this tutorial we'll see how to search and download Sentinel-2 images and calculate the Normalized Difference Vegetation Index (NDVI) using Remotior Sensus.Following the video of this tutorial.
Read more » -
sur Mappery: Plantage district Amsterdam
Publié: 24 November 2024, 12:00pm CET
-
sur Free and Open Source GIS Ramblings: GeoParquet in QGIS – smaller & faster files for the win!
Publié: 23 November 2024, 11:23pm CET
tldr; Tired of working with large CSV files? Give GeoParquet a try!
“Parquet is a powerful column-oriented data format, built from the ground up to as a modern alternative to CSV files.” [https:]]
(Geo)Parquet is both smaller and faster than CSV. Additionally, (Geo)Parquet columns are typed. Text, numeric values, dates, geometries retain their data types. GeoParquet also stores CRS information and support in GIS solutions is growing.
I’ll be giving a quick overview using AIS data in GeoPandas 1.0.1 (with pyarrow) and QGIS 3.38 (with GDAL 3.9.2).
File sizeThe example AIS dataset for this demo contains ~10 million rows with 22 columns. I’ve converted the original zipped CSV into GeoPackage and GeoParquet using GeoPandas to illustrate the huge difference in file size: ~470 MB for GeoParquet and zipped CSV, 1.6 GB for CSV, and a whopping 2.6 GB for GeoPackage:
 Reading performance
Pandas and GeoPandas both support selective reading of files, i.e. we can specify the specific columns to be loaded. This does speed up reading, even from CSV files:
Whole file Selected columns CSV 27.9 s 13.1 s Geopackage 2min 12s 
20.2 s GeoParquet 7.2 s 4.1 s Indeed, reading the whole GeoPackage is getting quite painful.
Here’s the code I used for timing the read times:

As you can see, these times include the creation of the GeoPandas.GeoDataFrame.
If we don’t need a GeoDataFrame, we can read the files even faster:
Non-spatial DataFramesGeoParquet files can be read by non-GIS tools, such as Pandas. This makes it easier to collaborate with people who may not be familiar with geospatial data stacks.
And reading plain DataFrames is much faster than creating GeoDataFrames:

But back to GIS …
GeoParquet in QGISIn QGIS, GeoParquet files can be loaded like any other vector layer, thanks to GDAL:

Loading the GeoParquet and GeoPackage files is pretty quick, especially if we zoom into a small region of interest (even though, unfortunately, it doesn’t seem possible to restrict the columns to further speed up loading). Loading the CSV, however, is pretty painful due to the lack of spatial indexing, which becomes apparent very quickly in the direct comparison:
 (You can see how slowly the red CSV points are rendering. I didn’t have the patience to include the whole process in the GIF.)
As far as I can tell, my QGIS 3.38 ‘Grenoble’ does not support writing to or editing of GeoParquet files. So I’m limited to reading GeoParquet for now.
However, seeing how much smaller GeoParquets are compared to GeoPackages (and also faster to write), I hope that we will soon get the option to export to GeoParquet.
For now, I’ll start by converting my large CSV files to GeoParquet using GeoPandas.
More readingIf you’re into GeoJSON and/or PyGeoAPI, check out Joana Simoes’ post: “Navigating GeoParquet: Lessons Learned from the eMOTIONAL Cities Project”
And if you want to see a global dataset example, have a look at Matt Travis’ presentation using Overture data:
-
sur Mappery: Upside down
Publié: 23 November 2024, 12:00pm CET


Michaël Galien shared this photo of a former globe converted into a lamp, placing the South on top of it

-
sur Mappery: Chopping boards
Publié: 22 November 2024, 12:00pm CET


Cartonaut saw these chopping boards at Costco
-
sur Mappery: Underground at St Pancras
Publié: 21 November 2024, 12:00pm CET
Pièce jointe: [télécharger]

Doug Greenfield shared this map situated in the underground at St Pancras
-
sur Mappery: Florida place mat
Publié: 20 November 2024, 12:00pm CET

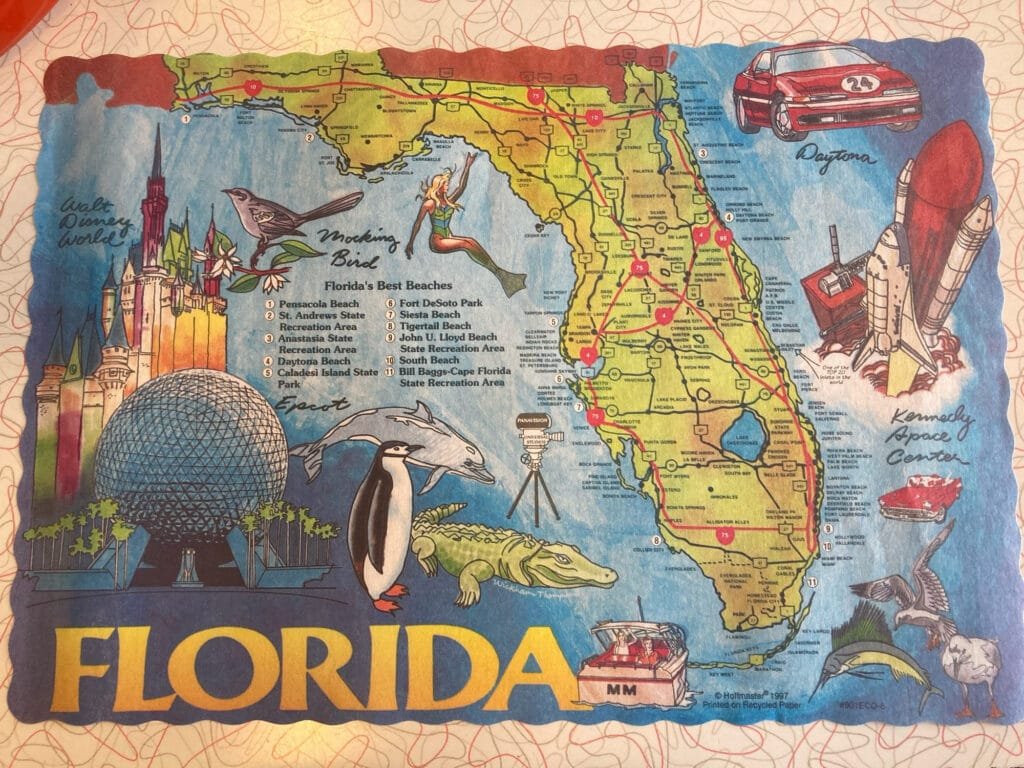
Courtney Shannon shared this place mat
-
sur OSGeo Announcements: [OSGeo-Announce] FOSS4G Europe 2024 Tartu final press release
Publié: 19 November 2024, 11:05pm CET
News item: FOSS4G Europe 2024 Tartu final press release - OSGeo
November 2024Dear OSGeo community,
it has now been some months since FOSS4G Europe 2024 in Tartu, Estonia.
We, the LOC would like to thank you all for your participation, either on site or via the interwebs, for your proposals for presentations and workshops - you helped us put together this amazing event in our hometown. You've helped us create something that will always have a very special place in our hearts.
The final press-release for FOSS4G Europe 2024 is - finally
 - ready and can be accessed under the foundation news at osgeo.org [1]. Further links to photos, presentation videos on TIB-AV portal and YouTube, and to the academic track proceedings are all in there.
We hope you enjoyed your time in Tartu, and in the surrounding areas if you had time to explore a bit more.
So one last time - on behalf of the FOSS4G Europe 2024 LOC, thank you and see you very soon.
Tõnis Kärdi
FOSS4G Europe 2024 chair[1] - FOSS4G Europe 2024 Tartu final press release - OSGeo
About FOSS4G Europe
--------------------------------
The FOSS4GE conference, a European extension of the Open Source Geospatial Foundation (OSGeo) annual FOSS4G event, connects professionals in the geoinformation software realm. FOSS4G Europe 2024 in Tartu was the eastern and northernmost (and as it turned out - largest) ever FOSS4G Europe conference to date. 2024.europe.foss4g.org
FOSS4G Europe 2024
2024.europe.foss4g.org
FOSS4G Europe 2024
The FOSS4G Europe 2024 conference is taking place 1-7 July in the beautiful city of Tartu, Estonia.
 OSGeo
OSGeo
 FOSS4G (Events) - OSGeo
With a robust schedule of keynote speakers, workshops, paper sessions and talks, FOSS4G offers a great opportunity for newcomers and regular visitors alike. This ‘annual gathering of the tribes’ boasts: A massive selection of presentations A...
Est. reading time: 2 minutes
About OSGeo
-------------------
The Open Source Geospatial Foundation (OSGeo) is a non-profit
organization dedicated to the development and promotion of open-source
geospatial technologies and data. OSGeo serves as an umbrella
organization for the collaborative development of open source
geospatial software, and provides financial, organizational, and legal
support to the broader geospatial community.
OSGeo
OSGeo - OSGeo
OSGeo, the OpenSource for GeoSpatial Fosters global adoption of open geospatial technology by being an inclusive software foundation.
_______________________________________________
Announce mailing list
Announce@lists.osgeo.org
[https:]]1 post - 1 participant
-
sur GeoTools Team: GeoTools 32.1 released
Publié: 19 November 2024, 9:53pm CET
GeoTools 32.1 released The GeoTools team is pleased to announce the release of the latest stable version of GeoTools 32.1: geotools-32.1-bin.zip geotools-32.1-doc.zip geotools-32.1-userguide.zip geotools-32.1-project.zip This release is also available from the OSGeo Maven Repository and is made in conjunction with GeoServer 2.26.1 and GeoWebCache 1.26.1. -
sur OSGeo Announcements: [OSGeo-Announce] Welcoming our new OSGeo Charter Members 2024
Publié: 19 November 2024, 9:51pm CET
News item: Welcoming our new OSGeo Charter Members 2024 - OSGeo
November 2024OSGeo would like to welcome our new OSGeo Charter Members 2024.
We are happy to announce that the following people were accepted as OSGeo Charter Members:
Alberto Vavassori from Italy
Caitlin Haedrich from United States of America
Cholena Smart from Australia
Claudio Iacopino from Italy
Dave Barter from United Kingdom
Felipe Matas from Chile
Gresa Neziri from Kosovo
Hamidreza Ostadabbas from Iran
Mathieu Pellerin from Cambodia
Matthias Daues from Germany
Maxime Collombin from Switzerland
Petr Sevcik from Czech Republic
Ponciano da Costa de Jesus from Timor-Leste
Sami Mäkinen from Finland
Scott McHale from Canada
Tobias Wendorff from Germany
Vasil Yordanov from Bulgaria
Vincent Sarago from France
William Dollins from United States of America
Youssef Harby from EgyptYou are welcome to find out about our new members at the following page New Member Nominations 2024 - OSGeo
In 2024, we had 21 valid nominations and all were accepted.
This year 300 charter members casted their vote.
The board approved the new members in November 2024.OSGeo has 580 charter members
- from 74 countries
- 11 are retiredThanks a lot to Luís Moreira de Sousa, Iván Sánchez Ortega, Vicky Vergara (2024 OSGeo Elections CROs) for organizing the OSGeo Election 2024.
Share thisSee the full list of the OSGeo Charters member and find a link to every profile page there [https:]]
About OSGeo
-------------------
The Open Source Geospatial Foundation (OSGeo) is a non-profit
organization dedicated to the development and promotion of open-source
geospatial technologies and data. OSGeo serves as an umbrella
organization for the collaborative development of open source
geospatial software, and provides financial, organizational, and legal
support to the broader geospatial community.
OSGeo
OSGeo - OSGeo
OSGeo, the OpenSource for GeoSpatial Fosters global adoption of open geospatial technology by being an inclusive software foundation.
_______________________________________________
Announce mailing list
Announce@lists.osgeo.org
[https:]]1 post - 1 participant
-
sur GeoSolutions: FREE Webinar: MapStore at work, NORDIQ webgis product
Publié: 19 November 2024, 12:09pm CET
You must be logged into the site to view this content.
-
sur Mappery: Traveling seeds
Publié: 19 November 2024, 12:00pm CET
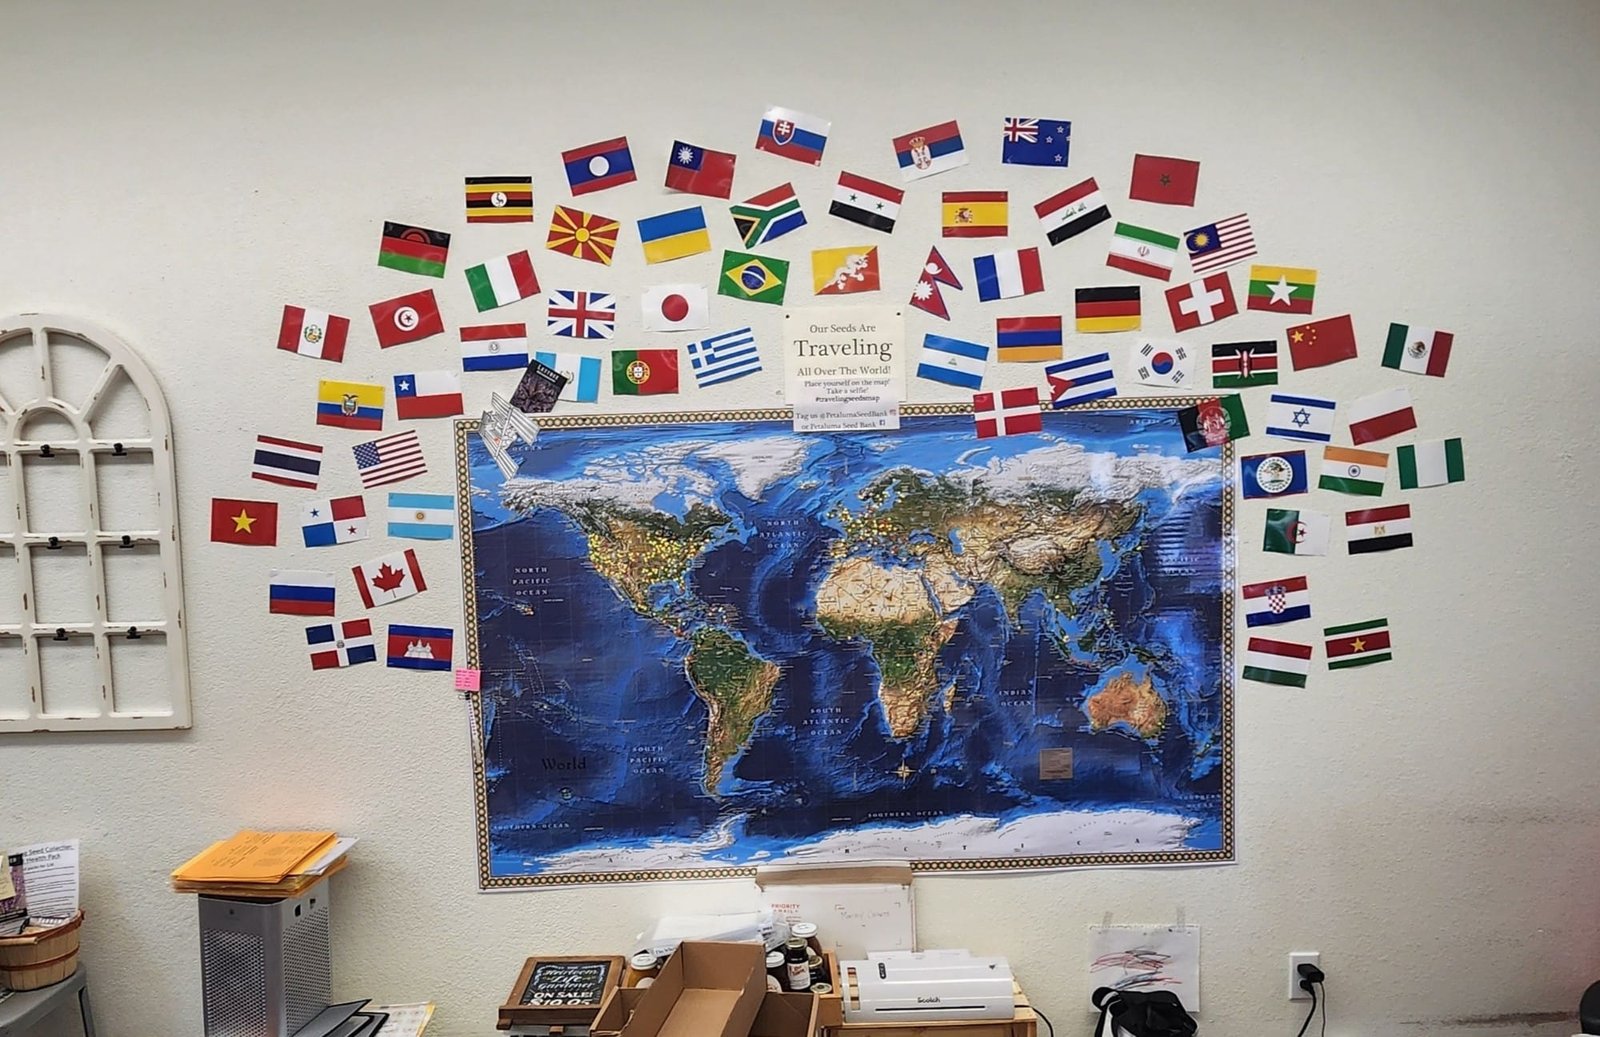
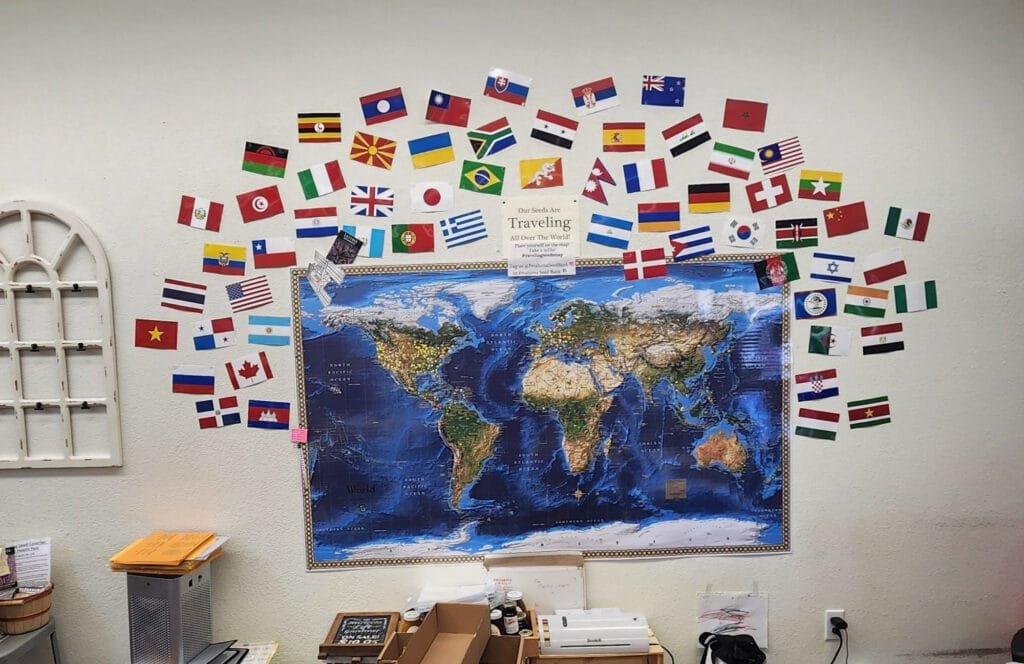
Seed store map of where they ship their heirloom seed. Source: Cartonaut
-
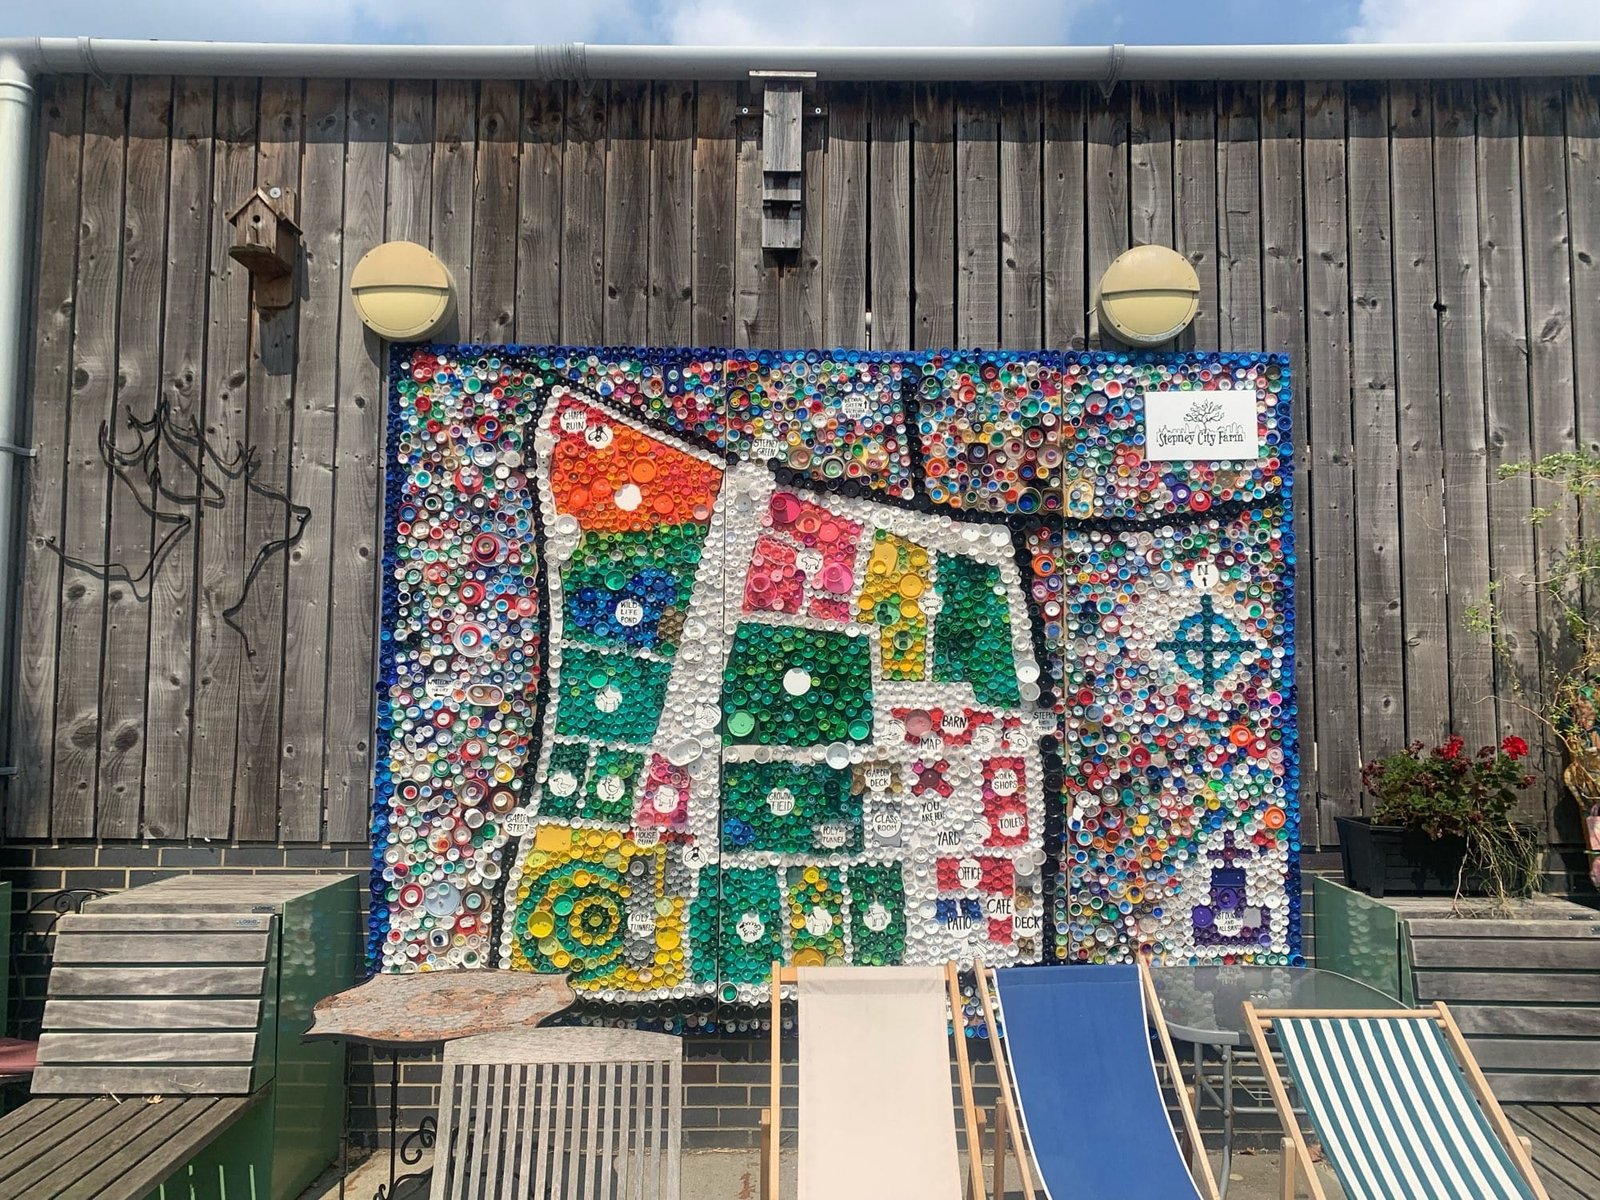
sur Mappery: Stepney City Farm
Publié: 18 November 2024, 12:00pm CET

Source: The Geospatial Index
-
sur Sean Gillies: Python typing mulligan
Publié: 18 November 2024, 4:16am CET
This is why I've been hesitant to add type hints to Fiona, Rasterio, and Shapely. David Lord on missteps and misgivings:
I want a "start over" tool for type annotating a Python library. I started with Flask as untyped code, then added annotations until mypy stopped complaining. But this didn't mean the annotations were _correct_. Over time I've fixed various reported issues. I feel like if I could start from scratch again, I'd probably get closer to correct with the experience I've gained. But removing all existing annotations and ignores is too time consuming on its own. #python
-
sur GeoServer Team: GeoServer 2.26.1 Release
Publié: 18 November 2024, 2:00am CET
GeoServer 2.26.1 release is now available with downloads (bin, war, windows), along with docs and extensions.
This is a stable release of GeoServer recommended for production use. GeoServer 2.26.1 is made in conjunction with GeoTools 32.1, and GeoWebCache 1.26.1.
Thanks to Peter Smythe (AfriGIS) for making this release.
Security ConsiderationsThis release addresses security vulnerabilities and is considered an important upgrade for production systems.
- GEOS-11557 CVE-2024-45748 High. The details will be released later.
See project security policy for more information on how security vulnerabilities are managed.
Release notesImprovement:
- GEOS-11557 CVE-2024-45748 High
- GEOS-11561 Client-Delegating MapML Proxy
- GEOS-11588 GWC disk quota, check JDBC connection pool validation query
Bug:
- GEOS-11524 csw: default queryables mapping not generated
- GEOS-11543 Unable to use propertyName to filter properties in a GetFeature request when service is not set
- GEOS-11553 SLD Style: Empty SE Rotationelement throws RuntimeException (QGIS generated SLD)
- GEOS-11556 NullPointerException when GWC disk quota monitoring is disabled
- GEOS-11559 The customized attributes editor is prone to setting the wrong attribute source
- GEOS-11573 TileLayer preview doesn’t work anymore
Task:
- GEOS-11574 Bump org.eclipse.jetty:jetty-server from 9.4.52.v20230823 to 9.4.55.v20240627 in /src
- GEOS-11587 Update map fish-print-v2 2.3.2 - see new MAPFISH_PDF_FOLDER configuration option
- GEOS-11609 Bump XStream from 1.4.20 to 1.4.21
- GEOS-11610 Update Jetty from 9.4.55.v20240627 to 9.4.56.v20240826
For the complete list see 2.26.1 release notes.
Community UpdatesCommunity module development:
- GEOS-11107 Open search for EO community module: packaging missing gt-cql-json-xx.x.jar
- GEOS-11517 Using various OGC APIs results in service enabled check related WARN logs
- GEOS-11560 OGC API modules lack cql2-json in assembly
- GEOS-11563 Allow configuring a DGGS resolution offset on a layer basis
- GEOS-11565 Allow configuring the minimum and maximum DGGS resolution for a layer
- GEOS-11579 DGGS modules prevent GeoServer startup if JEP is not installed
Community modules are shared as source code to encourage collaboration. If a topic being explored is of interest to you, please contact the module developer to make contact and offer assistance, even if it is just to say that it works for you.
About GeoServer 2.26 SeriesAdditional information on GeoServer 2.26 series:
-
sur From GIS to Remote Sensing: Tutorial: Create a Sentinel-2 high resolution jpg image Using Remotior Sensus
Publié: 17 November 2024, 2:57pm CET
This is a tutorial about Remotior Sensus, a Python package that allows for the processing of remote sensing images and GIS data.In particular, this tutorial illustrates how to create a high resolution jpg image from a Sentinel-2 image. Of course, this tutorial could be extended to other satellite images such as Landsat.Following the video of this tutorial.
Read more » -
sur Mappery: Hank’s chalk map
Publié: 17 November 2024, 12:00pm CET

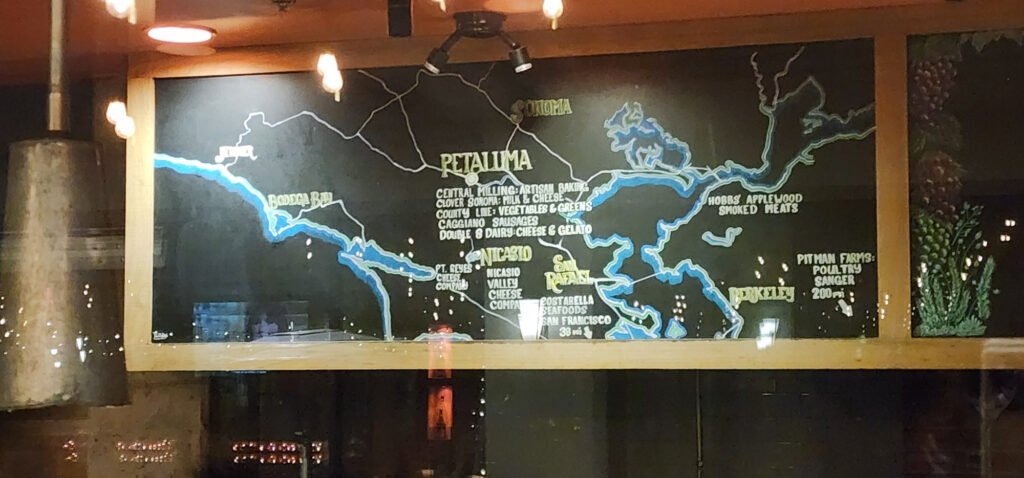
An enthusiastic chalk map on the menu board at Hank’s. Source: Cartonaut
-
sur From GIS to Remote Sensing: Semi-Automatic Classification Plugin major update: version 8.5
Publié: 16 November 2024, 2:20pm CET
-
sur Mappery: New Mexico
Publié: 16 November 2024, 12:00pm CET
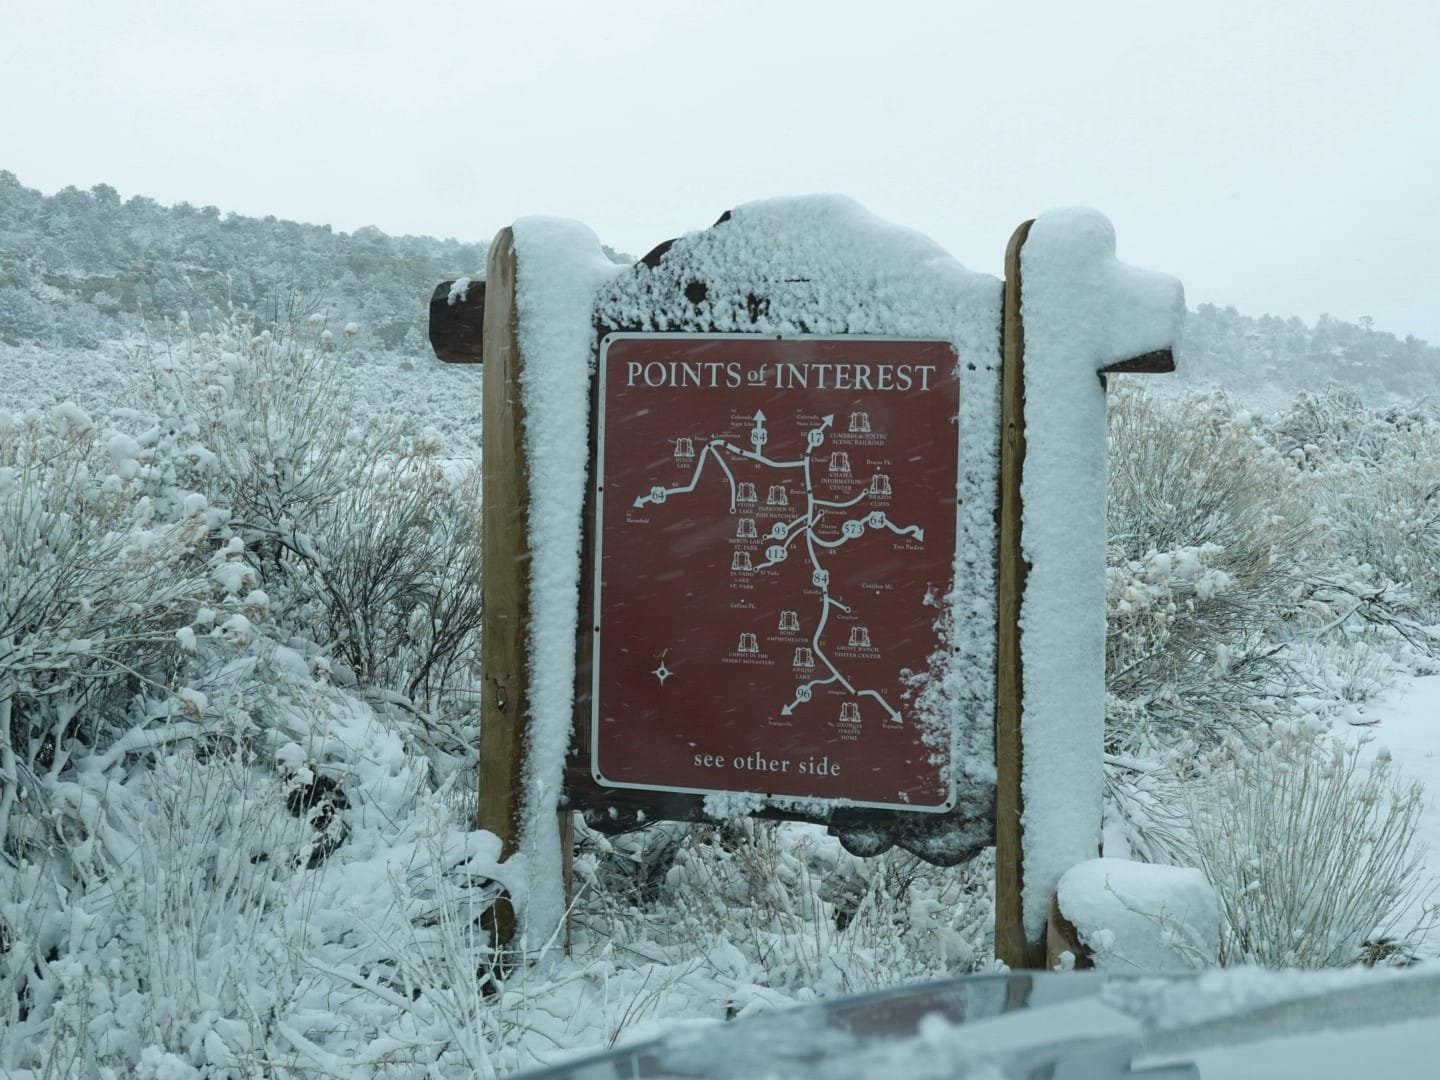

Jami wrote New Mexico has a lot of Maps In The Wild
-
sur gvSIG Batoví: Finalizó el VII Curso–Concurso Geoalfabetización mediante la utilización de Tecnologías de la Información Geográfica
Publié: 15 November 2024, 9:36pm CET

Un año más de excelentes proyectos desarrollados por estudiantes de todo el país que han decidido animarse y experimentar con el uso de las Tecnologías de Información Geográfica. Y una vez más estos estudiantes nos sorprenden con el nivel y la calidad de sus trabajos, logrados en apenas 3 meses, debiendo además atender todas sus otras responsabilidades que el estudio les exige.

Ya son más de 1000 docentes y estudiantes (no sólo de Uruguay, sino que también de México -en 2022- y Colombia -en 2023-) que han participado de esta iniciativa que nació en 2017 y que se realiza anualmente desde entonces, solamente interrumpiéndose en 2020, especialmente por la pandemia del COVID-19.

Este año nos acompañaron como tutores de los equipos concursantes:
- Romel Vázquez, Universidad Central «Marta Abreu» de Las Villas (Cuba)
- Ramon Alejandro Claro Torres, Universidad Central «Marta Abreu» de Las Villas (Cuba)
- Williams Luis Morales Moya, Universidad Central «Marta Abreu» de Las Villas (Cuba)
- Neftalí Sillero, Faculdade de Ciências da Universidade do Porto (Portugal)
- Carlos Lara, Facultad de Ciencias de la Universidad Católica de la Santísima Concepción (Chile)
- A/P Nadia Chaer, Comunidad gvSIG Uruguay (Uruguay)
- Lic. Maximiliano Olivera, profesor de Geografìa, CeRP del Litoral (Uruguay)
- Antoni Pérez Navarro, profesor de los Estudios de Informática, Multimedia y Telecomunicación, Universitat Oberta de Catalunya (España)
- Agustín Reyna, Dirección Nacional de Topografía (Uruguay)
El jurado estuvo integrado por:
- por el Ministerio de Transporte y Obras Públicas: Arq. Sergio Acosta y Lara
- por la Dirección General de Educación Secundaria: Insp. Mónica Canaveris
- por Ceibal: Mag. Lic. Sofía García
- por la Dirección de Educación Técnico Profesional: Prof. Julio A. Rodríguez
- por la Universidad Politécnica de Madrid: Dr. Luis Manuel Vilches Blázquez
- por la Asociación Nacional de Profesores de Geografía: Prof. Irene Lucía Knecht Santana
- Por la Universidad Central «Marta Abreu» de Las Villas: Dr. Mikel Moreno Hernández
A continuación, los videos de los proyectos ganadores:
Una vez más debemos agradecer a todas y todos los que han hecho posible que esto sucediera: al equipo del MTOP; a las y los tutores; a los integrantes del jurado; a todas y todos los colaboradores en el Plan Ceibal (gracias por su invalorable asistencia); a toda la Asociación gvSIG (gracias a su incansable apoyo es que este proyecto es posible); a la ANEP, en especial a la Dirección General de Educación Secundaria pero también a la Dirección General de Educación Técnico Profesional; a la Universidad Politécnica de Madrid; a las instituciones que este año nos han apoyado: Universidad Central Marta Abreu de Las Villas y la Asociación Nacional de Profesores de Geografía; y a todas las autoridades de las instituciones involucradas que han decidido continuar apoyando esta iniciativa, la que continúa creciendo.
Nos vemos el año que viene
-
sur Mappery: Muir Beach
Publié: 15 November 2024, 12:00pm CET
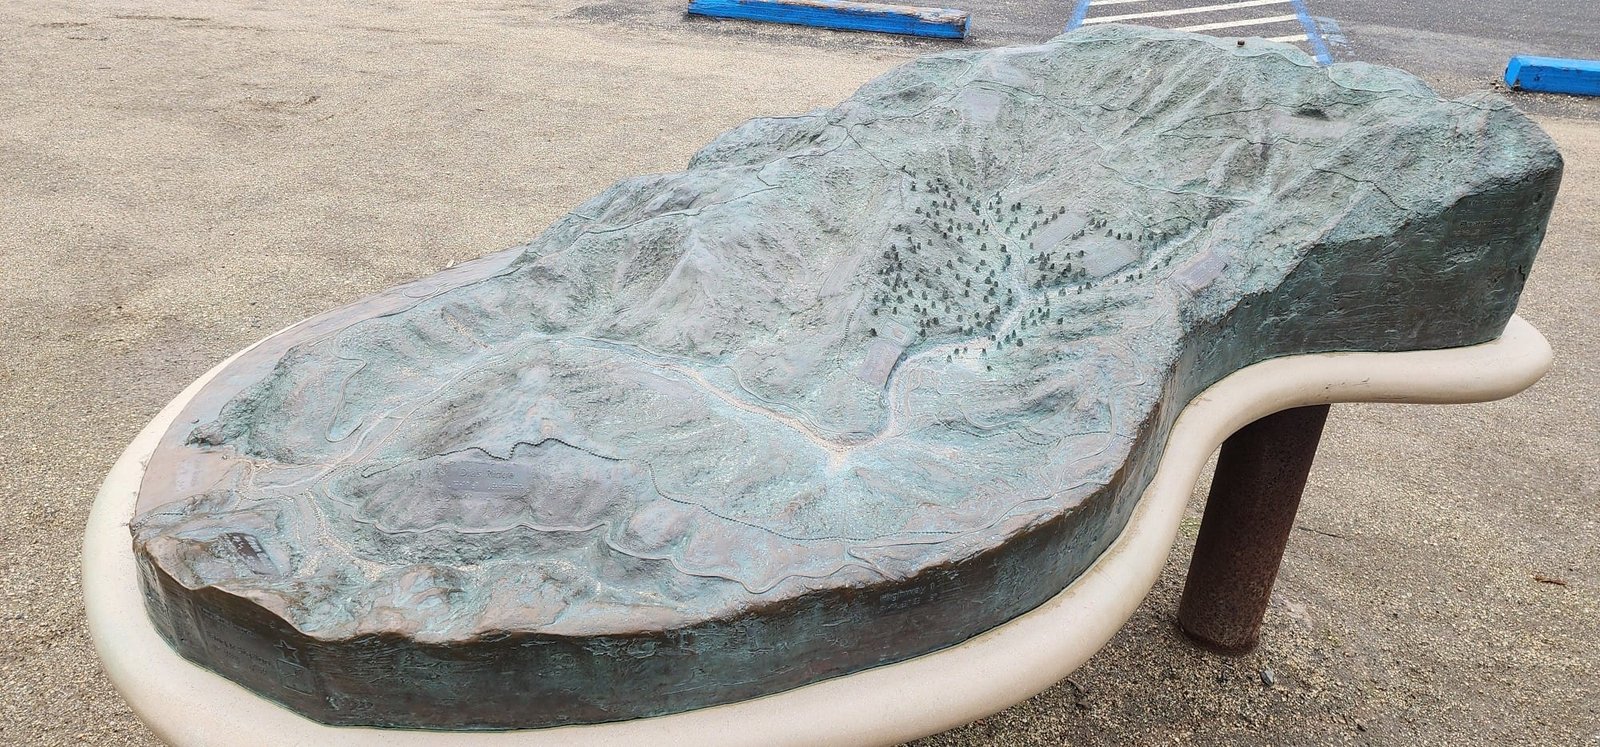
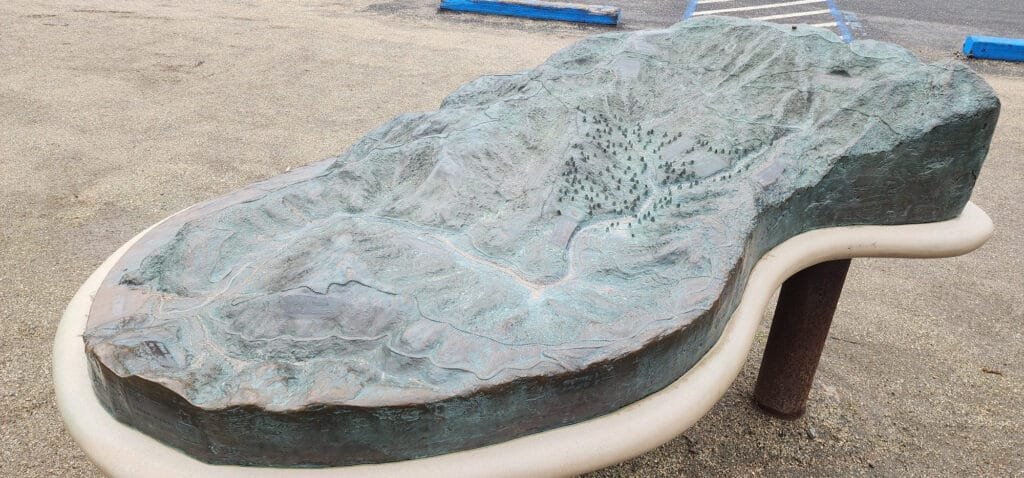
Cartonaut sent us this nice bronze relief and tactile map of Muir Beach.
-
sur WhereGroup: Material UI Themes und MapComponents
Publié: 14 November 2024, 3:10pm CET
Mit Material UI und MapComponents lassen sich flexible, ansprechende Kartenanwendungen gestalten. In unserem Blog zeigen wir, wie Themes und individuelle Anpassungen für eine konsistente und benutzerfreundliche Oberfläche sorgen. -
sur OSGeo Announcements: [OSGeo-Announce] pgRouting version 3.7.0 release
Publié: 14 November 2024, 12:25pm CET
The pgRouting Team is pleased to announce the release of pgRouting version 3.7.0
The latest release is available at [1]
For discussions on the release, go to [2]To see all issues & pull requests closed by this release see the Git closed milestone for 3.7.0 on Github. [3]
*Support*
* #2656 Stop support of PostgreSQL12 on pgrouting v3.7
o Stopping support of PostgreSQL 12
o CI does not test for PostgreSQL 12*New experimental functions*
* Metrics
o pgr_betweennessCentrality*Official function changes*
* #2605 Standarize spanning tree functions output
o Functions:
+ pgr_kruskalDD
+ pgr_kruskalDFS
+ pgr_kruskalBFS
+ pgr_primDD
+ pgr_primDFS
+ pgr_primBFS
o Standarizing output columns to (seq, depth, start_vid, pred,
node, edge, cost, agg_cost)
+ Added pred result columns.*Experimental promoted to proposed*
* #2635 pgr_LineGraph ignores directed flag and use negative values
for identifiers.
o pgr_lineGraph
+ Promoted to proposed signature.
+ Works for directed and undirected graphs.*Code enhancement*
* #2599 Driving distance cleanup
* #2607 Read postgresql data on C++
* #2614 Clang tidy does not work*To update your database*
Download the packaged version from your operating system, and use this command in the database:
ALTER EXTENSION pgrouting UPDATE TO "3.7.0";[1]. Release v3.7.0 · pgRouting/pgrouting · GitHub
[2]. v3.7.0 · pgRouting/pgrouting · Discussion #2677 · GitHub
[3]. Issues · pgRouting/pgrouting · GitHub1 post - 1 participant
-
sur Mappery: Walking on London
Publié: 14 November 2024, 11:00am CET
Pièce jointe: [télécharger]

Joe shared this from his visit to the old City Hall in London “he map room in the lowest floor of the old city hall was pretty big”
-
sur Mappery: Cambridge Station Cycle Park
Publié: 13 November 2024, 11:00am CET


The Cambridge Station cycle park has its perk for map lover coming home by night
-
sur Sean Gillies: Let's fucking go
Publié: 13 November 2024, 4:16am CET
I saw a physical therapist yesterday. I had a virtual visit with my physician today. I had a 2 mile hike in the sun around a local reservoir. Now I'm listening to the Glenn Branca Orchestra on The Frow Show and my take on my health is: let's go!
The expert consensus is that I did not injure my spine, but that muscles in the left side of my hip have clamped down on a nerve. I'm going to proceed as if that is true, foam rolling, walking, and running through the pain, and not worrying about my spine cracking in pieces. I do have a little bit of numbness in my upper left leg and so I will not directly dive into long technical downhill runs. I expect that I'll resolve that soon.
-
sur Jackie Ng: Announcing: mapguide-rest 1.0 RC6.1
Publié: 12 November 2024, 3:46pm CET
I've taken a momentary break from our (admittedly) glacial pace of MapGuide development to put out another release of mapguide-rest
This release includes the following changes:
- Fix missing reverse routing on selection overview
- Fix bad feature query preparation when querying against watermarked layers
- Relax strict-typing on MgReaderToGeoJsonWriter::FeatureToGeoJson() so that it can work with MgPaginatedFeatureReader allowing pagination to work again
- Added missing properties parameter to swagger defn for session-based feature selection route
We now return to regularly-scheduled programming of trying to get MapGuide Open Source 4.0 to the finish line.
As for mapguide-rest, I envision at least once more major RC *after* the final release of MapGuide Open Source 4.0 before finally wrapping things up on development work and pulling the trigger on the mapguide-rest 1.0 final release. Enough of this RC-after-RC business! -
sur Mappery: Relief map of Ilhabela
Publié: 12 November 2024, 11:00am CET


Harry shared this map that he spotted on his holiday in Brazil “I also saw this nice wall in a restaurant on Ilhabella which maybe scores better on the “maps as art” criteria.”
I like the way that the land is cut out of the plaster exposing the brick.
-
sur Nick Bearman: FOSS4G:UK South West 2024 - Bristol
Publié: 12 November 2024, 2:00am CET
It was great to attend FOSS4G:UK South West 2024 in Bristol on 12th Nov, at OSGeo:UK’s now regular Bristol Venue, The Engine Shed. The event was a sell out and we had 62 people in the Engine Shed’s main room.
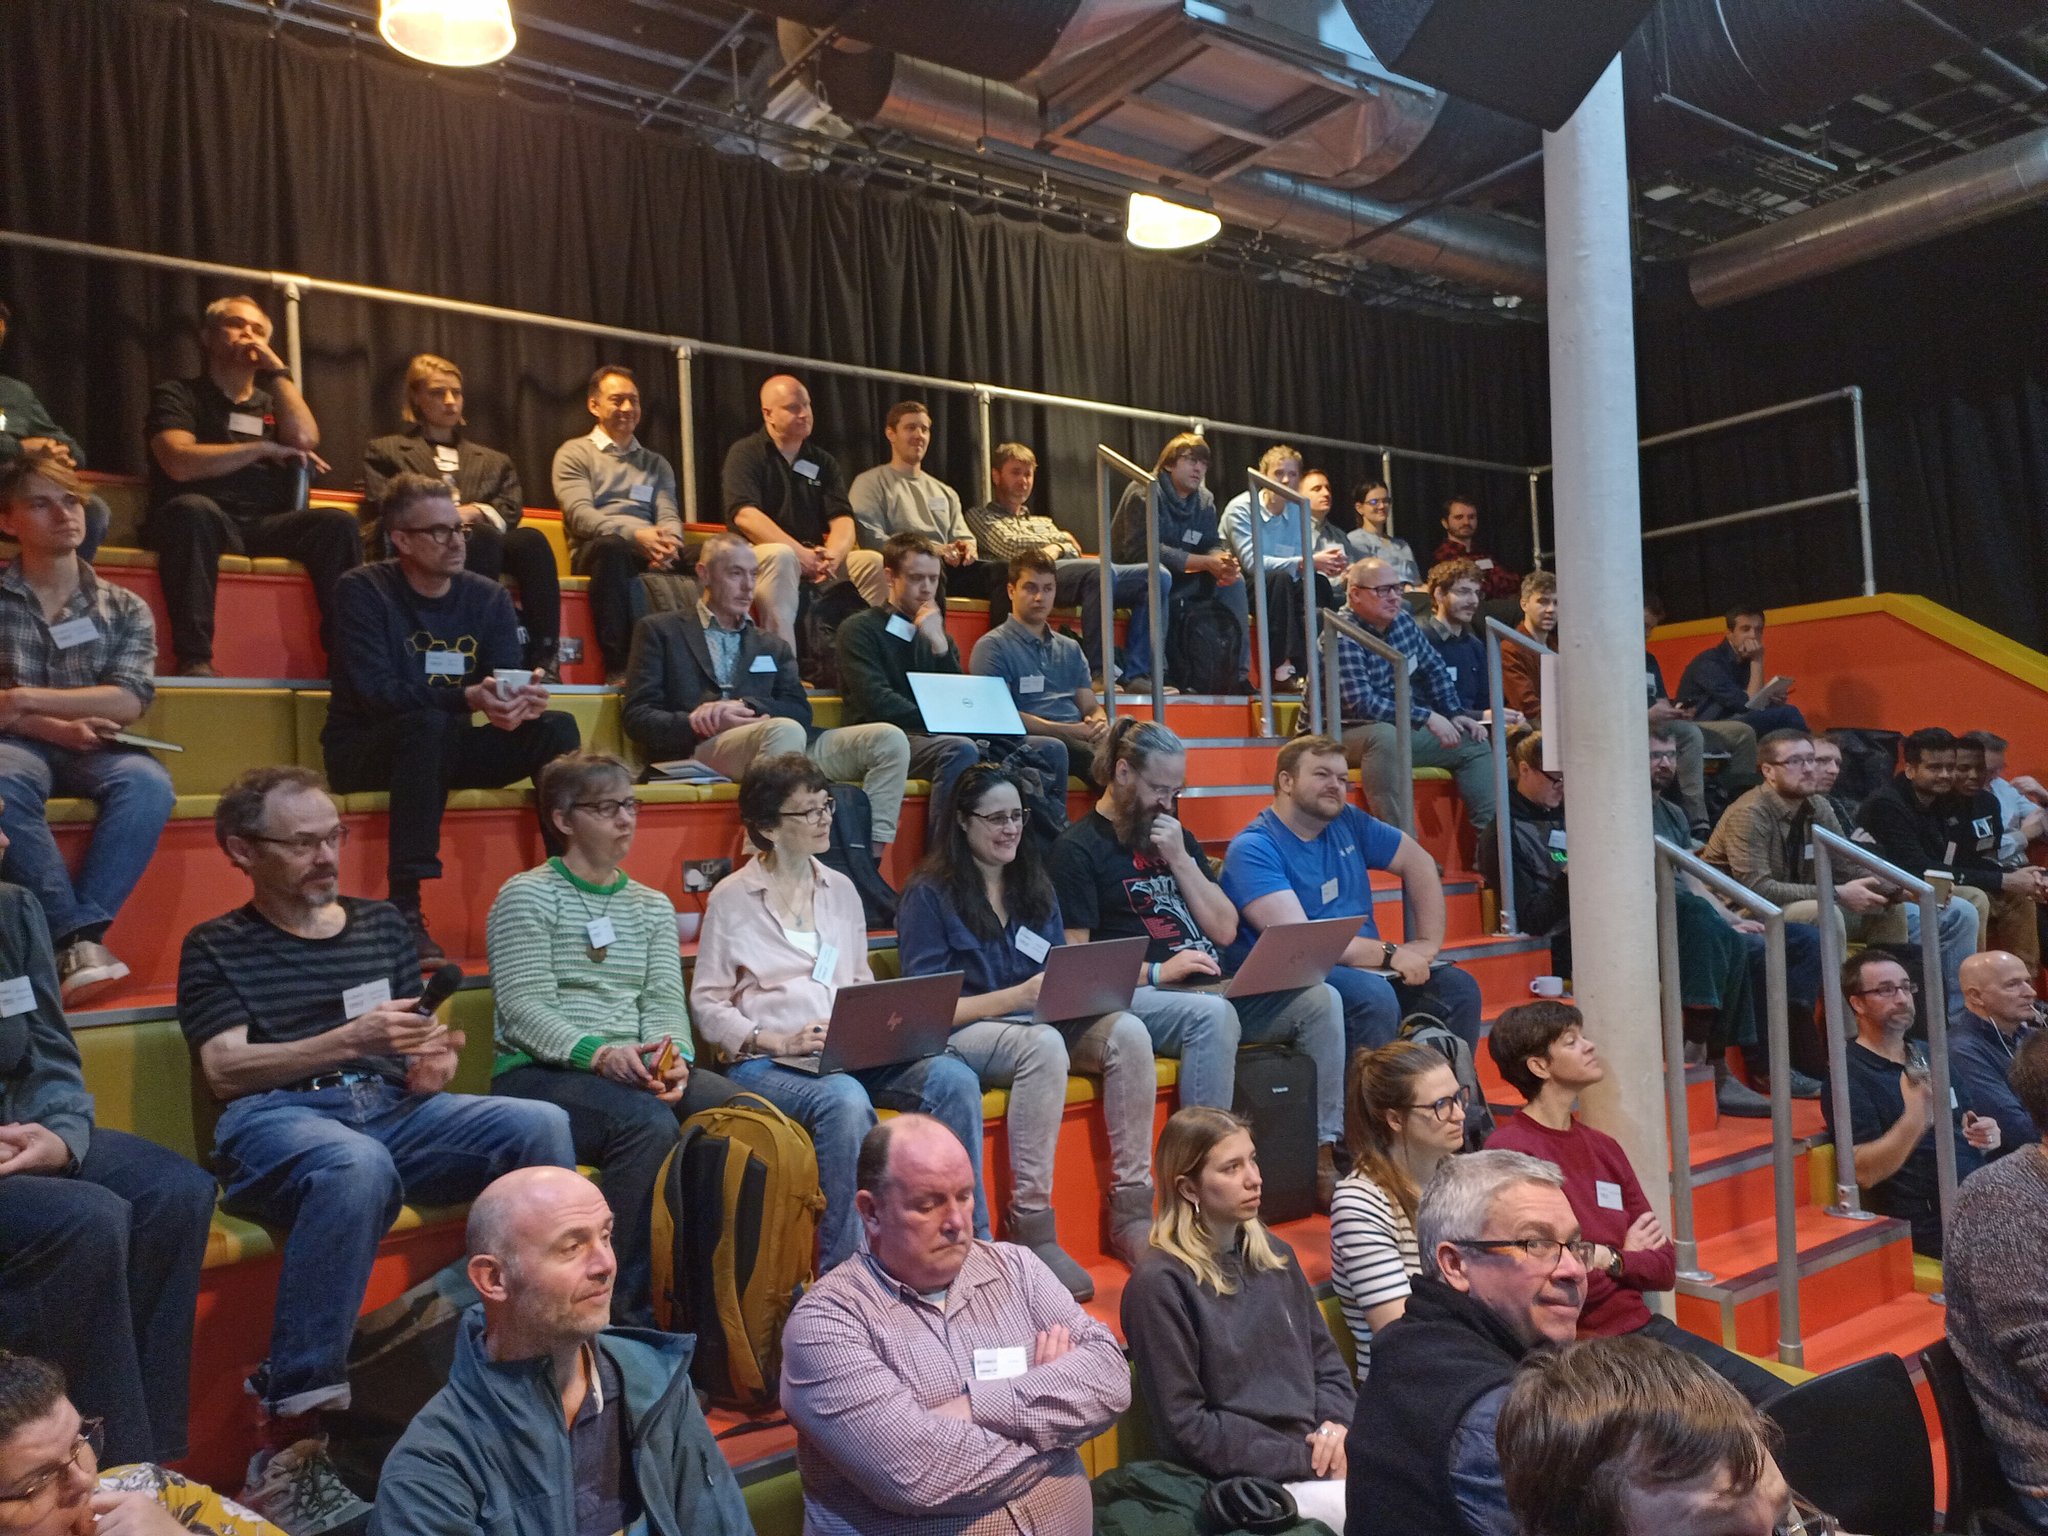
This was the first time in a while that I have been to a FOSS4G:UK as an attendee rather than as an organiser - and it made a nice difference! We had 14 great presentations, covering a whole range of topics including digitalization of railways, reproducible science, real time vessel monitoring, landscape heritage, open source funding, cloud native web apps and a whole variety of useful open source tools.
Unfortunately I missed the first presentation - thanks Great Western Railways! - but one common theme that cropped up a lot was how social media as a tool for open source projects has changed dramatically. James Milner said that social media used to be a great way to promote his program, Terra Draw, but know he gets no where near the same impact from using social media. It’s now a bit of a big unknown, and I particularly liked how he summarised this:
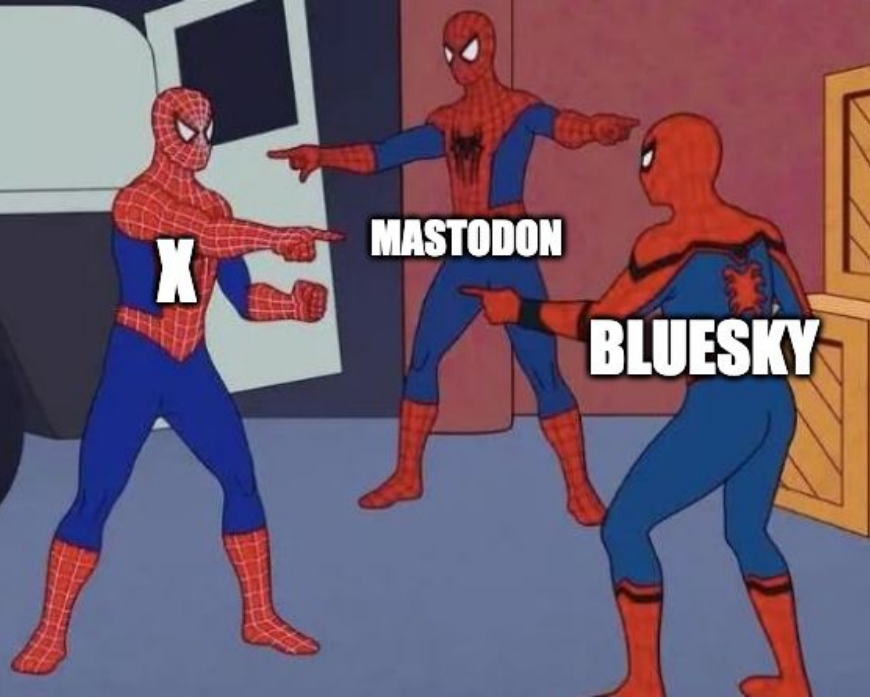
Interestingly, I sent out a number of social media posts to Twitter (X), Mastodon and LinkedIn, and LinkedIn got the most response, so make of that what you will! Although I think it’s fair to say LinkedIn is not universally loved, as it was memorably described as “Grindr for Business” by Andrew Bailey!
- Twitter (X) 1 retweet, 7 likes
- Mastodon 3 boosts, 3 favorites
- LinkedIn 6 comments, 4 reposts
The presenters have also mastered the use of memes, with Matt Travis hitting home with some of the perils of waiting for large data sets to load:

and of course also

It was also fantastic to get FAIR Open Science and FAIR workflows mentioned in the presentation by Richard Conway & Garin Smith from Telespazio, who are in the process of developing an exploration platform that allows researchers both to share their data, code and their methods in a reproducible form.
I also had the opportunity to speak about GoFundGeo and talk about how OSGeo:UK is funding a range of open source geospatial projects that will have an impact in the UK. Join the OSGeo:UK mailing list or check the website to find out more.
Nick presenting GoFundGeo, thanks to Sam Franklin for the photo
Finally, as ever, it was great to meet new people and network again with old friends at these events. I know of at least one contract opportunity, as well a number of potential ones and also I think some new volunteers for OSGeo:UK!
Thanks very much to all the organisers - Pascal Coulon, Alastair Graham, Sam Franklin, Dan Ormsby, Illya Sparkes-Santos, Ant Scott, as well as everyone who came along and took part.
If you want help or advice on any open source geospatial tool, or are interested in Introductory or Advanced GIS training in QGIS or R, please do contact me.
-
sur Camptocamp: The role of Open Source in achieving Digital Sovereignty
Publié: 12 November 2024, 2:00am CET
Pièce jointe: [télécharger]
In today’s digital world, the need for control over one’s digital ecosystem is more important than ever. -
sur Mappery: Large scale mapping
Publié: 11 November 2024, 11:00am CET
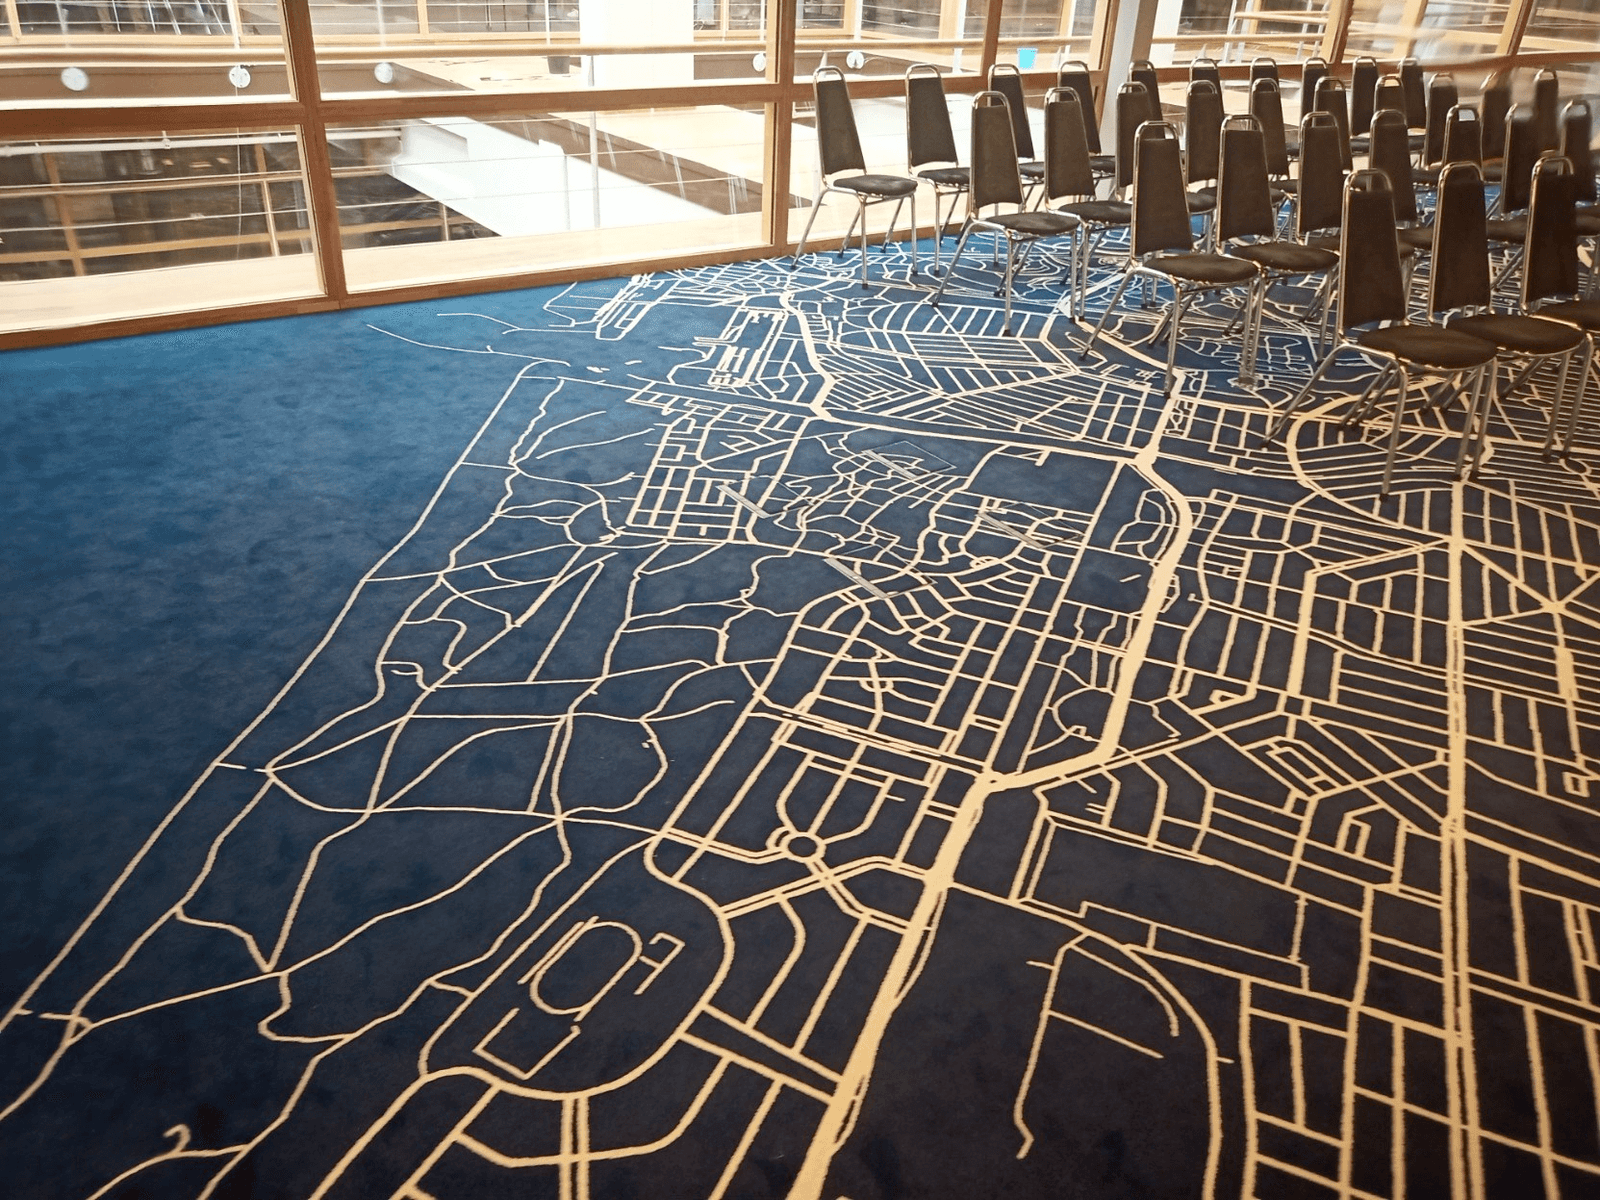

Edwin Wisze shared this “A few of the meeting rooms during the Logius PI planning have a beautiful map as a carpet. Here are a few examples: New York and The Hague”
I love maps you can walk on, feels like the right scale for me.

Which is your favourite?
-
sur GeoServer Team: Exploring CQL/ECQL Filtering in GeoServer
Publié: 11 November 2024, 2:00am CET
GeoSpatial Techno is a startup focused on geospatial information that is providing e-learning courses to enhance the knowledge of geospatial information users, students, and other startups. The main approach of this startup is providing quality, valid specialized training in the field of geospatial information.
( YouTube | LinkedIn | Facebook | X )
Exploring CQL and ECQL Filtering in GeoServerIn this session, we want to talk about the Using CQL/ECQL Filters in GeoServer in detail. If you want to access the complete tutorial, click on the link.
Introduction
Contextual Query Language (CQL) is a text-based query for search/retrieval adopted by the OGC for the Catalogue Web Services specification. Unlike the XML-based Filter Encoding language, CQL is more readable and easier for manual authoring. However, it has limitations, such as not being able to encode ID filters and requiring the attribute to be on the left side of comparison operators.
To overcome these limitations, GeoServer offers an extended version called ECQL, which closely resembles SQL and provides greater flexibility. ECQL allows users to define filters for querying data in GeoServer using attribute comparisons, logical operators, and spatial predicates. It is compatible with GeoServer’s REST API and can be used for WMS and WFS requests to retrieve filtered data.
Note. This video was recorded on GeoServer 2.22.4, which is not the most up-to-date version. Currently, versions 2.25.x and 2.26.x are supported. To ensure you have the latest release, please visit this link and avoid using older versions of GeoServer.
Note. Future version of GeoServer will include support for CQL2 which provides both a text and a JSON representation.
Comparison operatorsTo compare attribute values or other numeric and text values in your CQL / ECQL (Extended Common Query Language) expressions, you can utilize comparison operators.
In the Layer Preview section, first click on the OpenLayers option for the
topp:stateslayer. Next, locate and click on the Toggle options toolbar in the top left corner to access the advanced options.In the CQL filter box within this toolbar, enter the filter expression
STATE_NAME = 'Texas', and then press the Apply button. This filter will retrieve and display the data for the state of Texas.By reviewing the following examples using the Toggle options toolbar from the LayerPreview page, you will learn how to effectively understand and apply comparison operators using CQL/ECQL expressions:
- ‘PropertyIsGreaterThanOrEqualTo’ filter
This filter shows the states that have more than or equal to 5 million inhabitants.
PERSONS >= 5000000- ‘PropertyIsLike’ filter
This filter shows the states whose names, contain the letters ‘ing’ like Washington and Wyoming.
STATE_NAME like '%ing%'- ‘PropertyIsBetween’ filter
This filter shows the states with a population of 5 million to 10 million.
Spatial operatorsPERSONS between 5000000 and 10000000These operators enable you to perform spatial queries and filter data, based on various relationships between geometries. Here are the explanations for some commonly used spatial operators:
- ‘Intersect’ filter
This filter allows you to query spatial data in GeoServer based on geometric intersection relationships. This filter returns all features that have any spatial intersection or overlap.
The syntax for the Intersect filter in CQL is as follows:
Intersects(the_geom,Point(-90 40))- ‘Within’ filter
The Within filter checks if a spatial object is completely within another spatial object. This filter retrieves all features that are located within the boundaries of a specified geometric shape, using spatial relationships.
Within(the_geom,Polygon((-100 30,-100 45,-80 45,-80 30,-100 30)))- ‘Contains’ filter
This filter is the inverse of the “Within” filter. It checks if a spatial object completely contains another spatial object and helps you retrieve features that fully enclose the specified geometry.
Bounding Box operatorsCONTAINS(the_geom,LINESTRING(-73.9 43.5,-77.76 42.56))The Bounding Box operator is used to filter data based on a specified bounding box. The “bbox” filter in CQL allows you to query spatial data in GeoServer based on a bounding box or a rectangular area.
CQL filters can also be utilized with the GET method. To use the bbox filter using the GET method, enter the following code in the URL address bar of your browser:
http://localhost:8080/geoserver/topp/wms?service=WMS&version=1.1.0&request=GetMap&layers=topp:states&bbox=-124.73142200000001,24.955967,-66.969849,49.371735&width=768&height=330&srs=EPSG:4326&format=application/openlayers&CQL_FILTER=BBOX(the_geom,-110,41,-95,45)This filter enables you to retrieve all features that intersect, or are contained within the specified bounding box.
In this session, we took a brief journey through the “CQL filtering in GeoServer”. If you want to access the complete tutorial, click on the link.
-
sur Mappery: Map van
Publié: 10 November 2024, 11:00am CET


I found this Map Van on Portobello Road
-
sur Sean Gillies: A new CLI for GDAL
Publié: 9 November 2024, 6:54pm CET
Even Rouault has proposed a new, modern, and more coherent command line interface (CLI) for the GDAL/OGR project. I think it's a good idea and a good time to do it. I've wanted a better one for about 15 years. Even credits Rasterio for inspiration, and that's gratifying to see. I started writing Rasterio 10 years ago in part because I wanted a better CLI for GDAL.
What I wanted in a GDAL CLI were the following features:
A root command and a few subcommands, one namespace for everything.
Uniform arguments and options with predictable ordering and naming.
Good documentation of arguments and options.
More subcommands with fewer options each. Making gdal_translate into 3-4 commands, for example.
Input and output that favor stdin/stdout and JSON.
Ease of installation. For example, with pip instead of an OS package manager.
I estimated in 2013-2014 that it was not feasible for me to achieve those goals within the GDAL project itself. GDAL and its community had no funding for this kind of work at the time. I found the GDAL project's tests somewhat inscrutable and frustrating. A hefty legacy of documentation and folk wisdom about the old ways would have to be updated. Mostly by me, certainly. And the GDAL user community largely did not care. Free software that was fast and effective (and, most of all, free!) was already more than most people had dreamed of. A GIS analyst had so many business and organizational problems to deal with already that the rough edges of gdalinfo and gdal_translate didn't even crack her top 20. Software polish wasn't a big concern in the second decade of FOSS4G. I think it's still a hard thing to sell. Individual consumers will pay money for slick, well-designed software that makes them feel good. Organizations value polish less. And neither GDAL nor Rasterio sell anything to individual consumers.
Overhauling gdal_translate, ogr2ogr, and friends within the GDAL project looked like a non-starter to me. Pushing a herd of boulders up a hill, by myself, for free, for a community that was largely content with working around and stepping over these boulders. I think I made the right choice for myself. I got to start from scratch, move fast, and use a modern CLI framework. I made a command line interface for Rasterio that, while not perfect, met most of my goals. And I didn't go broke or burn out while doing it.
Today, thanks to years of fundraising work by Howard Butler, Paul Ramsey, Kristian Evers, and Even, the GDAL project does have funding to overhaul its command line interface as an aspect of overall project health and maintenance. Multiple developers can be paid to work on it. They won't have to donate their time to it as I would have. Rasterio's command line interface can't be adopted by GDAL, or be forked to become GDAL's because it doesn't have all the features of existing GDAL programs (or even of gdal_translate and ogr2ogr for that matter), and my decision to have more subcommands with fewer options is kind of against the grain of GDAL. But the new GDAL CLI can adopt the demonstrably useful features and design of Rasterio's. JSON output, for example, is something that GDAL has already picked up from Rasterio.
Rasterio will certainly fade a little if the new GDAL CLI is designed and executed well. But that's in the nature of software and software communities. Rasterio has always depended on GDAL and benefited from being built on a technically solid and well loved foundation. And I didn't invent CLI subcommands and JSON output, not at all. It's not unfair. If you succeed in open source, if you move the needle, you will be emulated. In this case, I think we can call it progress. I'm content.
In the long run, I stand to get half of what I originally wanted from a GDAL CLI, the first three of the six features I listed above. And there's probably still room for a suite of Unix style programs with different opinions and design decisions, especially if it and GDAL agree on basic concepts, arguments, options, and flags.
-
sur Mappery: Kunjapuri
Publié: 9 November 2024, 11:00am CET


Elizabeth spotted this street art on her way to the Kunjapuri temple. A quick search suggests that it is the symbol for International Yoga Day but you already knew that didn’t you?

-
sur Sean Gillies: Your account is deactivated
Publié: 9 November 2024, 6:03am CET
I stopped using Twitter a while ago. Then it was rebranded as "X". I dithered about deleting my account. Would it be taken over by crypto scammers or an 18 year-old Russian army private or contractor? I've come to the conclusion that I don't care anymore. They can have it if they want. I've downloaded my archive and clicked "deactivate your account".
If you see a post from an @sgillies on X, it isn't me.
-
sur Fernando Quadro: Começou a Black Friday Geocursos!
Publié: 8 November 2024, 1:00pm CET
A maior promoção de 2024 começa hoje, dia 08 e vai até o dia 10 de novembro.
Essa é a sua chance de adquirir nossos cursos com descontos imperdíveis nessa Black Friday.Cursos que estão com desconto:
 Combo: PostgreSQL, PostGIS e GeoServer (EAD Videoaula com 38h/aula)
 50% de desconto
 Acesso por 24 mesesCombo: PostgreSQL, PostGIS, GeoServer e OpenLayers 4 (EAD Videoaula com 53h/aula)
60% de desconto
Acesso por 24 meses Os cupons de desconto estão sendo informados no nosso Grupo VIP, basta você clicar no link abaixo :
 -
sur Mappery: Old T Shirt
Publié: 8 November 2024, 11:00am CET


I found this old T-shirt in a box in storage, long forgotten. This was a swag from my first employment.
-
sur Sean Gillies: On my feet
Publié: 8 November 2024, 5:54am CET
Saturday, I reported that I was laid up with a back injury. I'm feeling better today. The pain is manageable and I've been able to spend about half of my time awake upright, standing or sitting on my bed, with regular breaks to touch my toes and do the yoga half lift to stretch my back. I even managed to run a little bit yesterday while helping a guy who was the victim of a hit-and-run incident. Car on car, to be specific. No one was injured, as far as I could tell.
Ban cars. Ban injuries.
-
sur Sean Gillies: It's CyberGIS all over again
Publié: 8 November 2024, 5:23am CET
In a Mastodon thread about "GeoAI" today, I blurted out:
Uh huh. It's CyberGIS all over again.
We don't talk about CyberGIS anymore. I think it's going to be the same for "GeoAI".
-
sur Mappery: New Zealand misses out on global warming
Publié: 7 November 2024, 11:00am CET
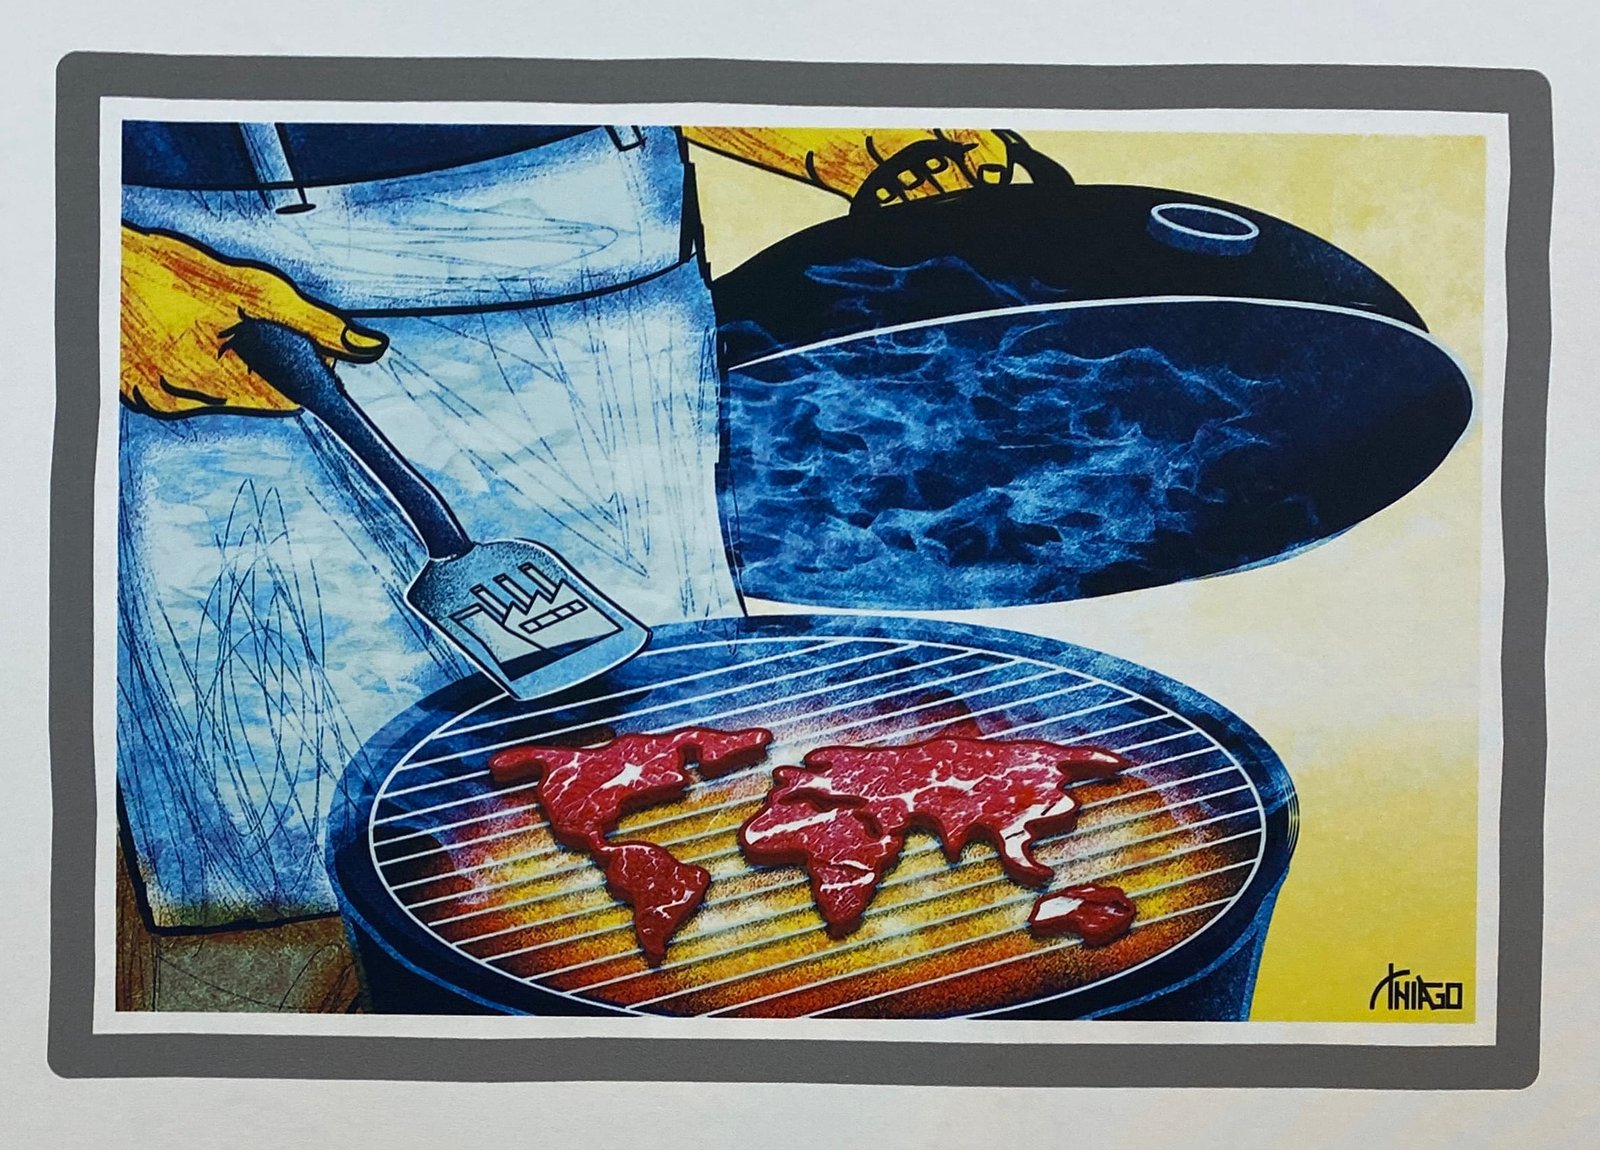

Reinder shared this cartoon by Thiago Lucas which one the European Cartoon Award.
The absence of New Zealand from the map may be a cartographic omission or it might be one more reason to take refuge there.
-
sur Sean Gillies: What the fuck!
Publié: 6 November 2024, 6:35pm CET
I knew that a second Trump presidency was very possible, but I'm still surprised that most American voters chose this sociopath. It's super disturbing to see the veneer of decency entirely stripped away from this country. Apparently, this really is who we are.
-
sur Mappery: Arles photography exhibition
Publié: 6 November 2024, 11:00am CET

Seen at Arles Photography Exhibition 2024
-
sur Fernando Quadro: Etapas básicas para criar seu WebGIS
Publié: 30 October 2024, 2:00pm CET
A melhor prática para criar um sistema WebGIS é armazenar todos os seus dados espaciais em um servidor PostgreSQL habilitado para PostGIS. Garanta que a indexação espacial seja aplicada para recuperação de dados mais rápida.
Você pode facilmente construir uma interface intuitiva e amigável usando HTML básico, CSS, Bootstrap e JavaScript.
Use Leaflet ou OpenLayers como sua biblioteca de mapeamento padrão!
Para filtrar dados ou executar consultas, siga estas etapas:
Colete a entrada do usuário e envie-a para seu script de backend por meio de uma solicitação AJAX.
Valide a entrada no backend e busque os dados necessários do banco de dados PostgreSQL usando consultas SQL.
Prepare os dados no backend e envie-os de volta para o cliente (interface do usuário).
O cliente receberá os dados por meio da mesma chamada AJAX e os formatará em camadas Leaflet. AJAX é assíncrono.
Estilize suas camadas de forma eficaz usando funções JavaScript.
Exiba as camadas no mapa.
Ajuste automaticamente a visualização do mapa para se ajustar à extensão do recurso pesquisado.
Adicione-os a um controle de camada para alternar a visibilidade entre ligado e desligado.
Crie dicas de ferramentas ou pop-ups para exibir informações detalhadas.
Se o usuário pesquisar por um único recurso, desenhe um círculo, linha ou polígono ao redor dele e amplie o recurso.Estas são as etapas básicas para exibir dados em um sistema WebGIS.
Gostou desse post? Conte nos comentários
Fonte: webgis.tech
Instagram: [https:]]
LinkedIn: [https:]] -
sur GeoTools Team: GeoTools 31.4 Released
Publié: 30 October 2024, 1:21pm CET
GeoTools 31.4 released The GeoTools team is pleased to announce the release of the latest maintenance version of GeoTools 31.4: geotools-31.4-bin.zip geotools-31.4-doc.zip geotools-31.4-userguide.zip geotools-31.4-project.zip This release is also available from the OSGeo Maven Repository and is made in conjunction with -
sur Mappery: Where’s this?
Publié: 30 October 2024, 11:00am CET
Pièce jointe: [télécharger]
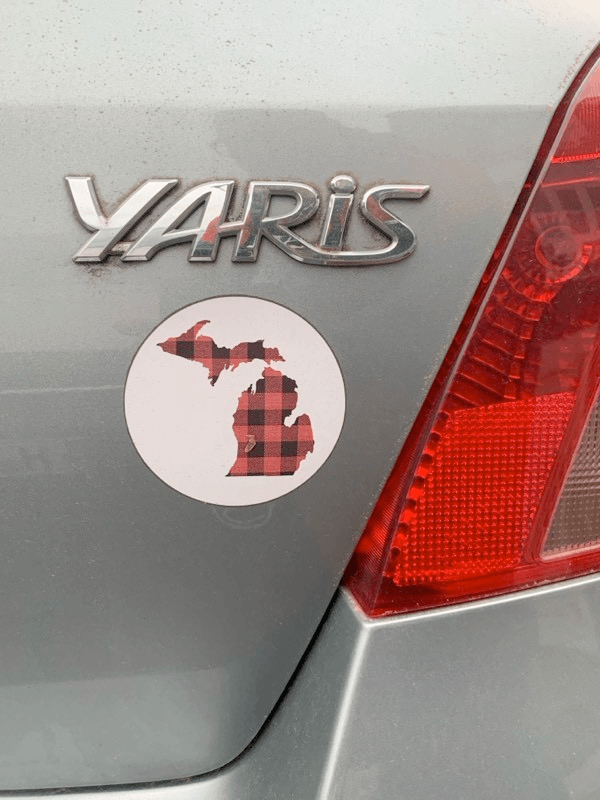
Marc-Tobias asked “Is this a map (in the wild)? If so of what?”
The answer is Michigan, US and apparently they celebrate something called Plaidurday (massive bonus points to me for working this out). I am going to mark my calendar for next year and wear a check shirt.
-
sur Fernando Quadro: Por que utilizar um WebGIS?
Publié: 29 October 2024, 2:00pm CET
Porque mais e mais empresas estão migrando para publicar seus produtos e serviços como WebGIS ou disponibilizando seus dados e funcionalidades pela web.
Essa mudança faz parte da tendência mais ampla conhecida como “GIS moderno”.
A mudança para o WebGIS oferece benefícios significativos.
Aqui estão as principais vantagens do WebGIS:1. Alcance um público mais amplo: os aplicativos WebGIS podem ser acessados ??globalmente por qualquer pessoa com uma conexão de internet, simplesmente usando uma URL.
2. Nenhuma instalação necessária: como o WebGIS é baseado em navegador e os navegadores geralmente são pré-instalados na maioria dos dispositivos, os usuários podem acessar os aplicativos instantaneamente sem a necessidade de instalação complexa de software.
3. Compatibilidade entre plataformas: o WebGIS funciona perfeitamente em todos os sistemas operacionais (Windows, Mac, Linux, etc.) usando navegadores da web padrão.
4. Custos mais baixos: as empresas podem reduzir despesas usando infraestrutura de nuvem e evitando ou reduzindo a necessidade de licenças de software caras.
5. Colaboração em tempo real: vários usuários podem interagir com os mesmos dados simultaneamente, permitindo colaboração em tempo real de diferentes locais.
6. Atualizações instantâneas: quaisquer atualizações ou alterações nos aplicativos podem ser disponibilizadas imediatamente para todos os usuários, sem exigir atualizações manuais ou reinstalações — basta atualizar o navegador.
7. Mais fácil para usuários não técnicos/não GIS: os aplicativos WebGIS geralmente oferecem interfaces intuitivas, tornando-os acessíveis até mesmo para especialistas não GIS que precisam executar tarefas específicas.
8. Escalabilidade: as soluções WebGIS podem ser dimensionadas facilmente para lidar com cargas de dados crescentes e demandas do usuário, fornecendo flexibilidade para empresas em crescimento.
O WebGIS ajuda as empresas a fornecer serviços e aplicativos com tecnologia GIS de forma mais eficaz, tornando-os acessíveis, eficientes e fáceis de usar para seus clientes e empresas.
Gostou desse post? Conte nos comentários
Fonte: webgis.tech
Instagram: [https:]]
LinkedIn: [https:]] -
sur Mappery: Glacier National Park
Publié: 29 October 2024, 11:00am CET
Pièce jointe: [télécharger]
-
sur GeoServer Team: GeoServer 2.25.4 Release
Publié: 29 October 2024, 2:00am CET
GeoServer 2.25.4 release is now available with downloads (bin, war, windows), along with docs and extensions.
This is a maintenance release of GeoServer providing existing installations with minor updates and bug fixes. GeoServer 2.25.4 is made in conjunction with GeoTools 31.4, and GeoWebCache 1.25.3.
Thanks to Jody Garnett for making this release.
Security ConsiderationsThis release addresses security vulnerabilities and is considered an important upgrade for production systems.
- GEOS-11557 CVE-2024-45748 High
See project security policy for more information on how security vulnerabilities are managed.
Release notesNew Feature:
- GEOS-11352 REST service for URL checks
Improvement:
- GEOS-11399 Use Catalog streaming API in LayerGroupPage
- GEOS-11427 metadata: “fix all” to support changing config repeatable field
- GEOS-11463 WMS vector dimension validation should query only one feature and only for dimension attribute
- GEOS-11502 Permit resize on user/group/role palette textbox to allow for extra long role names
- GEOS-11503 Update mongo schemaless DWITHIN to support non-point geometry
- GEOS-11557 CVE-2024-45748 High
- GEOS-11588 GWC disk quota, check JDBC connection pool validation query
Bug:
- GEOS-10811 GeoServer 2.22.0 WPS error while clipping raster with GeoJSON input
- GEOS-11071 GeoJSON PPIO goes NPE while decoding a GeoJSON geometry
- GEOS-11107 Open search for EO community module: packaging missing gt-cql-json-xx.x.jar
- GEOS-11453 Failure to look-up default value of custom dimensions on vector layers
- GEOS-11484 DirectRasterRenderer is not respecting advancedProjectionHandling and continuosMapWrapping format_options
- GEOS-11493 Azure blob store may not get environment parameters from property file
- GEOS-11497 WPS execution fails with GeoJSON input
- GEOS-11504 ResourceAccessManagerWrapper misses some delegating methods
- GEOS-11505 OWS Monitor only handles WFS 1.0 requests
- GEOS-11513 WMTS/GetDomainValues - Returned values are not sorted
- GEOS-11514 Fix parsing WPS geometry geojson inputs
- GEOS-11524 csw: default queryables mapping not generated
- GEOS-11543 Unable to use propertyName to filter properties in a GetFeature request when service is not set
- GEOS-11553 SLD Style: Empty SE Rotationelement throws RuntimeException (QGIS generated SLD)
- GEOS-11556 NullPointerException when GWC disk quota monitoring is disabled
- GEOS-11559 The customized attributes editor is prone to setting the wrong attribute source
Task:
- GEOS-11470 Upgrade the version of Mongo driver for schemaless plugin from 4.0.6 to 4.11.2
- GEOS-11506 Upgrade Spring version from 5.3.37 to 5.3.39 and Spring security from 5.8.13 to 5.8.14
- GEOS-11508 Update OSHI from 6.4.10 to 6.6.3
- GEOS-11533 Update org.apache.commons.vfs2 to 2.9.0
- GEOS-11574 Bump org.eclipse.jetty:jetty-server from 9.4.52.v20230823 to 9.4.55.v20240627 in /src
- GEOS-11587 Update map fish-print-v2 2.3.2
For the complete list see 2.25.4 release notes.
Community UpdatesCommunity module development:
- GEOS-11517 Using various OGC APIs results in service enabled check related WARN logs
- GEOS-11518 DGGS JDBC store SQL encoder should not force the timezone to CET
- GEOS-11519 Make DGGS rHealPix tests run again
- GEOS-11560 OGC API modules lack cql2-json in assembly
- GEOS-11563 Allow configuring a DGGS resolution offset on a layer basis
- GEOS-11565 Allow configuring the minimum and maximum DGGS resolution for a layer
- GEOS-11579 DGGS modules prevent GeoServer startup if JEP is not installed
Community modules are shared as source code to encourage collaboration. If a topic being explored is of interest to you, please contact the module developer to offer assistance.
About GeoServer 2.25 SeriesAdditional information on GeoServer 2.25 series:
- GeoServer 2.25 User Manual
- GeoServer 2024 Roadmap Plannings
- Raster Attribute Table extension
- Individual contributor clarification
Release notes: ( 2.25.4 | 2.25.3 | 2.25.2 | 2.25.1 | 2.25.0 | 2.25-RC )
-
sur EOX' blog: EOX IT Services GmbH at Intergeo Expo 2024
Publié: 29 October 2024, 2:00am CET
Intergeo 2024 is one of the world’s leading expos for geospatial solutions, bringing together professionals, innovators, and thought leaders from across the globe. Held this year in Stuttgart, Germany, the event provided a perfect platform for industry experts to showcase the latest advancements in ... -
sur Fernando Quadro: Interação entre Temperatura e Fluxos oceânicos com IA e GIS
Publié: 28 October 2024, 2:00pm CET
A combinação de Inteligência Artificial (IA) e Sistemas de Informação Geográfica (GIS) pode transformar nossa compreensão dos oceanos e suas dinâmicas. Aqui estão algumas formas de como essa interação entre temperatura e fluxos oceânicos pode ser otimizada com essas tecnologias:
Monitoramento em Tempo Real: Usando sensores e dados via satélite, o GIS pode mapear padrões de temperatura oceânica e fluxos em tempo real, enquanto a IA analisa grandes volumes de dados para prever mudanças futuras. Previsões Climáticas Precisas: A IA é capaz de identificar padrões históricos de temperatura e fluxo oceânico para criar modelos preditivos, ajudando a antecipar fenômenos como o El Niño ou a La Niña, além de mudanças em correntes oceânicas. Gestão de Riscos e Desastres: Previsões aprimoradas permitem uma melhor gestão de riscos para eventos climáticos extremos, como tempestades ou inundações, dando tempo para se preparar e minimizar impactos. Otimização de Rotas Marítimas: Com o uso de GIS e IA, é possível otimizar rotas de transporte marítimo, aproveitando correntes oceânicas e temperaturas favoráveis, economizando combustível e reduzindo emissões. Conclusão: A combinação de IA e GIS na análise de temperatura e fluxos oceânicos oferece uma visão mais profunda e preditiva do comportamento dos oceanos, essencial para a gestão ambiental, segurança e planejamento climático.
Fonte: webgis.tech
Instagram: [https:]]
LinkedIn: [https:]] -
sur Mappery: Bokhoven Mosaic
Publié: 28 October 2024, 11:00am CET
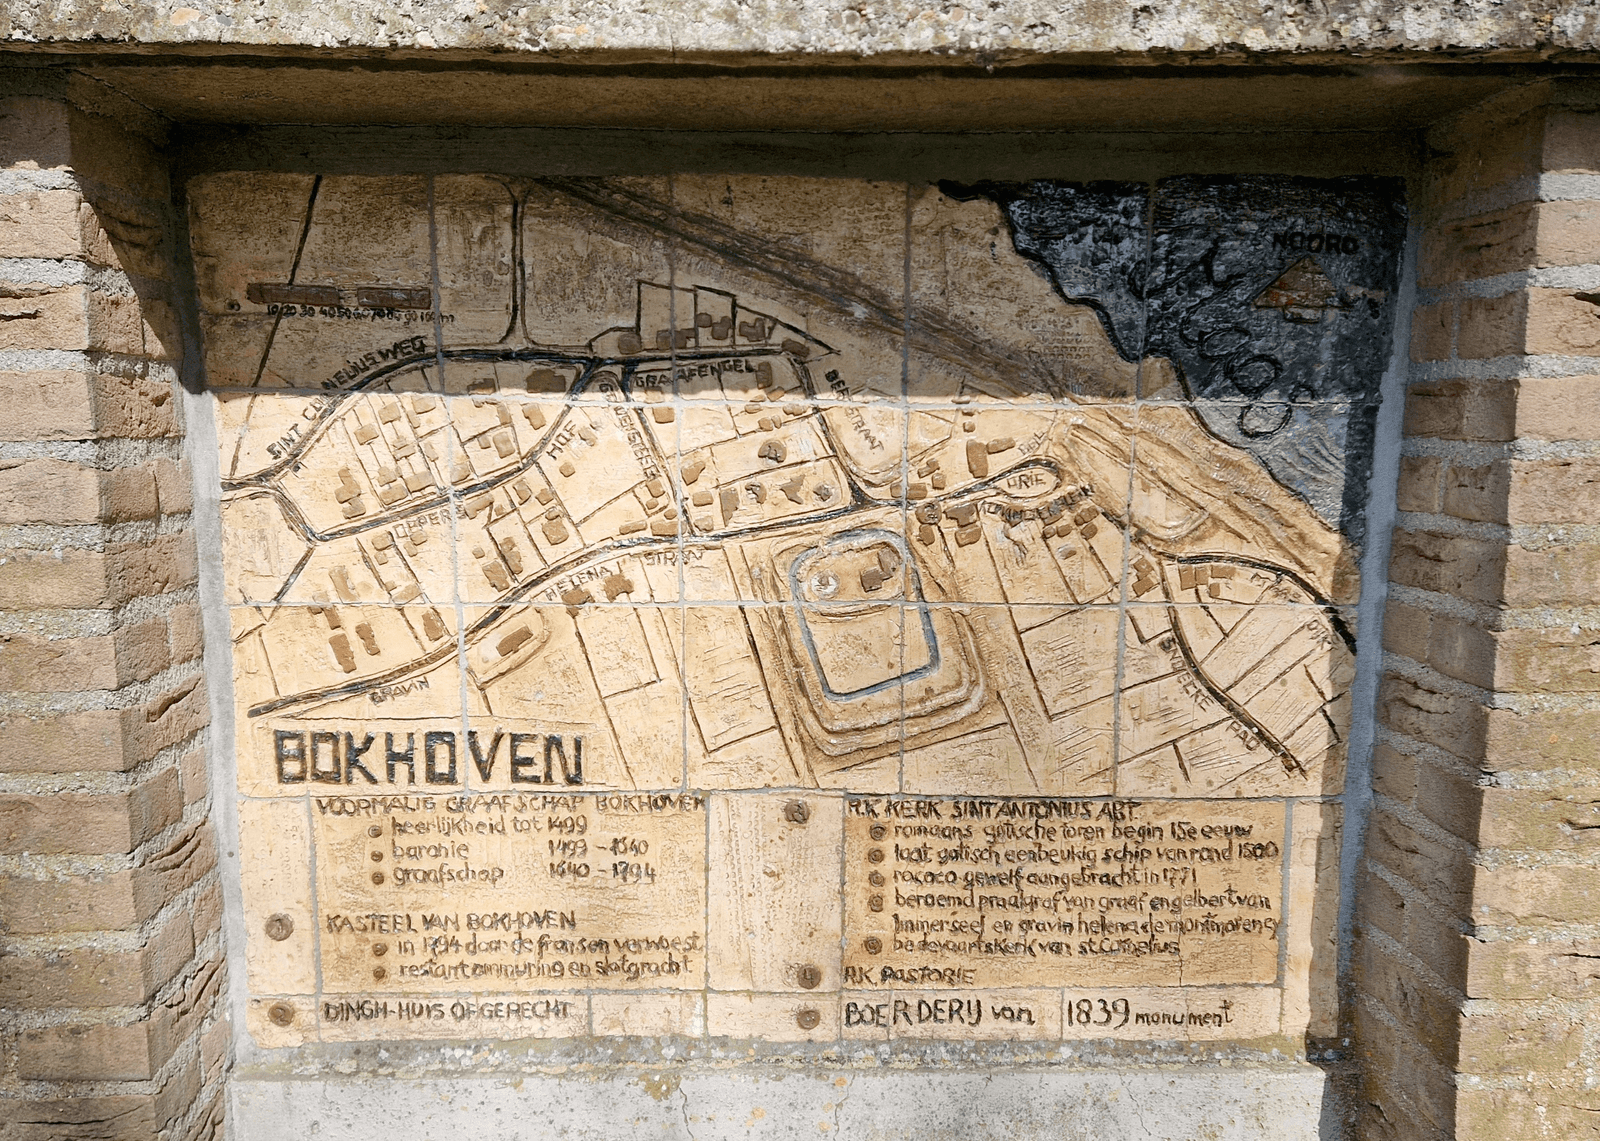
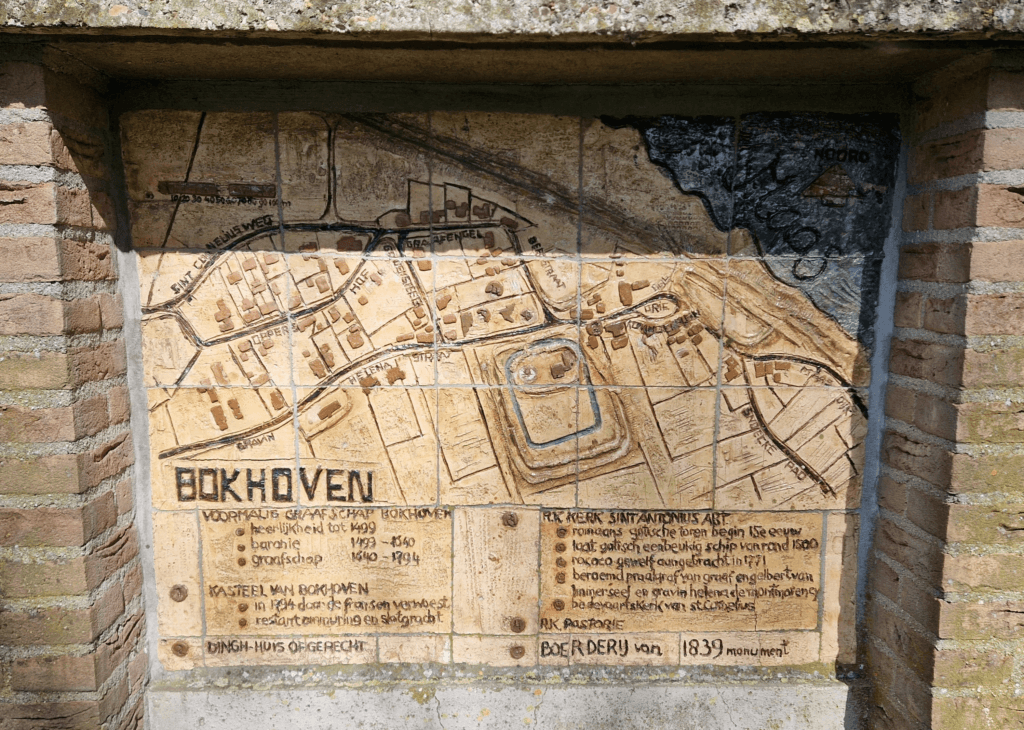
Garett Speed shared this nice mosaic map “another tile mosaic, this one is in the middle of the village Bokhoven in Noord Brabant, the Netherlands”
-
sur Mappery: Map on Beer
Publié: 27 October 2024, 11:00am CET
Pièce jointe: [télécharger]
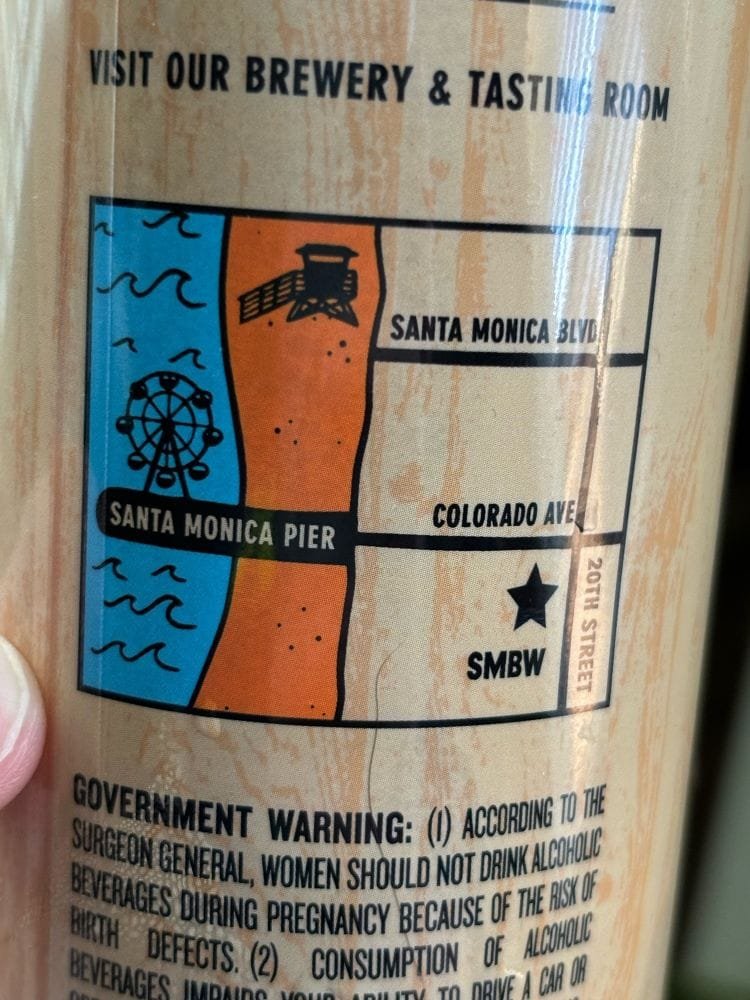
“What’s better than a map to beer?” said SHPMafia
-
sur Mappery: From here you can see
Publié: 26 October 2024, 1:00pm CEST

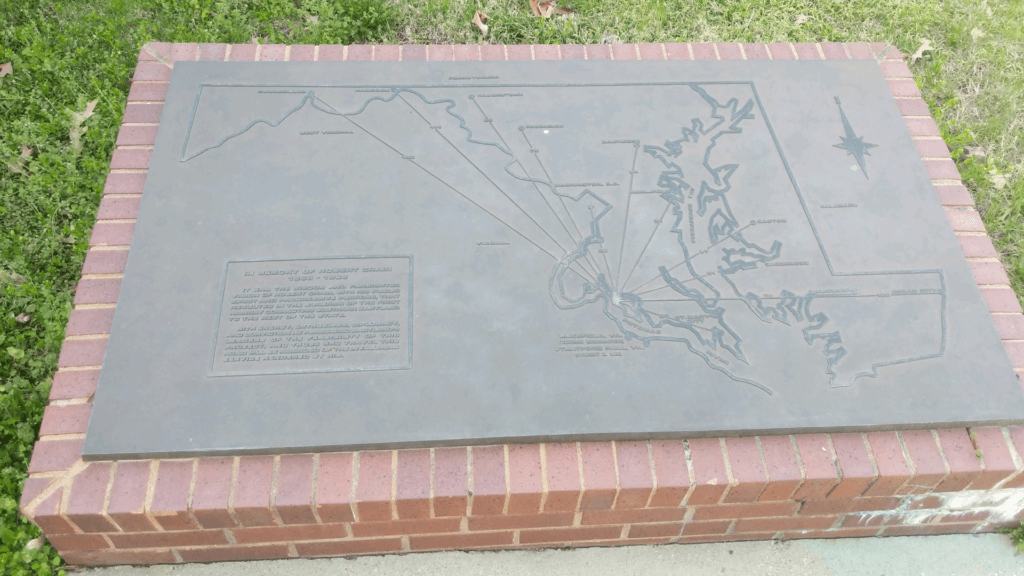
Andy McIntire shared this with us “Here’s a map I found a few days ago at a rest stop in southern Maryland, right where all the lines on the map join.”
-
sur Mappery: Contoured Neck Warmer
Publié: 25 October 2024, 1:00pm CEST
Pièce jointe: [télécharger]
Raf shared this, he said “Neck warmer handed out to participants at the 2024 Eutiches OnRoad motorbike rideout has a contour line vibe”
This looks like fun if you are a motorbike owner.
-
sur Fernando Quadro: Análises Espaciais nas Estratégias de Negócio
Publié: 24 October 2024, 4:00pm CEST
Vivemos em uma era onde a informação é o novo petróleo. Mas, como extrair valor dessa vastidão de dados disponíveis? A resposta está na interseção entre tecnologia e geografia: o mapeamento, o sensoriamento remoto e as análises espaciais. Estes recursos não são apenas ferramentas sofisticadas, mas sim catalisadores de transformação estratégica para os negócios. Vamos explorar o porquê.
Mapeamento: Visualizando OportunidadesO mapeamento permite visualizar dados geográficos de forma intuitiva, transformando informações complexas em insights claros e acionáveis. Imagine conseguir identificar novas oportunidades de mercado simplesmente observando a distribuição geográfica dos seus clientes! Isso proporciona uma vantagem competitiva inestimável, permitindo decisões mais precisas e eficazes.
 Sensoriamento Remoto:
Com o sensoriamento remoto, temos a capacidade de monitorar e analisar grandes áreas em tempo real, utilizando imagens de satélite e drones. Isso é particularmente valioso para setores como agricultura, mineração e gestão de recursos naturais, onde cada centímetro conta. Através dessas tecnologias, empresas podem aumentar sua eficiência operacional e minimizar impactos ambientais, promovendo um desenvolvimento mais sustentável.
 Análises Espaciais a Cereja do Bolo para Decisões Inteligentes e Estratégicas:
As análises espaciais vão além do simples mapeamento. Elas integram diferentes camadas de dados para revelar padrões escondidos e prever tendências. Seja na otimização de rotas de logística, na escolha de novos pontos de venda ou na mitigação de riscos ambientais, as análises espaciais oferecem uma perspectiva especializada que se fundamenta em dados concretos que são essenciais para análises e tomadas de decisão fundamentadas em evidências.
 Transformação Digital e Competitividade:
Empresas que adotam essas tecnologias ganham um diferencial competitivo significativo, sendo capazes de responder rapidamente às mudanças do mercado e antecipar demandas. Profissionais especializados nessas áreas são fundamentais para aproveitar ao máximo essas ferramentas, e valorizá-los é essencial para o sucesso e melhoria contínua.
 O Futuro Está Aqui
Se você ainda não considerou essas ferramentas e profissionais da área como parte da sua estratégia, o momento é agora. Com o investimento e a popularização dessas tecnologias em diversos setores, o diferencial competitivo se torna claro. Invista em tecnologia, inteligência espacial e veja seu negócio alcançar novos patamares de sucesso.
A inovação e seus benefícios podem estar “no agora” e você e sua empresa também podem estar!
Fonte: Danielle Gomes
Gostou desse post? Conte nos comentários
-
sur Mappery: Map Mural in Nova Scotia
Publié: 24 October 2024, 1:00pm CEST
Pièce jointe: [télécharger]
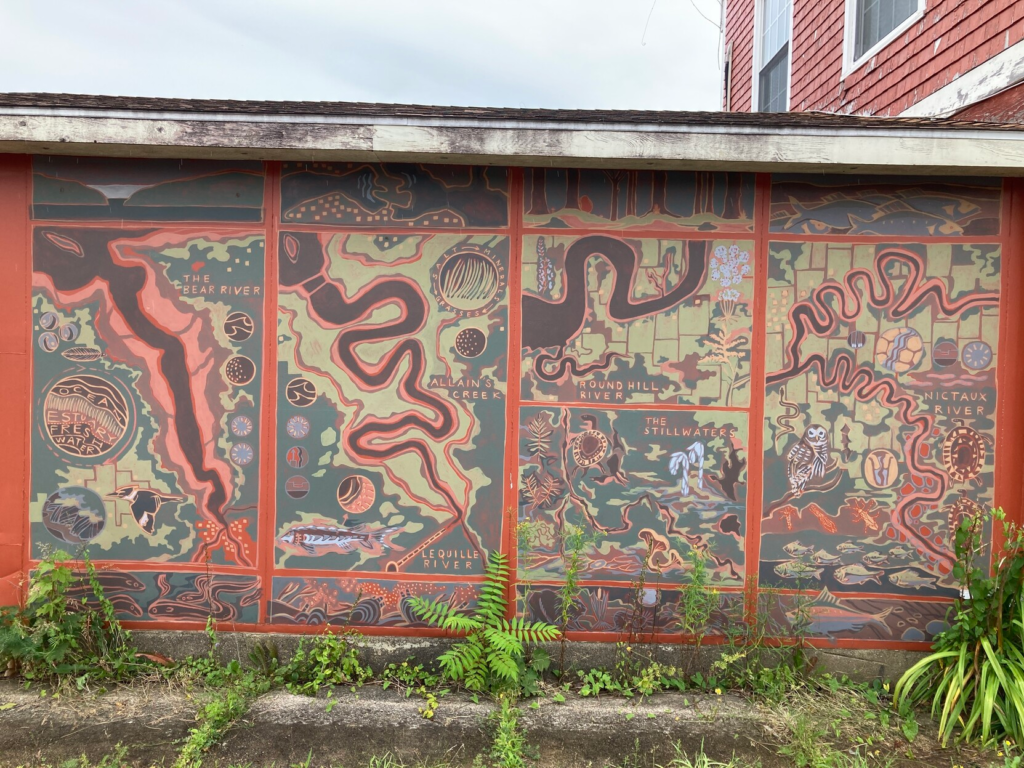
Doug shared this superb urban map mural. “Mural on building showing local rivers. Annapolis Royal, Nova Scotia”
-
sur Fernando Quadro: Melhores práticas para gerenciamento de dados geoespaciais
Publié: 23 October 2024, 4:00pm CEST
O gerenciamento eficaz de dados geoespaciais é crucial para organizações que trabalham com GIS. Inclua essas melhores práticas para maximizar o valor de seus dados geoespaciais, melhorar os processos de tomada de decisão e garantir a sustentabilidade dos dados a longo prazo.
Estabeleça regras claras para o uso de dados
Certifique-se de que todos saibam como lidar com os dados. Isso mantém os dados seguros e consistentes.Crie padrões de dados
Crie regras sobre como coletar, armazenar e compartilhar dados. Isso ajuda todos a usar os dados da mesma maneira.Use bons sistemas de armazenamento
Escolha sistemas que possam crescer com suas necessidades. O armazenamento em nuvem e bancos de dados espaciais funcionam bem para dados de mapas.Adicione detalhes sobre seus dados
Anote o que cada pedaço de dados significa. Isso ajuda as pessoas a encontrar e usar os dados certos.Faça backup dos seus dados
Faça cópias dos seus dados para mantê-los seguros. Tenha um plano para recuperar seus dados se algo der errado.Mantenha versões antigas
Salve versões diferentes dos seus dados. Isso ajuda você a rastrear alterações ao longo do tempo.Combine dados cuidadosamente
Aprenda a misturar dados de diferentes fontes. Isso lhe dá uma visão completa para melhores decisões.Faça com que os dados sejam fáceis de encontrar
Organize seus dados para que as pessoas possam encontrar o que precisam rapidamente.Treine sua equipe
Ensine a todos como usar os dados corretamente. Isso ajuda a evitar erros.Verifique a qualidade dos dados com frequência
Certifique-se regularmente de que seus dados estejam corretos e atualizados.Controle quem pode acessar os dados
Decida quem pode ver ou alterar diferentes tipos de dados. Isso mantém as informações confidenciais seguras.Planeje o futuro
Pense em como suas necessidades de dados podem mudar. Certifique-se de que seu sistema pode crescer com você.Gostou desse post? Conte nos comentários
Fonte: webgis.tech
Instagram: [https:]]
LinkedIn: [https:]] -
sur Mappery: The Balkan Territory on the side of a building
Publié: 23 October 2024, 1:00pm CEST
Pièce jointe: [télécharger]
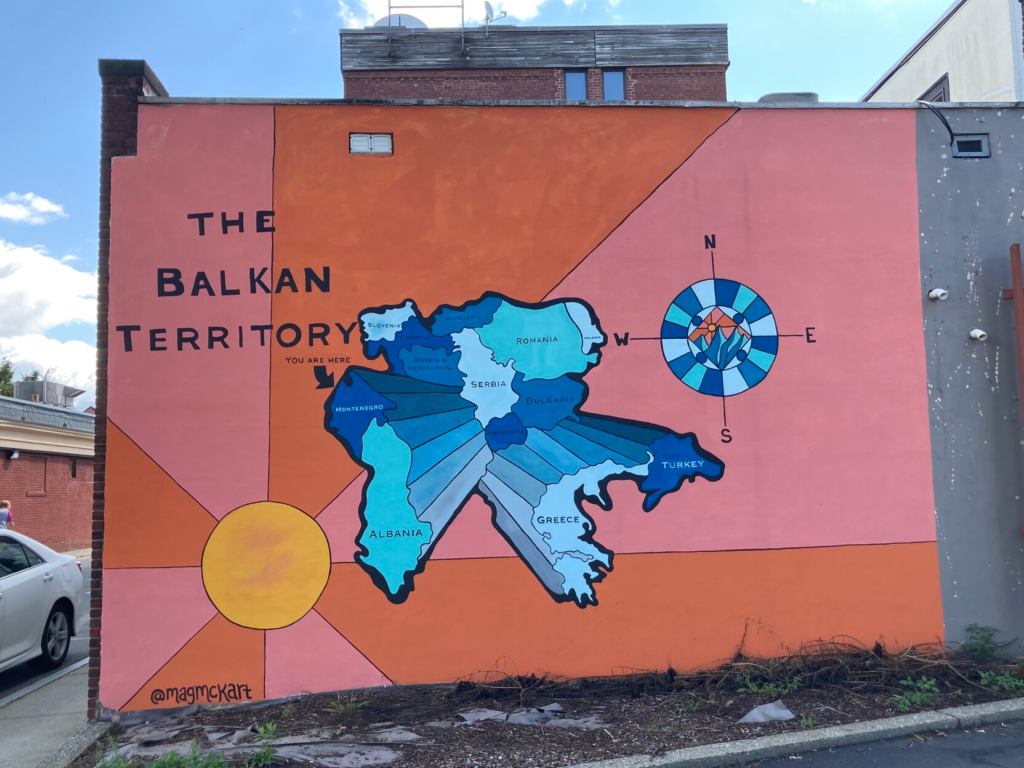
Rebecca Seifried shared this. “One of the rare murals in my humble town, adorning a wall outside the Balkan Lounge bar. Obviously not to scale, and with absolutely baffling 3D effects, I still find it charming #MapsintheWild. I feel duty-bound to commemorate it because the bar recently changed ownership – TBD what will happen to the mural!”
-
sur Fernando Quadro: Black Friday Geocursos, não perca!
Publié: 22 October 2024, 4:00pm CEST
 A BLACK FRIDAY DA GEOCURSOS VEM AÍ!
Quer estudar e crescer na carreira ainda em 2024? Então se liga que teremos cursos com descontos imperdíveis na Black Friday!
CURSOS COM ATÉ 60%OFF entre os dias 08 e 10 de novembro!Estarão disponíveis nossos COMBOS com os cursos: PostgreSQL, PostGIS Básico, GeoServer e OpenLayers 4!
Já anota na agenda ai para não esquecer!
Participe do nosso Grupo VIP para ficar por dentro de tudo e pegar seu cupom em primeiro mão:
-
sur Mappery: Wooden Map
Publié: 22 October 2024, 1:00pm CEST
Pièce jointe: [télécharger]
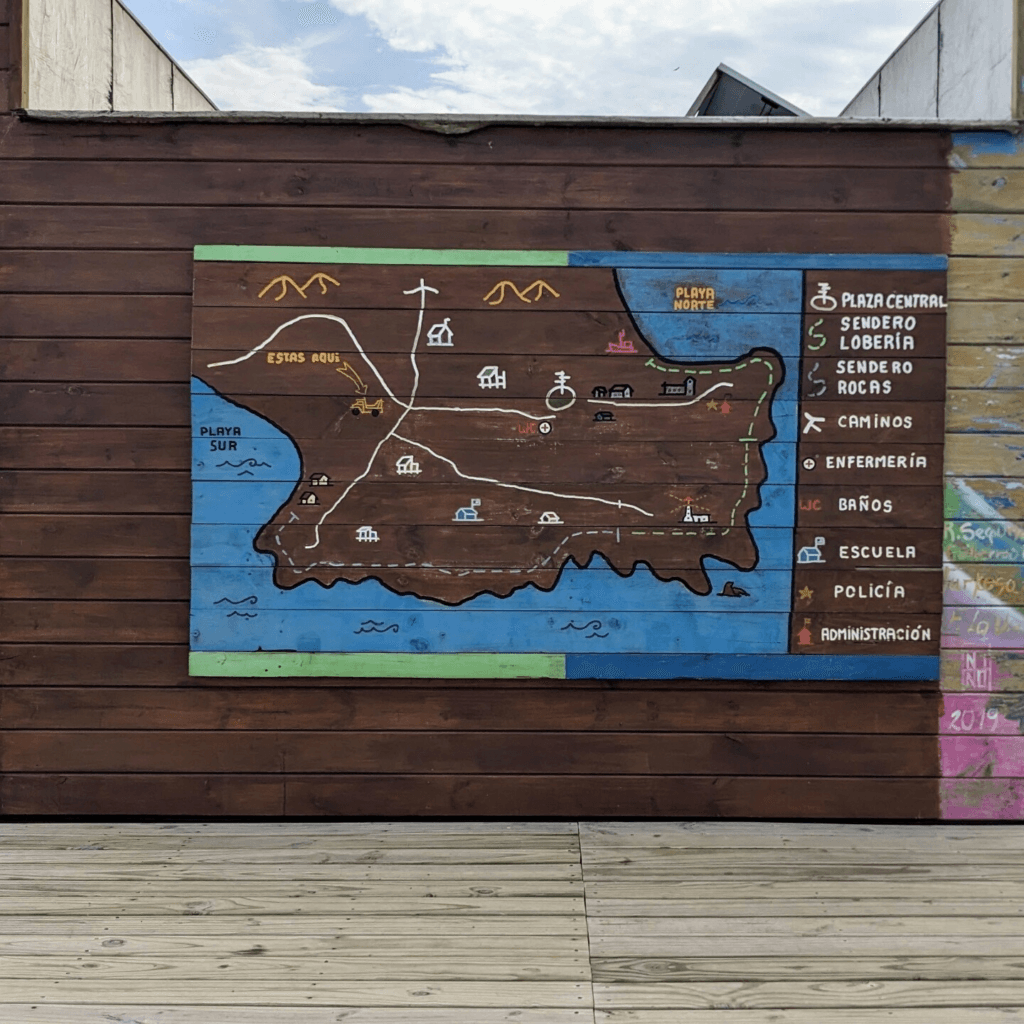
Ana Lucia Gonzalez shared this “Wooden map in Cabo Polonio, Uruguay, manually painted, showing the location of the main square, the path to the sea wolves, the school and the police station.”
-
sur Fernando Quadro: WFS-T com OpenLayers, PostGIS e GeoServer
Publié: 21 October 2024, 4:00pm CEST
Outro dia eu estava navegando pela internet quando “esbarrei” com um post muito interessante sobre como utilizar o WFS Transactions (WFS-T), para salvar feições no PostGIS a partir de uma aplicação web com OpenLayers.
Eu já tinha postado algo bem similar a isso a um bom tempo atrás, mas já estava bastante desatualizado, então eu decidir traduzir e (re)postar esse material aqui no blog.
1. O Projeto
Essa aplicação está postada no GitHub e usa no frontend React/OpenLayers para atualizar dados de recursos GIS armazenados em um banco de dados PostGIS usando transações WFS (facilitadas pelo GeoServer).
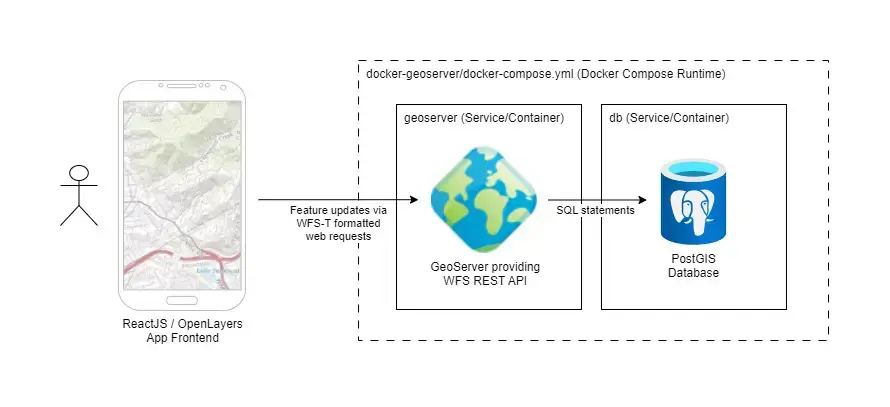
2. Objetivo
O objetivo era exibir um recurso WFS em um mapa com OpenLayers e gravar alguns dados no PostGIS cada vez que o recurso fosse clicado. Isso foi feito incluindo a propriedade interation nos dados do recurso que rastreou o número de cliques.

Foi utilizado o docker kartoza/docker-geoserver para montar o backend com GeoServer e PostGIS. Graças ao trabalho duro do Kartoza, isso foi tão fácil quanto executar docker-compose up no diretório apropriado (mais instruções aqui).
Alguma configuração foi necessária para criar uma tabela e um registro de exemplo no PostGIS. Uma vez que isso foi concluído, mais algumas etapas foram necessárias para criar um workspace, store e uma camada no GeoServer para publicar a tabela do PostGIS.
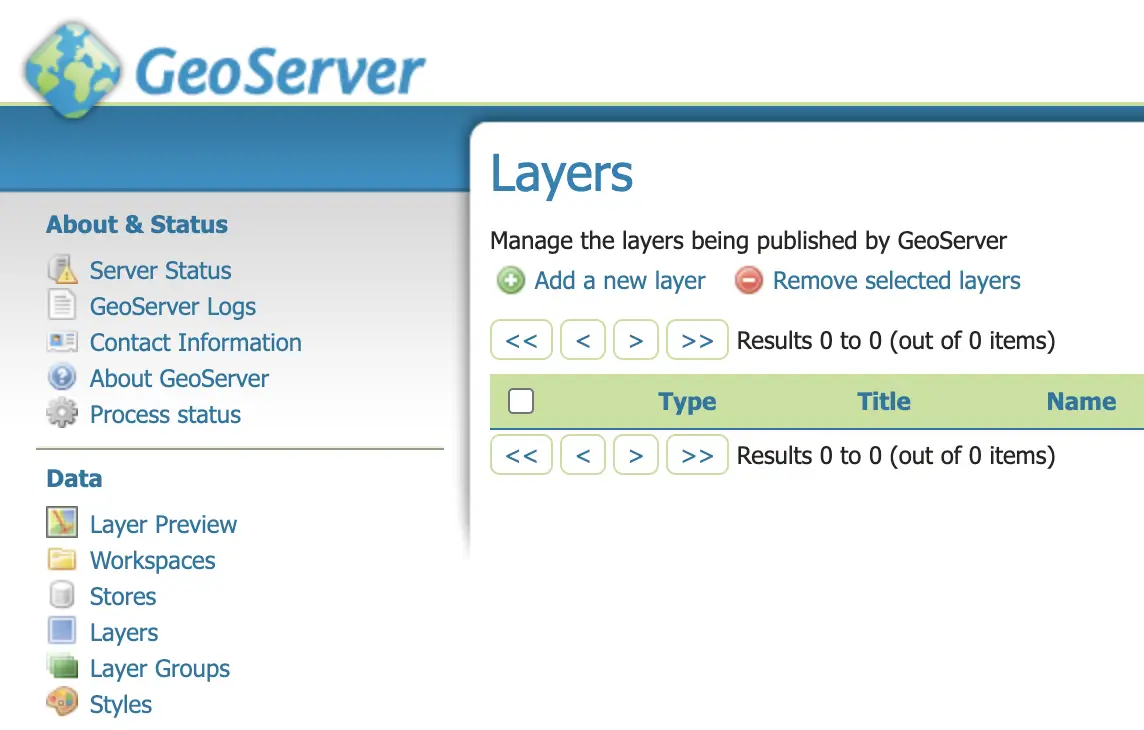
A etapa final é publicar a camada no GeoServer e aí começa a diversão!
3. O Frontend
O aplicativo frontend foi baseado em React com OpenLayers. Alguns call-outs específicos e lições aprendidas são compartilhados abaixo, mas confira o projeto no GitHub para o código-fonte completo.
3.1 Criando a camada WFS do GeoServer no OpenLayers
Definir a camada e os estilos do WFS foi simples usando a estratégia bbox padrão, usada para instruir o OpenLayers sobre como/quando carregar os recursos do WFS. Veja:
import VectorSource from 'ol/source/Vector';
import GeoJSON from 'ol/format/GeoJSON.js';
import {bbox as bboxStrategy} from 'ol/loadingstrategy.js';
import VectorLayer from 'ol/layer/Vector';

const GEOSERVER_BASE_URL = 'http://localhost:8600/geoserver/dev';

// create geoserver generic vector features layer
const featureSource = new VectorSource({
  format: new GeoJSON(),
  url: function (extent) {
    return (
      GEOSERVER_BASE_URL + '/ows?service=WFS&' +
      'version=1.0.0&request=GetFeature&typeName=dev%3Ageneric&maxFeatures=50&' +
      'outputFormat=application%2Fjson&srsname=EPSG:3857&' +
      'bbox=' +
      extent.join(',') +
      ',EPSG:3857'
    );
  },
  strategy: bboxStrategy,
});

const featureLayer = new VectorLayer({
  source: featureSource,
  style: {
    'stroke-width': 0.75,
    'stroke-color': 'white',
    'fill-color': 'rgba(100,100,100,0.25)',
  },
});
3.2 Usando React Refs para acessar objetos OpenLayers
Ao integrar o OpenLayers com o React, é importante inicializar os objetos do OpenLayers uma vez (por exemplo, em um hook onload) e usar Refs para manter referências a esses objetos entre as renderizações.
Isso também permite que a versão atual desses objetos seja acessível em funções de retorno de chamada. Caso contrário, uma versão obsoleta do objeto pode ser fornecida ao retorno de chamada (capturada no momento do fechamento do retorno da chamada).
// react
import React, {  useEffect, useRef } from 'react';
import Map from 'ol/Map'

function MapWrapper(props) {

  // refs are used instead of state to allow integration with 3rd party map onclick callback;
  //  these are assigned at the end of the onload hook
  //  [https:]   const mapRef = useRef();
  const mapElement = useRef();
  const featuresLayerRef = useRef();

  // other logic removed for brevity

  // react onload hook
  useEffect( () => {

    // create map
    const map = new Map({
      // config removed for brevity
    })

    // save map and featureLary references into React refs
    featuresLayerRef.current = featureLayer;
    mapRef.current = map

  },[])

  return (
    <div>
      <div ref={mapElement} className="map-container"></div>
    </div>
  )

}

export default MapWrapper
No exemplo acima, os objetos OpenLayers map, featuresLayer e até mesmo o div mapElement são armazenados como Refs para uso em funções de retorno de chamada fora do React.
3.3 Executando transações WFS a partir de funções de retorno de chamada do OpenLayers
O ponto crucial de todo esse aplicativo é enviar as solicitações de transação WFS para o GeoServer com os dados de recurso do OpenLayers para gravar no PostGIS. Isso é tratado na função de retorno de chamada no onclick do mapa.
import WFS from 'ol/format/WFS';
import GML from 'ol/format/GML32';

const GEOSERVER_BASE_URL = 'http://localhost:8600/geoserver/dev';

// map click handler - uses state and refs available in closure
const handleMapClick = async (event) => {

  // get clicked feature from wfs layer
  // TODO: currently only handles a single feature
  const clickedCoord = mapRef.current.getCoordinateFromPixel(event.pixel);
  const clickedFeatures = featuresLayerRef.current.getSource().getFeaturesAtCoordinate(clickedCoord);
  if (!clickedFeatures.length) return; // exit callback if no features clicked
  const feature = clickedFeatures[0];

  // parse feature properties
  const featureData = JSON.parse(feature.getProperties()['data']);

  // iterate prop to test write-back
  if (featureData.iteration) {
    ++featureData.iteration;
  } else featureData.iteration = 1;

  // set property data back to feature
  feature.setProperties({ data: JSON.stringify(featureData) });
  console.log('clicked updated feature data', feature.getProperties())

  // prepare feature for WFS update transaction
  //  [https:]   const wfsFormatter = new WFS();
  const gmlFormatter = new GML({
    featureNS: GEOSERVER_BASE_URL,
    featureType: 'generic',
    srsName: 'EPSG:3857' // srs projection of map view
  });
  var xs = new XMLSerializer();
  const node = wfsFormatter.writeTransaction(null, [feature], null, gmlFormatter);
  var payload = xs.serializeToString(node);

  // execute POST
  await fetch(GEOSERVER_BASE_URL + '/wfs', {
    headers: new Headers({
      'Authorization': 'Basic ' + Buffer.from('admin:myawesomegeoserver').toString('base64'),
      'Content-Type': 'text/xml'
    }),
    method: 'POST',
    body: payload
  });

  // clear wfs layer features to force reload from backend to ensure latest properties
  //  are available
  featuresLayerRef.current.getSource().refresh();

  // display updated feature data on map
  setFeatureData(JSON.stringify(featureData));
}
O código acima é executado quando o recurso WFS é clicado. Isso aciona a seguinte lógica:
Linhas 11-14: o objeto de feição OpenLayers clicado é identificado
Linhas 17-25: a propriedade iteration do recurso é aumentada em 1 e salva de volta no recurso
Linhas 30-38: o recurso é convertido no formato apropriado para a transação WFS
Linhas 41-48: a solicitação de transação WFS é definida para a instância do Docker GeoServer criada anteriormente no projeto
Linhas 52-55: solicita que o OpenLayers recarregue os dados WFS do GeoServer para garantir que as propriedades de atualização estejam presentes4. Para onde ir a partir daqui
Agora que temos um exemplo de como gravar dados GIS do OpenLayers no PostGIS, podemos expandir este aplicativo para suportar criação e edição de recursos mais complexos. Por exemplo, desenhar recursos com o OpenLayers.
Fonte: Taylor Callsen
-
sur Mappery: Lisbon Metro Map
Publié: 21 October 2024, 1:00pm CEST
Pièce jointe: [télécharger]
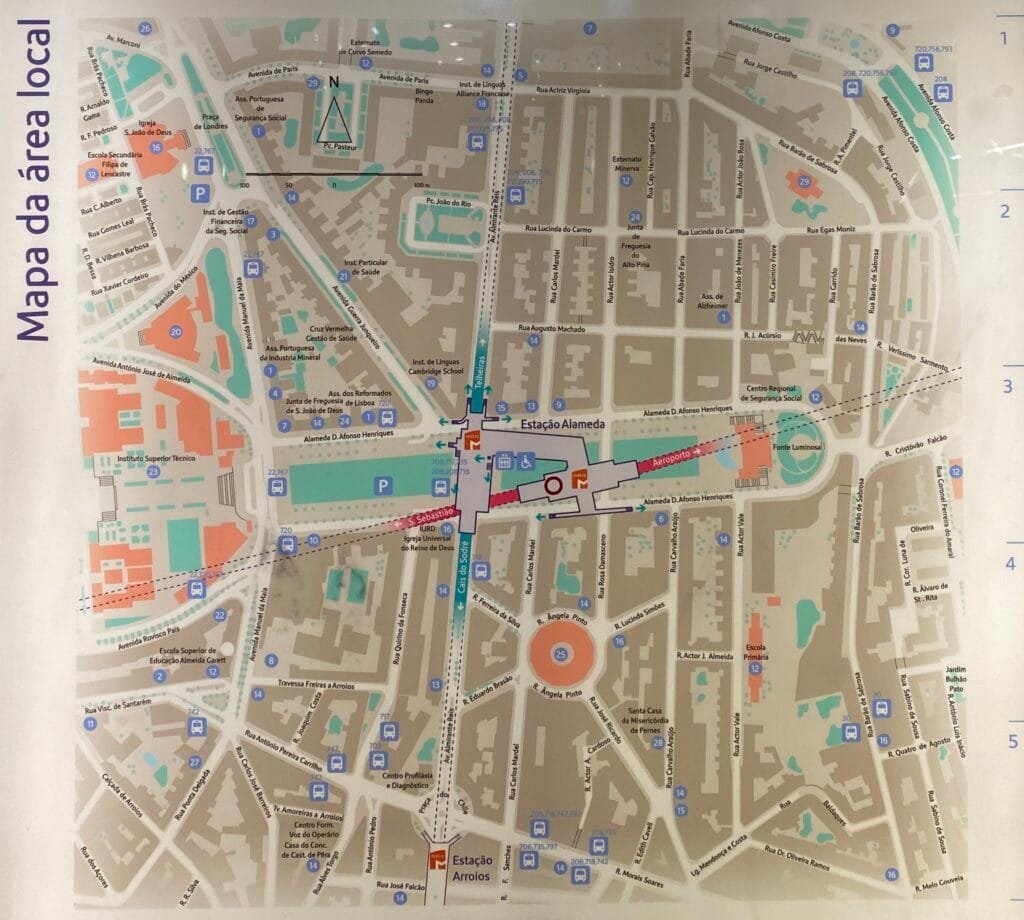
Reinder sent this and said “In metro stations in Lisbon, one can find maps that present a plan of the streets above your head. What I saw there for the first time is that the metro station and metro lines themselves are also depicted on the map: quite convenient for better orientation!”
Impressive.
-
sur Mappery: Chloropleth Embroidery
Publié: 20 October 2024, 1:00pm CEST
Pièce jointe: [télécharger]
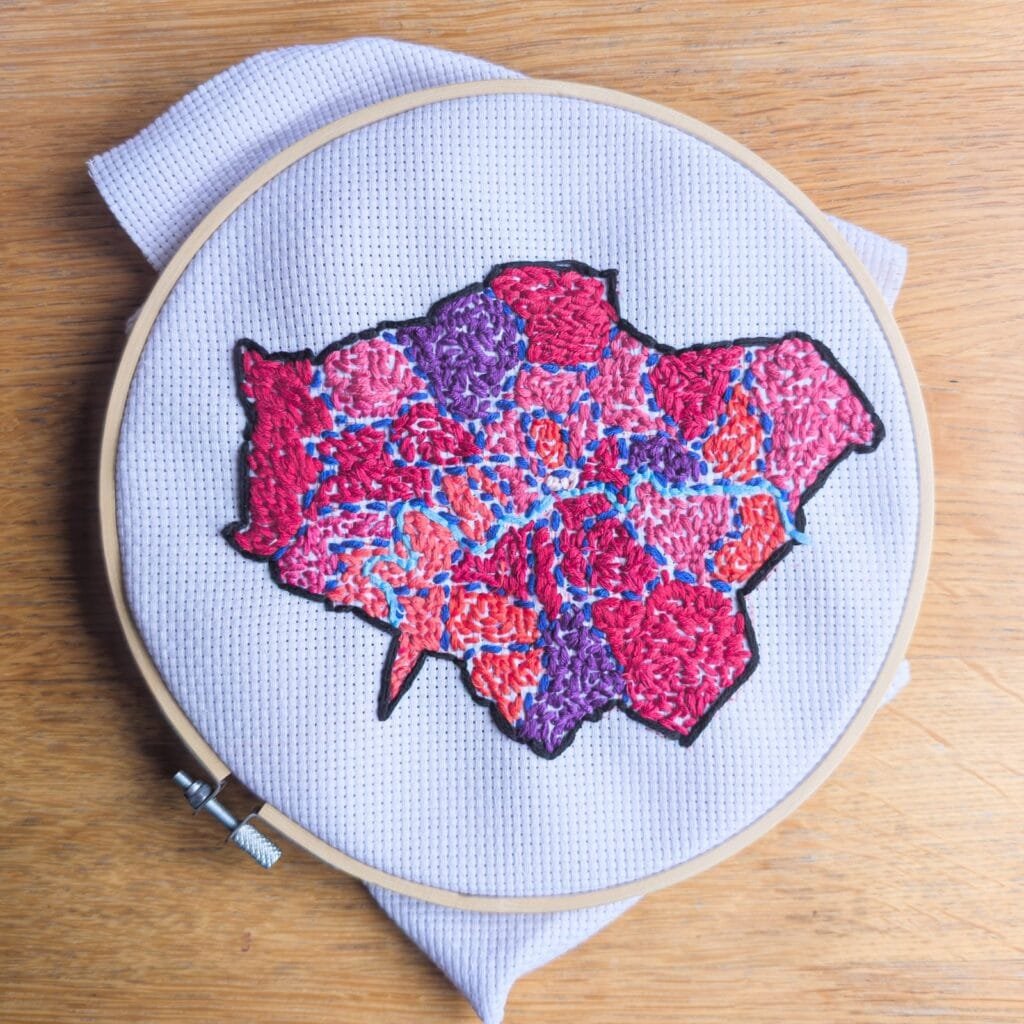
My pal Giuseppe Sollazzo has an incredibly wide range of interests which include geography and embroidery. He recently completed his latest project – “Mission accomplished ? Choropleth of London councils by population, with a terrible palette choice! Data from wikipedia, shapefile from Ordnance Survey”
I asked him what prompted the idea for this embroidered map – “The idea fundamentally came from my recent interest in trying more analogue experiences while not completely giving up my data & digital passions. Which means I’m doing less internet, more ham radio, and less javascript maps and more physical ones. Having recently learned crochet, I thought that embroidery would be great for data visualization. It takes a while so it’s an act of love to data ? But the result is oddly pleasant.”
I think we can all agree that it is more than oddly pleasant! If there was a Nobel Prize for geogeekery, I think Giuseppe would be a winner.
-
sur Mappery: Lighting up Lisbon Airport
Publié: 19 October 2024, 1:00pm CEST
Pièce jointe: [télécharger]
Reinder sent this from Lisbon. Sparkly!
-
sur Markus Neteler: How to contribute to GRASS GIS development
Publié: 18 October 2024, 8:06pm CEST
How to contribute to GRASS GIS development: Guidance for new developers in the GRASS GIS Project.
The post How to contribute to GRASS GIS development appeared first on Markus Neteler Consulting.
-
sur Mappery: Map van
Publié: 18 October 2024, 1:00pm CEST
Pièce jointe: [télécharger]
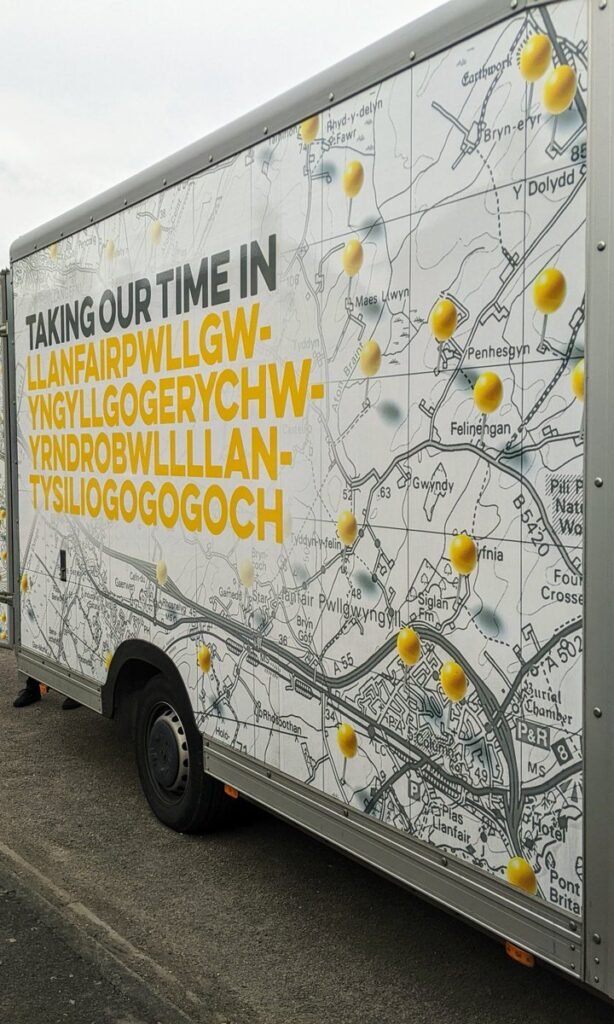
We love Maps on Vans. This one comes from Bob Chell. Thanks for sharing.
-
sur 3liz: Sortie de Lizmap Web Client 3.8
Publié: 17 October 2024, 2:00pm CEST
Lizmap Web Client 3.8Nous sommes heureux d'annoncer la sortie de Lizmap Web Client 3.8, la nouvelle version majeure de l'application.
Financeurs


 Pré-requis et installation
Il est désormais requis d'avoir un QGIS serveur minimum 3.28. Cependant, nous recommandons fortement d'utiliser une version LTR plus récente, comme la version 3.34. Consultez la feuille de route QGIS.
Pour utiliser pleinement cette version 3.8, n'oubliez pas de mettre à jour votre extension Lizmap dans QGIS bureautique. Nous avons écrit un article dédié sur cette version.
Fonctionnalités Demande de tuile unique pour toutes les couchesJusqu'à la version 3.7, Lizmap Web Client effectuait une requête HTTP au serveur QGIS par couche visible.
Désormais, grâce à Faunalia qui a contribué au code source, Lizmap Web Client peut effectuer une seule requête HTTP
GetMapà QGIS Serveur pour toutes les couches visibles (sauf pour les couches ayant un cache actif).Les deux méthodes ont des avantages et des inconvénients. Cette nouvelle option de l'extension peut être très utile pour les projets lourds.
Petite astuce également disponible sur la dernière version 3.7, il est désormais possible de désactiver le permalien automatique avec la case à cocher.
AccrochageLorsque l'accrochage est activé sur une couche, l'utilisateur peut désormais sélectionner dans l'interface Web sur quelle couche s'accrocher.
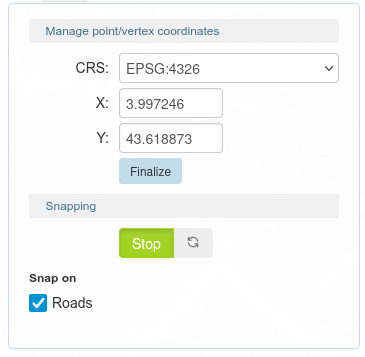
Cette nouvelle fonctionnalité a été développée par Faunalia.
InfobulleLa fonctionnalité d'Infobulle de Lizmap Web Client a été grandement améliorée dans cette dernière version. Avant, côté gauche de la capture d'écran, vous ne pouviez sélectionner qu'un champ à afficher lorsque vous survoliez une entité dans le navigateur Web. Maintenant, comme nous pouvons voir sur le côté droit, nous pouvons écrire un modèle HTML. Comme cela peut prendre en charge des expressions QGIS, nous vous encourageons à migrer votre "ancienne" configuration pour ajouter du HTML.
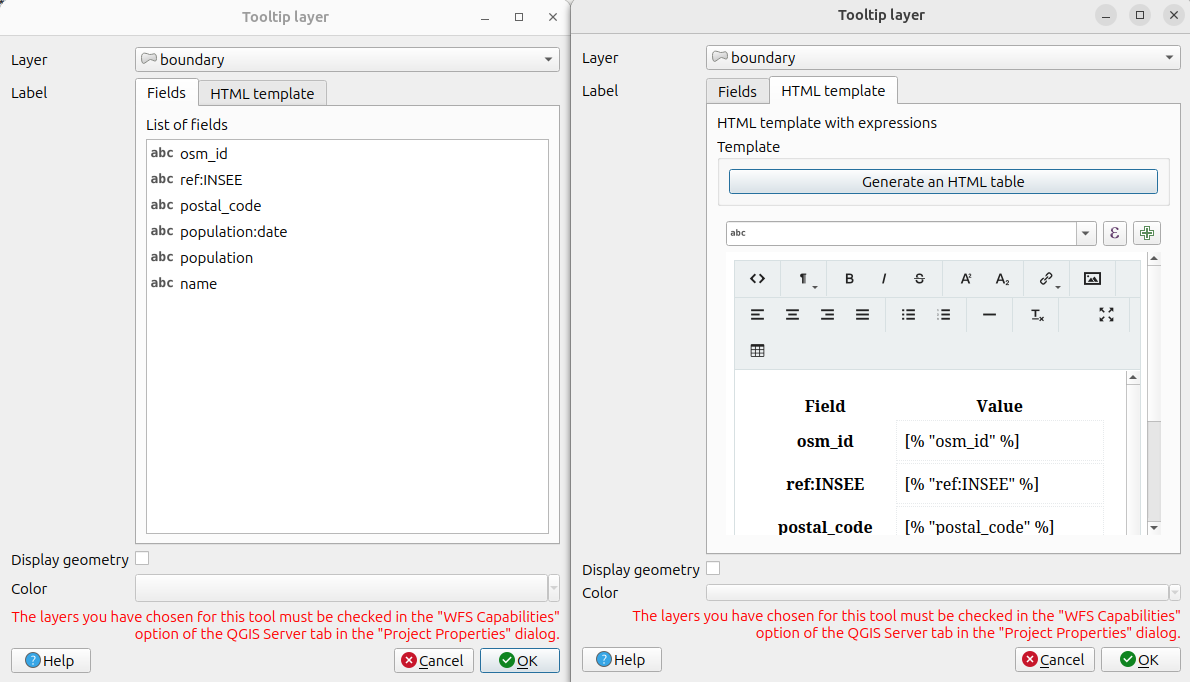
Cette nouveauté a été financée par le PNR Ballons des Vosges.
Navigation sur la carteEn raison de la transition, sous le capot, d'OpenLayers 2 vers OpenLayers 10, la transition entre les différents le niveau de zoom est désormais plus fluide que dans la version 3.7.
Dans 3.7, le choix dans Lizmap concernant la légende était de suivre exactement ce que faisait QGIS Bureautique lors d'un clic dans la légende sur les groupes, sous-groupes et couches.
Après quelques retours d'utilisateurs, nous avons introduit le double clic dans la légende pour basculer tous les éléments enfants.
Filtrage par attribut
Lorsqu'une couche dispose d'un filtrage attributaire sur les utilisateurs ou les groupes, il est désormais possible d'avoir une liste de valeurs séparées par des virgules dans le champ :
id name filter_field 1 one group_a,group_b 2 two group_b 3 three group_b,all 4 four all Cette nouvelle fonctionnalité a été financée par le département du Calvados.
Numérisation et relations au sein du projetPour les relations 1:n et n:m, lorsqu'elles sont dans une popup, les éléments enfants sont correctement placés à l'intérieur de la popup parent selon la configuration QGIS Glisser&Déposer.
Le même comportement existe lors de la modification d'une entité.
De nouveaux boutons pour ajouter des entités liées ont été ajoutés, par exemple dans la table attributaire ci-dessous :
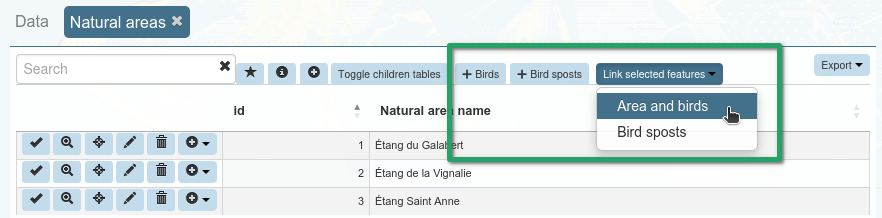
Cette nouvelle fonctionnalité a été développée par Faunalia.
Lors de la numérisation, il y a un bouton Effacer tout.
PopupNous avons introduit un nouveau composant HTML
lizmap-features-tablepour avoir une liste compacte d'entités et les étiquettes d'une couche vecteur. Le Nom d'affichage (Display name) de QGIS est utilisé comme étiquette de l'entité : une expression peut être utilisée pour modifier son contenu, configuré dans l'onglet Info-bulle des propriétés de la couche vecteur de QGIS. Par exemple :CONCAT("quartiers_libquart", ' - ', "libsquart", ' (', to_int(area(@geometry)/10000), ' ha)')produira un texte comme
MONTPELLIER CENTRE - Les Aubes (85 ha)
Vous pouvez trouver plus d'informations sur la page dédiée sur GitHub sur la syntaxe de ce composant HTML.
Cette nouveauté a été financée par la ville d'Avignon.
AdministrationDans le panneau d'administration, sur la page Information serveur, similaire à la liste des extensions QGIS Serveur installées, on peut désormais retrouver la liste des modules Lizmap installés, avec sa version correspondante.
Concernant les extensions, nous avons ajouté un lien HTML vers la page d'accueil de l'extension, afin de vous guider vers quelques informations complémentaires. Cette dernière fonctionnalité viendra également sur les modules plus tard.
Chargement du JavaScript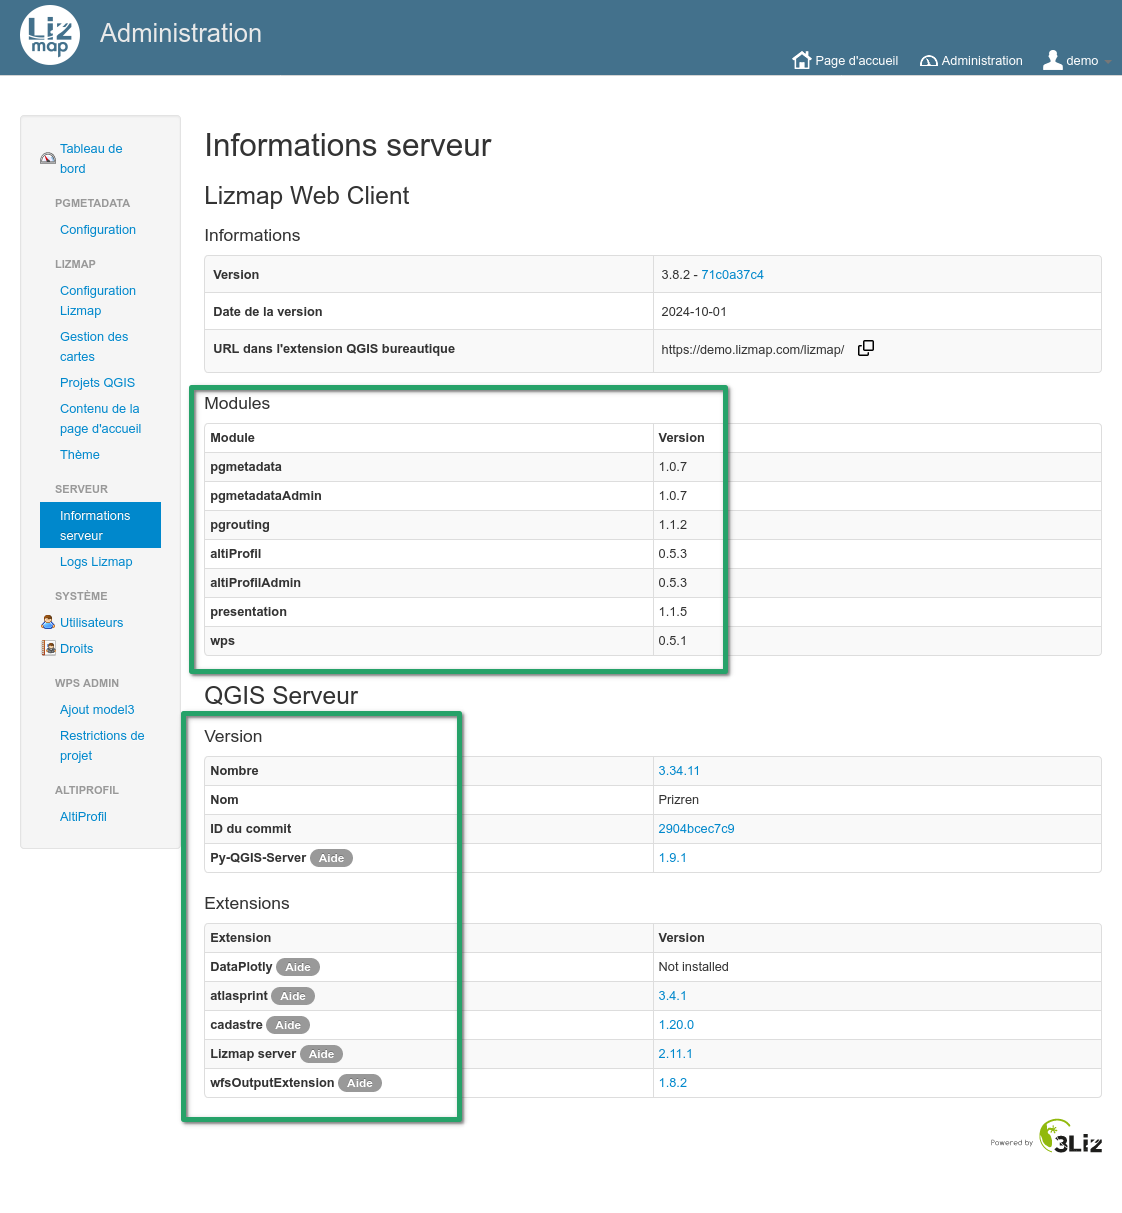
Si un JavaScript génère une erreur lors du chargement de la carte, il existe désormais un bouton pour ouvrir temporairement la carte sans JavaScript complémentaire grâce au paramètre
no_user_defined_js=1dans l'URL. Cela vous permet de charger la carte et vérifiez si l'erreur provient d'un script complémentaire.En passant, nous avons également travaillé sur XSS. Ce travail a commencé il y a quelques versions (en 3.6), mais maintenant en 3.8, il n'est plus possible d'intégrer directement du code JavaScript dans l'info-bulle HTML de QGIS. Vous devez utiliser un fichier
Sous le capot*.jsdédié.La carte OpenLayers 10 est maintenant par-dessus la carte "historique" OpenLayers 2. Certains outils ont été migrés d'OpenLayers 2 vers OpenLayers 10, comme les popups et la localisation par surbrillance d'une couche. Par conséquent, cette version supprime à nouveau certaines dépendances d'OpenLayers 2.
Vous devrez peut-être adapter des scripts JavaScript complémentaires définis par l'utilisateur pour dessiner vos couches OpenLayers par-dessus la carte OpenLayers 10, par exemple.
Documentation sur le codeDepuis la version 3.7, de nombreuses refactorisations de code ont été effectuées du côté JavaScript et PHP. Nous pouvons désormais fournir une documentation HTML sur ces deux langages. Elles sont disponibles sur docs.3liz.org par exemple pour PHP ou pour JavaScript.
Nous vous recommandons fortement d'utiliser la nouvelle API JavaScript lors de l'écriture d'un script JavaScript complémentaire personnalisé.
TéléchargementVous pouvez télécharger le dernier zip sur notre page des sorties.
Pensez à installer la dernière version
3.8.X(et non pas3.8.0par exemple)Vous pouvez également consulter la liste des modifications complètes ("changelog") de la version 3.8.0, en anglais.
ModulesÀ la date du 15 octobre 2024, voici la liste des modules qui ont été mis à jour pour 3.8 :
Les autres modules sont en cours.
Nous espérons que vous allez apprécier cette nouvelle version ?
L'équipe 3Liz
-
sur 3liz: Release of Lizmap Web Client 3.8
Publié: 17 October 2024, 2:00pm CEST
Lizmap Web Client 3.83Liz is pleased to announce the release of Lizmap Web Client 3.8, the new major version of the application.
Funders
Pre-requirements and installation
It is now required to have a minimum QGIS server 3.28. However, we highly recommend using the latest LTR version, i.e. version 3.34. Check the QGIS roadmap.
To take full advantage of this version 3.8, don't forget to update your Lizmap plugin in QGIS desktop. We've written an article dedicated to this version.
Features Single tile request for all layersUntil version 3.7, Lizmap Web Client was doing one HTTP request to QGIS server per visible layer.
Now, thanks to Faunalia which contributed to the source code, Lizmap Web Client can make a single HTTP request
GetMapto QGIS Server for all visible layers (except for layers having a cache enabled).Both methods have strengths and weaknesses. This new option in the plugin, can be very useful for heavy projects.
Quick tip which is available on latest 3.7 as well, it's now possible to disable the automatic permalink with the checkbox.
SnappingWhen snapping is enabled on a layer, the user can now select from the web interface on which layer to snap on.
This new feature have been developed by Faunalia.
TooltipThe "Tooltip" feature in Lizmap Web Client got a great improvement in this latest version. Before, on the left side of the screenshot, you could only select one field to display while hovering a feature in the web browser. Now, as we can see on the right side, we can write an HTML template. We can support QGIS expression, se we encourage you to migrate your "old" configuration to add some nice HTML.
This new feature have been funded by PNR Ballons des Vosges.
Map viewerDue to the transition, under the hood, from OpenLayers 2 to OpenLayers 10, the map transition between different zoom level is now smoother than in the 3.7 release.
In 3.7, the choice in Lizmap about the legend was to follow exactly what QGIS Desktop is doing when clicking in the legend about groups, subgroups and layers.
After some user feedbacks, we could introduce the double click in the legend to toggle all child items.
Attribute filterWhen a layer has an attribute filtering about user or groupes, it's now possible to have a comma separated list of values in the field :
id name filter_field 1 one group_a,group_b 2 two group_b 3 three group_b,all 4 four all This new feature have been funded by Calvados province.
Digitizing and relations within the projectFor both 1:n and n:m relations, when displayed in a popup, the child items are correctly placed inside the parent popup according to the QGIS Drag&Drop configuration relations have been improved.
The same behavior exists when editing a feature.
New buttons to add linked features have been added, for instance in the attribute table below :
This new feature have been developed by Faunalia.
When digitizing, there is a button Erase all.
PopupWe have introduced a new HTML component
lizmap-features-tableto have a nice compact list of vector layer features and labels.The QGIS Display name is used as the feature label: an expression can be used to tweak its content, configured in the Tooltip tab of the QGIS vector layer properties. For example:
CONCAT("quartiers_libquart", ' - ', "libsquart", ' (', to_int(area(@geometry)/10000), ' ha)')will produce a text like
MONTPELLIER CENTRE - Les Aubes (85 ha)You can find more information on the dedicated page on GitHub about the syntax of this HTML component.
This new feature have been funded by Avignon city.
AdministrationIn the administration panel, on the Server information page, similar to the list of QGIS Server plugins installed, we can now find the list of Lizmap modules installed with its own version.
About the plugins, we have added an HTML link to the plugin home page, we can lead you to some information about the plugin itself. This latest feature will come as well on modules later.
JavaScript loadingIf a JavaScript raises an error while loading the map, there is now a button to temporarily open the map without additional user JavaScript script thanks to the flag in the
no_user_defined_js=1. This allows you to ty the map and check if the error come from an additional script.Side note, we have also worked on XSS. This work started a few version ago (in 3.6), but now in 3.8, it's not possible to embed JavaScript code into QGIS HTML maptip directly. You must use a dedicated
Under the hood*.jsfile.The OpenLayers 10 map is now on top on the legacy OpenLayers 2 map. Some tools were migrated from OpenLayers 2 to OpenLayers 10, like popup and locate by layer highlight. Therefore, this version removes again some OpenLayers 2 dependencies.
You might need to adapt some additional user defined JavaScript to draw your OpenLayers layers on top of the OpenLayers 10 map for instance.
Documentation about the codeSince version 3.7, a lot of code refactoring was done on the JavaScript and PHP side. Therefore, we can now provide an HTML documentation about these two languages. Both are available on docs.3liz.org for instance for PHP or for JavaScript.
We strongly recommend you to use the new JavaScript API when writing custom additional JavaScript script.
JavascriptDue to the work which have been done during the legend or other features in Lizmap, some previous Javascript script might not work anymore and need to be adapted.
DownloadYou can download the latest zip on our releases page.
Do not forget to install the latest
3.8.X(and not3.8.0for instance).You can also check the full changelog of version 3.8.0.
ModulesAs of October 15th 2024, this is the list of modules which have been released for 3.8 :
Other modules are work-in-progress.
We hope you will enjoy this new version ?
The 3Liz team
-
sur Mappery: Worn Clothing
Publié: 17 October 2024, 1:00pm CEST
Pièce jointe: [télécharger]
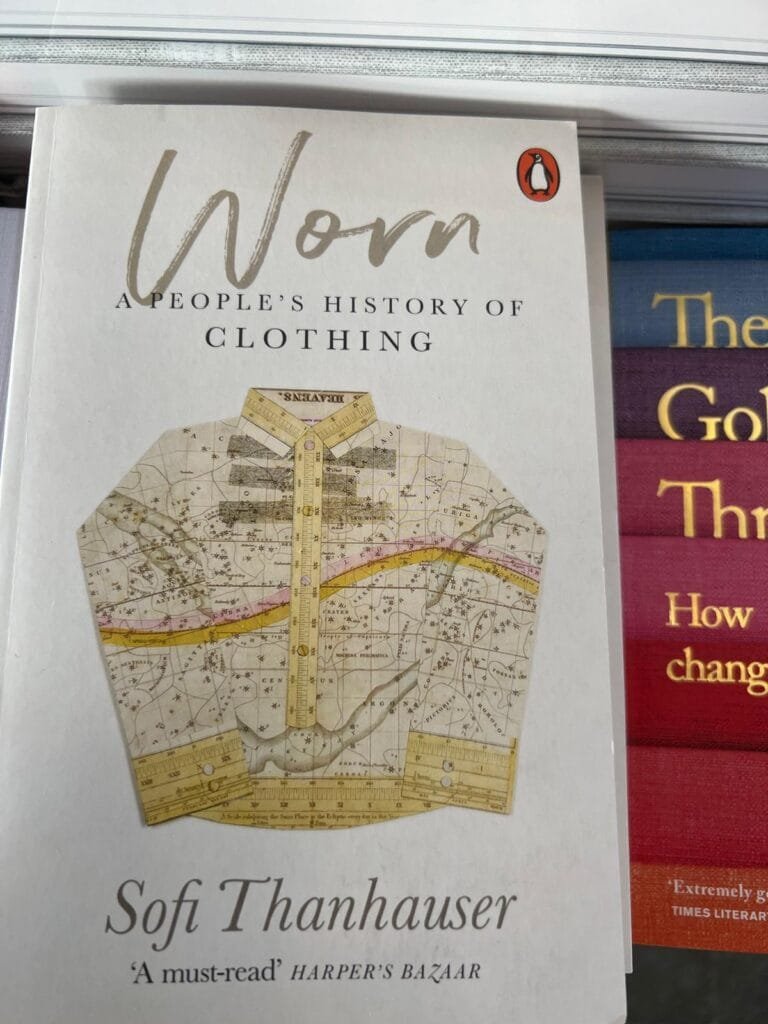
Elizabeth sent me this, beyond the cover I am not sure that this is a book for map lovers.
“A captivating and deeply researched study of the five main fabrics from which clothing is made: linen, cotton, silk, synthetics, and wool. Positing that “there is scarcely a part of the human experience, historic or current, that the story of clothes does not touch,” – Publishers Weekly
-
sur Fernando Quadro: 8 Funções do GIS na Inteligência de Negócios
Publié: 16 October 2024, 4:00pm CEST
O Sistema de Informações Geográficas (GIS) é uma tecnologia que pode ser usada para inteligência de negócios de diversas formas, como:
Análise de Localização
Identifica localizações ideais para novas lojas, armazéns e instalações com base em dados geográficos e demográficos. Segmentação de Mercado
Estratégias de marketing adaptadas para regiões específicas. Otimização da Cadeia de Suprimentos
Planejamento de rotas, logística e gerenciamento de estoque identificando os caminhos mais eficientes para transporte. Gerenciamento de Riscos
Mapeia riscos ambientais e geopolíticos, zonas de desastres naturais, instabilidade política ou pontos críticos de crimes. Insights sobre o Comportamento do Cliente
O GIS rastreia os comportamentos do consumidor geograficamente, identificando padrões e preferências de compra regionais. Gerenciamento de Ativos
Gerenciamento e monitoramento de ativos físicos como equipamentos, veículos ou infraestrutura em vários locais. Análise de Concorrentes
Mapeia as localizações e o alcance de mercado dos concorrentes, fornecendo insights sobre lacunas ou oportunidades. Integração de dados em tempo real
GIS integra dados em tempo real de várias fontes, permitindo a tomada de decisões dinâmicas para ambientes de rápida mudança.Fonte: webgis.tech
Instagram: [https:]]
LinkedIn: [https:]]Gostou desse post? Conte nos comentários
-
sur WhereGroup: Mapbender 4 – Praxisbericht nach dem Major Release
Publié: 16 October 2024, 2:32pm CEST
Seit dem Major Release Mapbender 4.0.0. gibt es erste positive Rückmeldungen. Wir berichten über bereits umgezogene Projekte und nehmen noch einmal Bezug auf unser QGIS2Mapbender-Plugin, mit dem Sie Mapbender-Anwendungen direkt aus QGIS erstellen können. -
sur Mappery: Another embroidery from Anne
Publié: 16 October 2024, 1:00pm CEST
Pièce jointe: [télécharger]
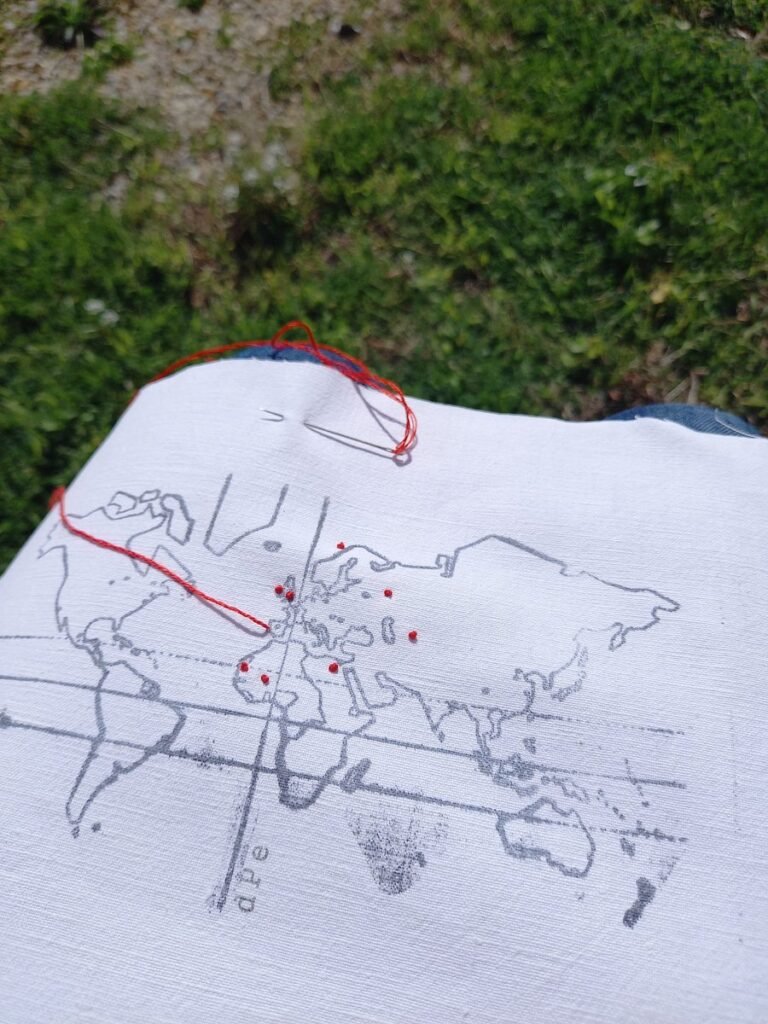
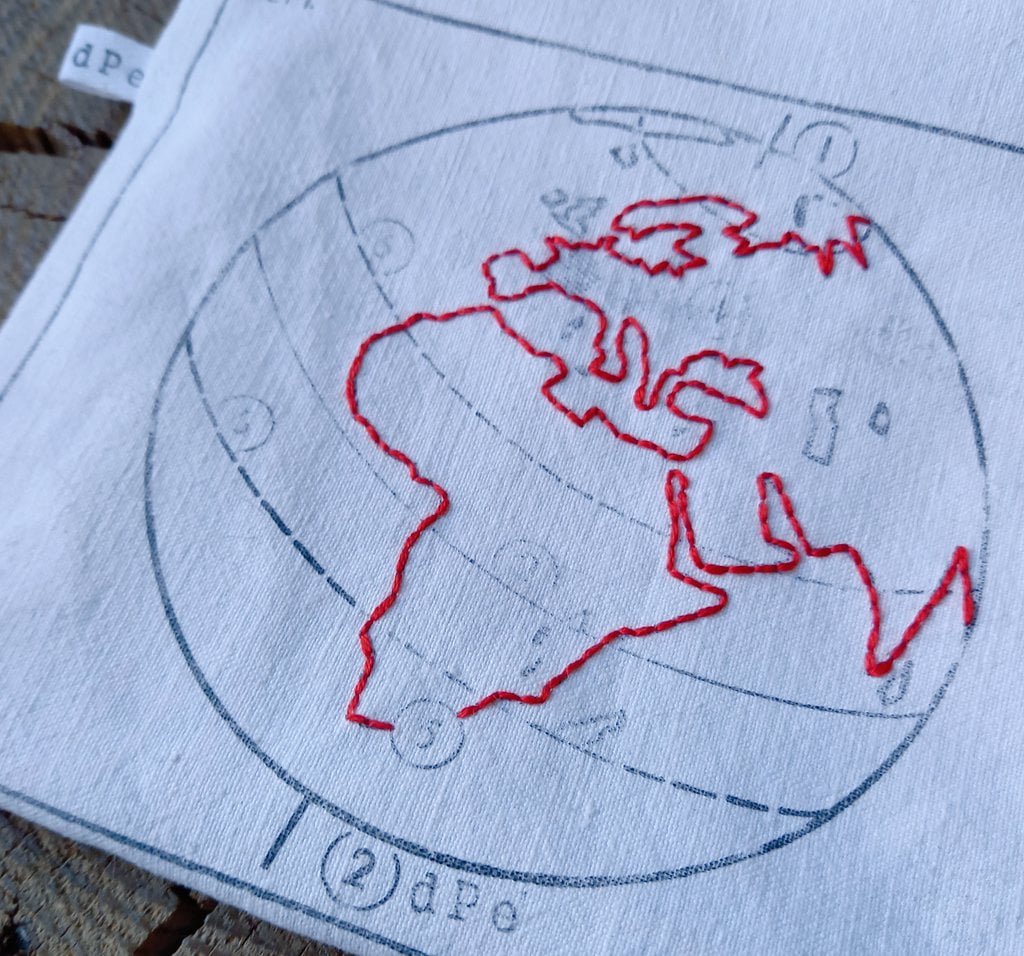
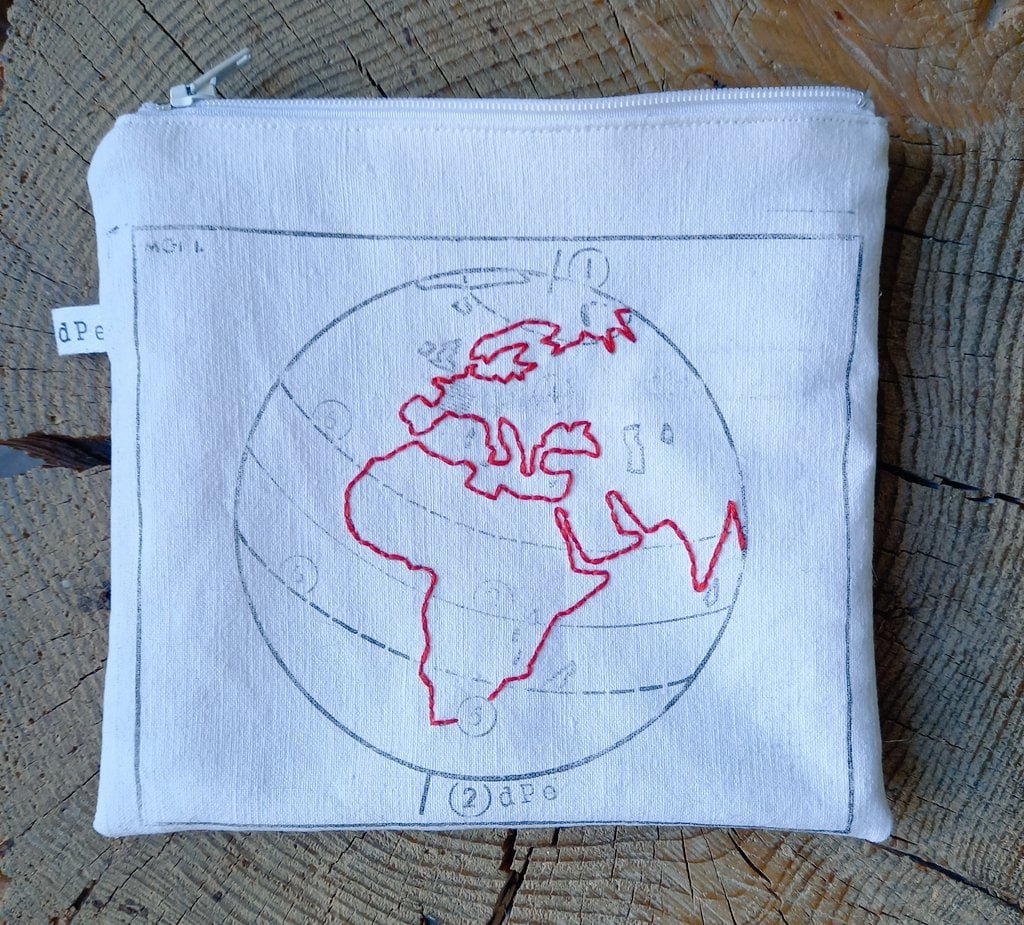
Anne L. shared this Map In The Wild, crafted over a weekend while enjoying the sun in her courtyard.
-
sur Fernando Quadro: Interpolação de dados usando GDAL
Publié: 16 October 2024, 12:03am CEST
Interpolação espacial é uma técnica para estimar valores desconhecidos em locais com base em valores conhecidos em pontos próximos, criando uma superfície contínua a partir de dados discretos.
Como pode ser útil?? Prevê valores em locais não amostrados.
? Preenche lacunas de dados para cobertura de área completa.
? Cria superfícies contínuas a partir de dados de pontos.
? Suporta tomada de decisão em vários campos.
? Permite mapeamento temático e visualização de padrões. A interpolação espacial com GDAL aprimora seus dados GISA interpolação espacial é uma técnica crucial de engenharia de recursos em GIS que estima valores desconhecidos entre pontos de dados conhecidos.
GDAL (Geospatial Data Abstraction Library) oferece ferramentas poderosas para implementar vários métodos de interpolação. Aqui está uma visão geral das principais técnicas:
Ponderação de distância inversa (IDW)
? Método simples e rápido
? Assume que pontos próximos têm mais influência
? Ideal para estimativas rápidasKrigagem
? Método geoestatístico
? Considera a autocorrelação espacial
? Fornece estimativas de incertezaVizinho Natural
? Adapta-se a dados irregularmente espaçados
? Interpolação suave, sem efeito de alvo
? Bom para modelagem de terrenoSpline
? Cria uma superfície suave
? Útil para fenômenos gradualmente variáveis
? Suporta parâmetros de tensão e regularizaçãoA escolha do método de interpolação correto depende das características dos seus dados e dos requisitos do seu projeto.
Gostou desse post? Conte nos comentários
Fonte: webgis.tech
Instagram: [https:]]
LinkedIn: [https:]] -
sur Mappery: The World with Chandeliers
Publié: 15 October 2024, 1:00pm CEST
Pièce jointe: [télécharger]
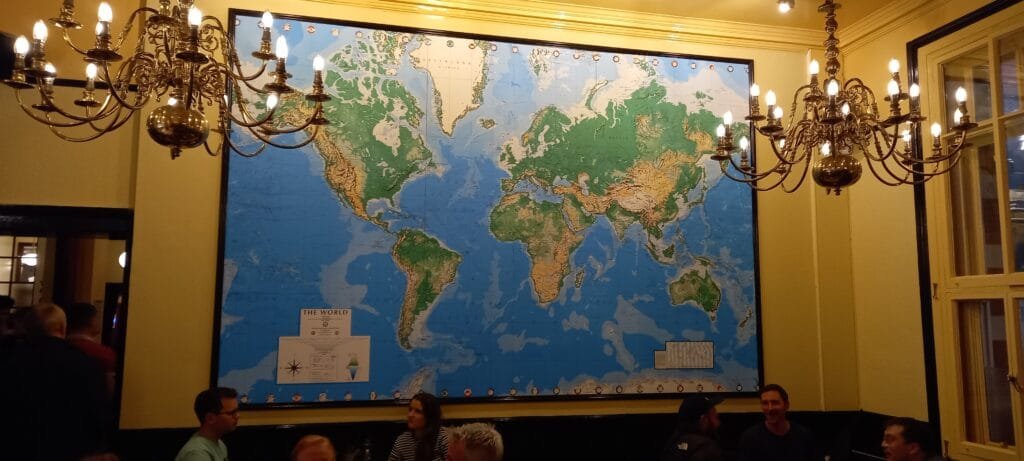
Berl sent me this, he said “Seen on one of the walls of the ‘Leyton Engineer’ pub in East London in what used to be Leyton Town Hall. I was on my way to see a Leyton Orient game and popped in to have a bite to eat and a tipple and meet my son.”
Glad to see that Leyton Council had such a global view.
For those of our readers who don’t know of Leyton Orient, they are a football club based in East London. The name apparently came about as a suggestion from one of their players, Jack R Dearing, who had worked on the Orient Stream Navigation Company (otherwise known as the Orient Line).
-
sur Sean Gillies: Mastodon #20albums
Publié: 15 October 2024, 6:15am CEST
There was this trend a few weeks ago on Mastodon where once a day, for 20 days, you posted the cover of an album that was, for whatever reason, a big deal in your life. I really got into it, thanks to Ed Summers.
20 albums are threaded in the link below. They are in an order that is kind of chronological, enough that you can see me evolve from teenage headbanger to aging hipster.
Post by @sgillies@mastodon.social View on Mastodon
-
sur Mappery: Chart of Knowledge
Publié: 14 October 2024, 1:00pm CEST
Pièce jointe: [télécharger]
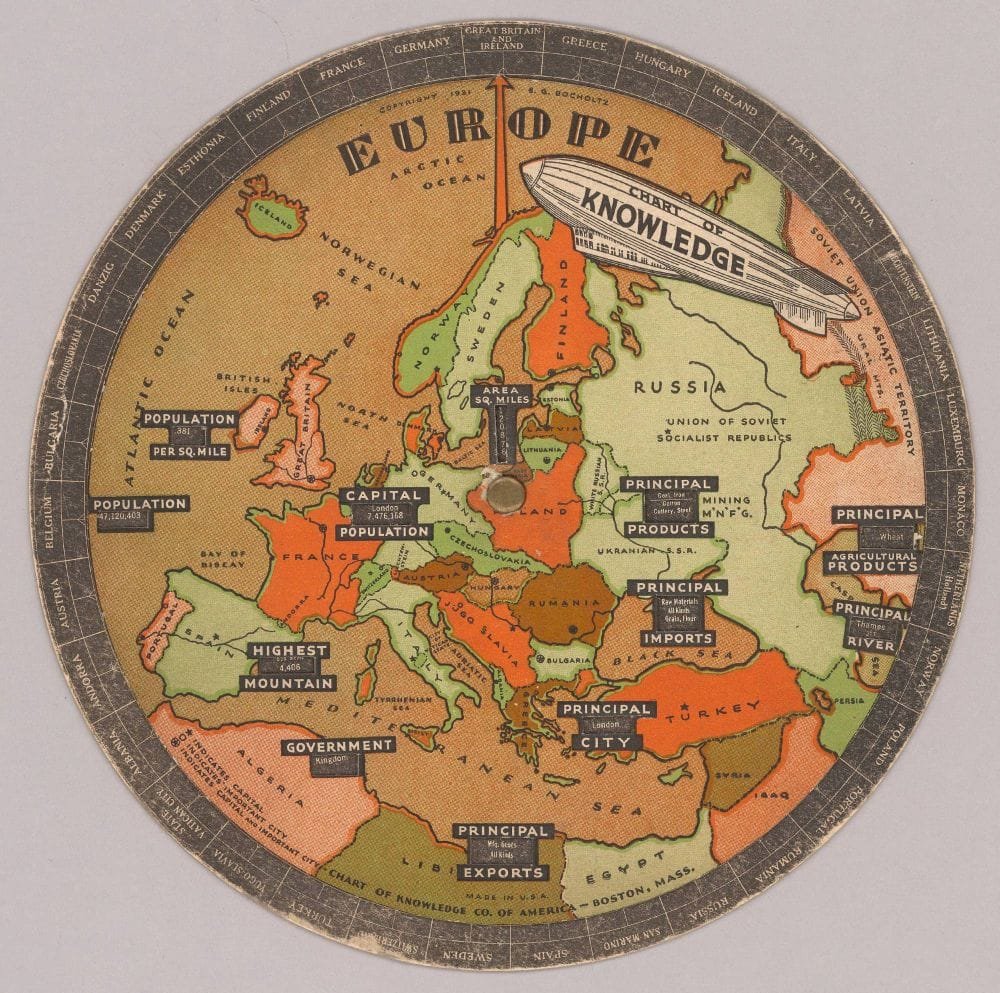
Monsieur LeCartograhe, now also on BlueSky, shared this Chart of Knowledge, 1931 – Bocholtz, S.G.
-
sur GeoSolutions: FREE Webinar: GeoServer 2.26.0 and Beyond
Publié: 14 October 2024, 10:42am CEST
You must be logged into the site to view this content.
-
sur Mappery: A Street Guide that is not Mobile
Publié: 13 October 2024, 1:00pm CEST
Pièce jointe: [télécharger]

Scott Simmons found this street guide in his hotel, “Just got into my room in Taichung, Taiwan and found the wall to be a handy guide. Problem is, I cannot easily carry the wall into the streets, so the picture will have to do. This hotel is just a few blocks from GIS.FCU (GIS Research Center at Feng Chia University), a huge contributor to international standardization ( [https:]] ).”
I wonder what the thinking was to use this street map as decoration?
-
sur Sean Gillies: Running again
Publié: 13 October 2024, 3:51am CEST
After I gave up on The Bear 100 and Black Squirrel in August, I stopped running for 6 weeks to let my Achilles tendonitis subside. I quit using the stair stepper and elliptical machines at the gym, too. My only activities were bike commuting, yoga, weight lifting, and a weekly "HIIT the water" class. I've joked about aquasizing, but have really been getting into this class. The instructor is gung ho, the regulars are friendly, and it's a good, low impact, workout. I'm going to keep doing it this fall and winter, for sure.
On the 20th of September I went for a flat 2 mile run at Pineridge Open Space. It felt great to run outdoors on dirt, and I didn't feel any worse afterwards. I did another easy, flat trail run 4 days later. This week I did two 3.5 mile runs on trails and another session on an elliptical trainer. 2 hours in all. I'm going to try to increase to 3 hours a week by the end of the year.
I'm grateful to be able to run again. With some luck, 2025 could be a good year.
-
sur Mappery: Spot the Map
Publié: 12 October 2024, 1:00pm CEST
Pièce jointe: [télécharger]

Reinder sent this pic of a shop window in Mafra in Portugal. He said there is quite a lot of Mappery in there. I found 6 and maybe 7, how about you?
-
sur Sean Gillies: Rasterio 1.4.0
Publié: 12 October 2024, 5:35am CEST
A month ago I wrote a long-ish post about Fiona 1.10.0. I'll try to keep this one shorter. Rasterio 1.4.0 has three main changes: Python openers, detailed error chaining, and a new statistics API.
Python openers can connect filesystems implemented in Python, like fsspec or tiledb.vfs, to GDAL's own virtual filesystem machinery. In most cases, you should reply on GDAL's built-in virtual filesystem handlers. On the other hand, if you have unique or proprietary data access protocols, then Rasterio's new openers may be useful.
Often enough, I want more visibility into the errors that occur during GDAL I/O functions. I'd like to see all the errors, not just the last one. So, I've implemented Python-like chaining of GDAL errors. It's not perfectly analogous, because we don't have frames for GDAL code like we do for Python, but look at the kind of details you can get now:
>>> src.read()
rasterio._err.CPLE_AppDefinedError: TIFFFillTile:Read error at row 512, col 0, tile 3; got 38232 bytes, expected 47086

The above exception was the direct cause of the following exception:

rasterio._err.CPLE_AppDefinedError: TIFFReadEncodedTile() failed.

The above exception was the direct cause of the following exception:

Traceback (most recent call last):
  File "rasterio/_io.pyx", line 968, in rasterio._io.DatasetReaderBase._read
    io_multi_band(self._hds, 0, xoff, yoff, width, height, out, indexes_arr, resampling=resampling)
  File "rasterio/_io.pyx", line 207, in rasterio._io.io_multi_band
    with stack_errors() as checker:
  File "rasterio/_io.pyx", line 213, in rasterio._io.io_multi_band
    return checker.exc_wrap_int(retval)
  File "rasterio/_err.pyx", line 307, in rasterio._err.StackChecker.exc_wrap_int
    raise last
rasterio._err.CPLE_AppDefinedError: /app/tests/data/corrupt.tif, band 1: IReadBlock failed at X offset 1, Y offset 1: TIFFReadEncodedTile() failed.

The above exception was the direct cause of the following exception:

Traceback (most recent call last):
  File "<console>", line 1, in <module>
  File "rasterio/_io.pyx", line 650, in rasterio._io.DatasetReaderBase.read
    out = self._read(indexes, out, window, dtype, resampling=resampling)
  File "rasterio/_io.pyx", line 971, in rasterio._io.DatasetReaderBase._read
    raise RasterioIOError("Read or write failed. See context for details.") from cplerr
rasterio.errors.RasterioIOError: Read or write failed. See context for details.
Lastly, the flawed, multimodal
statistics()method of datasets has been deprecated and is replaced by new, simplerstats(),clear_stats(), andupdate_stats()methods.Rasterio 1.4.0 remains limited to "classical" rasters, those with a handful of bands or channels all of the same type. For hyperspectral data cubes and the like, you should use h5py, xarray, or other emerging software. I'm quite interested in working on new software in that area, but I'd like to do so without any classical raster legacy.
-
sur Mappery: Arctic Circle
Publié: 11 October 2024, 1:00pm CEST
Pièce jointe: [télécharger]

Matthew Edney sent us this, he said “My father in law at the Arctic Circle, in Dalton, Alaska, the dot for the location is right by his head”
Pretty Cool

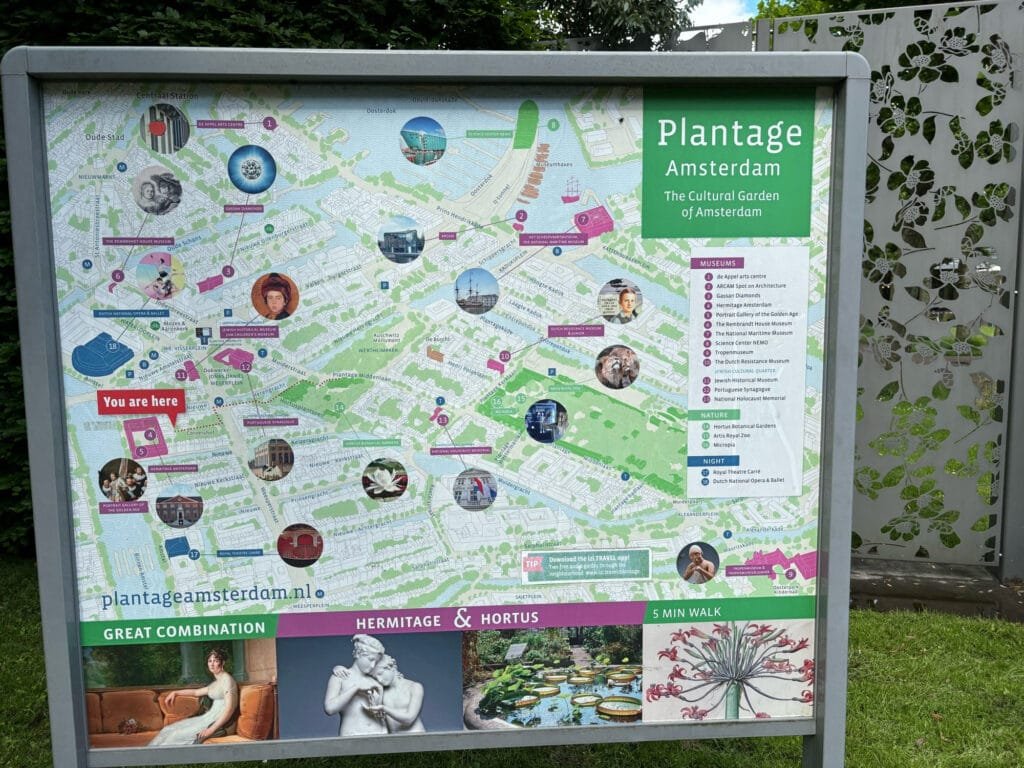


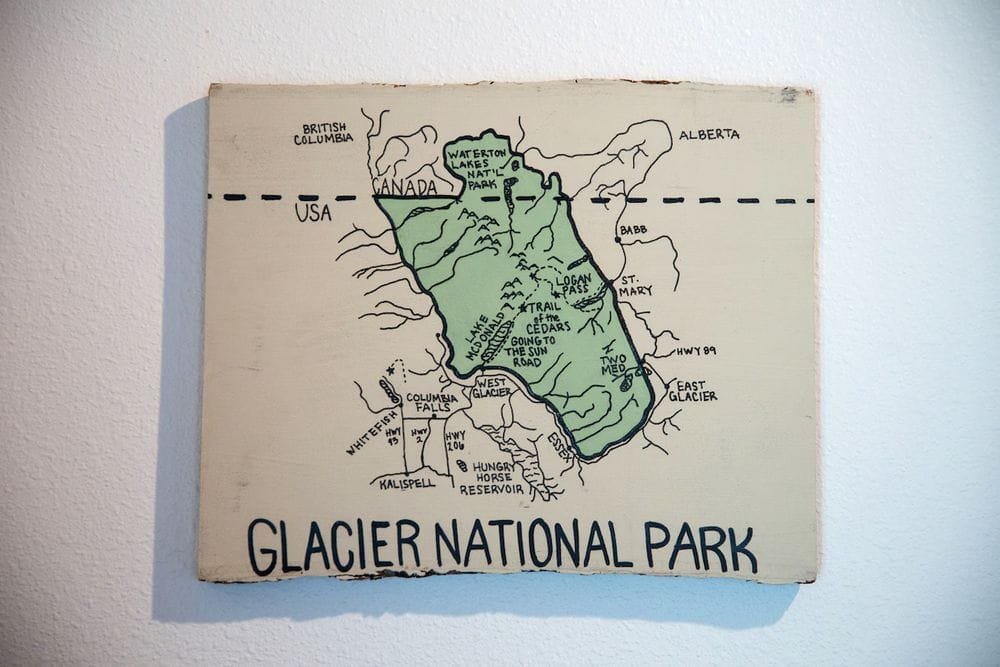