
Vous pouvez lire le billet sur le blog La Minute pour plus d'informations sur les RSS !
Canaux
7090 éléments (557 non lus) dans 56 canaux
 Dans la presse
(418 non lus)
Dans la presse
(418 non lus)
-
 Cybergeo
(351 non lus)
Cybergeo
(351 non lus) -
Revue Internationale de Géomatique (RIG)
-
SIGMAG & SIGTV.FR - Un autre regard sur la géomatique
(6 non lus)
-
Mappemonde
(60 non lus)
-
Dans les algorithmes
(1 non lus)
Du côté des éditeurs
(19 non lus)
-
Imagerie Géospatiale
-
Toute l’actualité des Geoservices de l'IGN
(15 non lus)
-
arcOrama, un blog sur les SIG, ceux d ESRI en particulier (4 non lus)
-
arcOpole - Actualités du Programme
-
Géoclip, le générateur d'observatoires cartographiques
-
Blog GEOCONCEPT FR
Toile géomatique francophone
(91 non lus)
-
Géoblogs (GeoRezo.net) (5 non lus)
-
Conseil national de l'information géolocalisée
(11 non lus)
-
Évènements – Afigéo
-
 Geotribu
-
Les cafés géographiques
(5 non lus)
-
UrbaLine (le blog d'Aline sur l'urba, la géomatique, et l'habitat)
-
Icem7
-
Séries temporelles (CESBIO)
(2 non lus)
-
Datafoncier, données pour les territoires (Cerema)
-
Cartes et figures du monde
-
SIGEA: actualités des SIG pour l'enseignement agricole
-
Data and GIS tips
-
Neogeo Technologies
-
ReLucBlog
-
L'Atelier de Cartographie
-
My Geomatic
-
archeomatic (le blog d'un archéologue à l’INRAP)
-
Cartographies numériques
-
Veille cartographie
-
Makina Corpus (1 non lus)
-
Oslandia
(2 non lus)
-
Camptocamp
(51 non lus)
-
Carnet (neo)cartographique
-
GEOMATIQUE
-
Le blog de Geomatys
(2 non lus)
-
Geomatick
-
CartONG (actualités)
-
Afigéo
(12 non lus)
Géomatique anglophone
(19 non lus)

Planet OSGeo
-
sur TorchGeo: v0.6.0
Publié: 1 September 2024, 2:12pm CEST
TorchGeo 0.6.0 Release NotesTorchGeo 0.6 adds 18 new datasets, 15 new datamodules, and 27 new pre-trained models, encompassing 11 months of hard work by 23 contributors from around the world.
Highlights of this release Multimodal foundation models
There are thousands of Earth observation satellites orbiting the Earth at any given time. Historically, in order to use one of these satellites in a deep learning pipeline, you would first need to collect millions of manually-labeled images from this sensor in order to train a model. Self-supervised learning enabled label-free pre-training, but still required millions of diverse sensor-specific images, making it difficult to use newly launched or expensive commercial satellites.
TorchGeo 0.6 adds multiple new multimodal foundation models capable of being used with imagery from any satellite/sensor, even ones the model was not explicitly trained on. While GASSL and Scale-MAE only support RGB images, DOFA supports RGB, SAR, MSI, and HSI with any number of spectral bands. It uses a novel wavelength-based encoder to map the spectral wavelength of each band to a known range of wavelengths seen during training.
The following table describes the dynamic spatial (resolution), temporal (time span), and/or spectral (wavelength) support, either via their training data (implicit) or via their model architecture (explicit), offered by each of these models:
Model Spatial Temporal Spectral DOFA implicit - explicit GASSL implicit - - Scale-MAE explicit - - TorchGeo 0.6 also adds multiple new unimodal foundation models, including DeCUR and SatlasPretrain.
Source Cooperative migration
TorchGeo contains a number of datasets from the recently defunct Radiant MLHub:
- AgriFieldNet Competition Dataset
- Smallholder Cashew Plantations in Benin
- Sentinel-2 Cloud Cover Segmentation Dataset
- CV4A Kenya Crop Type Competition
- Tropical Cyclone Wind Estimation Competition
- Marine Debris Dataset for Object Detection in Planetscope Imagery
- Rwanda Field Boundary Competition Dataset
- South Africa Crop Type Competition
- SpaceNet Datasets
- Western USA Live Fuel Moisture
These datasets were recently migrated to Source Cooperative (and AWS in the case of SpaceNet), but with a completely different file format and directory structure. It took a lot of effort, but we have finally ported all of these datasets to the new download location and file hierarchy. As an added bonus, the new data loader code is significantly simpler, allowing us to remove 2.5K lines of code in the process!
OSGeo community project
TorchGeo is now officially a member of the OSGeo community! OSGeo is a not-for-profit foundation for open source geospatial software, providing financial, organizational, and legal support. We are in good company, with other OSGeo projects including GDAL, PROJ, GEOS, QGIS, and PostGIS. Membership in OSGeo promotes advertising of TorchGeo to the community, and also ensures that we follow best practices for the stability, health, and interoperability of the open source geospatial ecosystem.
All TorchGeo users are encouraged to join us on Slack, join our Hugging Face organization, and join us in OSGeo using any of the following badges in our README:
Lightning Studios support

TorchGeo has always had a close collaboration with Lightning AI, including active contributions to PyTorch Lightning and TorchMetrics. In this release, we added buttons allowing users to launch our tutorial notebooks in the new Lightning Studios platform. Lightning Studios is a more powerful version of Google Colab, with reproducible software and data environments allowing you to pick up where you left off, VS Code and terminal support, and the ability to quickly scale up to a large number of GPUs. All TorchGeo tutorials have been confirmed to work in both Lightning Studios and Google Colab, allowing users to get started with TorchGeo without having to invest in their own hardware.
Backwards-incompatible changes- All Radiant MLHub datasets have been ported to the Source Cooperative file hierarchy (#1830)
- GeoDataset: the bbox sample key was renamed to bounds in order to support Kornia (#2199)
- Chesapeake7 and Chesapeake13: datasets were removed when updating to the 2022 edition (#2214)
- Benin Cashews and Rwanda Field Boundary: remove
os.path.expanduserfor consistency (#1705) - LEVIR-CD and OSCD:
imageskey was split intoimage1andimage2for change detection (#1684, #1696) - EuroSAT:
B08Awas renamed toB8Ato match Sentinel-2 (#1646)
- aws-cli: to download datasets from AWS (#2203)
- azcopy: to download datasets from Azure (#2064)
- prettier: for YAML file formatting (#2018)
- ruff: for code style and documentation testing (#1994)
- radiant-mlhub: website no longer exists (#1830)
- rarfile: datasets rehosted as zip files (#2210)
- zipfile-deflate: no longer needed for newer Chesapeake data (#2214)
- black: replaced by ruff (#1994)
- flake8: replaced by ruff (#1994)
- isort: replaced by ruff (#1994)
- pydocstyle: replaced by ruff (#1994)
- pyupgrade: replaced by ruff (#1994)
- python: 3.10+ required following SPEC 0 (#1966)
- fiona: 1.8.21+ required (#1966)
- kornia: 0.7.3+ required (#1979, #2144)
- lightly: 1.4.5+ required (#2196)
- lightning: 2.3 not supported due to bug (#2155, #2211)
- matplotlib: 3.5+ required (#1966)
- numpy: 1.21.2+ required (#1966), numpy 2 support added (#2151)
- pandas: 1.3.3+ required (#1966)
- pillow: 3.3+ required (#1966), jpeg2000 support required (#2209)
- pyproj: 3.3+ required (#1966)
- rasterio: 1.3+ required (#1966)
- shapely: 1.8+ required (#1966)
- torch: 1.13+ required (#1358)
- torchvision: 0.14+ required (#1358)
- h5py: 3.6+ required (#1966)
- opencv: 4.5.4+ required (#1966)
- pycocotools: 2.0.7+ required (#1966)
- scikit-image: 0.19+ required (#1966)
- scipy: 1.7.2+ required (#1966)
- AgriFieldNet (#1873)
- CaBuAr (#2235)
- ChaBuD (#1259)
- Digital Typhoon (#1748)
- EuroSAT Spatial (#2074)
- GeoNRW (#2209)
- I/O Bench (#1972)
- LEVIR-CD (#1770)
- LEVIR-CD+ (#1707)
- QuakeSet (#1997)
- Sentinel-2 + CDL (#1889)
- Sentinel-2 + EuroCrops (#1869)
- Sentinel-2 + NCCM (#1950)
- Sentinel-2 + South America Soybean (#1959)
- South Africa Crop Type (#1970)
- VHR-10 (#1082)
- Remove torchgeo.datamodules.utils.dataset_split (#2005)
- EuroSAT: make sure normalization is actually applied (#2176)
- Fix plotting in datamodules when dataset is a subset (#2003)
- AgriFieldNet (#1459)
- Airphen (#1803)
- CaBuAr (#2235)
- ChaBuD (#1259)
- CropHarvest (#1677)
- Digital Typhoon (#1748)
- EuroCrops (#1813)
- EuroSAT Spatial (#2074)
- GeoNRW (#2209)
- I/O Bench (#1972)
- LEVIR-CD (#1770)
- Northeast China Crop Map (#1666)
- PRISMA (#1743)
- QuakeSet (#1997)
- SkyScript (#2253)
- South Africa Crop Type (#1840)
- South America Soybean (#1668)
- SpaceNet 8 (#2203)
- Benin Cashews: migrate to Source Cooperative (#2116)
- Benin Cashews: remove
os.path.expanduserfor consistency (#1705) - BigEarthNet: fix broken download link (#2174)
- CDL: add 2023 checksum (#1844)
- Chesapeake: update to 2022 edition (#2214)
- ChesapeakeCVPR: reuse NLCD colormap (#1690)
- Cloud Cover: migrate to Source Cooperative (#2117)
- CV4A Kenya Crop Type: migrate to Source Cooperative (#2090)
- EuroSAT: rename
B08AtoB8Ato match Sentinel-2 (#1646) - FireRisk: redistribute on Hugging Face (#2000)
- GlobBiomass: add min/max timestamp (#2086)
- GlobBiomass: use float32 for pixelwise regression mask (#2086)
- GlobBiomass: fix length of dataset (#2086)
- L7 Irish: convert to IntersectionDataset (#2034)
- L8 Biome: convert to IntersectionDataset (#2058)
- LEVIR-CD+: split
imageintoimage1andimage2for change detection (#1696) - NASA Marine Debris: migrate to Source Cooperative (#2206)
- OSCD: support fine-grained band selection (#1684)
- OSCD: split
imageintoimage1andimage2for change detection (#1696) - PatternNet: redistribute on Hugging Face (#2100)
- RESISC45: redistribute on Hugging Face (#2210)
- Rwanda Field Boundary: don't plot empty masks during testing (#2254)
- Rwanda Field Boundary: migrate to Source Cooperative (#2118)
- Rwanda Field Boundary: remove
os.path.expanduserfor consistency (#1705) - SpaceNet 1–7: migrate to Source Cooperative (#2203)
- Tropical Cyclone: migrate to Source Cooperative (#2068)
- VHR-10: redistribute on Hugging Face (#2210)
- VHR-10: improved plotting (#2092)
- Wester USA Live Fuel Moisture: migrate to Source Cooperative (#2206)
- Add support for
pathlib.Pathto all datasets (#2173) - Datasets can now use command-line utilities to download (#2064)
- GeoDataset:
bboxkey was renamed tobounds(#2199) - GeoDataset: ignore other bands for separate files (#2222)
- GeoDataset: don't warn about missing files for downloadable datasets (#2033)
- RasterDataset: allow subclasses to specify which resampling algorithm to use (#2015)
- RasterDataset: use nearest neighbors for int and bilinear for float by default (#2015)
- RasterDataset: calculate resolution after changing CRS (#2193)
- RasterDataset: support date_str containing % character (#2233)
- RasterDataset: users can now specify the min/max time of a dataset (#2086)
- VectorDataset: add
dtypeattribute to match RasterDataset (#1869) - VectorDataset: extract timestamp from filename to match RasterDataset (#1814)
- IntersectionDataset: ignore 0 area overlap (#1985)
- DatasetNotFoundError: when a dataset has not yet been downloaded (#1714, #2053)
- DependencyNotFoundError: when an optional dependency is not installed (#2054)
- RGBBandsMIssingError: when you try to plot a dataset but don't use RGB bands (#1737, #2053)
- RandomGeoSampler: fix performance regression, 60% speedup with preprocessed data (#1968)
- I/O Bench (#1972)
- Explicitly specify batch size (#1928, #1933)
- MoCo: explicitly specify memory bank size (#1931)
- Semantic Segmentation: support
ingore_indexwhen using Jaccard loss (#1898) - SimCLR: switch from Adam to LARS optimizer (#2196)
- SimCLR: explicitly specify memory bank size (#1931)
- Use Kornia's AugmentationSequential for all model weights (#1979)
- Update TorchGeo's AugmentationSequential to support object detection (#1082)
- Datasets: add license information about every dataset (#1732)
- Datasets: update link to cite SSL4EO-L dataset (#1942)
- Models: emphasize new multimodal foundation models (#2236)
- Trainers: update num_classes parameter description (#2101)
- Add button for the new Lightning Studios (#2146)
- Remove button for the recently defunct Planetary Computer Hub (#2107)
- Custom Raster Datasets: download the dataset before calling super (#2177)
- Custom Raster Datasets: fix typo (#1987)
- Transforms: update EuroSAT band names to match Sentinel-2 (#1646)
- README: fix CLI example (#2142)
- README: add Hugging Face badge (#1957)
- README: fix example of creating fake raster data (#2162)
- Read the Docs: use latest Ubuntu version to build (#1954)
- Allow horizontal scrolling of wide tables (#1958)
- Fix broken links and redirects (#2267)
- Ensure all functions have type hints (#2217)
- Make all class variables immutable (#2218)
- Check for unreachable code (#2241)
- Datasets: test dataset length (#2084, #2089)
- Datamodules: don't download during testing (#2215, #2231)
- download_url: add shared fixture to avoid code duplication (#2232)
- load_state_dict: add shared fixture to avoid code duplication (#1932)
- load_state_dict_from_url: add shared fixture to avoid code duplication (#2223)
- torch_hub: add fixture to avoid downloading checkpoints to home directory (#2265)
- Pytest: silence warnings (#1929, #1930, #2224)
- PyVista: headless plotting (#1667)
- Check numpy 2 compliance (#2151)
- Coverage: use newer flag to override ignores (#2260)
- Dependabot: update devcontainer (#2025)
- Dependabot: group torch and torchvision (#2025)
- Labeler: update to v5 (#1759)
- macOS: disable pip caching (#2024)
- Windows: fail fast mode (#2225)
This release is thanks to the following contributors:
@adamjstewart
@alhridoy
@ashnair1
@burakekim
@calebrob6
@cookie-kyu
@DarthReca
@Domejko
@favyen2
@GeorgeHuber
@isaaccorley
@kcrans
@nilsleh
@oddeirikigland
@pioneerHitesh
@piperwolters
@robmarkcole
@sfalkena
@ShadowXZT
@shreyakannan1205
@TropicolX
@wangyi111
@yichiac -
sur Mappery: Lambeth Palace
Publié: 1 September 2024, 1:00pm CEST

Simon Wrigley found this beautiful window near the entrance to Lambeth Palace.
Rounding the corner, He found it was not one window but two – one with each hemisphere of the globe. It looks like a Nicolosi Globular Projection, which is a Double hemispheric polyconic map projection

MapsintheWild Lambeth Palace
-
sur Mappery: It’s a Squishy World
Publié: 31 August 2024, 1:00pm CEST
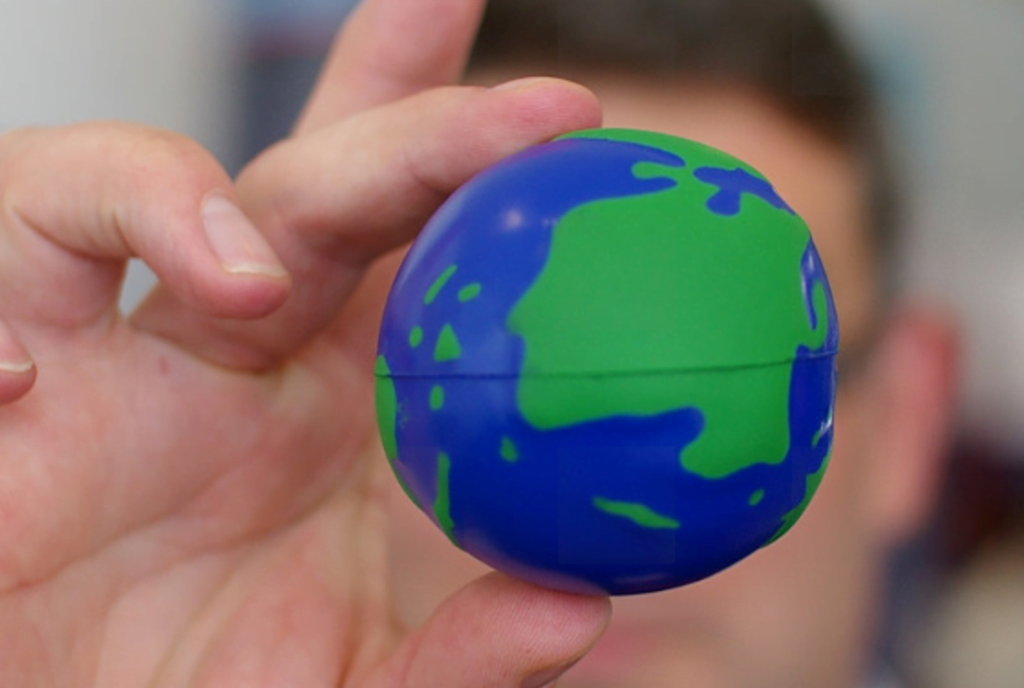
Barry shared this pic of a globe style stress ball, I think it may originate from a proprietary software vendor
MapsintheWild It’s a Squishy World
-
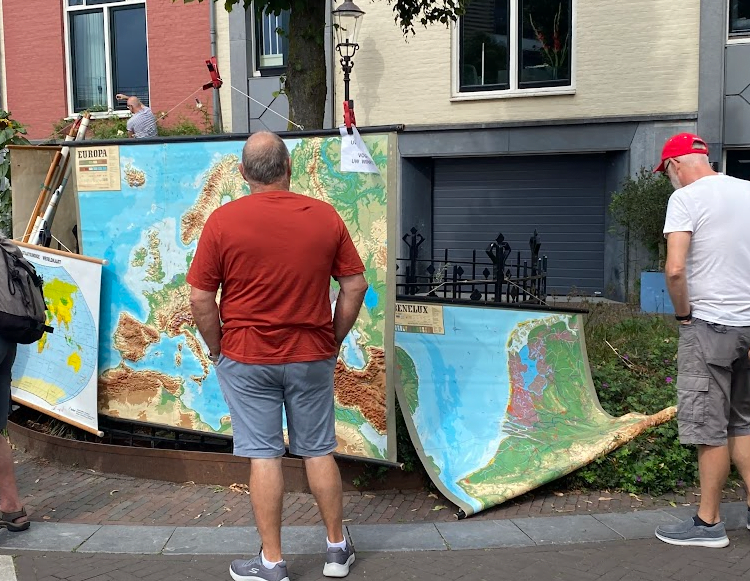
sur Mappery: Collette
Publié: 30 August 2024, 1:00pm CEST
Reinder shared this pic of a shop window display “Cartographically inspired shop window of the 2nd hand bookshop Colette in The Hague”
MapsintheWild Collette
-
sur Free and Open Source GIS Ramblings: Building spatial analysis assistants using OpenAI’s Assistant API
Publié: 29 August 2024, 10:15pm CEST
Earlier this year, I shared my experience using ChatGPT’s Data Analyst web interface for analyzing spatiotemporal data in the post “ChatGPT Data Analyst vs. Movement Data”. The Data Analyst web interface, while user-friendly, is not equipped to handle all types of spatial data tasks, particularly those involving more complex or large-scale datasets. Additionally, because the code is executed on a remote server, we’re limited to the libraries and tools available in that environment. I’ve often encountered situations where the Data Analyst simply doesn’t have access to the necessary libraries in its Python environment, which can be frustrating if you need specific GIS functionality.
Today, we’ll therefore start to explore alternatives to ChatGPT’s Data Analyst Web Interface, specifically, the OpenAI Assistant API. Later, I plan to dive deeper into even more flexible approaches, like Langchain’s Pandas DataFrame Agents. We’ll explore these options using spatial analysis workflow, such as:
- Loading a zipped shapefile and investigate its content
- Finding the three largest cities in the dataset
- Selecting all cities in a region, e.g. in Scandinavia from the dataset
- Creating static and interactive maps
To try the code below, you’ll need an OpenAI account with a few dollars on it. While gpt-3.5-turbo is quite cheap, using gpt-4o with the Assistant API can get costly fast.
OpenAI Assistant APIThe OpenAI Assistant API allows us to create a custom data analysis environment where we can interact with our spatial datasets programmatically. To write the following code, I used the assistant quickstart and related docs (yes, shockingly, ChatGPT wasn’t very helpful for writing this code).
Like with Data Analyst, we need to upload the zipped shapefile to the server to make it available to the assistant. Then we can proceed to ask it questions and task it to perform analytics and create maps.
from openai import OpenAI

client = OpenAI()

file = client.files.create(
  file=open("H:/ne_110m_populated_places_simple.zip", "rb"),
  purpose='assistants'
)
Then we can hand the file over to the assistant:
assistant = client.beta.assistants.create(
  name="GIS Analyst",
  instructions="You are a personal GIS data analyst. Write and rund code to answer geospatial analysis questions",
  tools=[{"type": "code_interpreter"}],
  model="gpt-3.5-turbo",  # or "gpt-4o"
  tool_resources={
    "code_interpreter": {
      "file_ids": [file.id]
    }
  }
)
Then we can start asking questions and giving our assistant tasks:
thread = client.beta.threads.create()

message = client.beta.threads.messages.create(
  thread_id=thread.id,
  role="user",
  content="Please load the zipped shapefile and describe the content"
)
assistant > The shapefile has been successfully loaded as a GeoDataFrame with the following details:

- The GeoDataFrame has 243 entries.
- It contains a total of 38 columns with various data types including integer, float, and object types.
- One of the columns is a geometry column representing the spatial information.

If you have any specific analysis or visualizations you would like to perform on this data, feel free to let me know!
The docs have a nice example for how to stream the answers back, e.g. into a Jupyter notebook. I’ve used it to create a small convenience function:
def ask_another_question(question):
    message = client.beta.threads.messages.create(
        thread_id=thread.id,
        role="user",
        content=question
    )
    with client.beta.threads.runs.stream(
        thread_id=thread.id,
        assistant_id=assistant.id,
        event_handler=EventHandler(),
    ) as stream:
        stream.until_done()

ask_another_question("Please list the three largest cities")
assistant > code_interpreter # Sort the GeoDataFrame by the population in descending order largest_cities = gdf.sort_values(by='pop_max', ascending=False).head(3)[['name', 'pop_max']] largest_cities assistant > The three largest cities in the dataset, along with their maximum population numbers, are as follows: 1. Tokyo: 35,676,000 2. New York: 19,040,000 3. Mexico City: 19,028,000 These cities have the highest recorded maximum population numbers in the dataset. Let me know if you need any further information or analysis!ask_another_question("extract all scandinavian cities ")assistant > To extract all the Scandinavian cities from the dataset, we can filter the GeoDataFrame based on the countries typically considered part of Scandinavia. These countries include Norway, Sweden, Denmark, Finland, and sometimes Iceland. Let's filter the GeoDataFrame to extract the Scandinavian cities. assistant > code_interpreter # List of countries typically considered part of Scandinavia scandinavian_countries = ['Norway', 'Sweden', 'Denmark', 'Finland', 'Iceland'] # Filter the GeoDataFrame for Scandinavian cities scandinavian_cities = gdf[gdf['adm0name'].isin(scandinavian_countries)][['name', 'adm0name']] scandinavian_cities.head() # Displaying the first few Scandinavian cities assistant > Here are some of the Scandinavian cities extracted from the dataset: 1. Reykjavík, Iceland 2. Oslo, Norway 3. Helsinki, Finland 4. København (Copenhagen), Denmark 5. Stockholm, Sweden These are just a few examples of Scandinavian cities present in the dataset. If you would like the complete list or perform any specific analysis on these cities, feel free to let me know!ask_another_question( "please create a world map with all cities (use gray circles) " "with scandinavian cities highlighted as red circles. " )assistant > To create a world map with all cities represented as gray circles and Scandinavian cities highlighted as red circles, we will use the GeoPandas library for mapping. Let's go ahead and create the map. assistant > code_interpreter import matplotlib.pyplot as plt # Plot all cities with gray circles and Scandinavian cities with red circles fig, ax = plt.subplots(figsize=(12, 8)) # Plot all cities in gray circles gdf.plot(ax=ax, color='lightgrey', markersize=5) # Plot Scandinavian cities in red circles scandinavian_cities.plot(ax=ax, color='red', markersize=50, edgecolor='black', label='Scandinavian Cities') # Set the title ax.set_title('World Map with Scandinavian Cities Highlighted', fontsize=16) # Add legend ax.legend() # Display the map plt.show() assistant > It seems that there was an error while plotting the map because the GeoDataFrame `scandinavian_cities` does not have the necessary numeric data to plot the map directly. ... plt.show() output > assistant > Here is the world map with all cities represented as gray circles and Scandinavian cities highlighted as red circles. The map provides a visual representation of the locations of the Scandinavian cities in relation to the rest of the cities around the world. If you need any further assistance or modifications, feel free to let me know!To load and show the image, we can use:
import matplotlib.pyplot as plt
import matplotlib.image as mpimg

def show_image():
    messages = client.beta.threads.messages.list(thread_id=thread.id)

    for m in messages.data:
        if m.role == "user":
            continue
        if m.content[0].type == 'image_file':
            m.content[0].image_file.file_id
            image_data = client.files.content(messages.data[0].content[0].image_file.file_id)
            image_data_bytes = image_data.read()
            with open("./out/my-image.png", "wb") as file:
                file.write(image_data_bytes)
            image = mpimg.imread("./out/my-image.png")
            plt.imshow(image)
            plt.box(False)
            plt.xticks([])
            plt.yticks([])
            plt.show()
            break
Asking for an interactive map in an html file works in a similar fashion.
You can see the whole analysis workflow it in action here:
This way, we can use ChatGPT to perform data analysis from the comfort of our Jupyter notebooks. However, it’s important to note that, like the Data Analyst, the code we execute with the Assistant API runs on a remote server. So, again, we are restricted to the libraries available in that server environment. This is an issue we will address next time, when we look into Langchain.
ConclusionChatGPT’s Data Analyst Web Interface and the OpenAI Assistant API both come with their own advantages and disadvantages.
The results can be quite random. In the Scandinavia example, every run can produce slightly different results. Sometimes the results just use different assumptions such as, e.g. Finland and Iceland being part of Scandinavia or not, other times, they can be outright wrong.
As always, I’m interested to hear your experiences and thoughts. Have you been testing the LLM plugins for QGIS when they originally came out?
-
sur Mappery: Topo Map Chocolate
Publié: 29 August 2024, 1:00pm CEST
-
sur EOX' blog: Sentinel-2 Cloudless 2023
Publié: 29 August 2024, 4:00am CEST
We are thrilled to announce the latest release of EOxCloudless 2023 imagery. Whether you are an existing customer or new to EOxCloudless, this latest update offers clarity with beautiful sceneries and is designed to meet the needs of our users in a convenient way. With the everchanging and more cha ... -
sur Oslandia: (Fr) [Story] Oslandia x QWC : épisode 1 / 8
Publié: 28 August 2024, 6:51pm CEST
Sorry, this entry is only available in French.
-
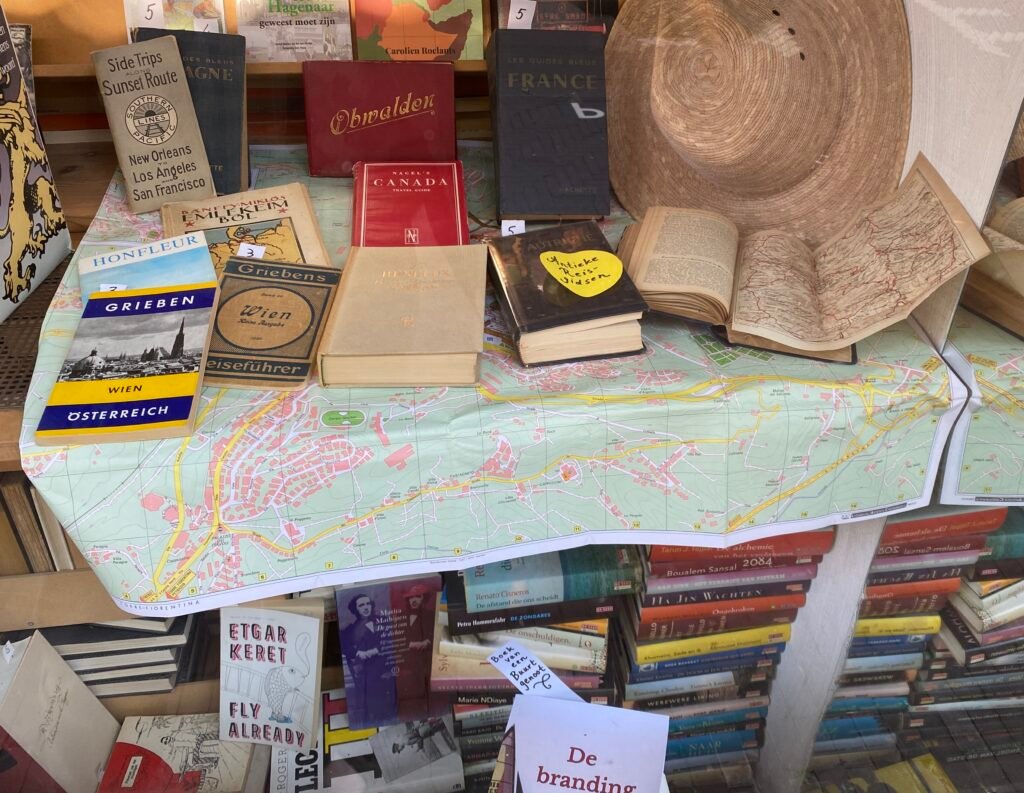
sur Mappery: Deventer
Publié: 28 August 2024, 1:00pm CEST
Reinder sent these pics from the second hand book market in Deventer “… at the largest 2nd hand book market of Europe (August 4, 2024) of course there was also some cartographical material for sale.”

MapsintheWild Deventer
-
sur Mappery: Keighley & Worth Valley Railway
Publié: 27 August 2024, 1:00pm CEST
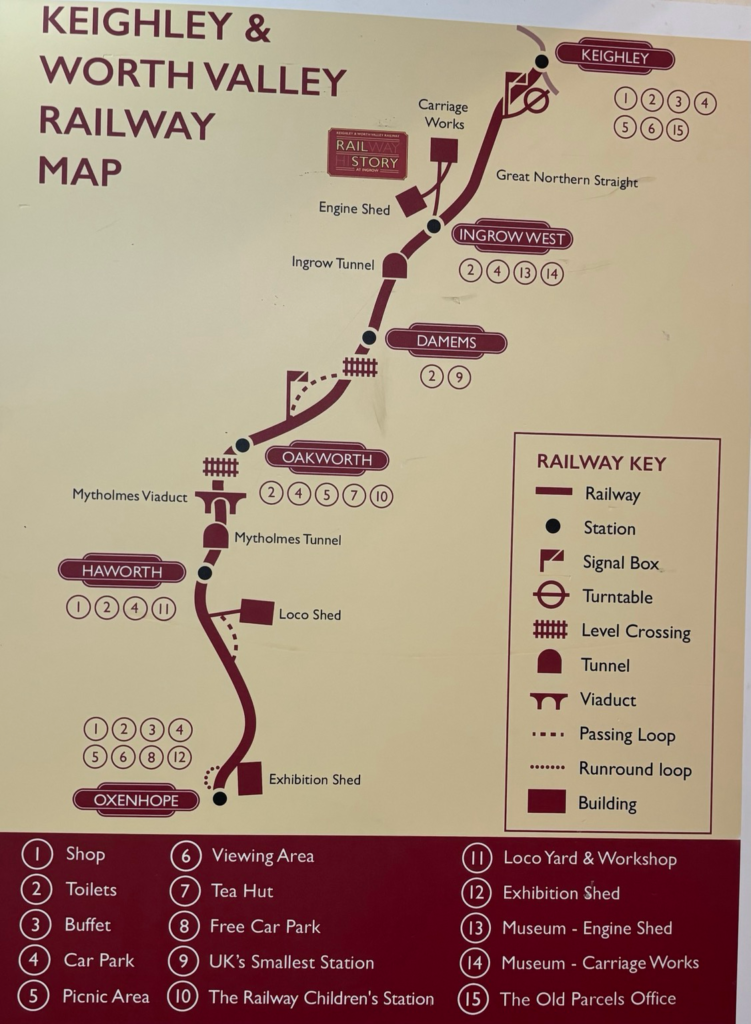
Doug shared this old railway map, you might think this an old relic that he spotted but – no! This 150 year old railway line closed in 1962 and was reopened a few years later, you can read more here and you can still travel on the line.
MapsintheWild Keighley & Worth Valley Railway
-
sur GeoTools Team: GeoTools 30.5 released
Publié: 26 August 2024, 1:23pm CEST
The GeoTools team is pleased to the release of the latest stable version of GeoTools 30.5:geotools-30.5-bin.zip geotools-30.5-doc.zip geotools-30.5-userguide.zip geotools-30.5-project.zip This release is also available from the OSGeo Maven Repository and is made in conjunction with GeoServer 2.24.5. The release was made by Andrea Aime (Geosolutions) -
sur Mappery: Globe Teapot
Publié: 26 August 2024, 1:00pm CEST

Another one from Reinder Storm. “Don’t remember whether I sent this before, don’t remember where and when I saw this one – but I do know that I like it …”
I am sure the tea will have an international flavour in this pot.
MapsintheWild Globe Teapot
-
sur Mappery: Mount Rainier Time Map
Publié: 25 August 2024, 1:00pm CEST
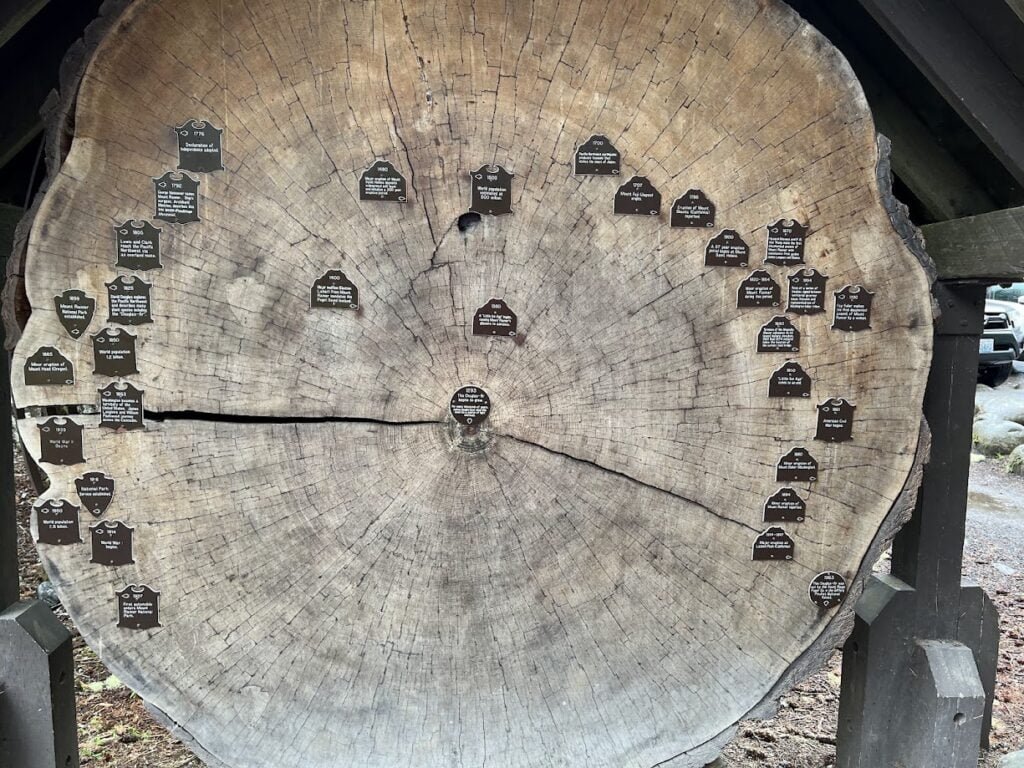
Another pic from Krista Mott’s roadtrip. “At Mount Rainier National Park there was one of the felled Douglas-fir, that began to grow in 1293, depicts a map of time”
I am expecting a bit of “That’s not a map!” feedback but it sure looks like one to me and it definitely is wild.
MapsintheWild Mount Rainier Time Map
-
sur Mappery: Phillipines in Ipswich, Massachusetts
Publié: 24 August 2024, 1:00pm CEST

Judy Tymon sent us this pic “I found this map at a new local cafe here in Ipswich Massachusetts. The cafe is called “The M Cafe”, M for Manila, capital of the Philippines. I liked it because it shows the outline of the country along with the lat/long. And of course the cafe is owned by a woman from the Philippines.”
MapsintheWild Phillipines in Ipswich, Massachusetts
-
sur Free and Open Source GIS Ramblings: MovingPandas 0.19 released!
Publié: 23 August 2024, 8:30pm CEST

This release is the first to support GeoPandas 1.0.
Additionally, this release adds multiple new features, including:
- New explore() function adds interactive folium / leaflet maps
- New support for mfjson trajectory

For the full change log, check out the release page.
We have also revamped the documentation at [https:]] using the PyData Sphinx Theme:

On a related note: if you know what I need to change to get all Trajectory functions listed in the TOC on the right, please let me know.
-
sur geomatico: Ética y economia: ¿son viables los proyectos geoespaciales de software libre?
Publié: 23 August 2024, 2:56pm CEST
Pièce jointe: [télécharger]
Jornadas SIG Libre 2024
En la XVII edición de las Jornadas de SIG Libre, debate plenario sobre «viabilidad económica de los proyectos de software libre en datos geoespaciales» en el que participamos con Òscar Fonts, nuestro CTO.
- 0:00 Introducción Gemma Boix, directora del SIGTE – UdG
- 2:30 Angelos Tzotsos (OSGeo)
- 29:20 Óscar Fonts (Geomatico)
- 42:40 Josep Lluís Sala (BGeo)
- 55:30 Iván Sánchez
-
sur Mappery: Light Pollution in the Netherlands
Publié: 23 August 2024, 1:00pm CEST
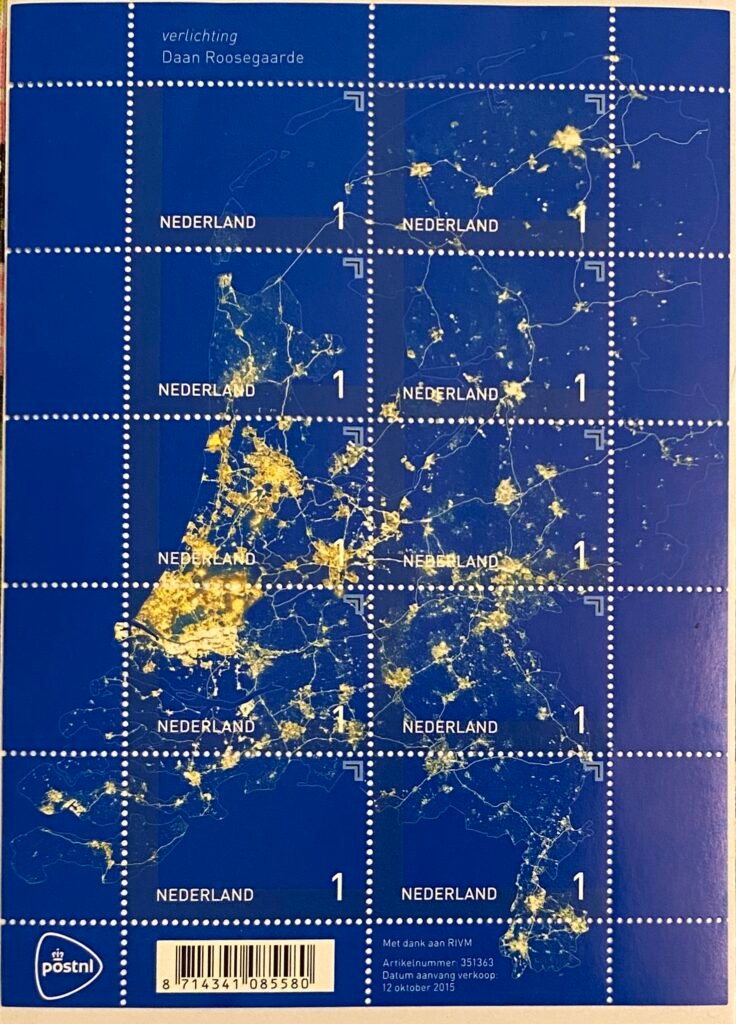
Reinder shared these stamps “These stamps were issued in The Netherlands in 2015. They present an image of light pollution. Artist / designer Daan Roosegaarde has created these illuminated stamps for PostNL. The stamp sheet shows a modern map of the Netherlands on a clear night in spring. The stamps provide insight into the daily use of light.”
We haven’t had that many maps in the wild stamps, surely there must be a load more out there?
MapsintheWild Light Pollution in the Netherlands
-
sur Mappery: Where do you come from?
Publié: 22 August 2024, 1:00pm CEST
Krista Mott sent us this pic from her roadtrip in the north west US. “On the way home, we stopped in Seattle at Pike Place Market where I found this “Show us where you came from!” map. Quite a great representation of visitors from around the world.
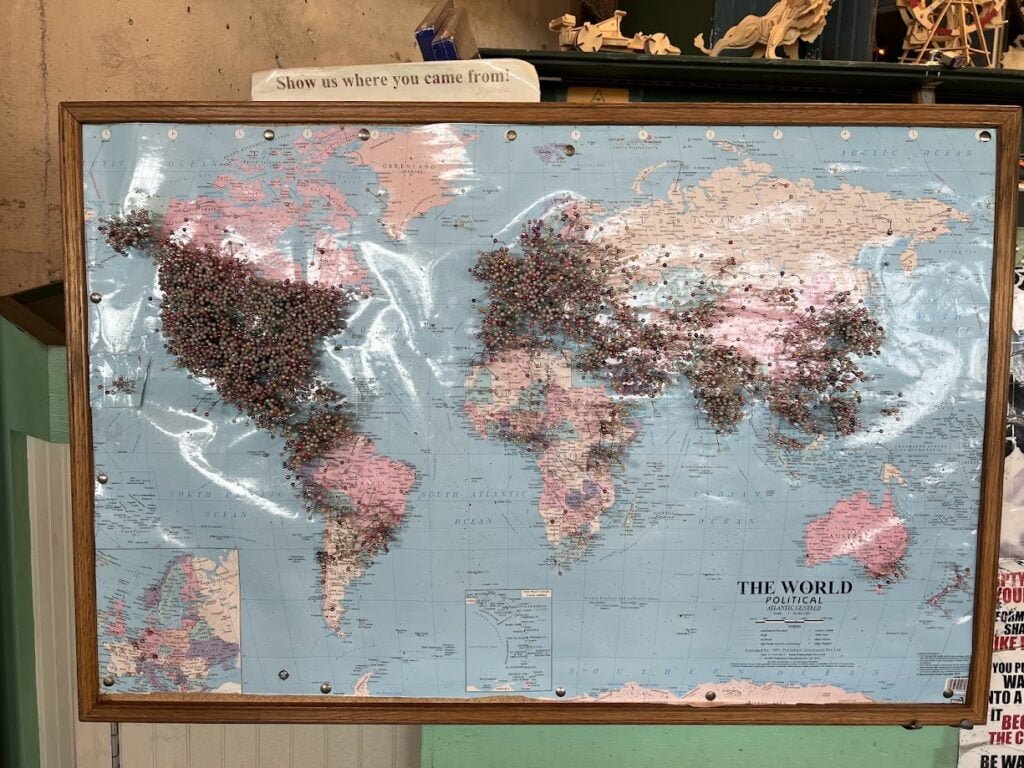
MapsintheWild Where do you come from?
-
sur Mappery: Global Architectural Salvage
Publié: 21 August 2024, 1:00pm CEST

Reinder is on form at the moment with a string of great pics.
“in a shop / workplace where they sell (an awful lot of) antique building materials. I’m not sure whether this is stained glass — or some other technique. I’m sure that I like it!” – we like it too, I think it is painted glass rather than stained
 Screenshot
MapsintheWild Global Architectural Salvage
-
sur Mappery: The Places of Hawaii
Publié: 20 August 2024, 1:00pm CEST
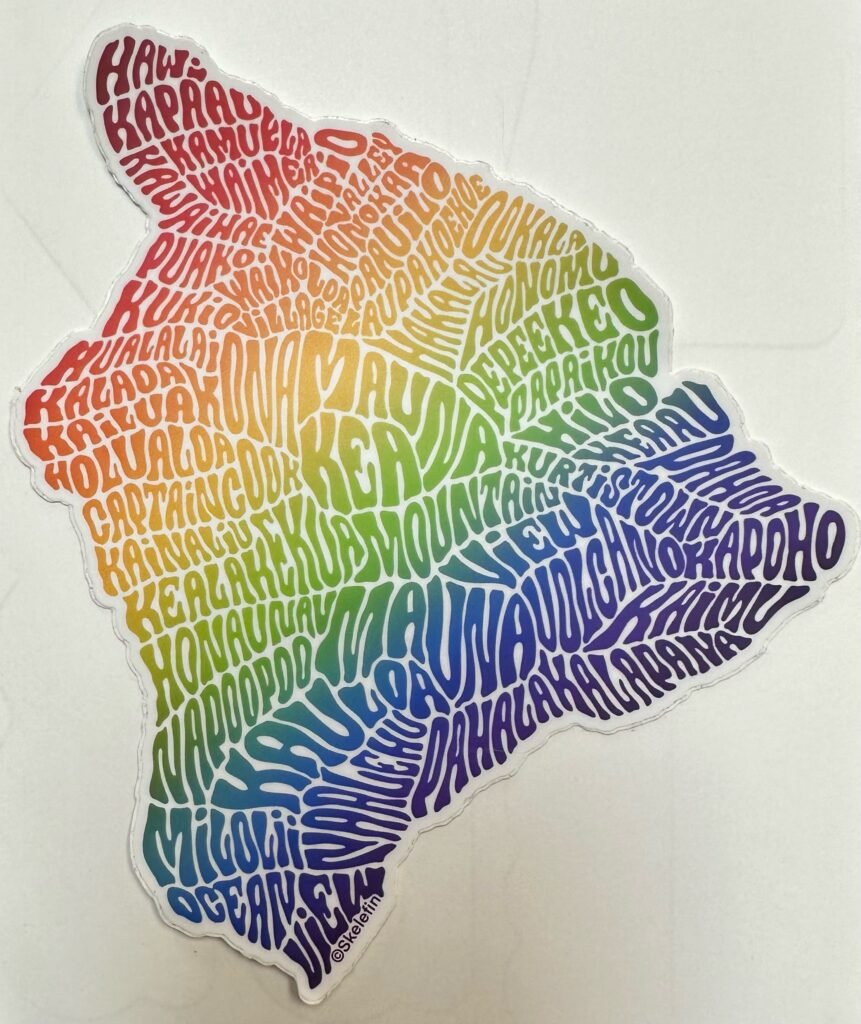
Scott Simmons sent us a pic of this superb sticker from Hawaii, “I found this great sticker on a recent vacation to the island of Hawai’i. The place names are all in their approximate correct location and the artist cleverly chose more important names to prioritize, while still filling the map quite evenly.”
Let’s have some more of these
MapsintheWild The Places of Hawaii
-
sur Mappery: The Parade
Publié: 19 August 2024, 1:00pm CEST

Reinder shared these pics of a gig that he saw recently, the band seem to be very into globes and maps.
“… on the Parade: a travelling theatrical festival in the Netherlands, 18th of July 2024. Cf [https:]] .
“Pop-music meets theater in a light-hearted and quirky concert. Looking at the mysterious word “fundamental”, these men create a bit of chaos in all order. Don’t we see the world fundamentally different than it really is: a dustball in the wind?”
I did quite like it and hope you do as well.”
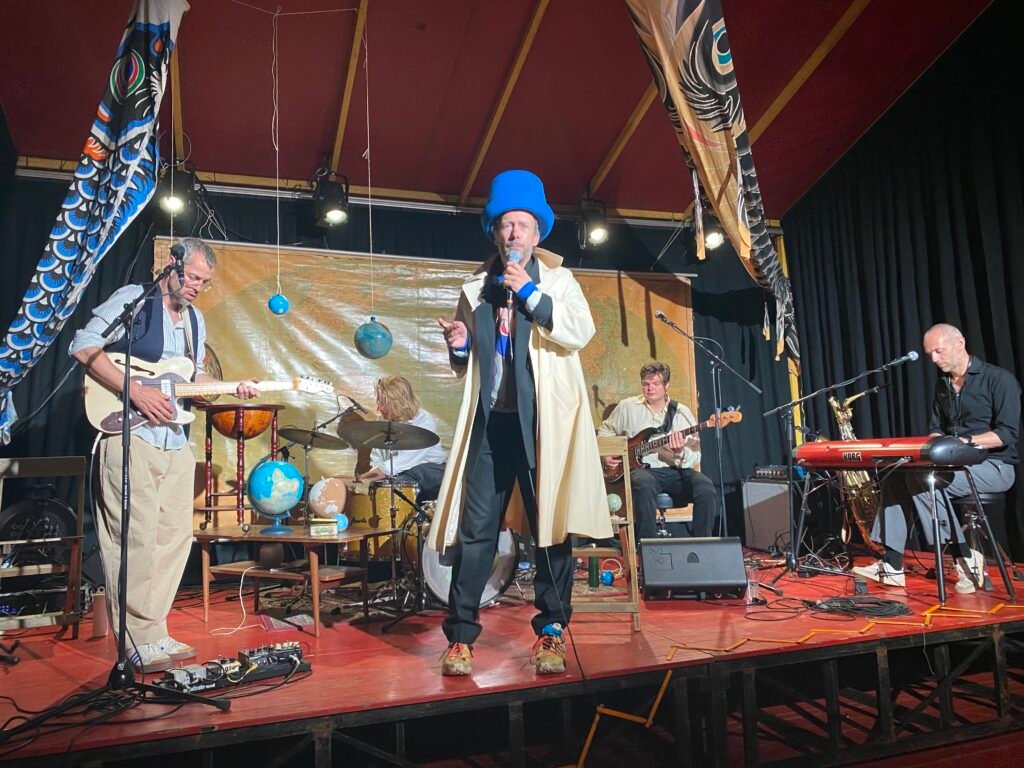
We say what’s not to like (except possibly the music)
MapsintheWild The Parade
-
sur Mappery: Trollhatte Kanal
Publié: 18 August 2024, 1:00pm CEST
Marc-Tobias spotted this van “Seen in [https:]] Includes a scale in kilometers and proper compass!”
That’s the first time I have seen a scale bar on an a map in the wild
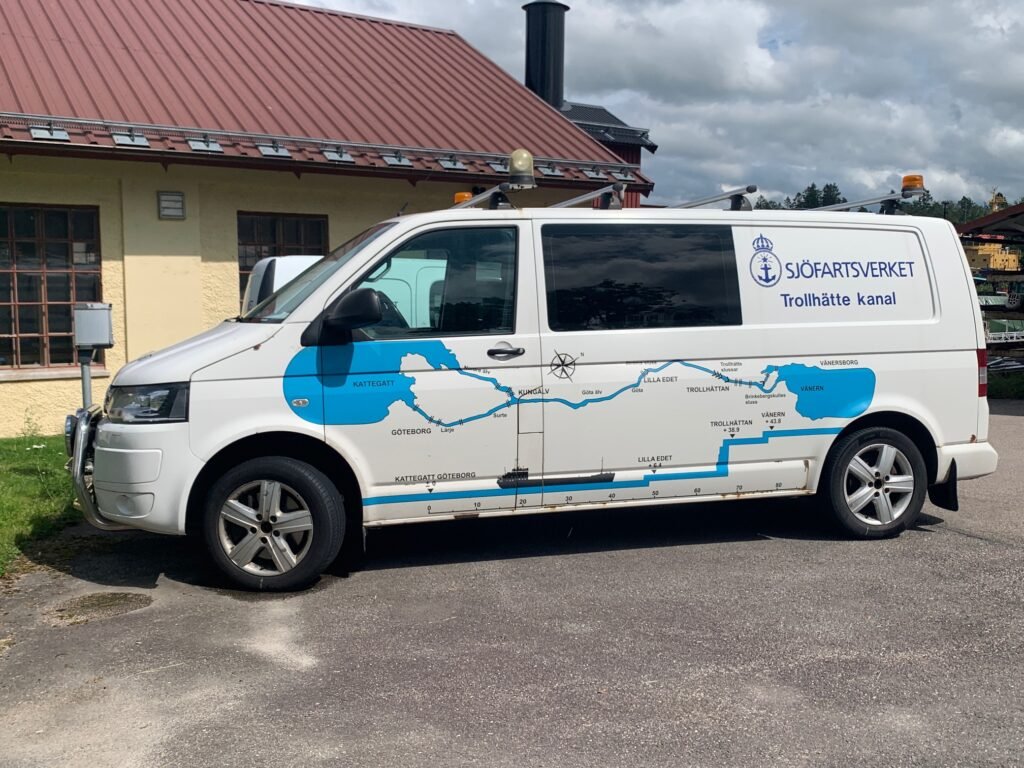
MapsintheWild Trollhatte Kanal
-
sur GeoServer Team: GeoServer 2.24.5 Release
Publié: 18 August 2024, 4:00am CEST
GeoServer 2.24.5 release is now available with downloads (bin, war, windows), along with docs and extensions.
This is a maintenance release of GeoServer providing existing installations with minor updates and bug fixes. GeoServer 2.24.5 is made in conjunction with GeoTools 30.5, and GeoWebCache 1.24.5.
Thanks to Andrea Aime for making this release.
Release notesImprovement:
- GEOS-11336 security-keycloak: upgrade keycloak version
- GEOS-11443 REST API does not take effect immediately due to 10 minute authentication cache
- GEOS-11463 WMS vector dimension validation should query only one feature and only for dimension attribute
- GEOS-11502 Permit resize on user/group/role palette textbox to allow for extra long role names
Bug:
- GEOS-11446 [INSPIRE] Incorrect behavior for unsupported languages
- GEOS-11453 Failure to look-up default value of custom dimensions on vector layers
- GEOS-11462 500 error thrown when double adding a user to a group via REST with JDBC user/group services
- GEOS-11484 DirectRasterRenderer is not respecting advancedProjectionHandling and continuosMapWrapping format_options
- GEOS-11493 Azure blob store may not get environment parameters from property file
Task:
- GEOS-11464 Update Jackson 2 libs from 2.17.1 to 2.17.2
For the complete list see 2.24.5 release notes.
Community UpdatesCommunity module development:
- GEOS-11111 Open search for EO community module: STAC search page has wrong self link
Community modules are shared as source code to encourage collaboration. If a topic being explored is of interest to you, please contact the module developer to offer assistance.
About GeoServer 2.24 SeriesAdditional information on GeoServer 2.24 series:
- GeoServer 2.24 User Manual
- Control remote HTTP requests sent by GeoTools/GeoServer
- State of GeoServer 2.24.1 (foss4g-asia presentation)
- Multiple CRS authority support, planetary CRS
- Extensive GeoServer Printing improvements
- Upgraded security policy
Release notes: ( 2.24.5 | 2.24.4 | 2.24.3 | 2.24.2 | 2.24.1 | 2.24.0 | 2.24-RC )
-
sur Mappery: Matthijs Röling
Publié: 17 August 2024, 1:00pm CEST
Reinder shared this pic of a book cover “Suddenly it occurred to me that the cover of this book by the Dutch writer Jean Pierre Rawie is decorated with a painting by Matthijs Röling, and that he added a globe to this still life.”

MapsintheWild Matthijs Röling
-
sur XYCarto: Cartographic Aotearoa
Publié: 17 August 2024, 5:38am CEST
I try hard to keep this blog about basic open source processing in GIS. I don’t spend much time talking about my cartographic work, since I like put it up in the gallery and try to let it speak for itself. Further, 90% of my cartographic products involve processing data before it ever gets to visualization, therefore, I see more value in demonstrating the basic processing and hopefully inspire folks to do their own thing once their data is in place.
If you might indulge me; however, I’d love to toot my own horn as they say and do a write up on my acceptance to the Atlas of Design this year and the honor to do a brief interview with Radio New Zealand (RNZ) about the map.
I know it is a bit cheeky to put up recognition of one’s own work, but this map was the culmination of several years of iterations, heaps of footwork getting it known, and a number of rejections along the way. I’m just so excited to finally get it out there to a wider audience.
Since this is primarily an open source blog about GIS, and that several have asked me about my tech stack I’ll share a portion of it here. If you want to get a feel of some of my blending techniques, you can see some past blogs where I wrote this up.
As I mentioned above, that vast majority of my cartography is in data prep and making data easier to work in visualization projects. I have a fairly simple tech stack for data prep.
- QGIS – Base map layout. My method is most often to develop the base image here, but do all the post processing for legends, supporting text, graphics, etc in specialized layout software. QGIS is amazing at handling large file types, blending, and making repeatable color palettes. Doing work at a national and world scale is often without issue.
- GDAL – Most used in the stack for prepping large scale raster data. Used more than anything else in GDAL for my vis work is gdalwarp, gdal_translate, gdaladdo, gdalbuildvrt, and gdaldem [hillshade, slope]. These are often used in bash scripts to repeat processes allowing me to easily develop multiple resolutions, scales, and resamples.
- GeoPandas – Used for vectors and primarily for my cleaning to get lighter GPKG files, automating redundant processes like clips, simplification, and table manipulation. It is an amazing tool I use a lot in development too.
- Python/Bash – Used for controlling all the automation and processing. Depending on the complexity of the task at hand, I will bounce between the two. Bash is really great at multi-core processing and can save enormous amounts of time in redundant processes.
- Colorhexa /Gpick – Palette development. Gpick is incredibly helpful in sampling imagery to find a color value you like. You can bring these values into Colorhexa and start to develop gradients and divergent values all the while keeping within your tone. There are many other sites that will help you do this, I just happen to enjoy this one.
- Docker – An unlikely item in a cartographic stack, but Docker has proved invaluable to me by allowing me to run multiple versions of QGIS and GDAL without wrecking my machine. I have a basic QGIS/Docker example here.
For those out there who have supported me on this journey and even those who lurk in the shadows, I cannot thank you enough for reading, liking, and sending me messages letting me know you are out there and find some of this useful. It helps more than you know and motivates me to continue to move forward. Also, tell all your friends!
-
sur QGIS Blog: Reports from the winning grant proposals 2023
Publié: 16 August 2024, 6:18pm CEST
With the QGIS Grant Programme 2023, we were able to support six proposals (four in the first round and two in the second round) that are aimed to improve the QGIS project, including software, infrastructure, and documentation. The following reports summarize the work performed in the first four proposals:
- QGIS Bug Tracker cleanup (#266) – Report
We have identified and closed ~291 tickets, among them:- 162 bugreports and feature requests which were already fixed or implemented
- 29 bugreports and feature requests which are invalid (data issues, wrong use of functionality, etc)
- 57 duplicate bugreports and feature requests
- 5 won’t fix bugreports
- 5 bugreports were converted to feature requests
- 33 tickets were closed (does not contain steps to reproduce, test data and no feedback was provided within several month)
- Additionally we ensured that all tickets has correct tags assigned to to make them easier to find.
- Porting to C++ and harmonization of Processing algorithms (#271) – Report
The QGIS Porting to C++ and Harmonisation of Processing Algorithms grant is now complete.- Existing Processing algorithms Voronoi Polygons and Delaunay Triangulation have been ported to C++ and now use GEOS instead of the unmaintained Python module.
- Two algorithms for generating XYZ tiles (directory and MBTiles variants) have been ported to C++ using a safer and cleaner multi-threading approach.
- The Align Rasters tool, which was not exposed to Processing, has been removed and a new Processing algorithm with the same functionality has been added.
- The existing Raster Calculator algorithm has been ported to C++. The algorithm now has two variants: a toolbox version that works the same way as before, and a modeler version that uses the same approach to input naming as the GDAL raster calculator.
- Add vertical CRS handling to QGIS (#267) – Report
- As of QGIS 3.34, QGIS can now create and handle vertical and compound CRSes.
- In QGIS 3.34 coordinate transforms were reworked so that they function correctly with vertical transformation, if both the source and destination CRS have vertical components.
- In QGIS 3.36 the coordinate reference selection widgets were updated to offer choices of 2d only, compound, or vertical only CRSes.
- In version 3.38, we introduced a new setting for QGIS projects, for their vertical reference system. Users can control this through project properties, and it’s accessible via PyQGIS and via associated expression variables (eg @project_vertical_crs) for use in print layouts.
- Similarly, in 3.38 we introduced the API support for map layers to have a vertical CRS. (This was not exposed to users in 3.38 though)
- In QGIS 3.40 so far we have exposed the vertical CRS setting for vector layers to users (via the layer properties dialog), allowing users to specify the associated vertical CRS for these layers. The vertical CRS is respected in elevation profile plots, in Identify tool results, and in 3D Map views (assuming the 3D map is created with an associated vertical CRS).
- There is an open pull-request for 3.40 to expose the vertical CRS for point cloud layers in a similar way, with the vertical CRS being respected in elevation profiles, identify tool results, and 3D map views
- We have open pull requests for 3.40 to show layer vertical CRS information in the layer properties “information” pages, and add expression variables at the layer scope (eg @layer_vertical_crs).
- Improve test result handling on QGIS CI (#268) – Report
Any tests which fail a rendering comparison will write a descriptive comment to the PR. The comment details which render tests failed, where they are in the code, and includes some helpful pointers to downloading the full test report and the QGIS developer documentation. We also implemented lots of improvements in running the tests locally and how the render test reports are generated and presented to developers.
Thank you to everyone who participated and made this round of grants a great success and thank you to all our sustaining members and donors who make this initiative possible!
- QGIS Bug Tracker cleanup (#266) – Report
-
sur Mappery: yNot Festival
Publié: 16 August 2024, 1:00pm CEST
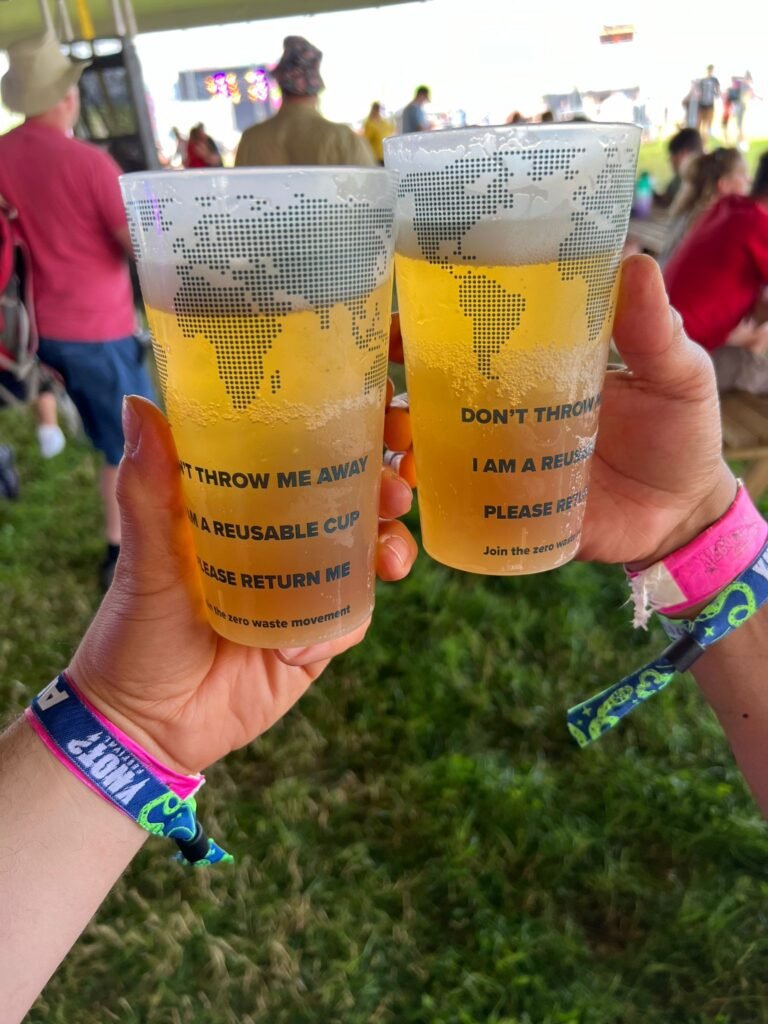
Jeremy shared a pic of the recyclable beer glasses at the yNOT festival. Is that a semi-conical projection?
MapsintheWild yNot Festival
-
sur Markus Neteler: GRASS GIS 8.4.0 released
Publié: 16 August 2024, 12:20pm CEST
The GRASS GIS 8.4.0 release provides more than 520 improvements and fixes with respect to the release 8.3.2.
The post GRASS GIS 8.4.0 released appeared first on Markus Neteler Consulting.
-
sur Mappery: Zierikzee
Publié: 15 August 2024, 1:00pm CEST
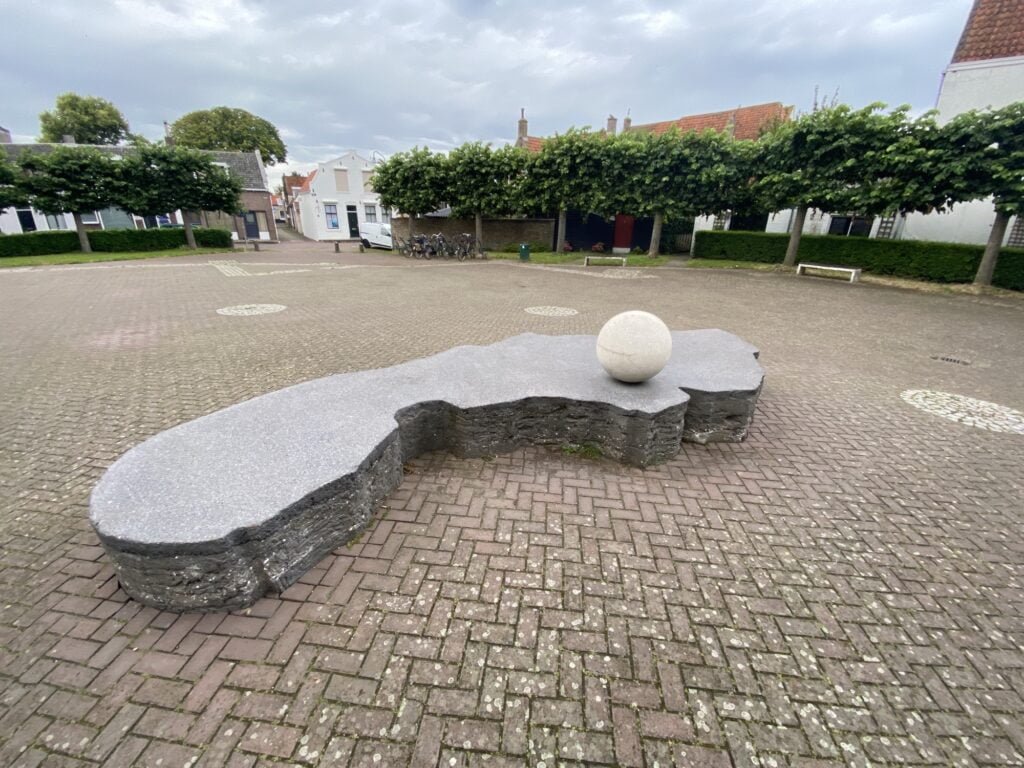
Reinder sent us this interesting map sculpture “I spotted this specimen of street furniture — in fact: my wife did. What you see is the outline of the island Schouwen-Duiveland, part of the Dutch province Zeeland. The white ball is actually on the spot of the town Zierikzee. Very quiet and charming now, but it has quite a notorious history. “
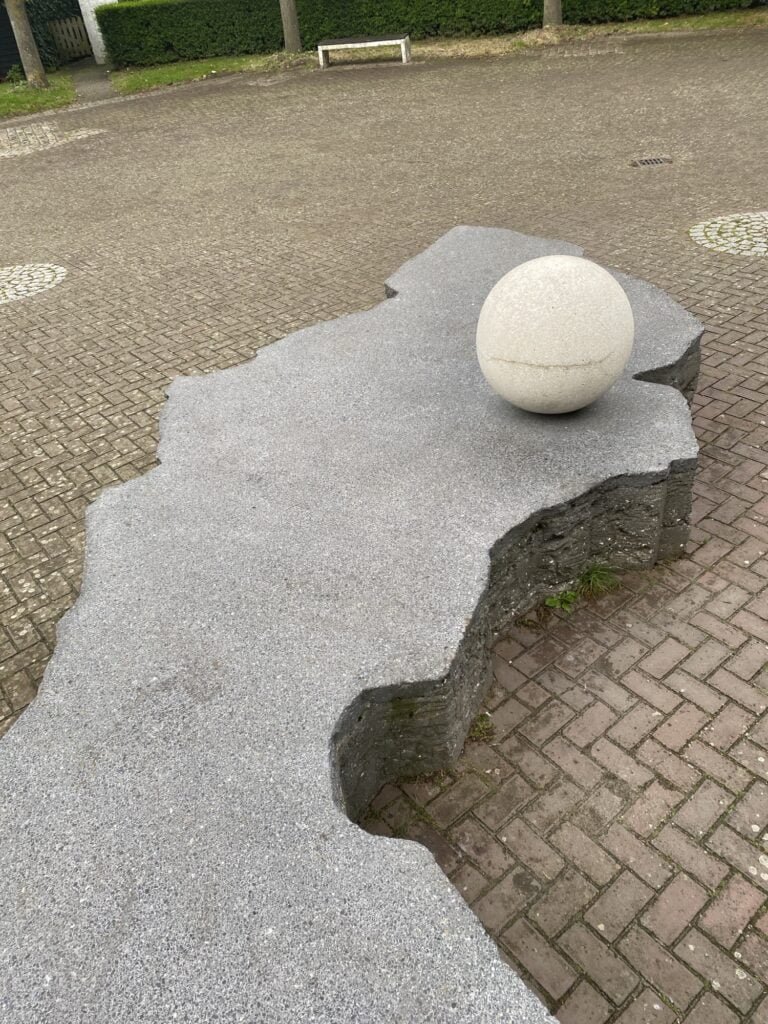
Well done Mrs Storm!
MapsintheWild Zierikzee
-
sur Jackie Ng: Announcing: MapGuide Open Source 4.0 Beta 2
Publié: 14 August 2024, 11:40pm CEST
This took way longer than expected, but the 2nd beta release of MapGuide Open Source is now available.
The main driver for this release is to update our various web tier components to their latest respective versions:
- PHP 8.1.29
- Apache [httpd] 2.4.62
- Apache Tomcat 9.0.89
- Installer
- Newer libpq.dll (PostgreSQL 16.3) bundled with Windows installer
- Server Tier
- Fix instability on Linux due to criss-crossed resolution of sqlite3 and geos symbols to our shared libraries instead of the distro-provided versions
- Repository admin tools have been momentarily pulled from this and future beta releases until the admin scripts have been updated and/or rewritten. As a workaround, use MapGuide Package files to backup/restore repository content
- Removed immature MVT tile rendering support. If you want to produce Mapbox Vector Tiles, use any tool from this list
- Web Tier
- Fix QUERYMAPFEATURES SelectionKey containing a newline char, breaking client-side reconciliation of selected features
- More PHP8 compatibility fixes in PHP AJAX Viewer
- Fix bad instanceof exception checks in PHP AJAX Viewer
- More PHP8 compatibility fixes in Site Administrator
- Buffer overflow fixes in WMS/WFS service layer
- New optional --bind-to parameter for MgDe [HttpServer]
- InstantSetup
- Fix crash if no setup log path specified when configuring
- Samples
- Fix bad extents in SheboyganXYZ tileset
Download
Note: Trac is a bit flaky right now, so the release notes page may not display. If that happens just retry with browser refreshes. Failing that, you can find all the necessary download links in my release announcement email -
sur WhereGroup: Plugins entwickeln für PhpStorm am Beispiel von Mapbender
Publié: 14 August 2024, 5:40pm CEST
Integrierte Entwicklungsumgebungen (IDEs) bringen von Haus aus schon viel Funktionalität mit. Fehlt allerdings noch eine Funktionalität, lässt sich diese oft auch über ein selbst entwickeltes Plugin ergänzen. -
sur Mappery: Canada Dry
Publié: 14 August 2024, 1:00pm CEST
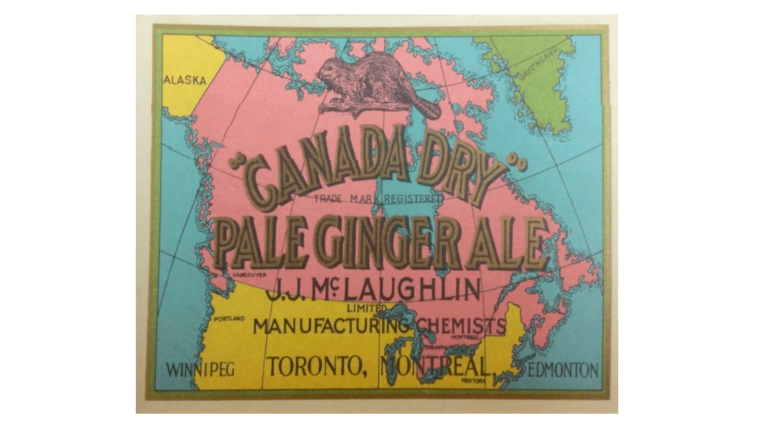
Kate shared this “Neat (and mappy!) Final Jeopardy trivia from the other night: “Early 1900s labels for this beverage brand featured a beaver sitting on a log at the top of a map.”
I am wondering whether the “Dry” refers to the taste or Prohibiton
MapsintheWild Canada Dry
-
sur Mappery: Maps in a Bar
Publié: 13 August 2024, 1:00pm CEST
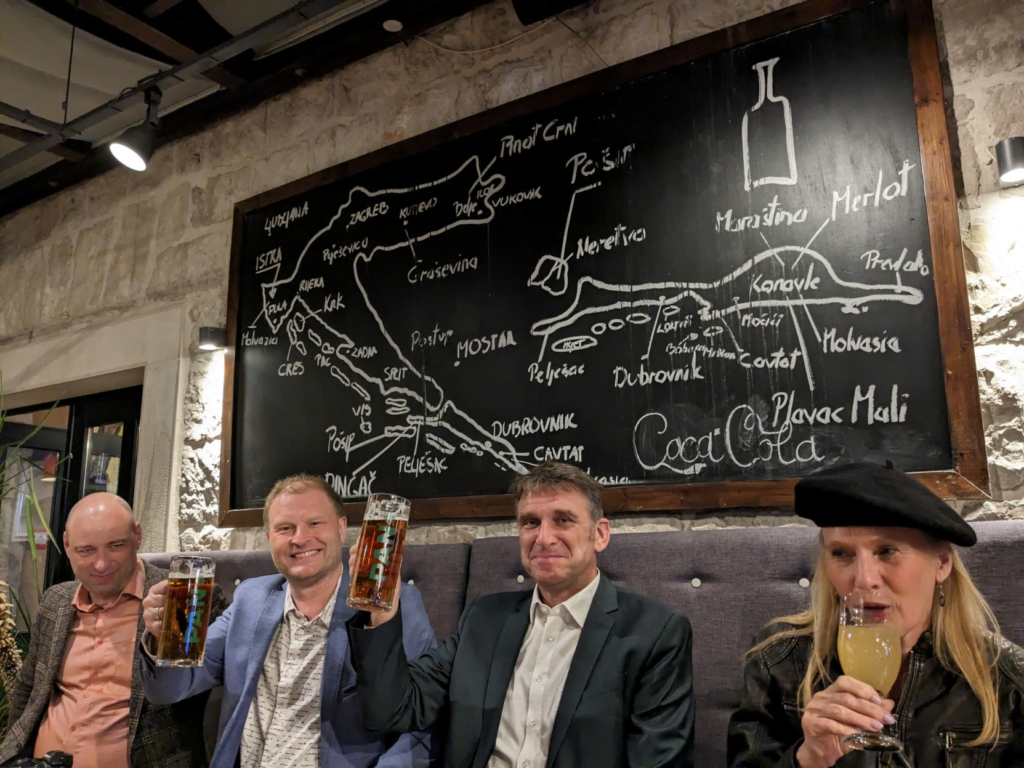
When Erik was in Dubrovnik for a conference he ended up in this bar with colleagues. “With the #CLGE delegates you always end up at a #MapsintheWild bar…”
MapsintheWild Maps in a Bar
-
sur Mappery: The Neighbourhoods of Ghent, piece by piece
Publié: 12 August 2024, 1:00pm CEST
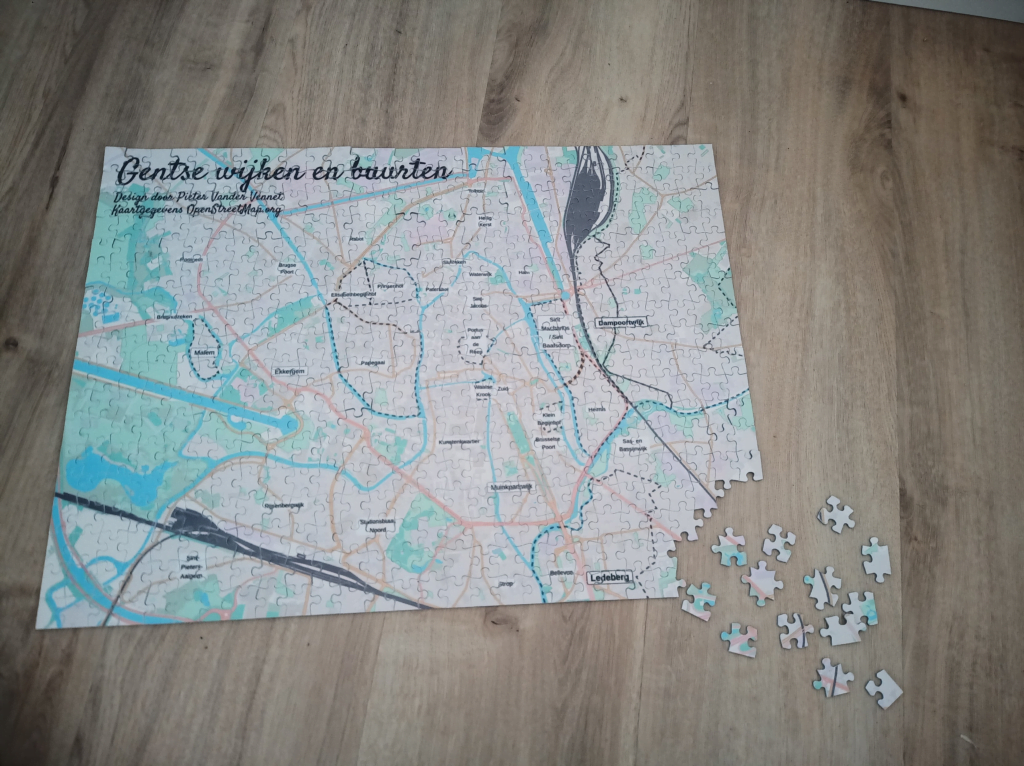
Pieter is a true map geek.
“I wanted to learn the names of the neighbourhoods in #Ghent, so I made me a #puzzle. I added the neighbourhoods in #OpenStreetMap , then made a custom theme in #MapComplete and use the ‘export as PNG’-functuon. The background is a modified stylesheet for @protomaps“
I did say true map geek!!
MapsintheWild The Neighbourhoods of Ghent, piece by piece
-
sur Sean Gillies: Bear scratch
Publié: 12 August 2024, 4:28am CEST
I just emailed the Bear 100 race director, Cody Draper, and said that I'm injured and won't recover in time to start in 6 weeks. I'm also too injured to do Black Squirrel in 3 weeks and will be emailing Nick and Brad next.
What's the injury? When I came home from vacation and started to ramp up my running, my right Achilles tendon became sore and very inflamed. On July 17 I went out for a 30 mile run and had to bail at mile 20. I took some time off from trail running and have been chugging on an elliptical trainer at my gym. Yesterday I tried some running on the bike path behind my house and couldn't even go a mile without excruciating pain. I'm calling it, my season is over. The last time I had serious Achilles tendonitis like this was at the end of my ultimate frisbee career 20 years ago. It took 4 months before I could run without pain. I'm going to keep going to the gym, ice and rest, see some specialists, and get ready for 2025.
-
sur Mappery: Serbo-Montenegrin Attack on Dubrovnik
Publié: 11 August 2024, 1:00pm CEST
-
sur QGIS Blog: Plugin Update – July, 2024
Publié: 10 August 2024, 2:05pm CEST
For the last month of July, one short of 30 new plugins were published in the QGIS plugin repository.
Here follows the quick overview in reverse chronological order. If any of the names or short descriptions catches your attention, you can find the direct link to the plugin page in the table below:
MariaDB to QGIS Fetches longitude (x) and latitude (y) data from MariaDB and writes it to a Shapefile or GeoPackage and adds it to your map. Print Selection Outputs selected features to text console. DeraPro DeraPro for projects and studies allows the download of the reference spatial data of Andalusia and make a cut of the information for a specific study area. QPackageQGZ QPackage is a tool to save both your QGIS project and data contained in the project to a new directory. ArgentinaGeoServices A QGIS plugin to import WMS Geoservices from Argentina. T Vertical Sessions Used to Vertical Sessions of Lidar Point Cloud. BuenosAires Converter A QGIS plugin that converts layers to EPSG:9497. Make Sector Plugin to create sector, circle radius, and spidergraph delimited and vector layer. CBERS-4A WPM Explorer The CBERS Explorer is a specialized plugin developed to facilitate the search and retrieval of images from the China-Brazil Earth Resources Satellite (CBERS) program, specifically focusing on the CBERS-4A satellite with Wide Field Imager (WPM) data. FPT Plot Alocation Plot alocation for forest inventory. QGISpell Creates context menu spell checking for attribute data based on ENCHANT libraries. ur-scape Data Importer Import data to ur-scape. MorphAL MorphAL plugin for QGIS. LER+ Nem adgang til LER2 forespørgsler. Threshold to ROI Create ROI (Region of Interest) with threshold values. Spell Checker Check the spelling of words in Print Layout elements. Filter By Selection Filter a given layer by the selected feature and attribute of another layer. Natur i Norge kartlegging Natur i Norge (NiN) mapping tool. AIAMAS – AI-Assisted Map Styler Symbolize your vector layers in seconds. Sentinel 2 Image Downloader This plugin allows users to download Sentinel-2 images. MapSafe Safeguard datasets using masking, encryption and notarisation. GPX Maker for GARMIN® devices This plugin exports GPX files for GARMIN® devices. QGIS Sound Effects Add sound effects to QGIS to make work less boring. Mosaic Tool A plugin to mosaic bands from selected raster layers. Polaris QGIS interface for Polaris through Polaris-Studio ArcGeek Calculator A comprehensive toolset for coordinate calculations, conversions, spatial operations, watershed analysis, land use analysis, and flood simulation in QGIS. Auxiliary Labeldata Importer Helps you to import Labeldata, stored in an auxiliary Layer from another Project. Sections Creates a section polygon layer from a point layer. Slownik warstw Tworzy s?ownik w formie pliku txt rozdzielanego tabulacjami dla wybranych warstw, program pozwala na eksport pe?nych nazw pól danej warstwy oraz wersje jako powstanie po zmienie z gpkg do shp. -
sur Mappery: Asia?
Publié: 10 August 2024, 1:00pm CEST
-
sur Fernando Quadro: Curso de GeoNode: Inscrições abertas
Publié: 9 August 2024, 8:43pm CEST
Aprenda a criar a sua própria Infraestrutura de Dados Espaciais com o GeoNode, uma plataforma para gestão e publicação de dados geoespaciais que reúne projetos open source maduros e estáveis sob uma interface consistente e fácil de usar, permitindo que os usuários, compartilhem seus dados de forma rápida e fácil.
Este curso visa capacitar os profissionais no uso eficiente da plataforma GeoNode, e tem como objetivos:
 Familiarizar os participantes com os conceitos fundamentais do Geonode e suas capacidades.
Explorar o funcionamento de servidores de mapas e seus benefícios.
Apresenar como realizar a criação de usuários e grupos de acessos às suas informações.
Ensinar como realiza a criação de seus Mapas, Dashboards e GeoStories.
Realizar a integração do Geonode com o QGIS através de plugins. Quer saber mais?
O Curso é oferecido na modalidade EAD Ao Vivo, com uma carga horária de 18 horas divididos em 6 encontros. Porém, essas aulas são gravadas e ficam disponíveis ao aluno por 12 meses em nosso portal do aluno.
Então, se por acaso você não puder comparecer em alguma das aulas ao vivo, não se preocupe, você poderá rever a aula gravada a qualquer momento.
Ficou interessado? -
sur KAN T&IT Blog: Innovación y Colaboración en FOSS4G Europe 2024
Publié: 9 August 2024, 6:39pm CEST
¿Te apasionan las tecnologías geoespaciales de código abierto? Si es así, FOSS4G Europe 2024 en Tartu, Estonia, fue el evento que no debiste perderte.
¿Alguna vez te has preguntado cómo el software de código abierto está revolucionando el mundo de los Sistemas de Información Geográfica (SIG)? FOSS4G Europe 2024 reunió a expertos y entusiastas de todo el mundo para explorar esta pregunta y mucho más.
Durante siete días, del 1 al 7 de julio, Tartu se convirtió en el epicentro de la innovación geoespacial. En esta ocasión, nuestro CEO, Ariel Anthieni y nuestro Sales Engineer, Adrián Yoris, tuvieron la oportunidad de participar de este evento.La conferencia ofreció una serie de talleres interactivos, presentaciones de vanguardia y sesiones plenarias con ponentes de renombre. Uno de los momentos destacados fue la presentación sobre la implementación de SIG de código abierto en proyectos comunitarios, donde se discutió cómo estas herramientas están transformando la gestión de recursos naturales en regiones rurales.
Un ejemplo notable fue el estudio de caso de una comunidad en Estonia que utilizó software SIG de código abierto para mejorar la gestión de sus bosques, resultando en una optimización del 20% en la recolección de datos y una mejor conservación ambiental. Esta historia ejemplifica cómo la tecnología puede ser una fuerza para el bien común.
Además, Ariel fue invitado a participar en el panel “Changing the mindset of ‘Open Source is just for those who can’t afford to pay licenses’”, junto a otros expertos como Codrina Ilie de Terrasigna y Matthias Kuhn de OPENGIS.ch, para compartir su experiencia como CEO de Kan Territory & IT, y comentar sobre cómo las soluciones basadas en código abierto pueden transformar sectores públicos y privados, ofreciendo innovación personalizada e integración eficiente de tecnologías geoespaciales.
FOSS4G Europe 2024 no solo fue un evento educativo, sino también una celebración de la colaboración y la innovación en el ámbito de los SIG. Si te lo perdiste, no olvides seguir las actualizaciones y prepararte para la edición internacional que se realizará en Belém, Brasil. Comparte tus experiencias y pensamientos en los comentarios, y sigue explorando más sobre el fascinante mundo de las tecnologías geoespaciales de código abierto.
¡Nos vemos en Brasil en la FOSS4G Internacional!Créditos de la Foto: Andres Tennus (fotógrafo de la FOSS4G Europe)
-
sur Mappery: Finger Lakes Wines
Publié: 9 August 2024, 1:00pm CEST
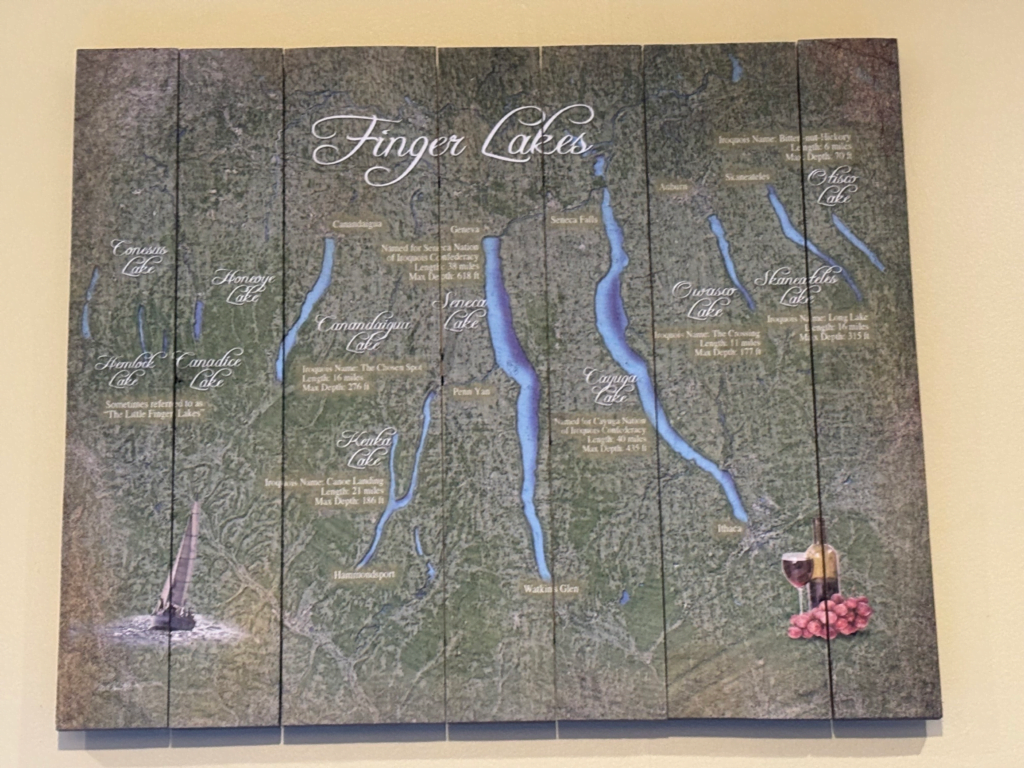
Doug Greenfield shared this wine map “Finger Lakes Wine Center @ Sonnenberg Gardens.”
MapsintheWild Finger Lakes Wines
-
sur Ian Turton's Blog: How to reproject features in QGIS
Publié: 9 August 2024, 4:00am CEST
I came across a brilliant thread on Mastodon by Sarah Dal discussing how she worked out what the most remote post box in the UK was. But there was one remark that bothered me, she said that to convert her lat, lon points to OSGB (EPSG:4326 to EPSG:27700 for the nerds) she had to go to the Ordnance Survey site to find some software to do this. Since she already had the points in QGIS this seemed like an unnecessary side quest to me. When I commented that she could have done this in QGIS she said that she always seemed to get it wrong.
I’m confused by this (and by the many other people who ask questions on gis.stackexchange.com about the same thing) so I’ve put together this video showing how I would do this. Basically, you right click on the layer you want to reproject and select
export->Save features asand then just change the drop down box to the projection you need. QGIS will then save the features and add that layer to your project. You shouldn’t see any difference other than the colour of the points will change (as QGIS assigns a new random colour to the new layer).And yes, I really should have split the Northern Irish post boxes out into a separate file and projected them to the Irish grid but this is just a demo.
-
sur Mappery: Afghani Bread Holder
Publié: 8 August 2024, 1:00pm CEST

Garrett Speed shared this “This Afghani restaurant in ‘s-Hertogenbosch has a bread holder with a map of Afghanistan as the base”
MapsintheWild Afghani Bread Holder
-
sur GeoSolutions: GeoSolutions Listed as Certified Cesium Developer
Publié: 7 August 2024, 8:00pm CEST
You must be logged into the site to view this content.
-
sur Mappery: A Tactile Experience in Ilhabela
Publié: 7 August 2024, 1:00pm CEST
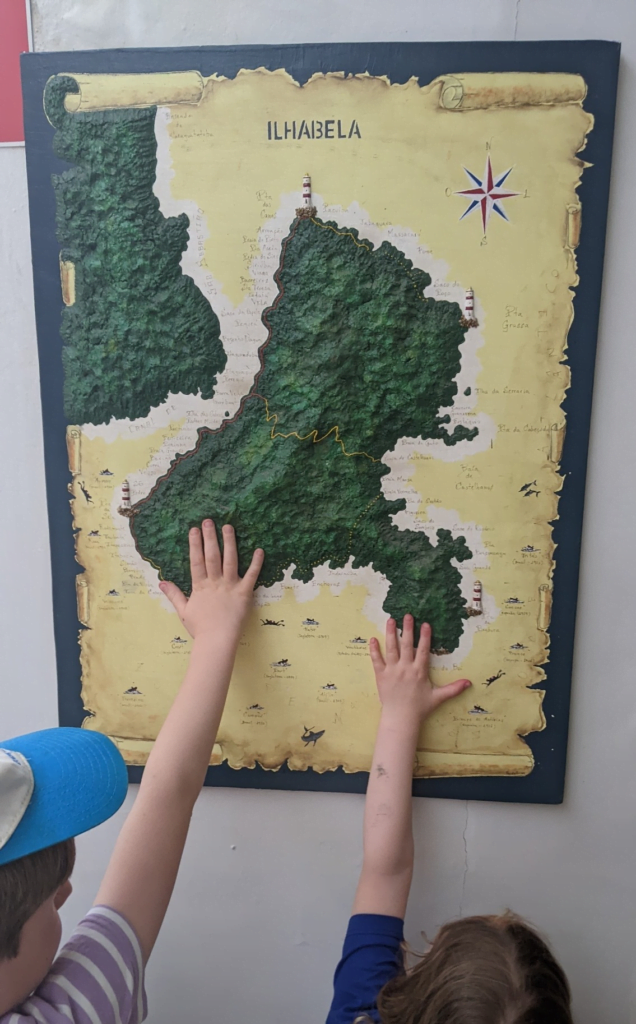
Harry Wood wrote “We arrived at Ilhabela for some Brazil beach time. It’s an island off the Sao Paulo coast. Here’s the kids getting tactile with a relief map in the hotel.”
Looks like fun
MapsintheWild A Tactile Experience in Ilhabela
-
sur Mappery: 30 Minute Walks in Central London
Publié: 6 August 2024, 1:00pm CEST

Nick Duggan shared this neat map, not sure where he spotted it.
MapsintheWild 30 Minute Walks in Central London
-
sur Mappery: Watersnood 4
Publié: 5 August 2024, 1:00pm CEST
-
sur Mappery: Watersnood 3
Publié: 4 August 2024, 1:00pm CEST

Via Reinder “This fantastic piece of textile art by Miep van Riessen consists of embroidered names of victims, and is at the same time a quite adequate ‘geographical impression’ of the region where the disaster took place: the Dutch province of Zeeland. “
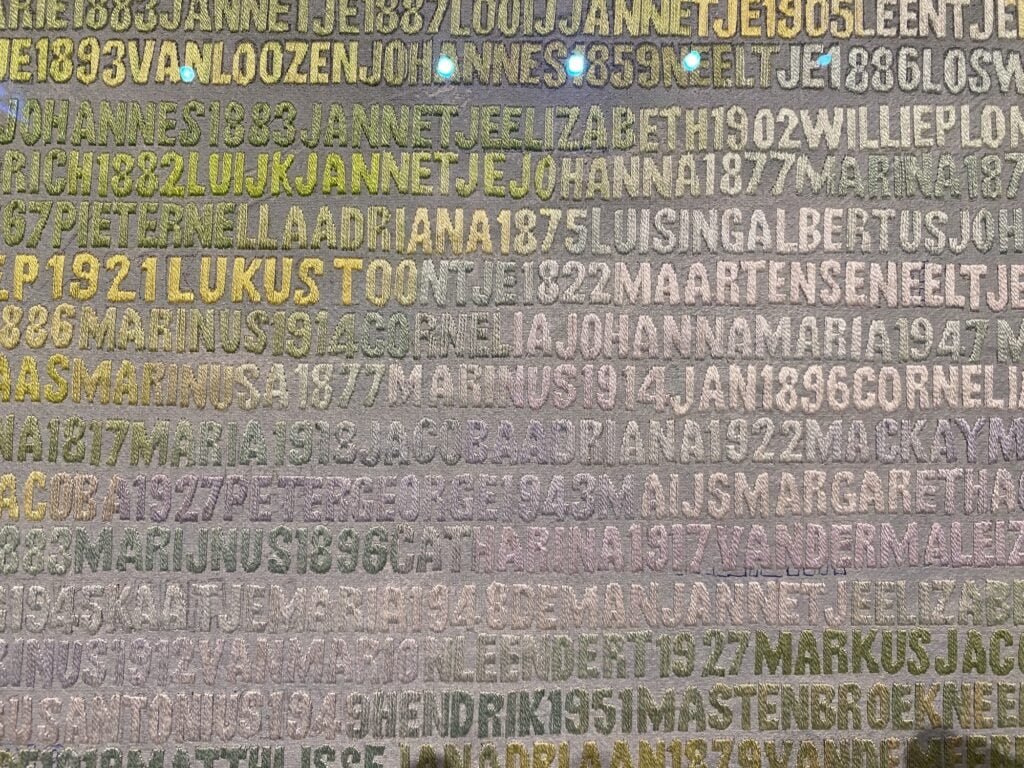
MapsintheWild Watersnood 3
-
sur Mappery: Watersnood 2
Publié: 3 August 2024, 1:00pm CEST
-
sur GeoServer Team: Using Binary Comparison Operators in GeoServer Filters
Publié: 3 August 2024, 4:00am CEST
GeoSpatial Techno is a startup focused on geospatial information that is providing e-learning courses to enhance the knowledge of geospatial information users, students, and other startups. The main approach of this startup is providing quality, valid specialized training in the field of geospatial information.
( YouTube | LinkedIn | Facebook | X )
Binary Comparison Operators in GeoServer FiltersIn this session, we want to talk about the various types of filters, with a particular focus on “Binary comparison operators in GeoServer” comprehensively. If you want to access the complete tutorial, click on the link.
Introduction
Filtering allows the selection of features that satisfy a specific set of conditions. Filters can be used in several contexts in GeoServer:
- In WMS requests, select which features should be displayed on a map
- In WFS requests, specify the features to be returned
- In SLD documents, apply different symbolizations to features on a thematic map
Note. This video was recorded on GeoServer 2.22.4, which is not the most up-to-date version. Currently, versions 2.24.x and 2.25.x are supported. To ensure you have the latest release, please visit this link and avoid using older versions of GeoServer.
Supported filter languagesData filtering in GeoServer follows the OGC Filter Encoding Specification, which provides a standard XML schema for encoding spatial, attribute, and temporal filters in GIS. This allows for customized queries to retrieve specific data from databases and web services while ensuring interoperability among GIS applications. GeoServer supports filters in both Filter Encoding Language and Common Query Language.
Filter Encoding LanguageThe Filter Encoding language, defined by OGC standards, utilizes an XML-based syntax to select specific features, similar to the “WHERE” clause in SQL. A filter consists of a condition formed by Predicate elements and Logical operators, employing comparison and spatial operators to evaluate relationships between feature properties. In this session, we will explore various types of binary comparison operators, while the next sessions will cover spatial operators.
Common Query LanguageCommon Query Language (CQL) is a Text-based language used in GeoServer for constructing filters and queries on geospatial data. It provides flexible and powerful options for filtering and retrieving specific subsets of data from GeoServer layers. In the upcoming sessions, we will dive into a detailed exploration of CQL/ECQL, covering its various operations and practical usage.
Comparison operatorsThese operators are part of Filter Encoding operators and are used in attribute-based queries to filter and retrieve specific features or data, based on their non-spatial attributes. The comparison operators include: binary comparison operators and value comparison operators.
The binary comparison operators are:
- PropertyIsEqualTo
- PropertyIsNotEqualTo
- PropertyIsLessThan
- PropertyIsLessThanOrEqualTo
- PropertyIsGreaterThan
- PropertyIsGreaterThanOrEqualTo
These operators contain two filter expressions to be compared. The first operand is often a
<PropertyName>, but both operands may be any expression, function or literal value. Binary comparison operator elements may include an optional matchCase attribute, with the true or false value. The default value is true, but the comparisons do not check the case if the attribute has a false value.Note. String comparison operators are case-sensitive.
PropertyIsEqualToPropertyIsNotEqualTo is a common type of filter used in GeoServer, which allows you to retrieve features from a data source based on the values of one or more properties. As an example of using this filter in WFS getFeature request:
- Navigate to the Demos page, then select Demo requests.
- From the Request section, select the WFS_getFeature1.0.xml request.
- The address will be filled in automatically, in the URL section.
Use the following block codes to replace line 26:
<PropertyIsEqualTo> <PropertyName>STATE_NAME</PropertyName> <Literal>Delaware</Literal> </PropertyIsEqualTo>- Now, we will explain some elements:
- The first fifteen lines include explanations in the form of comments.
- Line 16 describes the XML version and the GetFeature operation of the WFS service being used.
- Line 17 specifies the default output format for the WFS service as “gml2.” Additionally, GeoServer supports several other commonly used formats such as “gml3, shapefile, geojson, and csv.”
- Lines 18 to 23 define the start of the XML request and declare the namespaces used in the request.
- Line 24 specifies the type name of the feature to be queried. In this case, it requests features of the “topp:states”.
- Lines 25 to 30 define the filter criteria for the query. On these lines, we use the PropertyIsEqualTo filter, to retrieve all features where the state name attribute is equal to
Delaware.
-
Press the Submit button to see the implemented changes.
- Note. For GeoServer 2.25.2 the Demo Request page has been improved to show response Headers, and provide the option to pretty print XML output.
PropertyIsNotEqualTo is another common type of filter used in GeoServer, which allows you to retrieve features from a data source based on properties that don’t match a specified value. As an example of using this filter in a WFS getFeature request, use the following block codes to replace lines 26 to 29:
<PropertyIsNotEqualTo matchCase="false">
  <PropertyName>STATE_NAME</PropertyName>
  <Literal>delAwarE</Literal>
</PropertyIsNotEqualTo>
Note. The matchCase attribute in WFS_getFeature 1.1 and 2.0 versions, can be set to “false” to specify a case-insensitive comparison.
Press the Submit button.
In this example, we used the
PropertyIsLessThan<PropertyIsNotEqualTo>filter to retrieve all features where theSTATE_NAMEattribute, is not equal toDelaware.The PropertyIsLessThan filter is used to filter features, based on a comparison of a numeric property with a given value. It returns all features where the specified property is less than the specified value.
An example of using this filter in a WFS getFeature request is:
outputFormat="shape-zip"
<wfs:Query typeName="topp:states">
    <wfs:PropertyName>topp:STATE_NAME</wfs:PropertyName>
    <wfs:PropertyName>topp:LAND_KM</wfs:PropertyName>
<ogc:Filter>
  <PropertyIsLessThan>
    <PropertyName>STATE_FIPS</PropertyName>
    <Literal>18</Literal>
  </PropertyIsLessThan>
</ogc:Filter>
Press the Submit button.
In this example, we used the
<PropertyIsLessThan>filter to get all features in a shapefile format where the value of theSTATE_FIPSattribute is less than18. The query only retrieves theSTATE_NAMEandLAND_KMfields, instead of all the attributes.In this session, we took a brief journey through the various types of filters, with a particular focus on “Binary comparison operators in GeoServer”. If you want to access the complete tutorial, simply click on the link.
-
sur From GIS to Remote Sensing: Semi-Automatic Classification Plugin major update: version 8.3.0
Publié: 3 August 2024, 2:04am CEST
The Semi-Automatic Classification Plugin (SCP) has been updated to version 8.3.0.This new version requires Remotior Sensus to be updated to at least version 0.4.0.
During the update process of SCP from version 7 to version 8, several tools were excluded in order to give priority to the main plugin functions.With this 8.3.0 update, several tools are reintroduced, such as Clustering tool for unsupervised classification (K-means method), the Spectral distance tool, the Edit raster tool, and the Raster zonal stats.Read more » -
sur WhereGroup: Kick-off für die Entwicklung eines bundesweiten Softwaretools für mehr Klimaschutz in der Baubranche
Publié: 2 August 2024, 2:15pm CEST
Schon 2016 waren wir auf Landesebene im Bereich Ersatzbaustoffverordnung tätig und sind nun vom BMUV mit dem Umweltbundesamt mit der Erstellung eines bundesweiten Ersatzbaustoff-Katasters beauftragt. -
sur GRASS GIS: Report from the GRASS Community Meeting 2024
Publié: 2 August 2024, 1:42pm CEST
The annual GRASS GIS Community Meeting was held once again in the Czech Republic, this time at the NC State European Center in Prague from June 14 to 19. The meeting brought together users, supporters, contributors, power users and developers to collaborate and chart the future of the project. Thanks to the generous funding from the U.S. National Science Foundation (Award 2303651), the Open Source Geospatial Foundation (OSGeo), FOSSGIS e.V., and individual donors, we were able to welcome 16 in-person participants from 9 countries on 3 continents, plus 2 remote participants. -
sur Mappery: Watersnood 1
Publié: 2 August 2024, 1:00pm CEST
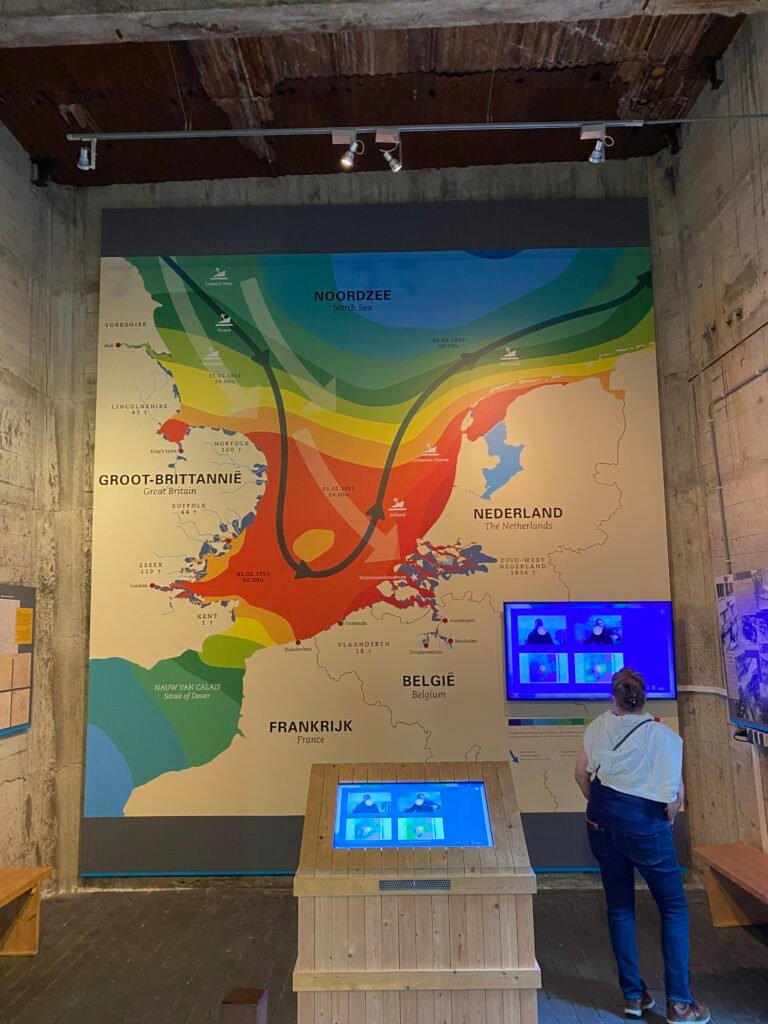
Reinder shared this “On the 1st of February 1953 a disastrous flood occurred in the southwest of The Netherlands. More than 1800 people lost their lives and an entire infrastructure was devastated. This is known as the Watersnood, and it is the topic of the Watersnoodmuseum in Ouwerkerk in the province of Zeeland.”
MapsintheWild Watersnood 1
-
sur Mappery: Custom underwear
Publié: 1 August 2024, 1:00pm CEST
And a new share from LeCatopgrahe with these custom underwear coming from Hop & Down.
MapsintheWild Custom underwear
-
sur GeoServer Team: GeoServer User Forum replaces mailing list
Publié: 1 August 2024, 4:00am CEST
GeoServer is updating our communication channels!
We know people do not like signing up for mailing lists, Twitter has been Xed out, and it is time to move on.
GeoServer User ForumWelcome to the GeoServer User forum:
- This forum is open to the public, we are pleased to meet you and hope you enjoy using GeoServer.
- Hosted by Open Source Geospatial Foundation
- All project communication including this forum are subject to our code of conduct
- This is one of many options for community support and communication.
Taking part is easy (sign-in with credentials you already have):
-
Login to discourse.osgeo.org:
-
Login “with LDAP” to use your OSGeo UserID (also used for other osgeo services).
The button appears greyed out, but this is only poor styling choice. The button is enabled and works.
-
Use “Log in with GitHub” to use GitHub credentials.
-
More options are added over time.

-
-
You may also use “Sign Up” if you want to create an account just for use with the Forum.
-
Unsubscribe from geoserver-users email list.
We will continue to operate the geoserver-user list for the month of August, and then do a final synchronization of any outstanding email messages to complete the migration.
-
Navigate to the category GeoSever / User to enjoy the forum.
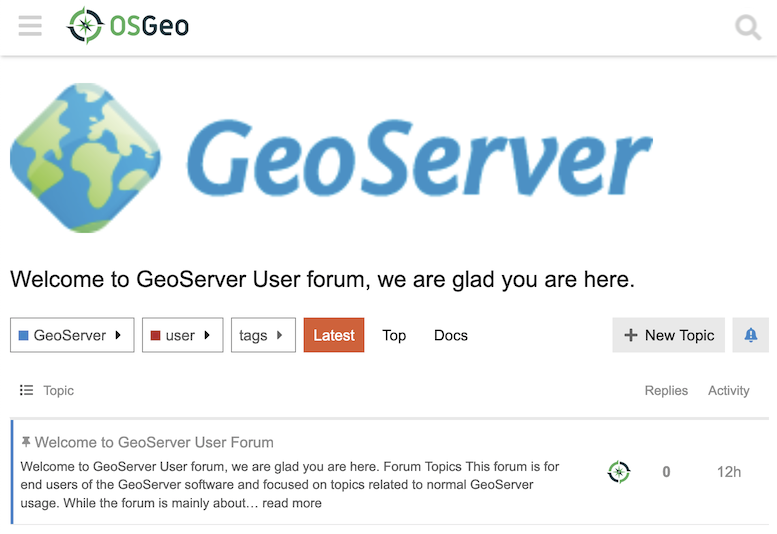
-
Use New Topic to start a new conversation.
Only the
GeoServer / usersubcategory allows new topics. If the New Topic button is disabled you may be looking at theGeoServertop-level category. -
To test please send introduce yourself we are looking forward to meeting you.
If you enjoy the out-of-band timezone friendly mailing list experience - Discourse allows you to subscribe to notifications, and use email to post and reply to topics.
-
Sign-in to Discourse as above.
-
From your profile preferences, use the email tab to adjust email settings.
IMPORTANT: Email is only sent when you are not logged in to the discourse website!

-
Navigate to GeoSever User category, and use the bell to change notifications to Watching.
-
If you wish to update any email rules the new mailing is
user.geoserver.discourse.osgeo.org -
You can send email to geoserver-user@discourse.osgeo.org to start a new topic.
To test please send an email to introduce yourself (rather than a test message).
GeoServer is occasionally active on social media:
- Mastadon: @geoserver@fosstodon.org
- LinkedIn Group
- Twitter/X: @GeoServerO - only used for emergencies.
If you enjoy social media we would love some assistance reposting and highlighting our community activity. Contact us on your preferred social media platform to help out.
-
sur Mappery: World T-Shirt
Publié: 31 July 2024, 1:00pm CEST
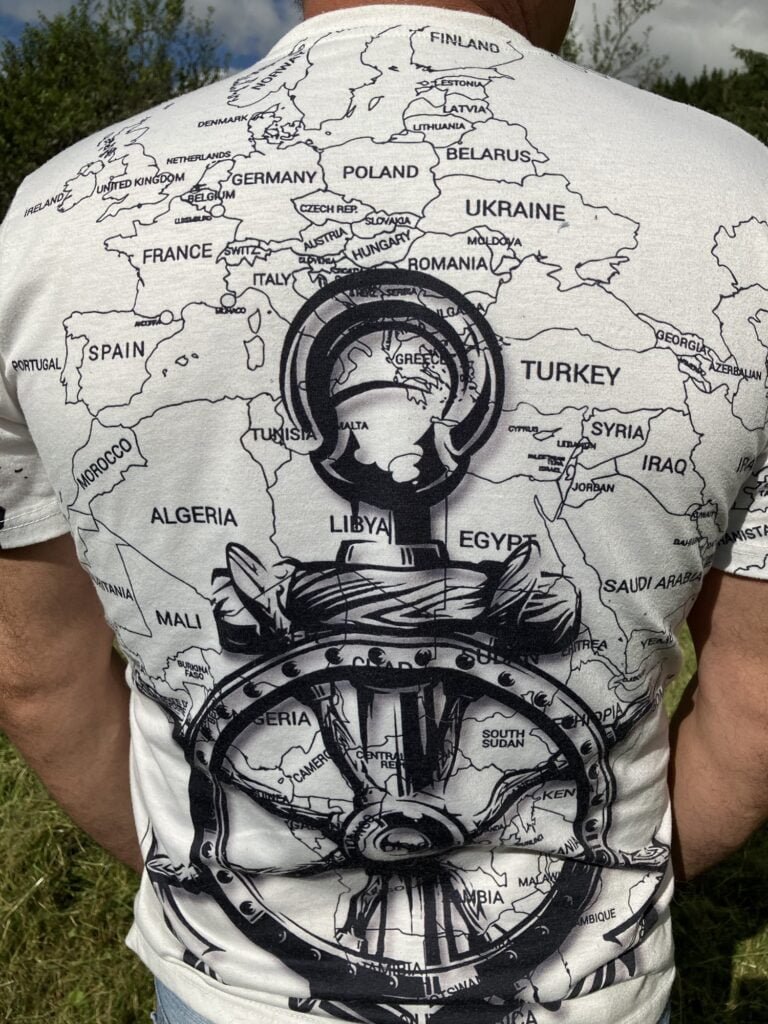
How a mechanical issue leads to a new map in the wild. Back home, I had a problem with a lawn mower. I called a friend for help, who finally came with this fabulous T-shirt!
MapsintheWild World T-Shirt
-
sur GeoSolutions: GeoSolutions Announces Membership in World Geospatial Industry Council
Publié: 30 July 2024, 8:19pm CEST
You must be logged into the site to view this content.
-
sur Mappery: Cup Cakes from Mont-Ral
Publié: 30 July 2024, 1:00pm CEST
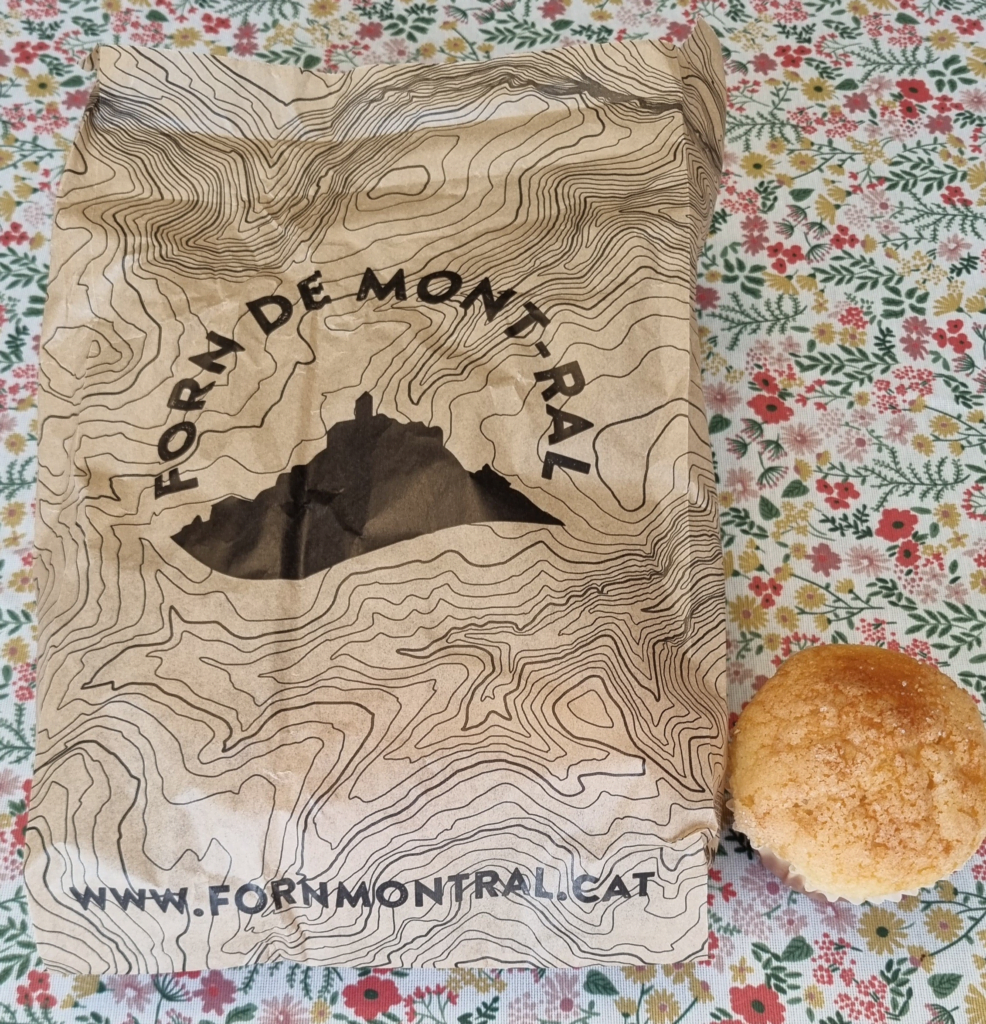
Raf shared this “Tasty cupcakes from Forn de Mont-ral, Prades, Catalunya”
MapsintheWild Cup Cakes from Mont-Ral
-
sur Markus Neteler: Happy 41st birthday, GRASS GIS!
Publié: 29 July 2024, 1:01pm CEST
Today, we celebrate a true geospatial legend: GRASS GIS!
The post Happy 41st birthday, GRASS GIS! appeared first on Markus Neteler Consulting.
-
sur Mappery: Panorama of New York City
Publié: 29 July 2024, 1:00pm CEST
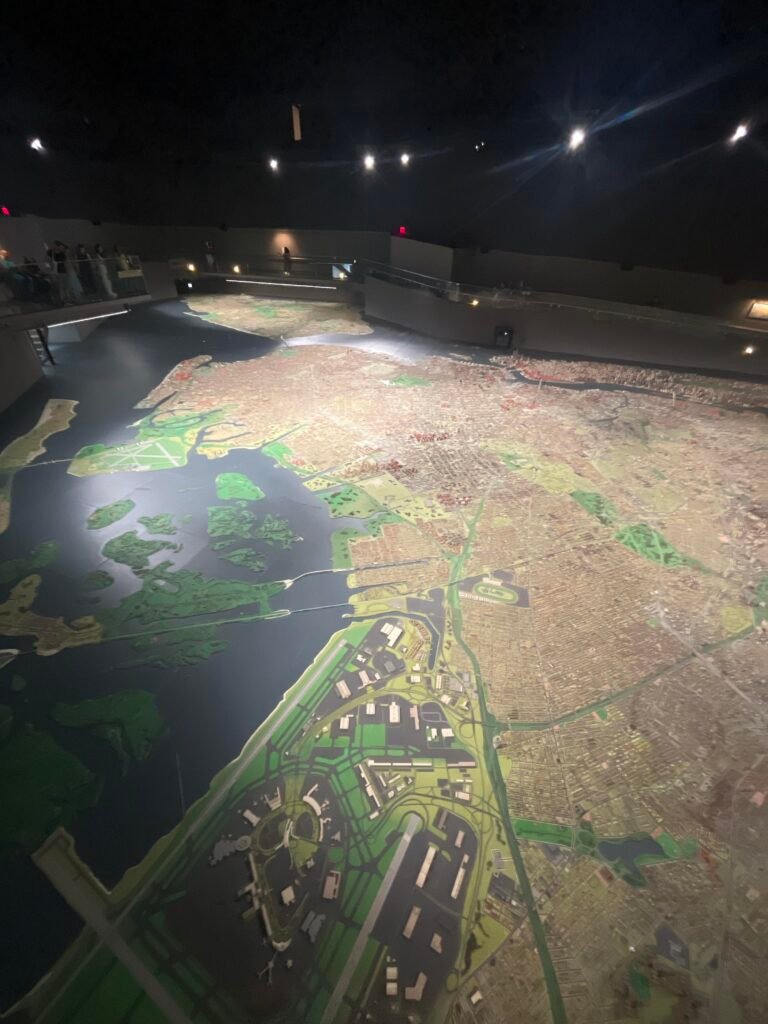
Tom MacWright shared this picture of the Panorama of the City of New York, an urban model of New York City and the centrepiece of the Queens Museum. For more information, click here.
MapsintheWild Panorama of New York City
-
sur Mappery: Sorgenfri
Publié: 28 July 2024, 1:00pm CEST
-
sur GRASS GIS: GRASS GIS 8.4.0 released
Publié: 27 July 2024, 1:42pm CEST
What’s new in a nutshell The GRASS GIS 8.4.0 release contains more than 520 changes compared to 8.3.2. This new minor release includes important fixes and improvements to the GRASS GIS tools, libraries and the graphical user interface (GUI), making it even more stable and robust for daily work. Most importantly: location becomes project: The Python API, command line, and graphical user interface are now using project instead of location for the main component of the data hiearchy while maintaining backward compatibility. -
sur Mappery: Bed sheets
Publié: 27 July 2024, 1:00pm CEST
-
sur Mappery: Do not mix dishcloths and napkins
Publié: 26 July 2024, 1:00pm CEST
This is literally what I thought when I saw this picture. The sentence makes sense for a French speaker; the English version would be: not mix apples and pears, but I also found apples and oranges. Always happy to learn the usage if you want to comment on our socials.
Anyway, my title is misleading about the subject; the picture shows handkerchiefs from Chris Chambers.
MapsintheWild Do not mix dishcloths and napkins
-
sur Mappery: Bowtie
Publié: 25 July 2024, 1:00pm CEST
-
sur GeoSolutions: MapStore 2024.01 Series of releases
Publié: 25 July 2024, 11:07am CEST
You must be logged into the site to view this content.
-
sur WhereGroup: Erweiterte Geodatenvisualisierung mit MapComponents
Publié: 24 July 2024, 3:40pm CEST
Die MapComponents-Bibliothek ermöglicht die Anzeige und Integration verschiedener Datenformate direkt im Browser. Anhand eines praktischen Beispiels wird gezeigt, wie Benutzer OpenStreetMap-Daten in eine Webanwendung laden und diese anzeigen lassen können. -
sur Mappery: Coaster
Publié: 24 July 2024, 1:00pm CEST
-
sur Jorge Sanz: Elastic Volunteering Time Off
Publié: 23 July 2024, 1:15pm CEST

My employer, Elastic, has a number of philanthropic initiatives but definitely the one I love the most is the Volunteering Time Off (VTO). We are given 40 hours per year from our working hours to contribute to projects and initiatives we care about. Employees have full freedom to choose what they want to do with that time and are encouraged to use it.
In my case, over this almost 5 years I have to admit I haven’t used all that time every year but I tried to get the most of it. During COVID I did some remote work for a local NGO that works for fair trade, giving them a webinar about Open Source among other things (see update from December 2019 and following months). I also spent a few days working on some admin tasks for the Open Source Geospatial Foundation and I’ve already written here about a couple sessions I did for Cibervoluntarios, training seniors and teens about safe browsing and email.
Last week I was showcased in the company blog, along with other colleagues, on different projects to contribute to. In my case, last year I joined the mapping efforts after the Morocco Earthquake and took a full day mapping roads and streets of a rural area, as part of the coordinated efforts from the Humanitarian OpenStreetMap team (reported on my October community update). I’m very happy to have this support from my employer to leave things aside when an emergency like this arises, granted there are no other urgent issues at work.
As a personal call to action, I’d love to get back to Cibervoluntarios activities. This year has been quite busy; let’s see after summer if there’s room for getting out and engaging with them.
I know I haven’t updated this site in a while, I’ll write one soon! ?
-
sur Mappery: Geodesic point
Publié: 23 July 2024, 1:00pm CEST
-
sur QGIS Blog: Introducing the new QGIS.org website
Publié: 23 July 2024, 11:00am CEST
We have a new website!
We recently launched our new website at QGIS.org. It is a ground-up overhaul and provides a fresh take on the first contact point for existing or potential users wishing to engage with the QGIS project and discover its value proposition.

A new strategy for QGIS.org websites
In this blog post, we would like to provide an overview of the goals that we had for building the new QGIS.org website and the bigger picture of how this website update fits into the broader strategy for our website plans for QGIS.
About two years ago, we started experimenting with building a new QGIS.org website based on Hugo. Hugo, as a technology choice, was less important than was our intent to develop a more modern site that addressed our strategic goals.
After some ‘in-house’ (i.e. volunteer-based) work to develop an initial version of the site, we received the go-ahead to use QGIS funds for this and put out a call in October 2023 for a company to support our work. This was ultimately won by Kontur.io, who, together with our volunteers, brought the work into high gear.
 Initial analysis of the questions and actions to be quickly answered by qgis.org
Goal 1: Speak to a new audience
Our primary goal was to speak to a new audience. We are confident that QGIS can compete with all of the commercial vendors providing GIS software. We didn’t convey that well on our old website. We feel that QGIS was too apologetic in how it presented itself. We wanted a website which inspires confidence while addressing the needs of a corporate or organisational decision-maker who is looking at the QGIS project during their GIS software selection process.
The old website was very focused on the developer and contributor community. Obviously, those aspects are important since, without our fantastic community, the QGIS project would not exist. The messaging around open source is also important. Yet these ideas are secondary to the idea that QGIS is one of the best (if not the best) desktop GIS applications out there on the market – open-source or otherwise. We need to present it in this professional perspective.
So, the first goal was to change the messaging to focus on QGIS’s value proposition and take a very professional approach to presenting ourselves on the website.
 User group and requirements analysis for the potential qgis.org visitors
Goal 2: Harmonisation
The second goal was to start the process of harmonising all of our website properties. QGIS.org, over the years, has built many different web properties. For example, there’s the plugins website, the feed, the changelog, the sustaining members website, the lessons website and the certification website, the new resources hub website, the API documentation, the user documentation, the user manual, the training manual, various other documentation efforts, and more. Some of those are combined in one application, There are also some less well-known resources, like our analytics.qgis.org and another one for plugin analytics. In short, we’ve a lot of resources!
With so many different web properties, they’ve devolved over time: each has its own look and feel, navigation approach and how you interact with it. Some of them were translated, and some of them were not. We want to harmonise all of these sites so that the user does not notice any change in user experience when they move from one QGIS-related site to another.
Goal 3: Harmonising deployment
In the underlying process of these changes, we’re also redeploying all of the websites on new servers, which are more up-to-date and use better security and maintenance practices. Plenty of work is happening in the background to ensure that all of the servers are in a better-maintained state, document how they’re maintained, and so on.
Goal 4: A hub and spokes
The objective of the new site design is to allow quick movement between the QGIS auxiliary sites. The QGIS.org site will form a hub that effortlessly takes visitors to whichever QGIS-related site they need to complete the task they are busy with. If you’re moving between these sites, the experience should be seamless. You should not really even be aware that you’re moving between different websites. Other than looking at the URL bar, the user presentation and experience should be harmonious between all of them.
One way we are planning to achieve this is to have a universal menu bar and footer. You will see that in the new website’s design, there is a menu bar across the top. This menu bar has two levels: the top menu and the second level, where the search bar is.
 The universal menu bar
In this second row, auxiliary sites will have their own sub-menu whilst keeping the shared top-level menu. So if you, for example, are moving around in plugins and want to review the plugin list or submit a new plugin, all of that navigation will be on the second line where the search bar is currently. Regardless of which subdomain you are on, the top-level menu bar will be the same, allowing you to easily navigate back to the hub or to another subdomain.
The footer will be unified and shared between all sites, and the cascading style sheets and styling will be unified across all of the QGIS websites.
In the next phase, we will work to achieve this coherence across all the websites, though we still have a few more tweaks to make to the qgis.org site first.
Goal 5: DOTDOTW – do one thing, do one thing well
We plan to break some auxiliary websites apart into separate pieces. So, for example, the changelog management, certification management, sustaining members management, and lessons management are all in one Django app. We will split them into small single-purpose applications using some common UX metaphors so that each is a standalone application that makes it easy for a potential contributor to understand everything the application does. This will also simplify management as we can upgrade each auxiliary site on separate development cycles. We will also finally have semantic URLs, e.g. certification.qgis.org, to take you to the different areas of interest on the site.
The plugins.qgis.org is also going to be refactored so that it just has plugins and not the resource sharing we’ve added in the last few years. The resource sharing will go into its own subdomain. Similarly, the Planet website will get split into its own website (the planet is a blog aggregator or RSS aggregator) that will be in its own managed instance. Some other components (like the analytics) are difficult to split out like this because they’re linked to the same database. We will try to make sure that those are more discoverable and theme them as much as possible to match the rest of the website experience.
Goal 7: Encapsulation

Another goal we had for the QGIS.org makeover was to make the site performant and self-contained. By self-contained, we mean that it should not ‘call’ out to CDN, Google or other platforms for resources like fonts, CSS frameworks, javascript libraries, etc. There were two reasons for this:
- These platforms often use such resources to track users as they move around the Internet, which we want to avoid as much as possible.
- We want to wholly manage our site, be able to fix any issues independently and generally follow a path of self-determination.
Our approach also facilitated the creation of a very performant website, as you can see here. We will try to adhere to these principles for the auxiliary site updates we do in the future, too.
What about translations?The question has come up: Why did we not want to translate the new QGIS.org when it was translated before?
Firstly, we should make it clear that we do not plan to remove translations from the user documentation, the user manual, and so on, where we think they have the most value.
For the main QGIS.org site, we question whether there is a high value in translating it. Here are some reasons why:
1. Lingua franca: If you are an IT manager in a non-English-speaking country and you want to evaluate some software, you’re going to run into a product page that presents itself in English – it is the norm for IT procurement to work in English for reviewing software products and so on.
2. Automation: Automated translations inside browsers are getting better and better. While these translations are still not completely adequate, we think they will be in one or two years’ time.
3. Translation integrity: Our pursuit of Goal 1 means that we would no longer find it acceptable to have partial website translations. We also need to ensure that the wording and phrasing are consistent with the English messaging. We also have concerns about the QA process regarding trust and review – we want to ensure that any translation truly reflects the meaning and intent of the original content and has not been adjusted during the translation process.
4. Cohesion: Our most important point is raised if we go back to this idea of cohesion between the different websites like QGIS.org, plugins.qgis.org and so on. As well as having the same styling, we also don’t want to switch between languages as you hop between the sites. We aim to present them all as one site. If we translate QGIS.org and then take you to our auxiliary sites, e.g., plugins.qgis.org, the feed, or certification pages, which are in English only, the experience is jarring.
So we must either translate everything into all of the same languages, or work in English. Translating everything is a mammoth task for the translators and for us to retrospectively add translation support to each platform. Thus, we prefer the approach of harmonising everything to one language and then focusing our translation efforts on three areas:
- The application itself,
- the user manual and
- the training manuals.
We can leave the rest of the experience in English and instead focus on harmonising, for now, both in terms of look and feel and the technology used.
When we consider everything as one big website and what the bigger plan is, it is hopefully clearer why we didn’t think translating the landing page and QGIS.org was the best approach.
Further funded workWe hope to use more QGIS funding to support this work in the future. We’re also hoping to work again with Kontur to start moving all these auxiliary sites into their own projects, applying our style guidelines to each. Independently of that, Tim (volunteer), Lova (QGIS funded), and others are already getting started with this process.
Helping outDo you have strong opinions about the website? Contact Tim on the PSC mailing list if you would like to get involved as a volunteer. We would love to hear from designers, word smiths, marketers, information architects, SEO specialists, web developers and those who think they can help us achieve our goals.
ConclusionWe hope our goals and process make sense for everybody and that we were able to lay out a clear, logical argument about why we don’t want to translate the new website quite yet. We want to focus on these overarching goals and then return to them later if they are still a priority for people. Everything we have built is Open Source and available at this repo, where you can also find an issue tracker to report issues and share ideas relating to the new website.
Thanks for reading. Go spatial without compromise


Cheers, Tim, Marco and Anita
-
sur SourcePole: Adding external WMS to the QGIS Cloud Web Map
Publié: 23 July 2024, 4:00am CEST
The use of WMS/WMTS layers in a QGIS Cloud map project can significantly degrade the performance of the map display. I have already discussed how to counter this problem in an earlier post. One of the solutions is to load external WMS as background layers. The problem with this approach, however, is that only one WMS background layer can be loaded at a time. If further WMS layers are to be loaded into the map at the same time, this approach cannot be used. -
sur Mappery: Wallpaper
Publié: 22 July 2024, 1:00pm CEST
-
sur GeoServer Team: GeoServer 2024 Q3 Developer Update
Publié: 22 July 2024, 4:00am CEST
This is a follow up to 2024 roadmap post outlining development opportunities.
First of all thanks to developers and organisations that have responded with offers of in-kind contributions. This blog post is assessing current progress and outlines a way forward to complete the Java 17/Jakarta EE/Spring 6 upgrades.
This post highlights development activities that are available to be worked on today, along with interested developers and commercial support providers available to work on GeoServer roadmap items.
Spring Framework 6 TasksThe key challenge we are building towards is a spring-framework 6 update, ideally by the end of 2024 when the version we use now reaches end-of-life.
The tasks below are steps towards this goal.
Wicket 9 upgradeInterested Parties:
- Brad has been doing amazing work with the Wicket 9 upgrade and is in need of assistance.
- GeoCat has offered to do manual A/B testing when PR is ready for testing.
Activity:
- [GEOS-11275] Wicket 9 upgrade
- geoserver#7154
Spring Security 5.8 provides a safe stepping stone ahead of the complete spring-framework 6 upgrade and is an activity that can be worked on immediately.
Interested parties:
- Andreas Watermeyer (ITS Digital Solutions) offered to work on this activity in during the initial January call out, and has indicated they are now ready to start.
Activity:
- [GEOS-11271] Upgrade spring-security to 5.8
The spring-security-oauth client has reached end-of-life and a GeoServer OAuth2 support must be rewritten or migrated as a result.
There are two paths to migrate to spring-security-core implementation:
-
Option: Migrate the existing community module implementations to spring-security-core in place; with as little loss of functionality as possible. This has the advantage of using existing test coverage to maintain a consistent set of functionality during migration.
-
Option: Setup a community module alongside the existing implementation with the goal of making a full supported etension. This approach has the advantages of allowing organisations the ability to do A/B testing as both the old and new implementation would be available alongside each other. This has the advantage of allowing stakeholders to only fund, implement, test functionality as required without disrupting existing use.
Security integrations often require infrastructure to develop and test against, which the core GeoServer team does not have access to for automated tests. We would like to see organisations review their security integration requirements and be on hand to support this development activity.
The initial priority will support for OAuth2 and Open ID Connect (OIDC), parties interested in maintaining support for Google, GeoNode, GitHub are welcome to participate.
Interested Parties:
- Andreas Watermeyer (ITS Digital Solutions) offered to work on this activity, or test as needed.
- GeoCat is interested in this work also, with the goal of bringing the OIDC plugin up to full extension status (if financing is available).
Activity: not started
- [GEOS-11272] spring-security-oauth replacement, with spring-security 5.8
The image processing library used by GeoServer has been donated to the open source community under the name ImageN.
The immediate goal has been to add test cases to this codebase and make an ImageN 1.0 release. Andrea has come up with the amazing idea of integrating with JAI-Ext project immediately, to benefit from the improved operators, and jumpstart test coverage.
Interested Parties:
- Jody (GeoCat) is available to support this activity, or take lead if funding is available.
- Andrea (GeoSolutions) has had a deep dive into the implications for the JAI-EXT project outlining a roadmap for project integration
We would like to see organisations that depend on GeoServer for earth observation and imagery to step forward with funding for this activity.
2024 Financial support and sponsorshipThus far 2024 has not had a strong enough sponsorship response to support the project goals above. As a point of comparison we established a budget of $15,000 with OSGeo last year to take on an low-level API change that affected several projects.
This year GeoServer sponsorship has raised between $1,000 and $2,000 which is not enough to plan with or coordinate in-kind contributions offered thus far.
Jody has worked with the OSGeo board to make adjustments to the sponsorship:
- Guidance has been provided for appropriate sponsorship levels for individual consultants, small organisation, companies and public institutions of different sizes.
- There are clear examples of how to sponsor and donate, along with the the perks and publicity associated with financial support
- GeoServer has a new sponsorship page on our website collecting this information
- GeoServer now lists sponsors logos on our home page, alongside core contributors.
We would like to thank everyone who has responded thus far:
- Sponsors: How 2 Map, illustreets
- Individual Donations: Peter Rushforth, Marco Lucarelli, Gabriel Roldan, Jody Garnett, Manuel Timita, Andrea Aime
-
sur From GIS to Remote Sensing: Semi-Automatic Classification Plugin version 8.3 release date
Publié: 21 July 2024, 3:00pm CEST
This post is to announce that the new version 8.3 of the Semi-Automatic Classification Plugin (SCP) for QGIS will be released the 3rd of August 2024.This new version will require the new version 0.4 of the Python processing framework Remotior Sensus, and will include several new features such as such as clustering, raster editing and raster zonal stats.
For any comment or question, join the Facebook group or GitHub discussions about the Semi-Automatic Classification Plugin.
-
sur Mappery: Which projection is this?
Publié: 21 July 2024, 1:00pm CEST

I found this nice geo license plate walking by the River Thames. Very geo-nerdy. Happy Sunday!
MapsintheWild Which projection is this?
-
sur From GIS to Remote Sensing: Remotior Sensus Update: Version 0.4
Publié: 20 July 2024, 5:41pm CEST
 I'm glad to announce the update of Remotior Sensus to version 0.4.This new version add several new features such as clustering, raster editing and raster zonal stats. Following the complete changelog:
- Added tool "Band clustering" for unsupervised K-means classification of bandset
- Added tool "Raster edit" for direct editing of pixel values based on vector
- Added tool "Raster zonal stats" for calculating statistics of a raster intersecting a vector.
- Improved the NoData handling for multiprocess calculation
- In "Band clip", "Band dilation", "Band erosion", "Band sieve", "Band neighbor", "Band resample" added the option multiple_resolution to keep original resolution of individual rasters, or use the resolution of the first raster for all the bands
- In "Cross classification" fixed area based accuracy and added kappa hat metric
- In "Band combination" added option no_raster_output to avoid the creation of output raster, producing only the table of combinations
- In "Band calc" replaced nanpercentile with optimized calculation function
- Improved extraction of ROIs in "Band classification"
- Minor bug fixing and removed Requests dependency
-
sur Mappery: Corsica
Publié: 20 July 2024, 1:00pm CEST
-
sur GeoNode: Docs For Devs
Publié: 19 July 2024, 7:43pm CEST
GeoNode: Docs For Devs -
sur GeoNode: Translate
Publié: 19 July 2024, 7:43pm CEST
GeoNode: Translate -
sur GeoNode: Improve
Publié: 19 July 2024, 7:43pm CEST
GeoNode: Improve -
sur GeoNode: Future
Publié: 19 July 2024, 7:43pm CEST
GeoNode: Future -
sur GeoNode: Patches
Publié: 19 July 2024, 7:43pm CEST
GeoNode: Patches -
sur GeoNode: Contribute
Publié: 19 July 2024, 7:43pm CEST
GeoNode: Contribute -
sur GeoNode: Extend
Publié: 19 July 2024, 7:43pm CEST
GeoNode: Extend -
sur GeoNode: Arch
Publié: 19 July 2024, 7:43pm CEST
GeoNode: Arch -
sur GeoNode: Testing
Publié: 19 July 2024, 7:43pm CEST
GeoNode: Testing -
sur GeoNode: Env Dev
Publié: 19 July 2024, 7:43pm CEST
GeoNode: Env Dev -
sur GeoNode: Management Commands
Publié: 19 July 2024, 7:43pm CEST
GeoNode: Management Commands -
sur GeoNode: Backups
Publié: 19 July 2024, 7:43pm CEST
GeoNode: Backups -
sur GeoNode: Other Languages
Publié: 19 July 2024, 7:43pm CEST
GeoNode: Other Languages -
sur GeoNode: Ssl
Publié: 19 July 2024, 7:43pm CEST
GeoNode: Ssl -
sur GeoNode: Troubleshoot
Publié: 19 July 2024, 7:43pm CEST
GeoNode: Troubleshoot -
sur GeoNode: Customize Geonode
Publié: 19 July 2024, 7:43pm CEST
GeoNode: Customize Geonode -
sur GeoNode: Production Geonode
Publié: 19 July 2024, 7:43pm CEST
GeoNode: Production Geonode -
sur GeoNode: Install Geonode
Publié: 19 July 2024, 7:43pm CEST
GeoNode: Install Geonode -
sur GeoNode: Share Map
Publié: 19 July 2024, 7:43pm CEST
GeoNode: Share Map -
sur GeoNode: Find Map
Publié: 19 July 2024, 7:43pm CEST
GeoNode: Find Map -
sur GeoNode: Create Map
Publié: 19 July 2024, 7:43pm CEST
GeoNode: Create Map
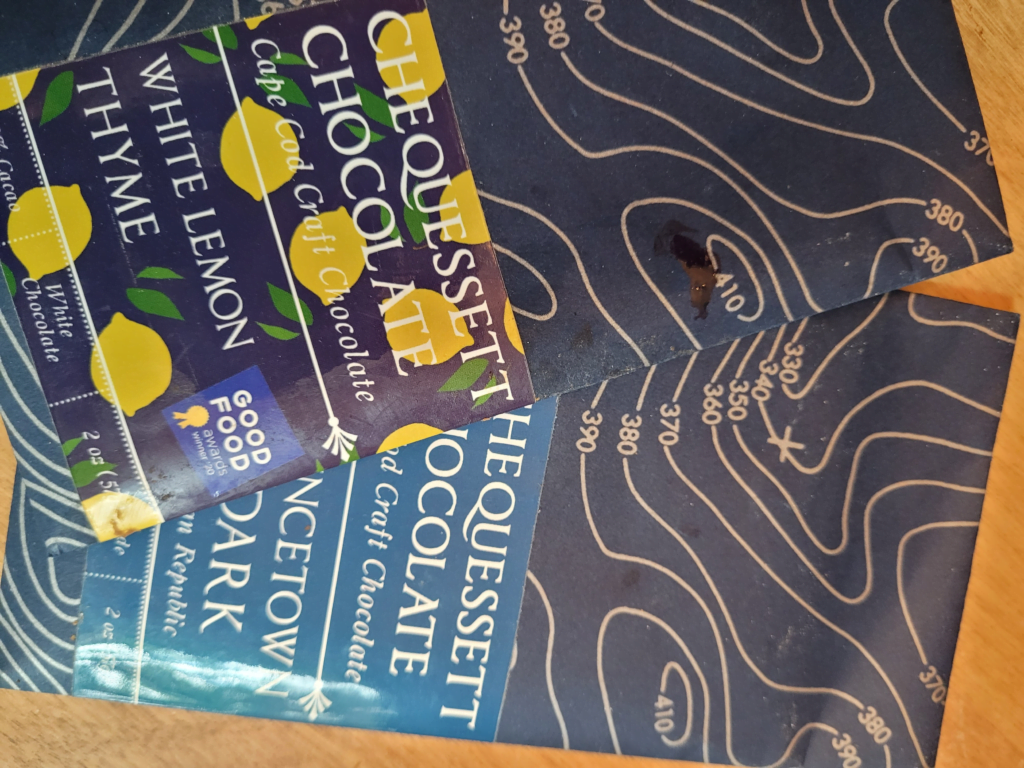


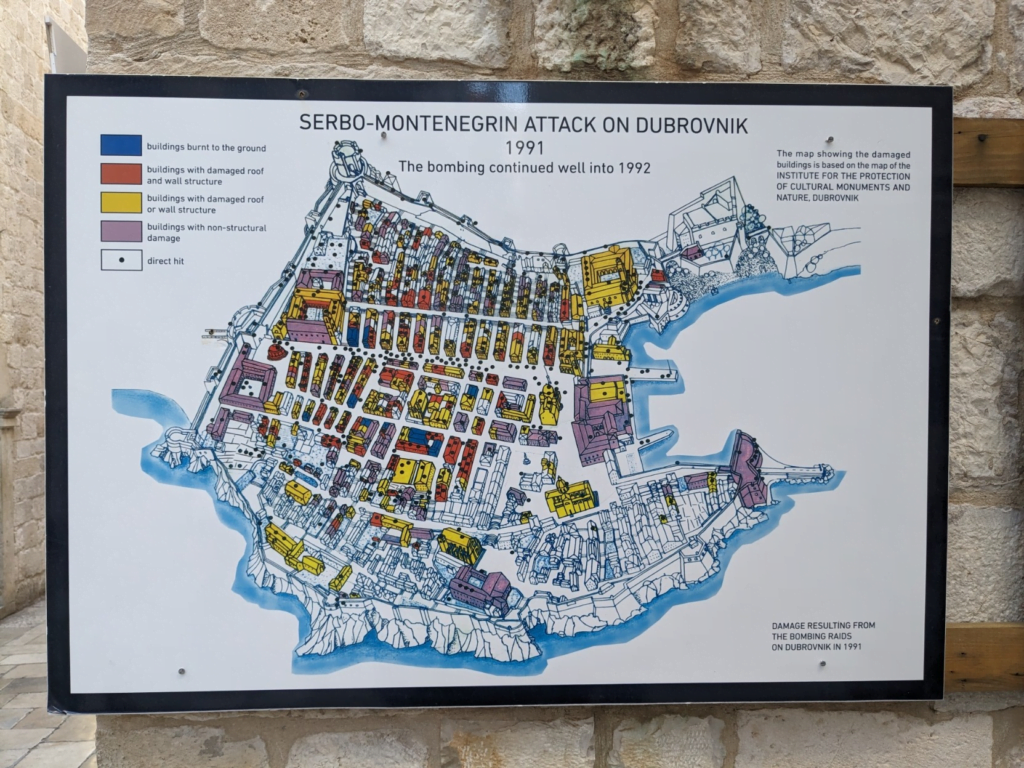
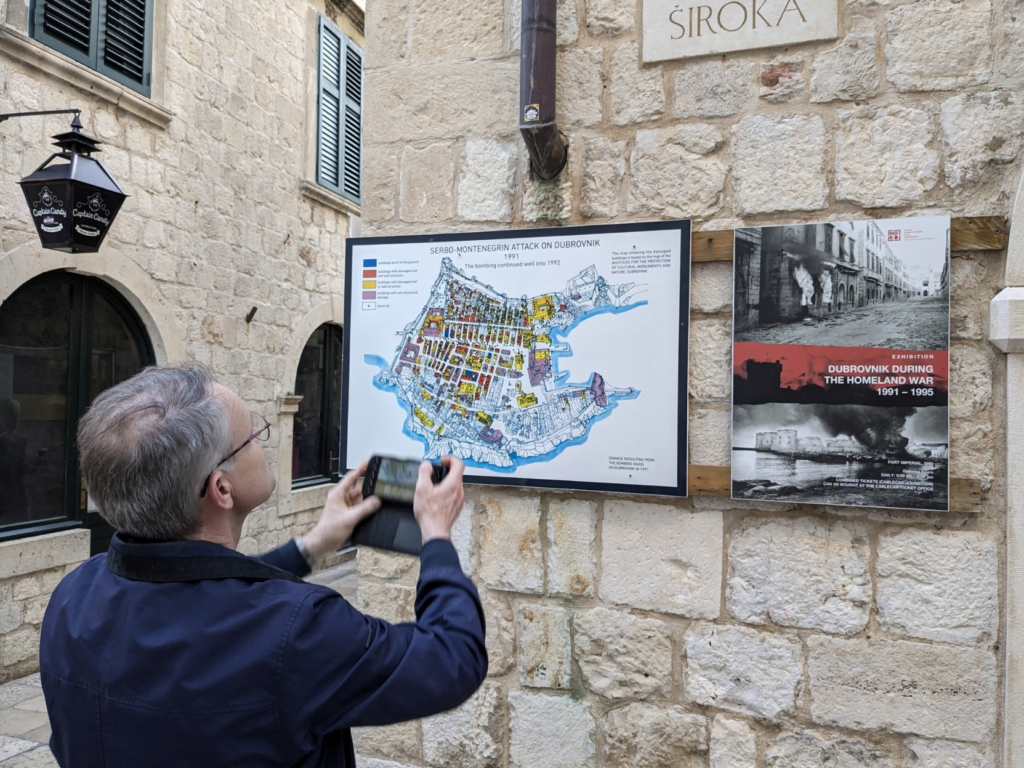

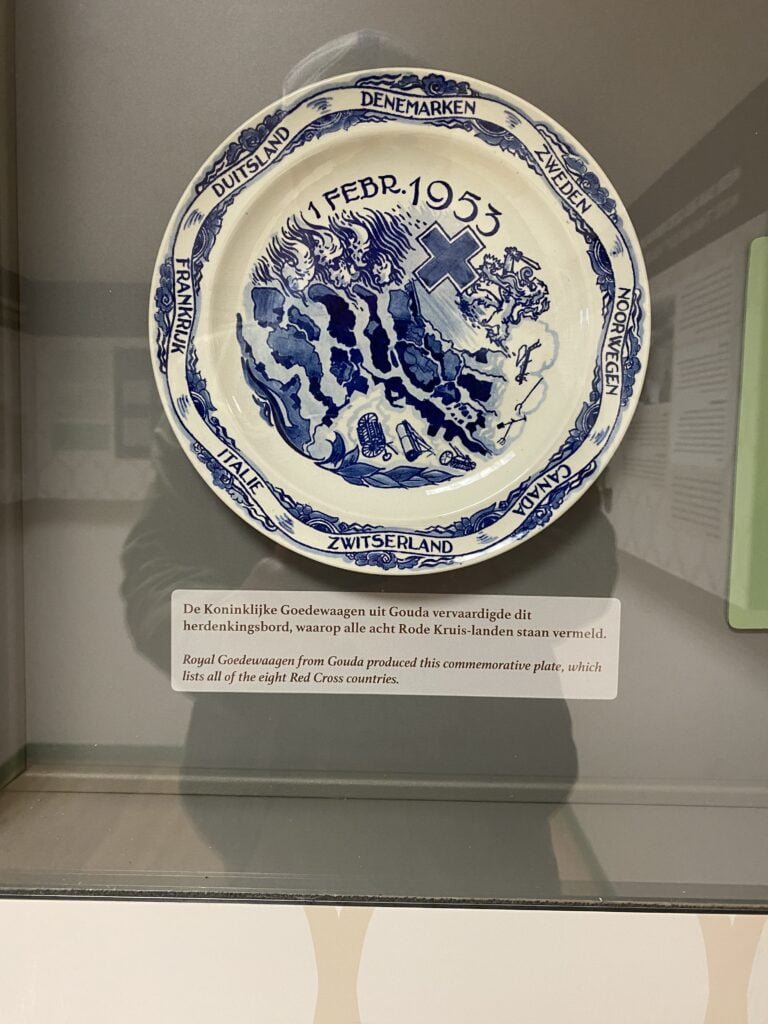
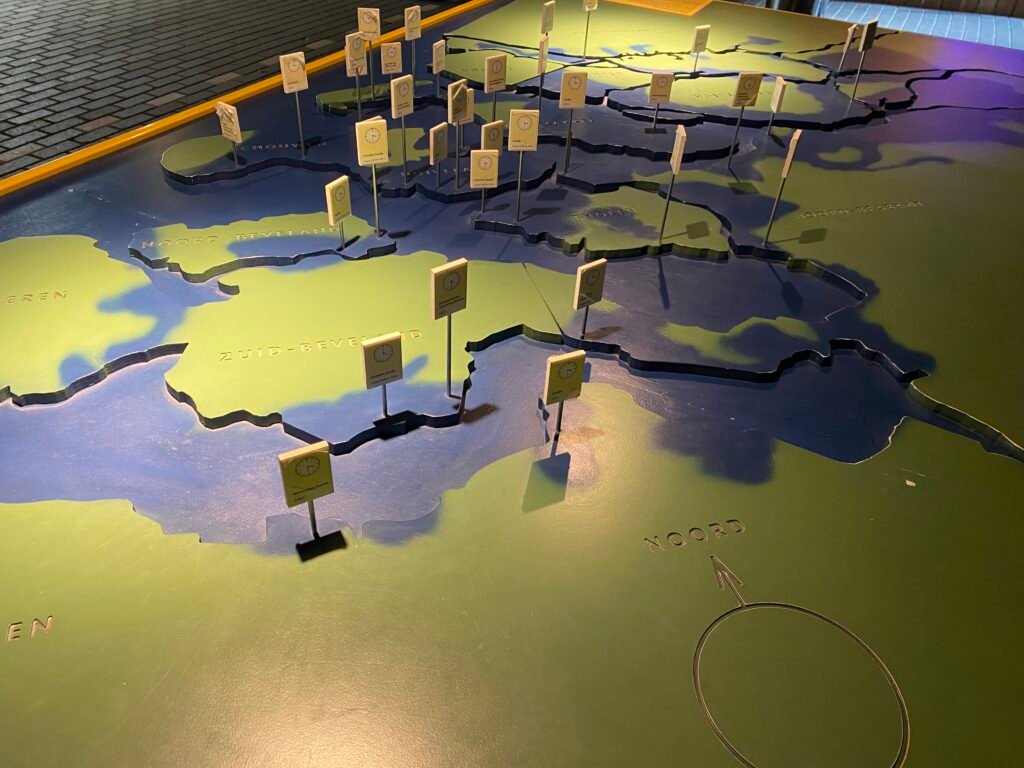


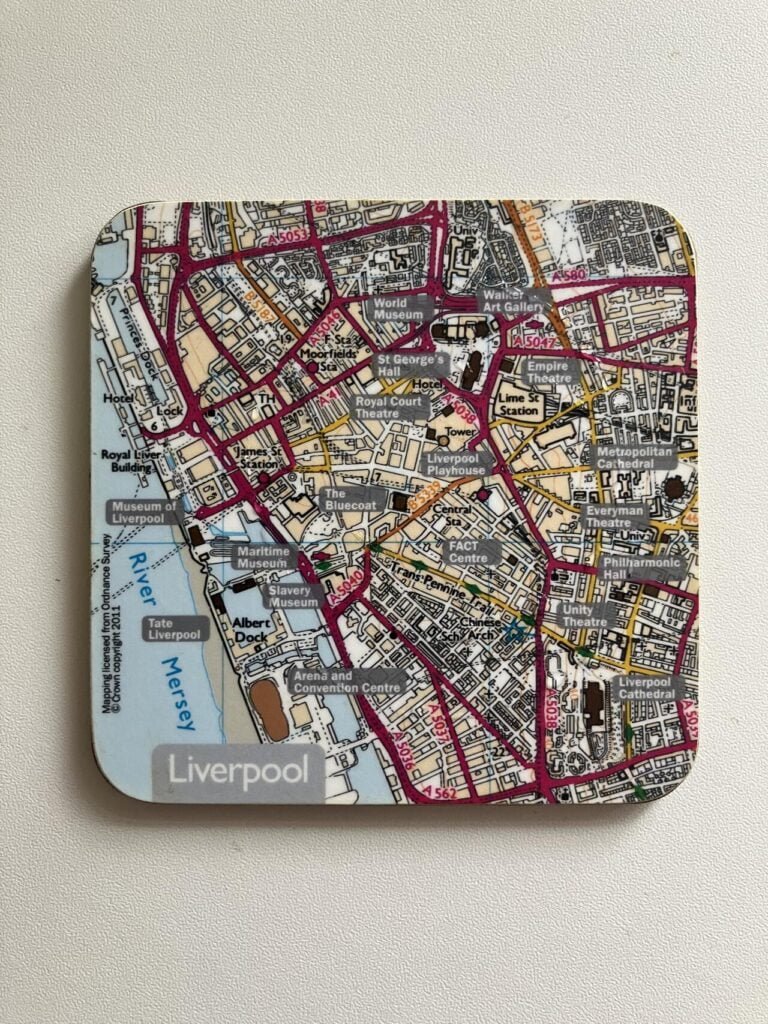


