
Vous pouvez lire le billet sur le blog La Minute pour plus d'informations sur les RSS !
Canaux
6782 éléments (244 non lus) dans 56 canaux
 Dans la presse
(110 non lus)
Dans la presse
(110 non lus)
-
 Cybergeo
(43 non lus)
Cybergeo
(43 non lus) -
Revue Internationale de Géomatique (RIG)
-
SIGMAG & SIGTV.FR - Un autre regard sur la géomatique
(6 non lus)
-
Mappemonde
(60 non lus)
-
Dans les algorithmes
(1 non lus)
Du côté des éditeurs
(19 non lus)
-
Imagerie Géospatiale
-
Toute l’actualité des Geoservices de l'IGN
(15 non lus)
-
arcOrama, un blog sur les SIG, ceux d ESRI en particulier (4 non lus)
-
arcOpole - Actualités du Programme
-
Géoclip, le générateur d'observatoires cartographiques
-
Blog GEOCONCEPT FR
Toile géomatique francophone
(86 non lus)
-
Géoblogs (GeoRezo.net)
-
Conseil national de l'information géolocalisée
(11 non lus)
-
Évènements – Afigéo
-
 Geotribu
-
Les cafés géographiques
(5 non lus)
-
UrbaLine (le blog d'Aline sur l'urba, la géomatique, et l'habitat)
-
Icem7
-
Séries temporelles (CESBIO)
(2 non lus)
-
Datafoncier, données pour les territoires (Cerema)
-
Cartes et figures du monde
-
SIGEA: actualités des SIG pour l'enseignement agricole
-
Data and GIS tips
-
Neogeo Technologies
-
ReLucBlog
-
L'Atelier de Cartographie
-
My Geomatic
-
archeomatic (le blog d'un archéologue à l’INRAP)
-
Cartographies numériques
-
Veille cartographie
-
Makina Corpus (1 non lus)
-
Oslandia
(2 non lus)
-
Camptocamp
(51 non lus)
-
Carnet (neo)cartographique
-
GEOMATIQUE
-
Le blog de Geomatys
(2 non lus)
-
Geomatick
-
CartONG (actualités)
-
Afigéo
(12 non lus)
Géomatique anglophone
(19 non lus)

opensource
-
sur Mappery: Car Park in The Hague
Publié: 9 June 2025, 1:00pm CEST
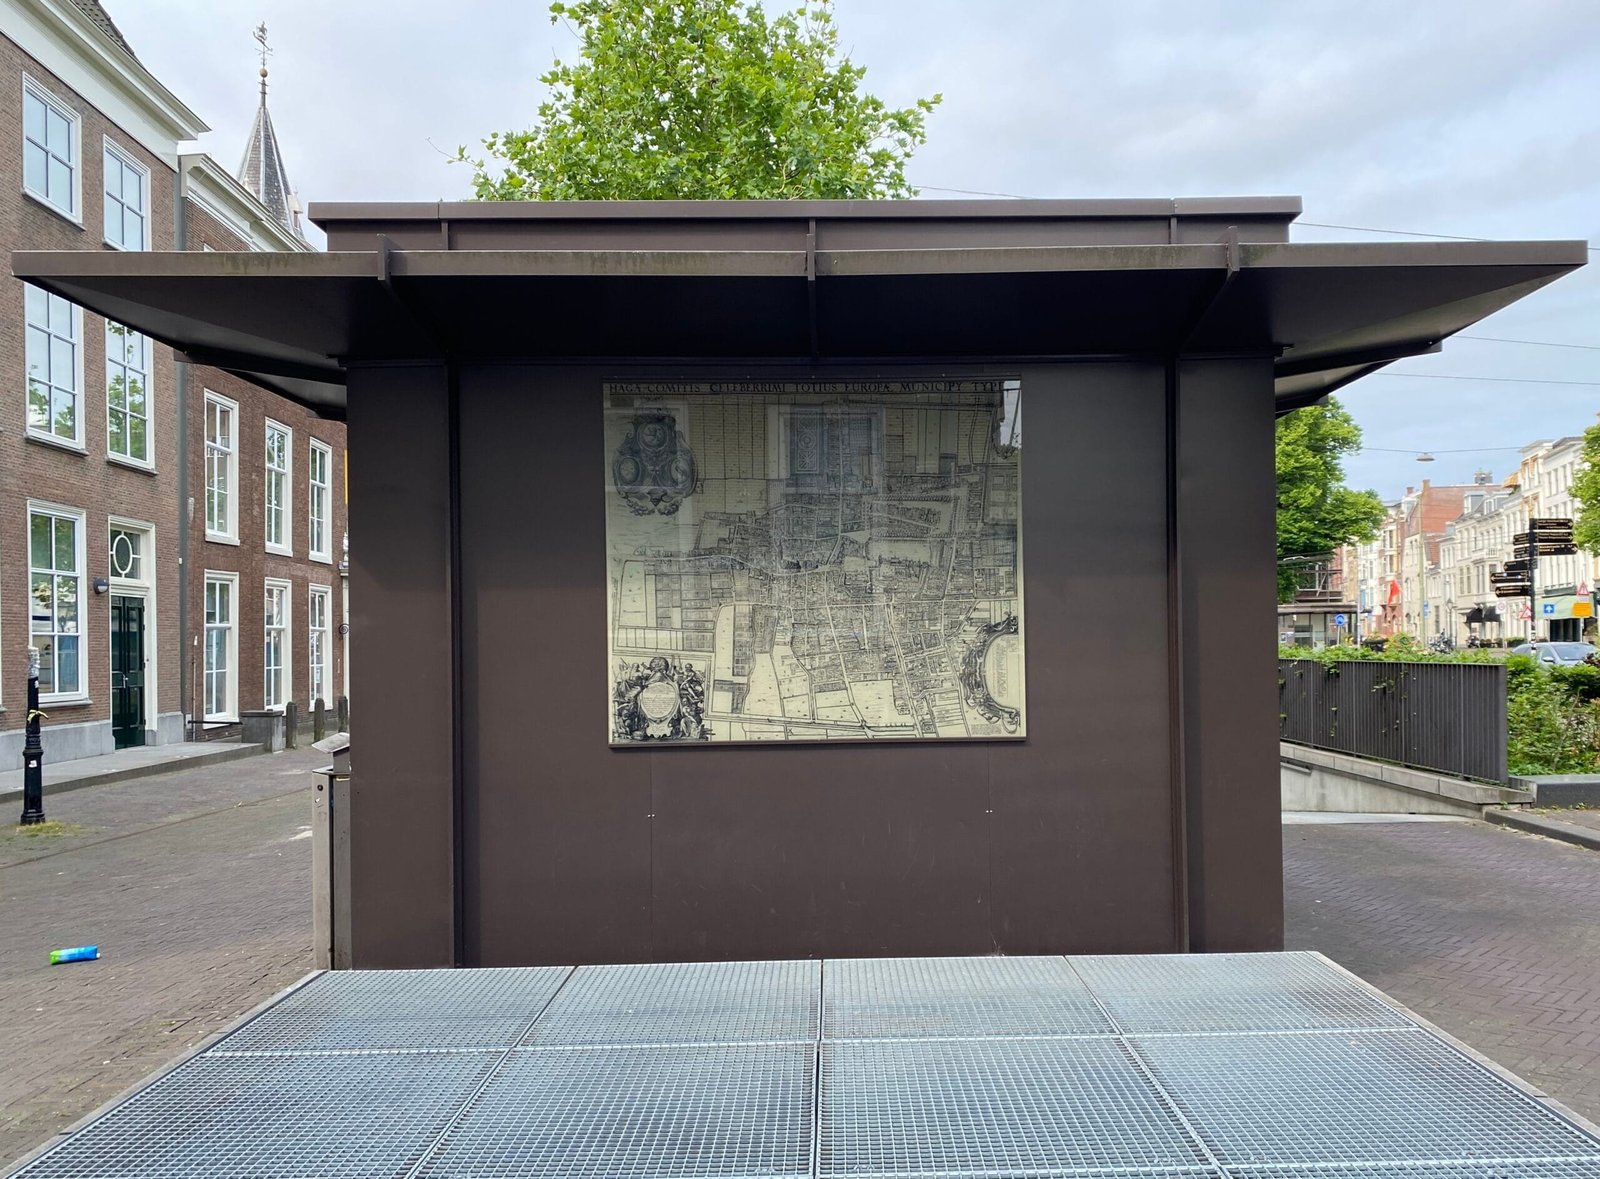
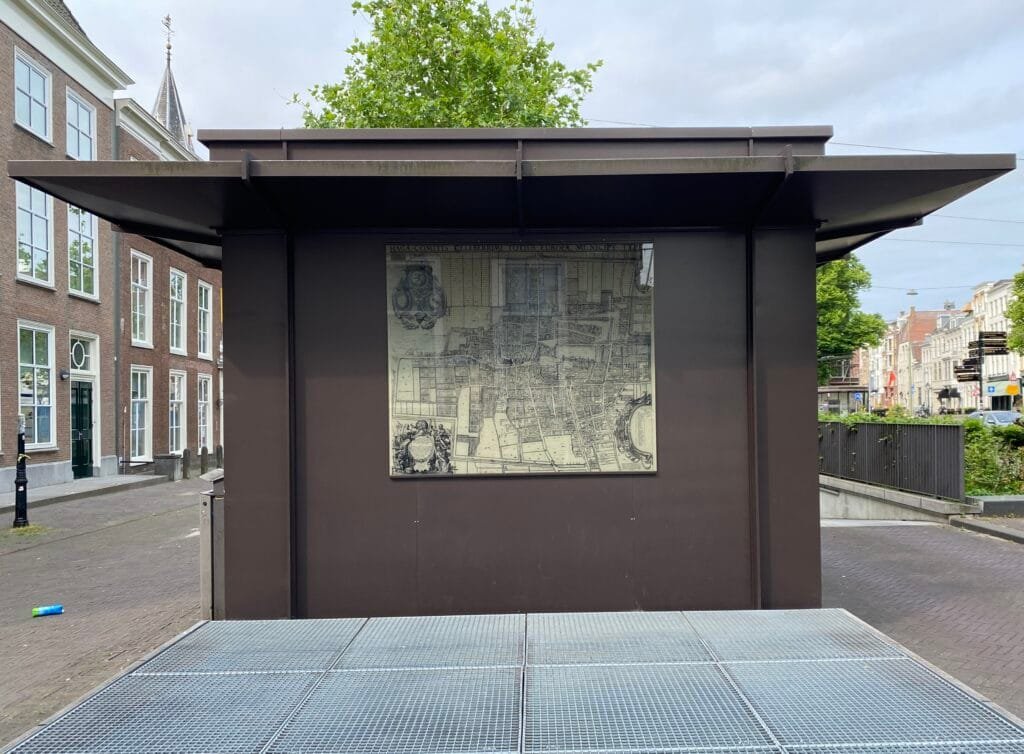
Reinder spotted this beautiful tiled map on the entrance to an underground car park in The Hague.
-
sur Mappery: Italian wines
Publié: 8 June 2025, 1:00pm CEST
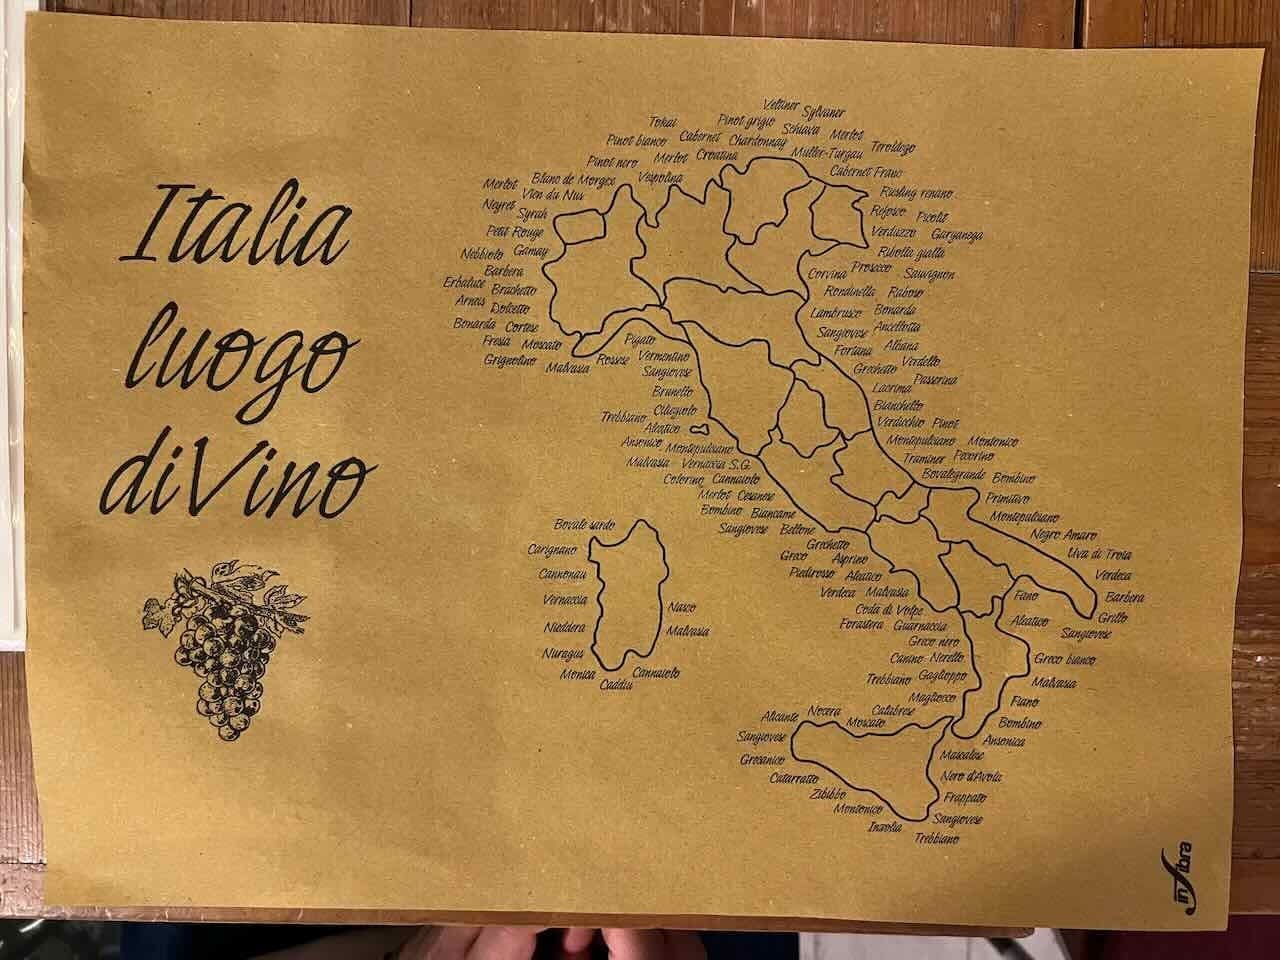
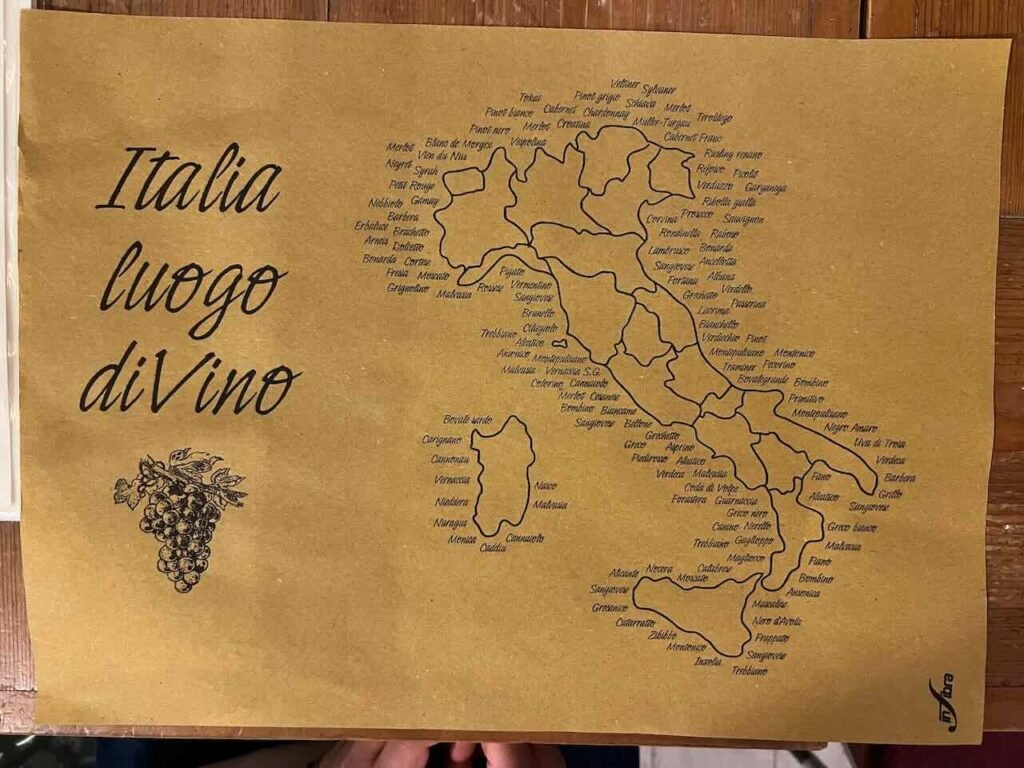
Fancy some Italian wines?
-
sur Mappery: Souvenir Shop in Italy
Publié: 7 June 2025, 1:00pm CEST


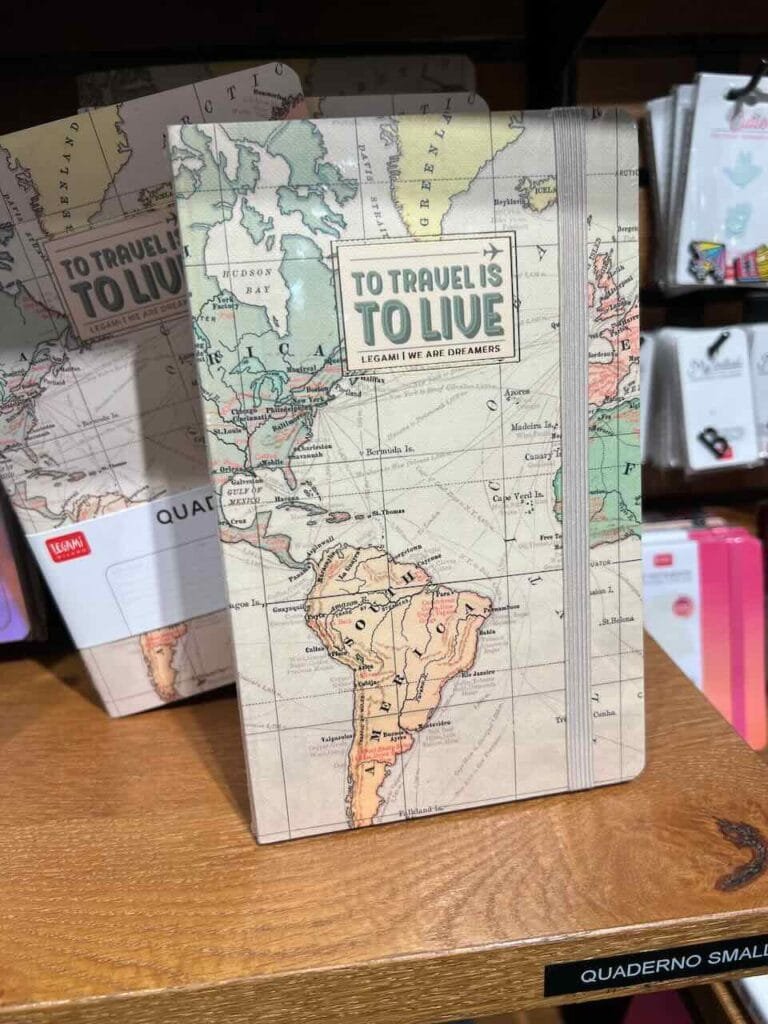
Legami is a souvenir shop where maps can be found in various forms.
-
sur Lutra consulting: Crowdfunding QGIS 3D: Support Open Source Digital Twins
Publié: 6 June 2025, 4:15pm CEST
Help fund QGIS 3D enhancements for digital twins, including glTF export, CityGML, IFC, and performance upgrades. Campaign ends June 30, 2025. -
sur Mappery: Trastevere
Publié: 6 June 2025, 1:00pm CEST
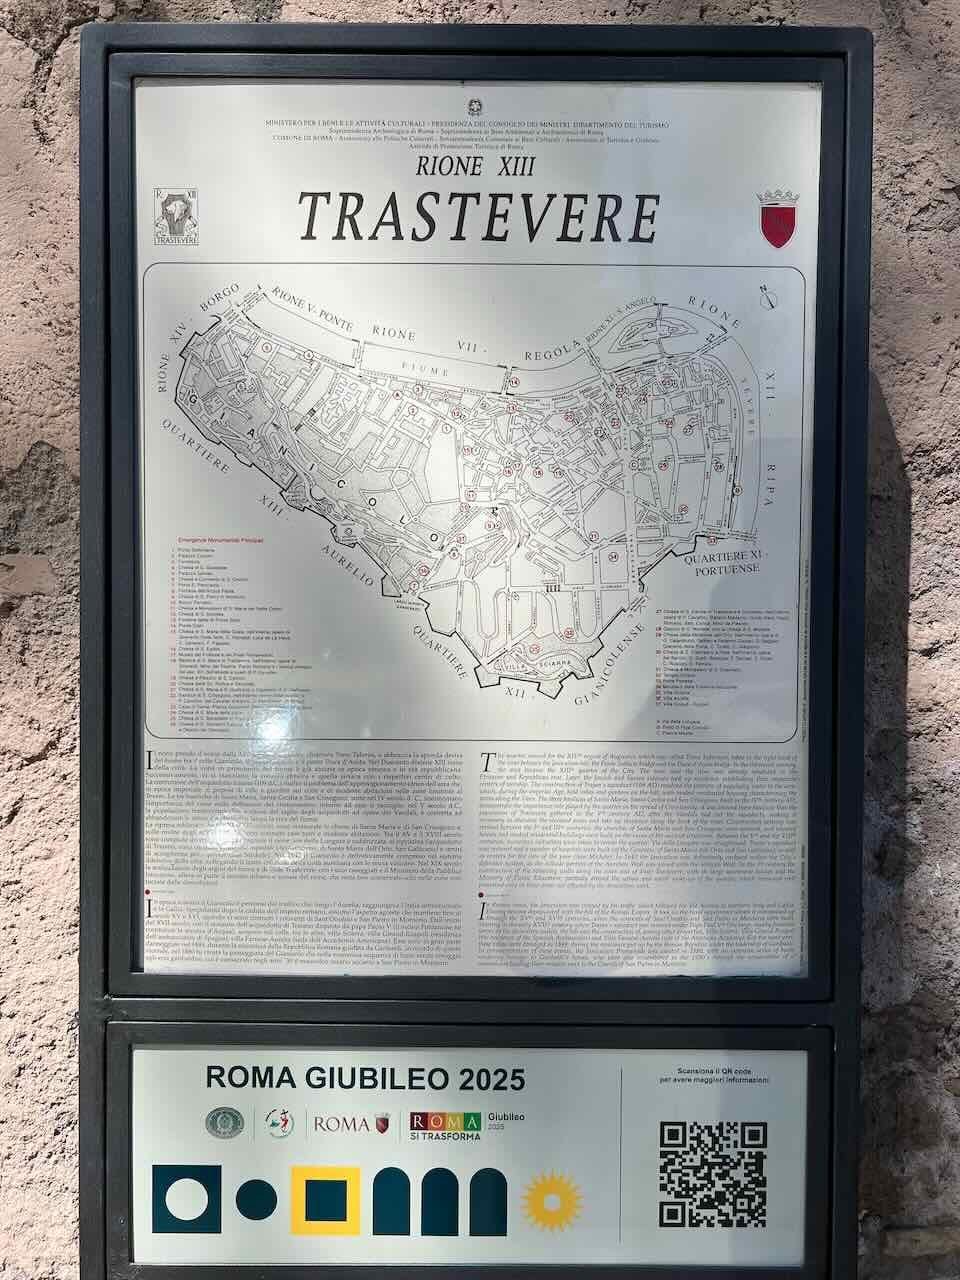


Back to Rome and the Trastevere.
-
sur Jackie Ng: Announcing: MapGuide Open Source 4.0 Beta 3
Publié: 5 June 2025, 6:37pm CEST
A new beta release of MapGuide Open Source 4.0 is now available.
The main driver for this release is updating an assortment of bundled components:
- PHP updated to 8.3.20
- Apache [httpd] updated to 2.4.63
- Tomcat updated to 9.0.104
This release also plugs an assortment of memory leaks found in:- The King Oracle FDO provider
- Rendering of tiles from tile sets
- Rendering of watermarks
- In-memory feature joins
- Render profiling
-
sur Mappery: Lecce
Publié: 5 June 2025, 1:00pm CEST
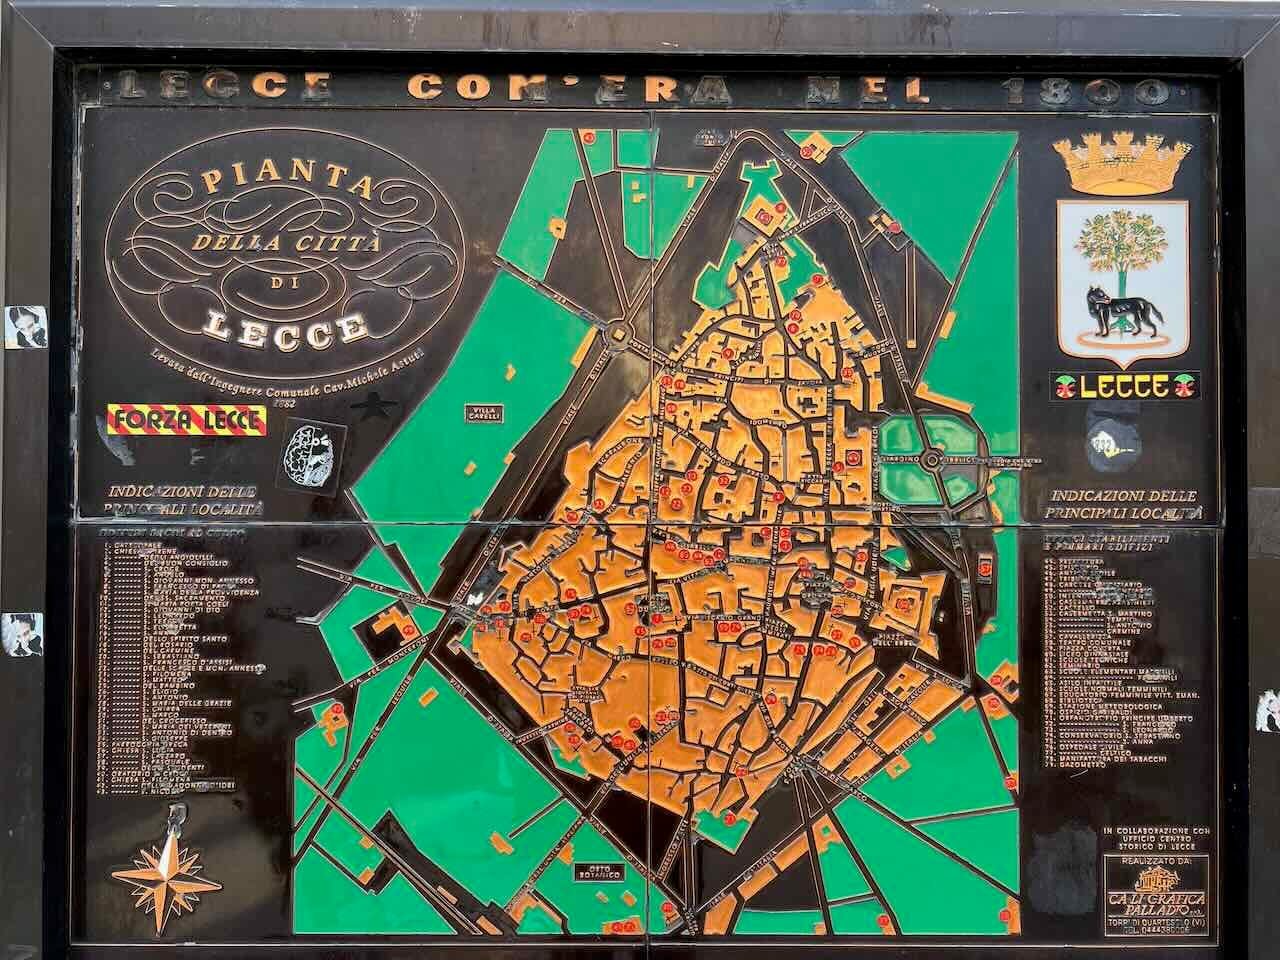

Lecce is in Italy’s southern Apulia region.
-
sur Camptocamp: France Becomes First Government to Endorse UN Open Source Principles, Now What?
Publié: 5 June 2025, 4:00am CEST
Pièce jointe: [télécharger]
In a historic and symbolic step, France has officially endorsed the United Nations' Open Source Principles, becoming the first government to do so, alongside many organizations including the Open Source Initiative, Linux Foundation and the Eclipse Foundation. -
sur Mappery: Polignano a Mare
Publié: 4 June 2025, 1:00pm CEST
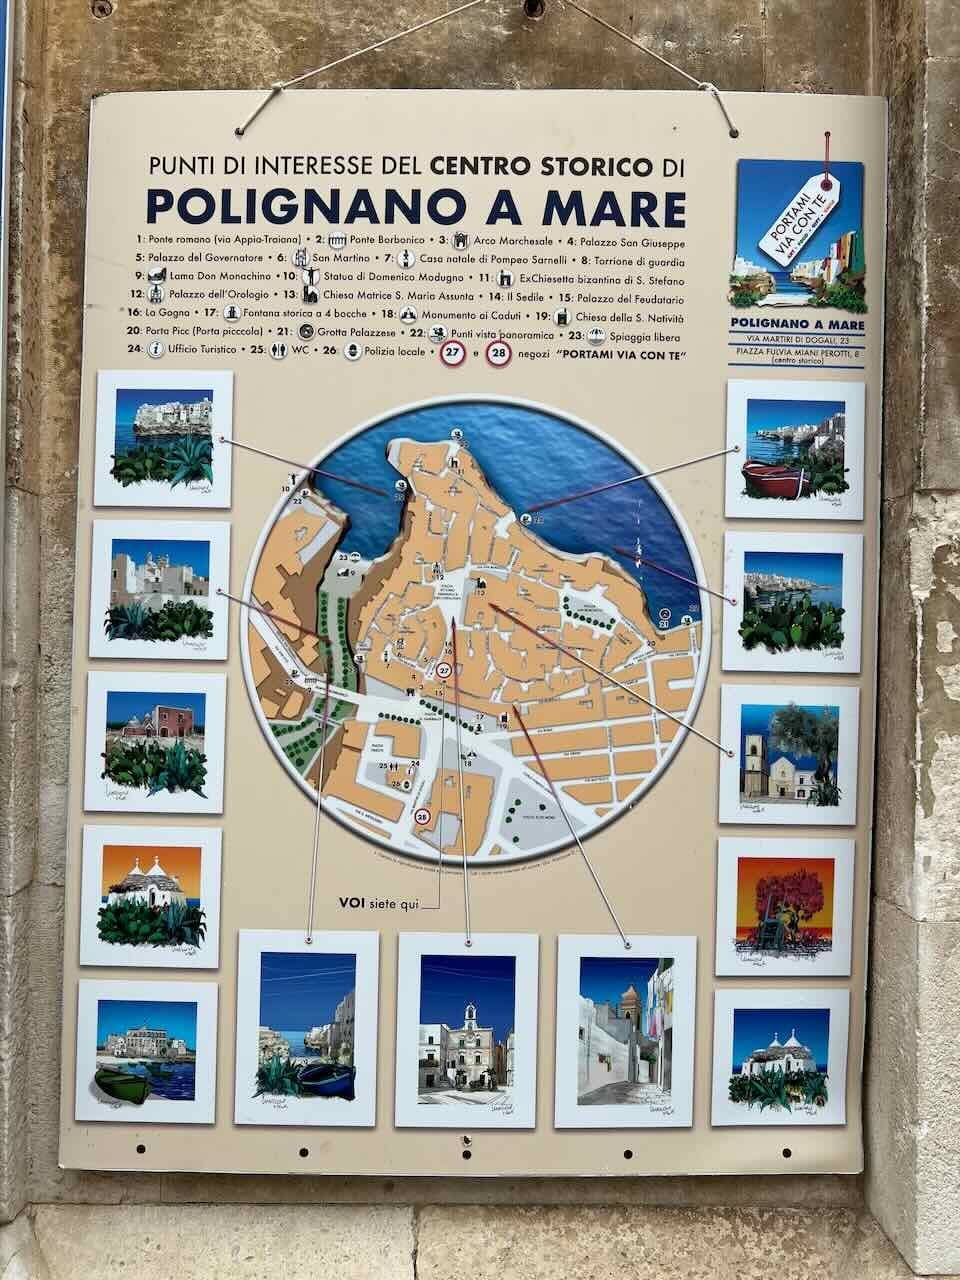

Fancy a visit to Puglia? Here is Polignano a Mare, Puglia, Italy.
-
sur FOSSGIS e.V. News: Vernetzungstreffen
Publié: 4 June 2025, 4:00am CEST
Vernetzungstreffen für Geoinformatiker:innen, FOSSGIS-Konferenz-Teilnehmende, Mitglieder und Interessierte in der FOSSGIS-CommunityEs begann mit einem Anruf einer Onlineteilnehmerin der FOSSGIS 2025, die ihre Begeisterung zur Konferenz zum Ausdruck brachte und nach Vernetzungsmöglichkeiten fragte. Die Idee ein Vernetzungstreffen online zu veranstalten, in dem sich die Teilnehmenden kennenlernen und austauschen, war im Raum.
Für den 04. Juni geplant, startete die Veranstaltung um 18 Uhr. Sieben Teilnehmende waren dabei, lernten sich kennen, erzählten woher sie kommen, womit die sie sich hinsichtlich FOSSGIS, Geoinformatik beschäftigen und suchten und fanden Kontaktpunkte. Oft ist es so, dass Geoinformatiker:innen in ihrer Institution die einzigen oder in einem sehr kleinen Team sind und deshalb den Austausch über die eigene Institution hinaus brauchen. Veranstaltungs- und Aktivitätenhinweise wurden dankbar angenommen.
Katja stellte den Verein und aktuelle Aktivitäten vor und stand für Fragen zur Verfügung.
Alle waren sich einig, dass diese Art Treffen sehr sinnvoll sind und fortgeführt werden sollten, um Interessierte Leute onzuboarden und Vernetzung zu ermöglichen. Auch Themen in Kleingruppen besprechen, wurde als gute Idee bestätigt.
Als Folgetermin ist der 10.09.025, wieder um 18 Uhr vereinbart.
Wiki: [https:]]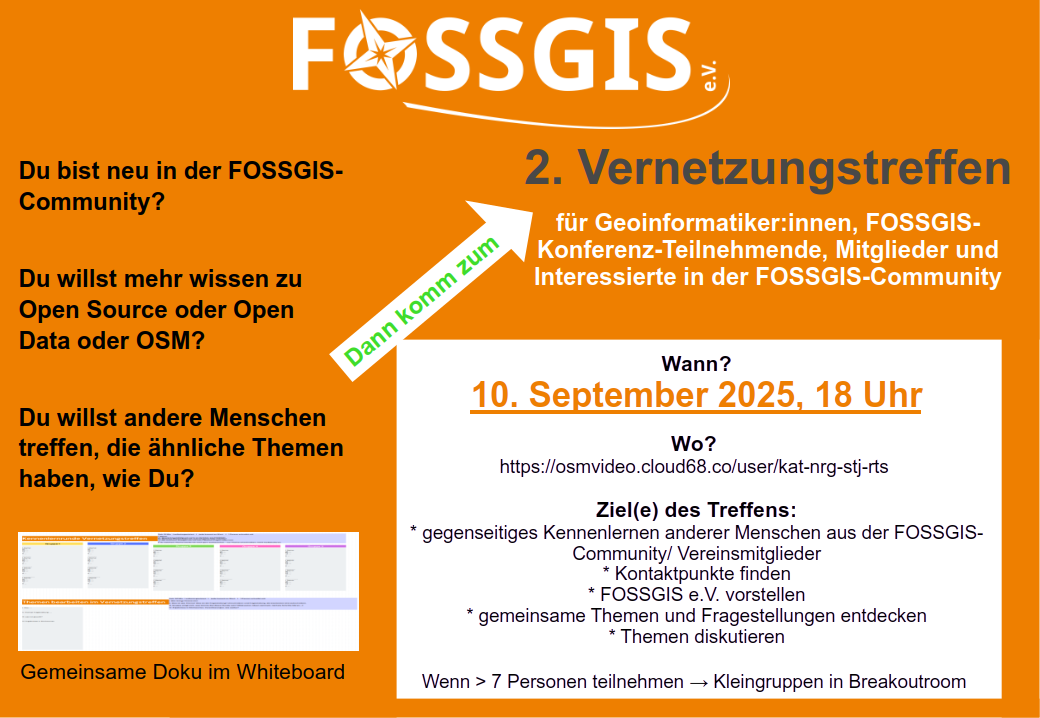
Ankündigung Vernetzungstreffen am 10.09.2025 mit Link zum Wiki -
sur Camptocamp: The AIS of Pas-de-Calais: a web application serving modern archaeology
Publié: 4 June 2025, 4:00am CEST
Pièce jointe: [télécharger]
Discover how the Pas-de-Calais Archaeological Information System (AIS) combines data integrity, UX design, and open-source innovation to support modern archaeological work in France. -
sur Sean Gillies: Bear training week 15 recap
Publié: 3 June 2025, 11:26pm CEST
My doctor convinced me to try a two week course of Naproxen and more PT before jumping into steroids. I'm following her advice and also sticking to low impact exercise. I did manage 115 minutes of comfortably hard treadmill running and elliptical pedaling in week 15, which was a big bump up from the previous week. Otherwise, my numbers continue to lack luster.
4.9 miles running
7 hours, 1 minute all training
0 ft D+ running
That 4.9 miles was on a treadmill at a 7% incline. That would have been 1,800 ft of elevation gain on an actual trail. And I went hard on the climbs on my one hilly bike ride.
Friday I felt fatigued. I attributed it to more hard workouts. Sunday I was definitely feeling sick. Sore throat, sinus congestion, headache. Today (Tuesday) I'm feeling 50% recovered from this cold. I hope to get some real exercise tomorrow.

A trailhead above a small reservoir, with a low ridge, and plains extending to the horizon in the background. Fort Collins' Pineridge Open Space.
-
sur Mappery: Trays from Peak District
Publié: 3 June 2025, 1:00pm CEST
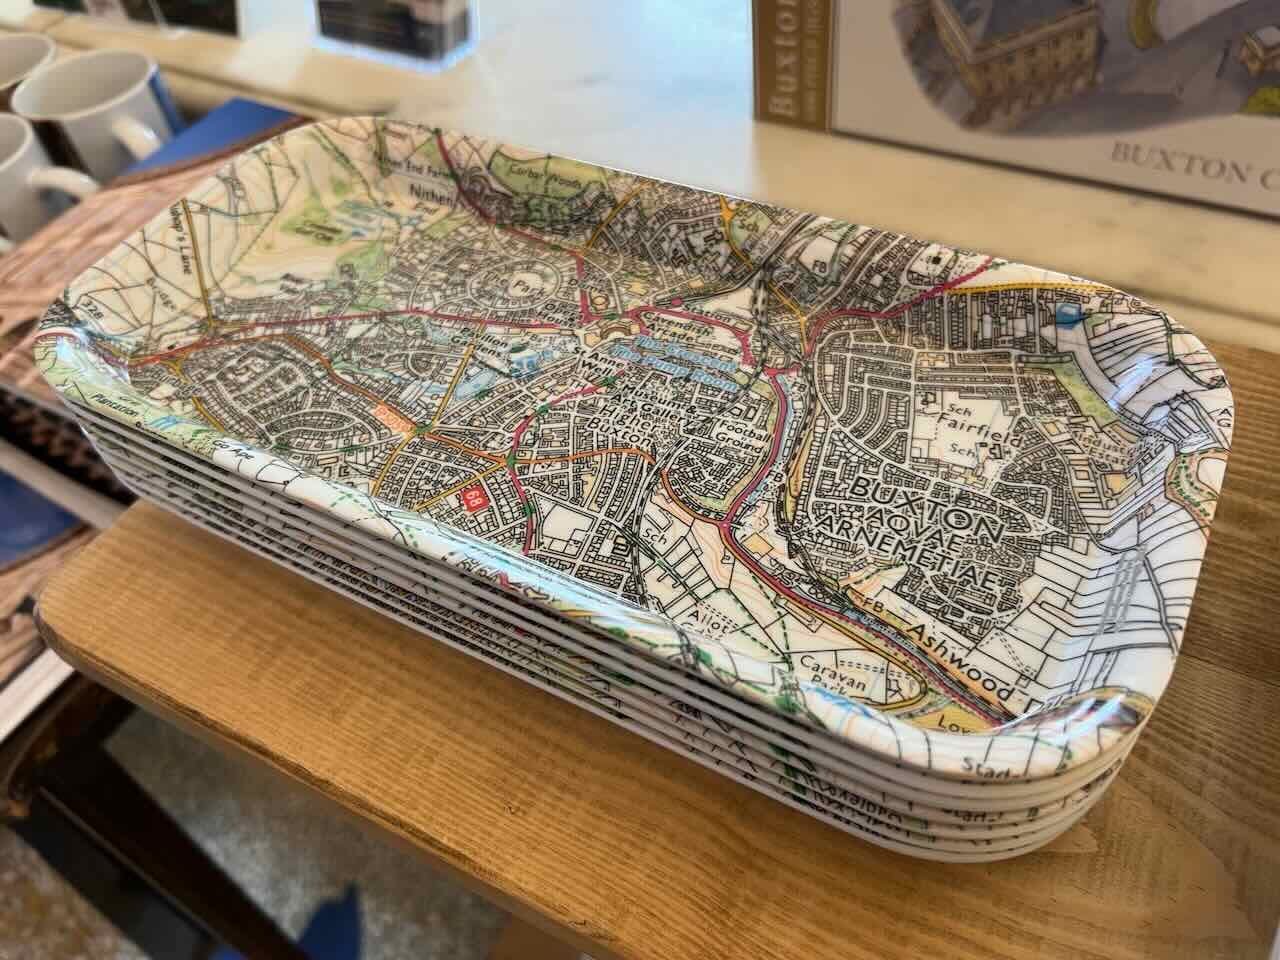


Trays as Peak District swag. I already have too many. One more?
-
sur OPENGIS.ch: QField 3.6 “Gondwana”: Locking on greatness
Publié: 3 June 2025, 11:46am CEST
Building on top of the last release which introduced background tracking, this development cycle focused on polishing functionalities and building on top of preexisting features. The variety of improvements is sure to make our diverse user base and community excited to upgrade to QField 3.6.
Main highlights
One of the most noticeable improvement in this version is the addition of “map preview rendering”. QField now renders partial map content immediately beyond the edge of the screen, offering a much nicer experience when panning around as well as zooming in and out. Long-time QGIS users will recognise the behaviour, and we’re delighted to bring this experience to the field
This upgrade was the foundation upon which we built the following enhancement: as of QField 3.6, using the “lock to position” mode now keeps your position at the very center of the screen while the canvas slips through smoothly. This greatly improves the usability of the function as your eyes never need to spend time locating the position within the screen: it’s dead center and it stays there!
Reminder, the “lock to position” mode is activated by clicking on the bottom-right positioning button, with the button’s background turning blue when the mode is activated.
The improvements did not stop there. Panning and zooming around used to drop users out of the lock mode immediately. While this had its upsides, it also meant that simple scale adjustments to try and view more of the map as it follows the position was not possible. With QField 3.6, the lock has been hardened. Moving the map around will temporarily disable the lock, with a visual countdown embedded within a toast message informs users of when the lock will return. An action button to terminate the lock is located within the toaster to permanently leave the mode.
Moving on to QFieldCloud, this cycle saw tons of improvements. To begin with, it is now possible to rely on shared datasets across multiple cloud projects. Known as localised data paths in QGIS, this functionality enables users to reduce storage usage by storing large datasets in QFieldCloud only once, serving multiple cloud projects, and also easing the maintenance of read-only datasets that require regular updates.

QFieldSync users will see a new checkbox when synchronising their projects, letting them upload shared datasets onto QFieldCloud.
Furthermore, QField has introduced a new cloud project details view to provide additional details on QFieldCloud-hosted projects before downloading them to devices. The new view includes a cloud project thumbnail, more space for richer description text, including interactive hyperlinks, and author details, as well as creation and data update timestamps. Finally, the view offers a QR code, which allows users to scan it quickly and access cloud projects, provided they have the necessary access permission. Distributing a public project has never been easier!
Beyond that, tons more has made its way into QField, including map layer notes viewable through a legend badge in the side dashboard, support for feature identification on online raster layers on compatible WMS and ArcGIS REST servers, atlas printing of a relationship’s child feature directly within the parent feature form, and much more. There’s something for everybody out there.
Focus on feature form polishingThis new version of QField coincides with the release of XLSForm Converter, a new QGIS plugin created by OPENGIS.ch’s very own ninjas. As its title implies, the plugin converts an XLSForm spreadsheet file (.xls, .xlsx, .ods) into a full-fledged QGIS project ready to be used in QField with a pre-configured survey layer matching the content of the provided XLSForm.
This was a golden opportunity to focus on polishing QField’s feature form. As a result, advanced functionalities such as data-driven editable flag and label attribute properties are now supported. In addition, tons of paper-cut bugs, visual inconsistencies, and UX shortcomings have been addressed. Our favourite one might just be the ability to drag the feature addition drawer’s header up and down to toggle its full-screen state

-
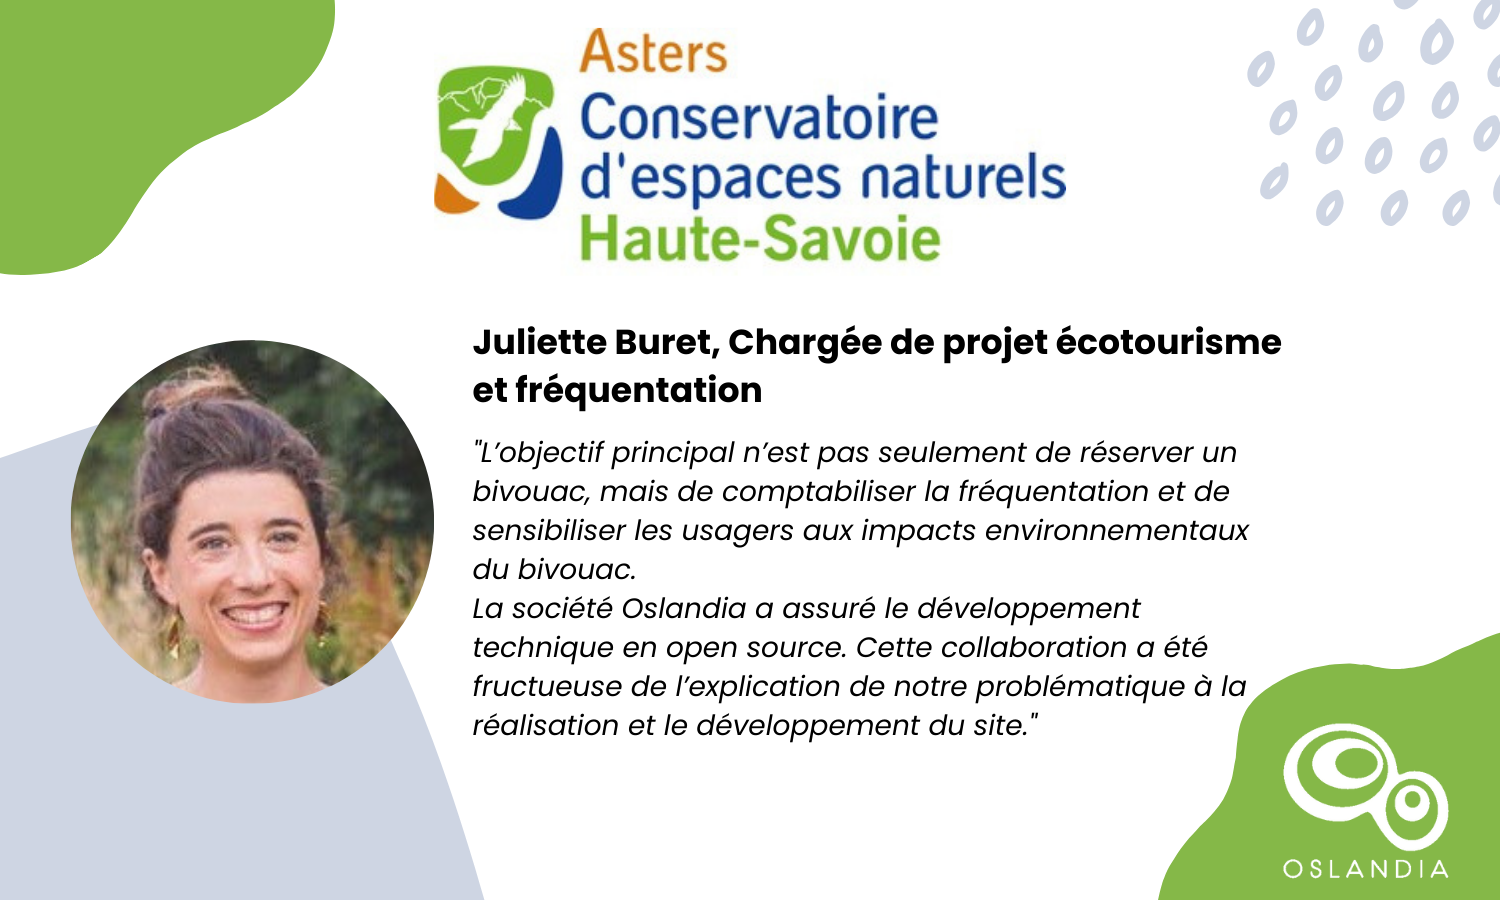
sur [Témoignage client] Juliette Buret, Chargée de projet écotourisme et fréquentation chez Asters- Conservatoire d’espaces naturels
Publié: 3 June 2025, 9:00am CEST par Caroline Chanlon
En 2024, Asters-CEN74 a lancé [https:]] , une plateforme de réservation en ligne pour encadrer le bivouac dans les réserves naturelles de Haute-Savoie.
À quels enjeux répond ce projet ?Ce projet répond à un besoin de gestion de la fréquentation en espaces naturels et accompagne les nouvelles réglementations interdisant ou limitant la pratique bivouac dans certaines zones.
La plateforme permet :
- de réserver un emplacement sur une carte,
- de visualiser les zones interdites,
- de remplir un questionnaire de sensibilisation aux bonnes pratiques.
L’objectif principal n’est pas seulement de réserver un bivouac, mais de comptabiliser la fréquentation et de sensibiliser les usagers aux impacts environnementaux du bivouac.
Comment s’est passée la collaboration avec Oslandia ?La société Oslandia a assuré le développement technique en open source. Cette collaboration a été fructueuse de l’explication de notre problématique à la réalisation et le développement du site.
Plus d’infos sur la plateforme dans le billet de Vincent Bré : [https:]]
Pour programmer votre bivouac, rendez-vous sur [https:]]
-
sur Mappery: Roman Empire
Publié: 2 June 2025, 1:00pm CEST
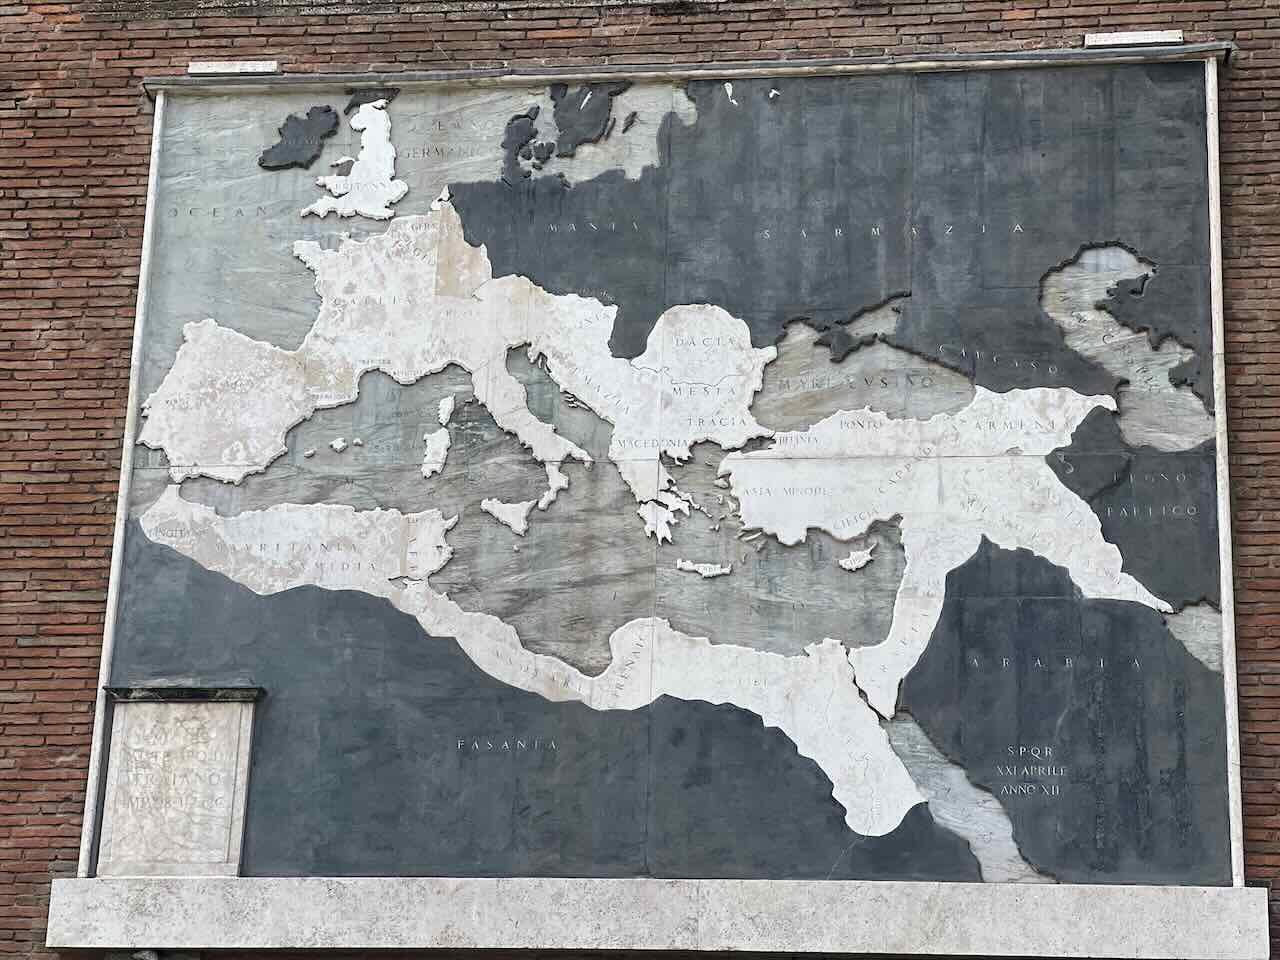


Spotted in Rome, Italy, next to the Colosseum
-
sur WhereGroup: Verarbeiten einer PointCloud (mit CloudCompare)
Publié: 2 June 2025, 12:00pm CEST
Wie funktioniert die Installation von CloudCompare und seine Verwendung für eine PointCoud – wir zeigen Ihnen step by step, wie’s fehlerfrei funktioniert. -
sur gvSIG Team: ? Última llamada: ¡Consulta el programa y asegura tu plaza en la Jornada IDE en la Administración Local!
Publié: 2 June 2025, 12:00pm CEST

El próximo 5 de junio, de 9:00 a 14:00 h, se celebrará en la Sala multiusos de La Harinera, en València Innovation Capital, La Jornada de Infraestructuras de Datos Espaciales en la Administración Local: Del Mapa a la Gestión. Este evento reunirá a diversos ayuntamientos que compartirán sus experiencias en la implementación de tecnologías libres para la gestión municipal.
 Programa de la jornada:
- 09:00 – 09:15: Bienvenida y presentación.
- 09:15 – 10:00: Bloque 1: Gestión y organización de la información territorial
Participan: Ayuntamiento de La Pobla de Vallbona, Ayuntamiento de Picassent. - 10:00 – 11:00: Bloque 2: Conectividad entre gvSIG Online y otras plataformas de gestión municipal
Participan: Ayuntamiento de Cullera, Ayuntamiento de Onda, Ayuntamiento de Cartagena. - 11:00 – 11:40: Pausa para café.
- 11:40 – 13:00: Bloque 3: Proyectos diversos de implantación de IDE en contextos municipales
Participan: Scolab, Ayuntamiento de Talavera, Ayuntamiento de Albacete. - 13:00 – 13:30: Novedades: Presentación de nuevas funcionalidades de la Suite gvSIG.
Mirada al futuro: Inteligencia artificial integrada en gvSIG Online. - 13:30 – 14:00: Cierre.
Este evento es una oportunidad única para conocer de primera mano cómo diferentes municipios están aplicando las Infraestructuras de Datos Espaciales para mejorar la gestión interna, facilitar el acceso ciudadano y conectar sistemas de información, utilizando herramientas de la Suite gvSIG.
 Modalidad de asistencia:
- Presencial: Aforo limitado. ¡Quedan pocas plazas disponibles!
- Streaming: Retransmisión en directo a través del canal de YouTube de gvSIG.
 Inscripción gratuita:
Para asistir, es necesario completar el formulario de inscripción disponible en el siguiente enlace:
No pierdas la oportunidad de participar en esta jornada y conocer las experiencias de otros ayuntamientos en la implementación de tecnologías libres para la gestión municipal.
¡Te esperamos el 5 de junio en València!
-
sur OPENGIS.ch: XLSForm Converter: unlock a world of surveys with our brand new QGIS plugin
Publié: 2 June 2025, 8:57am CEST
Today marks the initial release of our brand-new QGIS plugin, XLSForm Converter.
As the name suggests, the plugin converts XLSForm survey files into ready-to-use QGIS projects with a preconfigured survey attribute form.Migrating to QField was never easier!
 The converted survey form as displayed on QGIS (left) and QField (right)
Even more exciting is that the converted QGIS project includes all the necessary settings for use with QField, thanks to a nifty QFieldCloud integration. With just a single checkbox, you can upload your generated project to the cloud and begin gathering data—either as a standalone surveyor or collaboratively as part of a team.
We believe this provides a fantastic solution for organisations and groups familiar with XLSForm—or already working with templates—who want to leverage QGIS-powered QField to conduct spatial surveys.
Plugin highlightsThe plugin adds an algorithm to QGIS’ processing toolbox that converts a XLSForm file – Microsoft Excel’s .xls or .xlsx as well as LibreOffice Calc’s .ods – into a QGIS project containing a main survey layer and a basemap.
 The XLSForm Converter’s algorithm dialog
The layer’s geometry type will reflect the first geometry-driven question type found in the XLSForm, namely a point geometry for geopoint, a line geometry for geotrace, or a polygon geometry for geoshape.
For XLSForm repeat blocks, the algorithm generates additional layers and configures parent-child relationships to bind them to the main survey layer. These layers are hidden from the layer tree by default, keeping the project simple and user-friendly—even for users unfamiliar with QGIS.
For questions that capture media content—such as photographs, videos, and audio clips—the converter sets up the project so users can easily record them in QField with a single tap.
Pro tip: Since the converter is an algorithm, you can use it to build complex, model-driven survey projects via the QGIS Processing Modeler. You can also run conversions in headless environments using
QFieldCloud-facilitated deployment to QFieldqgis_process. The possibilities are endless!As mentioned earlier, the converted project can immediately be used in QField to conduct surveying. The best way to deploy these projects to your QField-running devices is via QFieldCloud. The algorithm comes with a parameter that – when checked – will automatically upload the generated project to QFieldCloud.
That functionality requires the QFieldSync plugin to be installed and enabled in QGIS. Just log in to your QFieldCloud account via QFieldSync, and let the algorithm take care of the rest. It’s magical! If you haven’t yet tried QFieldCloud, this might be a good time to do so by signing up for a free community account.
Of course, you’ll always be able to copy these projects manually onto devices via USB cable or the numerous file import options available in QField.
XLSForm-what?XLSForm is a form standard designed to simplify the authoring of forms using spreadsheet programs like LibreOffice Calc or Microsoft Excel. They are simple to get started with and allow for the authoring of complex forms in no time. The syntax is beginner-friendly, and the building of surveys by adding rows onto a spreadsheet is surprisingly intuitive.
The standard has been widely adopted across various sectors, including public health, humanitarian relief, disaster response, local governance, and non-profit organisations.
Over here at OPENGIS.ch, we believe this plugin can be instrumental to preexisting operations and projects interested in migrating to a QField surveying environment where spatial considerations are front and center. If you are interested in discussing this further, do not hesitate to contact us.
-
sur Mappery: Queen’s Park
Publié: 1 June 2025, 1:00pm CEST
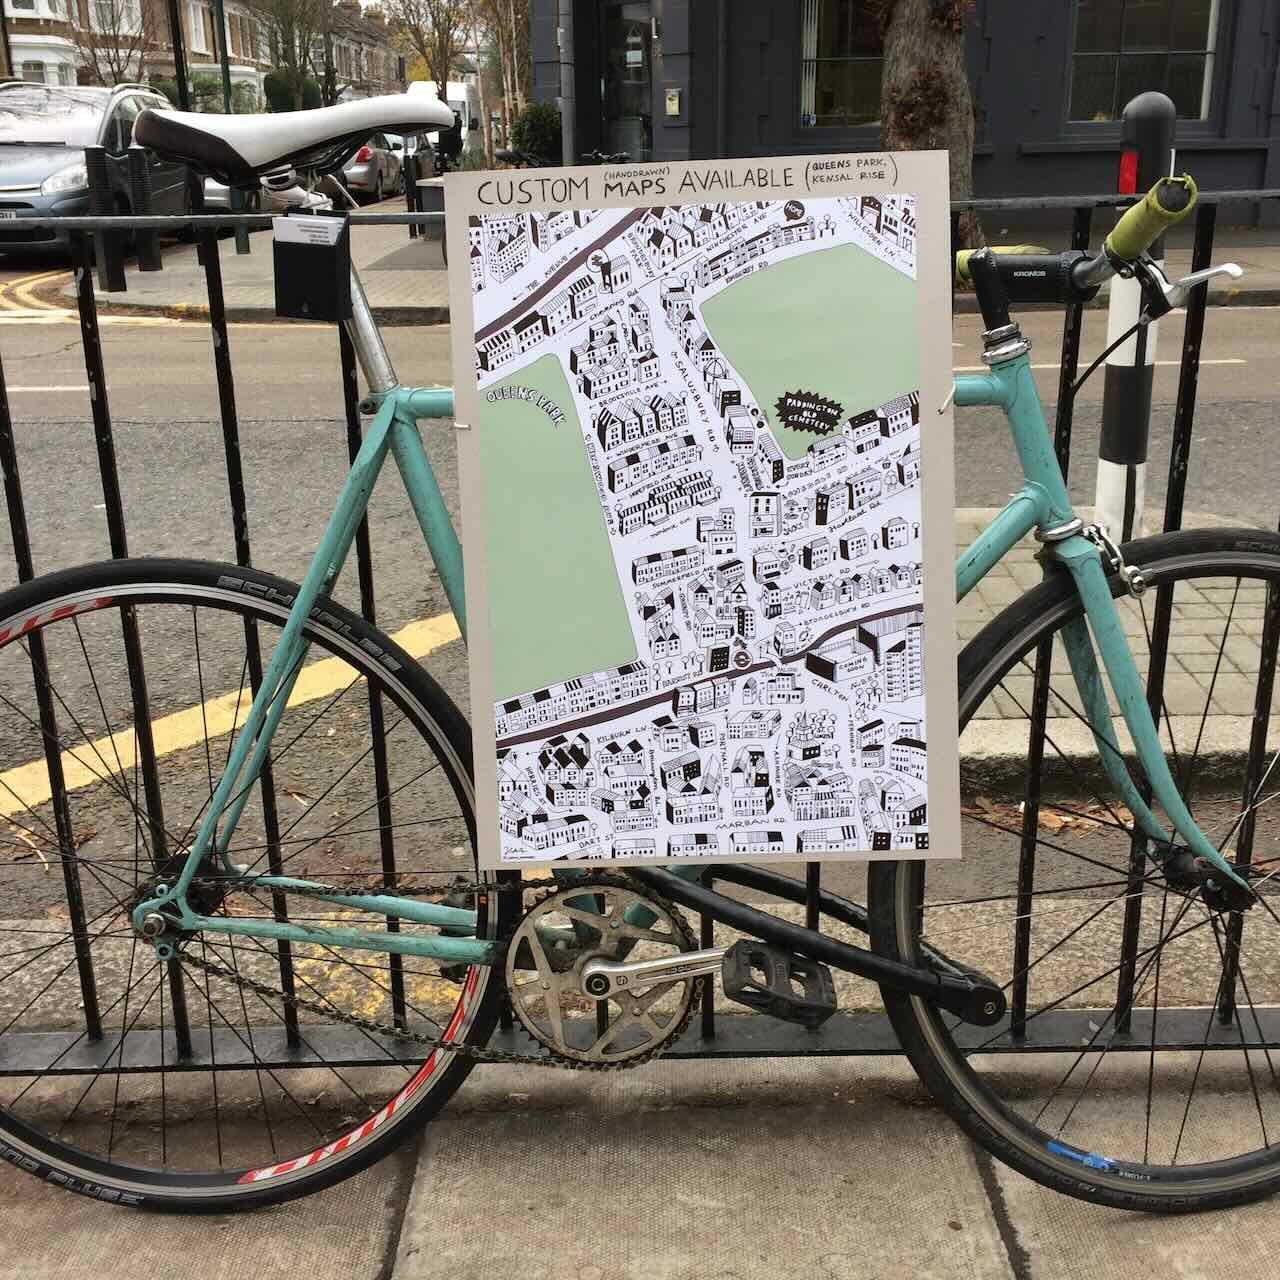

Spotted outside the Queen’s Park Farmers’ Market, London.
-
sur Mappery: Iron Israel
Publié: 31 May 2025, 1:00pm CEST


I was sitting near the entrance to the Carmel Market (shuk) in Tel Aviv and I spotted this map of Israel made out of iron plates. Felt significant to me but I understand others won’t agree.

-
sur Mappery: A Musical Globe in Delhi
Publié: 30 May 2025, 1:00pm CEST

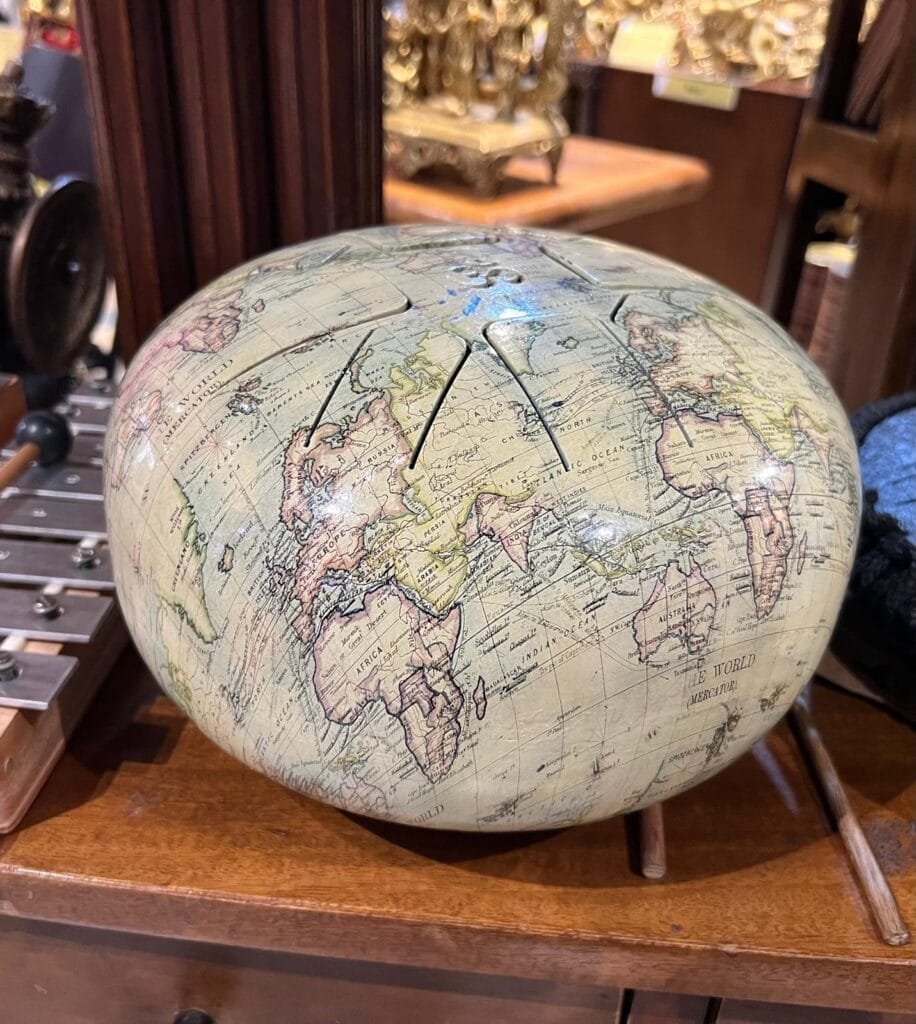
Elizabeth spotted this in Delhi, apparently it is some kind of musical instrument. It looks a bit like a cross between a drum and a xylophone, if anyone knows better please correct me in the comments.
-
sur Mergin Maps: [Blog] New API tools give you more user management options!
Publié: 30 May 2025, 4:00am CEST
Enhance user management in Mergin Maps with the Python API: automate user creation, manage roles, and integrate processes seamlessly. -
sur SIG Libre Uruguay: Sistema de información geográfica Montevimap
Publié: 29 May 2025, 4:45pm CEST
«Montevimap se renueva y mejora el acceso a la información territorial disponible para la generación de políticas públicas e investigación, así como para consulta por parte de la ciudadanía.»
[https:]] -
sur OPENGIS.ch: 1 Million Downloads: QField’s Big Milestone
Publié: 29 May 2025, 4:16pm CEST
 QField has officially hit 1 million downloads – thanks to you!
Let’s not beat around the bush: QField has hit 1+ million downloads. What started as an ambitious open-source project has transformed into a global tool that’s changing how professionals collect spatial data in the field. This big milestone is the result of years of dedication, with over 50,000 hours invested by our team. Our GeoNinjas contributed 14% of QGIS, while also driving open-source projects like ModelBaker and SwissLocator.Thank you for making GIS nerds the unsung heroes of fieldwork everywhere. Here’s to changing the world, one field at a time!
 GET QFIELD NOW
From Switzerland to the world!
GET QFIELD NOW
From Switzerland to the world!
Born in the Swiss Alps, raised by open-source, and now roaming the globe, QField has gone international! What started in Switzerland is now in the hands of field mappers, researchers, and GIS pros on six continents. Thank you for taking QField worldwide!

 Mapping the world one field at a time.
The numbers tell a story
Mapping the world one field at a time.
The numbers tell a story 
One million downloads might sound like just a number, but for us, it represents something much bigger. It’s 1’000’000 times someone chose an innovative, flexible mobile mapping solution. It’s 1’000’000 instances of fieldwork made easier, more efficient, and more accurate.
From humble beginnings to over 1 million downloads, QField has officially gone from “little app that could” to “open-source overachiever.” Thanks to the power of open source (and probably some caffeine).

QField has hit 1 million downloads in over 150 countries.
QField’s top user countries
QField’s passport is full!
We’re blown away by how far our geospatial tool has travelled: from mountaintops to city blocks, you’re mapping it all. Our amazing global user community is making QField a true #DigitalPublicGood. A map made in heaven! 
Mapping knows no borders, just like QField’s growing community.
 More than just an app
This cross-platform flexibility helps professionals collect GIS data anywhere, anytime. QField goes wherever you do. Android? Check. iOS? Check. Desktop? Check. If it has a screen, we’re probably on it. Collect GIS data anywhere, anytime.

QField isn’t just software, it’s a community-driven project that turns complex geospatial challenges into precise, actionable data. Every download represents a connection to our core mission: making professional-grade mobile GIS accessible, reliable, and straightforward.
QField’s Journey: Mapping our milestones
Our roadmap is packed with milestones and highlights that will continue to push the boundaries of mobile GIS.
 QField to QFieldCloud
You can play a key role in the sustainable growth of QField, the open-source digital good. Your support can take many forms, like contributing… or:


This not only streamlines and enhances your fieldwork but also gives you access to the full QField ecosystem with all its advantages. At the same time, you directly contribute to the continuous improvement of QField, ensuring its impact grows for everyone.
SUPPORT US
-
sur Mappery: Living with Dragons in South Africa – Metal Map
Publié: 29 May 2025, 1:00pm CEST


Gregory spotted this towering metal map within a service station, showing the network of major roads. Just to show how large it is here is Gregory, who happens to be wearing a strangely projected map t-shirt.

That’s the end of our little series of Gregory’s pictures from his visit to South Africa, we look forward to his next big trip “Living with Dragons in ….”
Thanks Gregory
-
sur SIG Libre Uruguay: gvSIG y el Museo del Prado
Publié: 28 May 2025, 9:27pm CEST
-
sur gvSIG Team: El Plano de Toledo del Greco, elaborado con gvSIG, en el Museo del Prado
Publié: 28 May 2025, 7:11pm CEST

Hoy he recibido una llamada que me ha emocionado. Era Cesáreo Bas Vivancos, ya jubilado tras muchos años de docencia en la Universidad Miguel Hernández. En las 11as Jornadas Internacionales de gvSIG, realizadas en 2015, presentó el excelente trabajo llevado a cabo para disponer de una nueva edición del plano de Toledo, elaborado por el Greco, digitalizada y que pudiera estar disponible para todo el mundo.
Cesáreo, decía, me llama para contarme que en el Museo del Prado, en la Galería Central del edificio Villanueva se reúnen, por primera vez desde su dispersión, ocho de las nueve obras que el Greco realizó para la iglesia del Monasterio de Santo Domingo el Antiguo de Toledo. Y que ahí está el Plano de Toledo, el elaborado con gvSIG. En el Museo del Prado.
-
sur Mappery: Living with Dragons in South Africa – Sightings Map
Publié: 28 May 2025, 1:00pm CEST
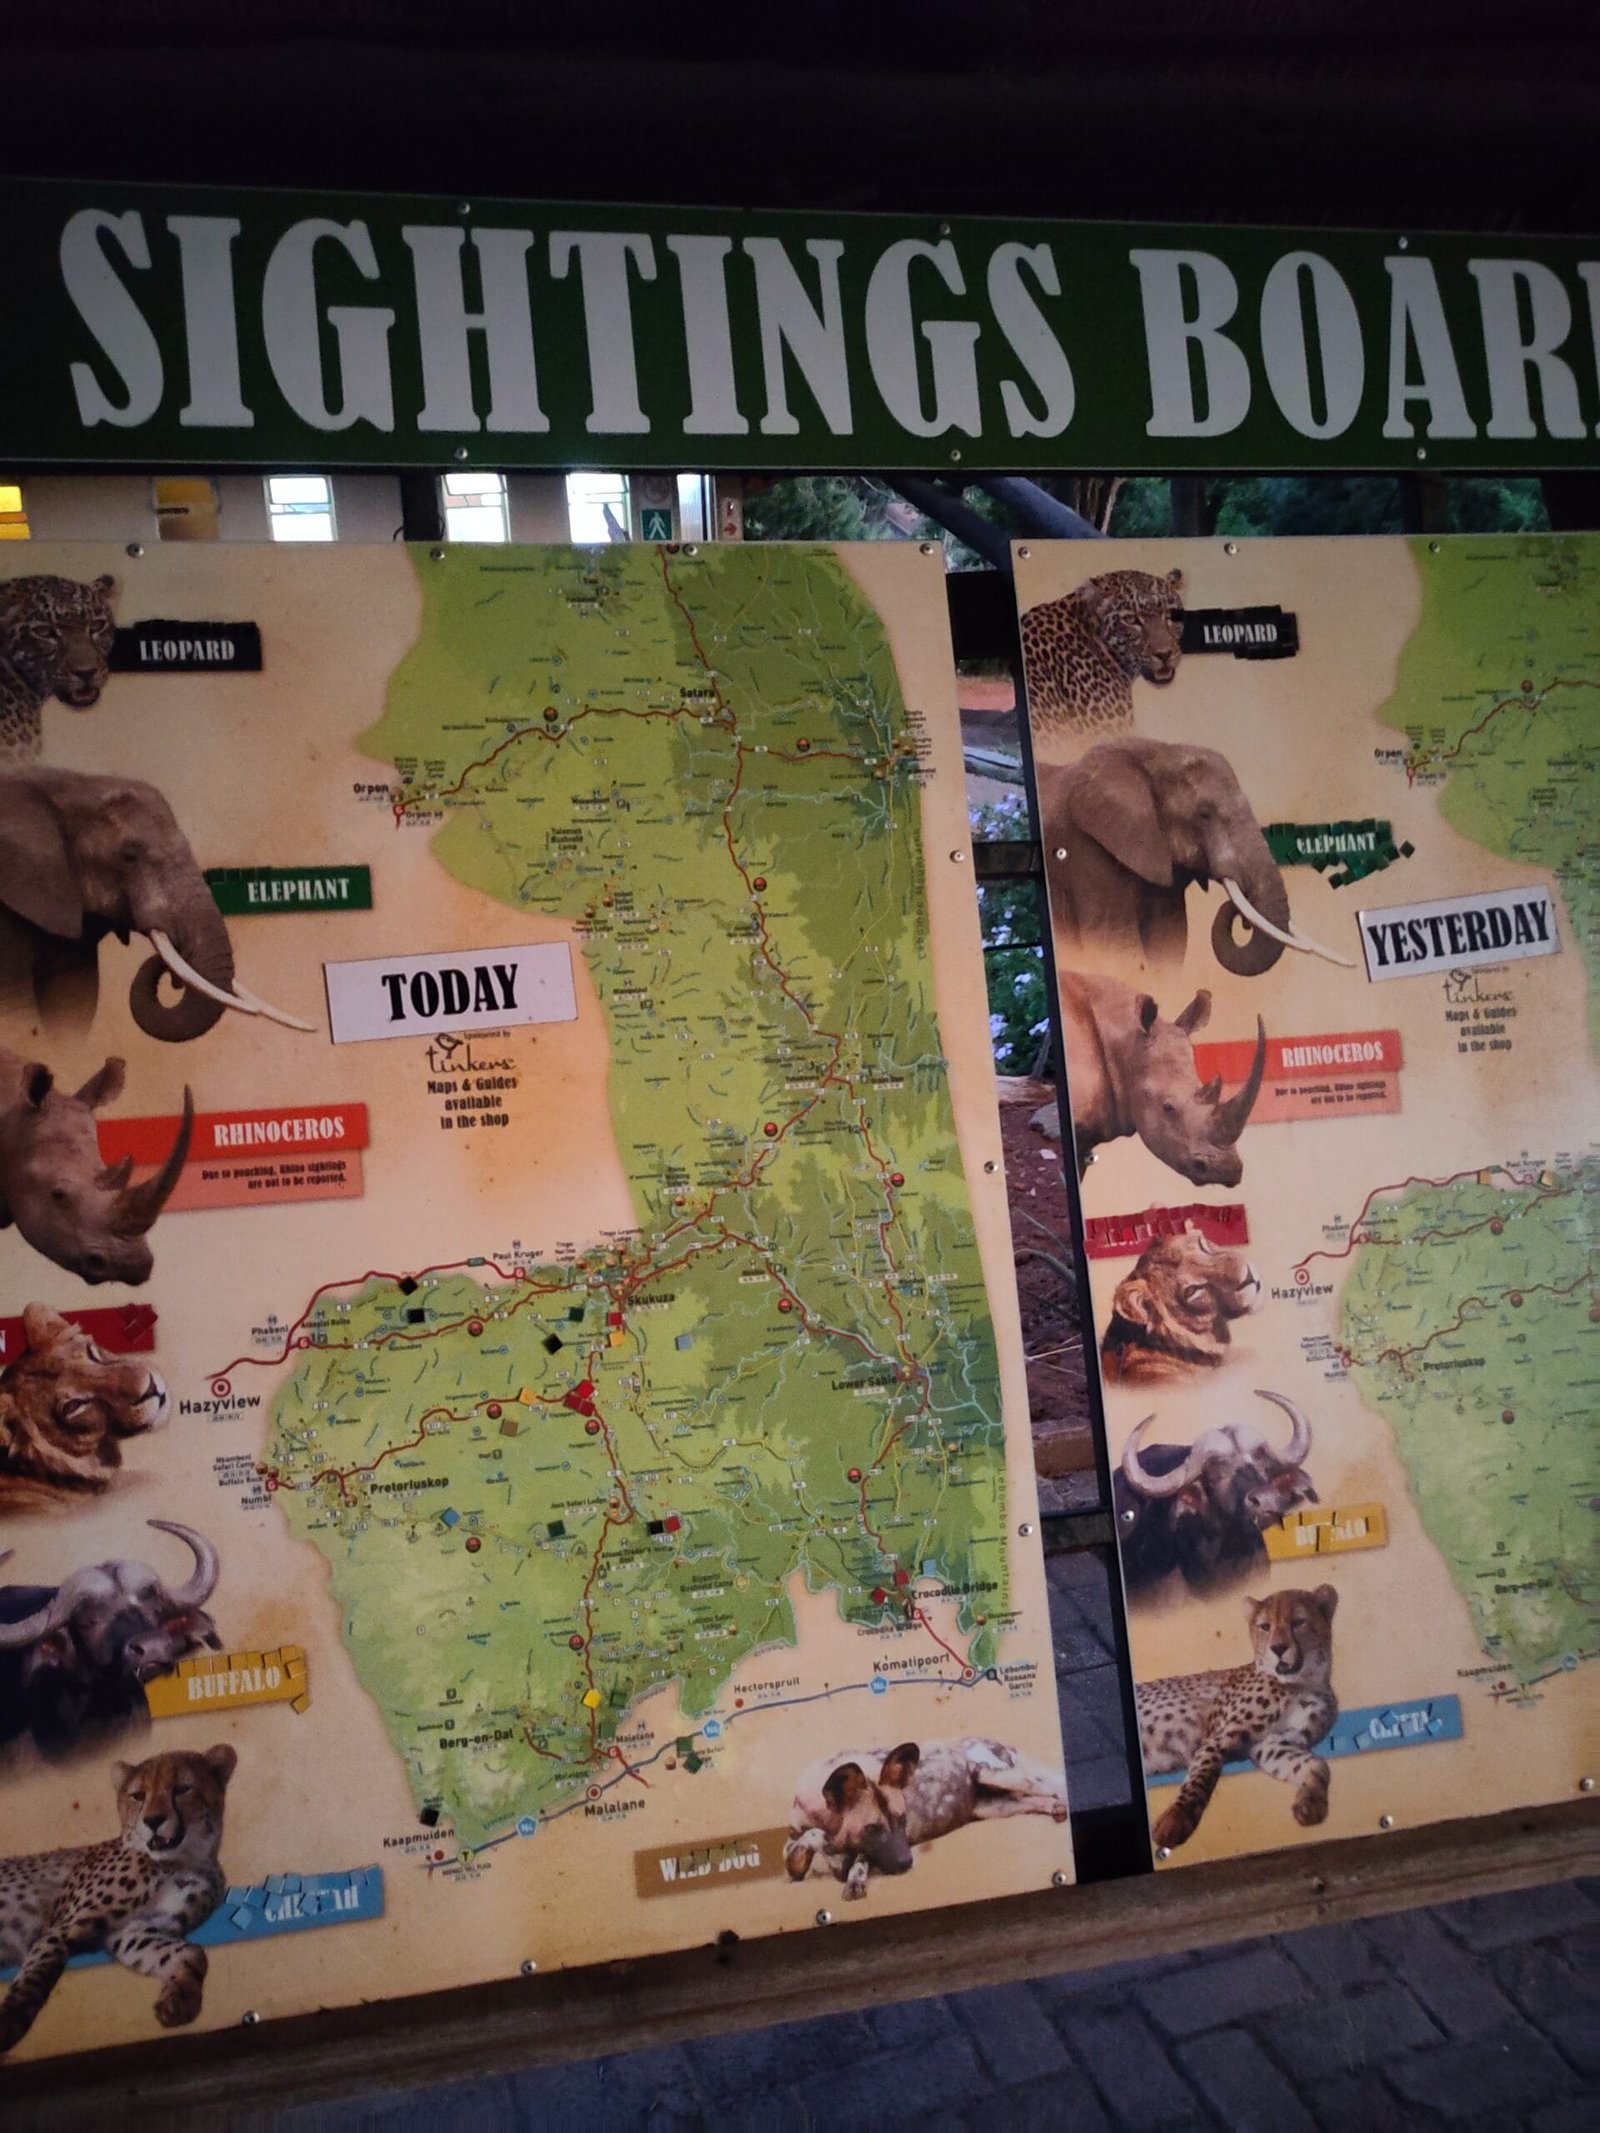

The Sightings board at Kruger National Park. Markers for Rhinos are removed so that poachers don’t get that information.
-
sur FOSSGIS e.V. News: Bericht vom FOSSGIS-OSM-Communitytreffen Nr. 23 - Mai 2025
Publié: 28 May 2025, 4:00am CEST
Vom 16. - 18. Mai 2025 haben sich 23 FOSSGIS- und OpenStreetMap-Begeisterte zum Arbeitstreffen im Linuxhotel getroffen.
Das Treffen begann am Freitagabend mit dem traditionellen Pizzaesssen.
Wie auch schon beim vorigen Treffen gab es nach dem Frühstück am Samstag und Sonntag eine kurze Session, in der zu besprechende Themen gesammelt und ein Zeitplan für den Tag erarbeitet wurden. So lief auch dieses Treffen wieder sehr strukturiert und effizent ab.Diskutiert wurden Themen zur FOSSGIS- und OpenStreetMap-Community wie Öffentlichkeitsarbeit, Präsenz auf Messen, Beitrag von FOSSGIS und OSM zur digitalen Souveränität, Vor- und Nachbereitung der FOSSGIS-Konferenz und vieles mehr. Auch technische Themen kamen nicht zu kurz, so wurde über Möglichkeiten gesprochen, GPS-Korrektursignale über SSRoverDAB+ mittels low-cost-Hardware zu empfangen, was zentimetergenaue Satellitenpostionsdaten für die breite OSM-Community verfügbar machen könnte. Ein weiteres Thema war das Model Context Protocol (MCP), das die Integration von Künstlicher Intelligenz mit externen Tools und Datenquellen ermöglicht. Damit könnten einerseits die OSM-Daten leichter und effizienter genutzt werden. Andererseits könnte das jedoch auch KI-generierte Edits möglich machen, die von denen echter User kaum zu unterscheiden wären. Letzteres könnte tiefgreifende Konsequenzen für die OSM-Community haben, dieses Thema bietet sicher auf zukünftigen Treffen reichlich Diskussionsstoff.
Die Teilnehmenden schauen auf ein angenehmes, produktives Treffen mit großartigen Teilnehmer:innen, die nicht nur tolle inhaltlche Beiträge lieferten, sondern auch bei der Organisation kräftig mit anpackten, zurück. Besonderer Dank gilt Katja, Marc und Jochen für die hervorragende Moderation der Sessions und dem Versorgungsteam für die Verköstigung. Und ohne die fantastische Unterstützung des Linuxhotels wäre auch dieses Treffen nicht möglich gewesen.
Die umfangreichen Ergebnisse der Besprechungen sind auf der Wiki-Seite des Treffens festgehalten. Selbstvertsändlich konnten Teilnehmehmende auch bei diesem Treffen weiter an ihren Projekten arbeiten: [https:]]
Das nächste FOSSGIS-OSM-Communitytreffen findet vom 19.09.-21.09.2025 im Linuxhotel statt: [https:]]
Fotoeindrücke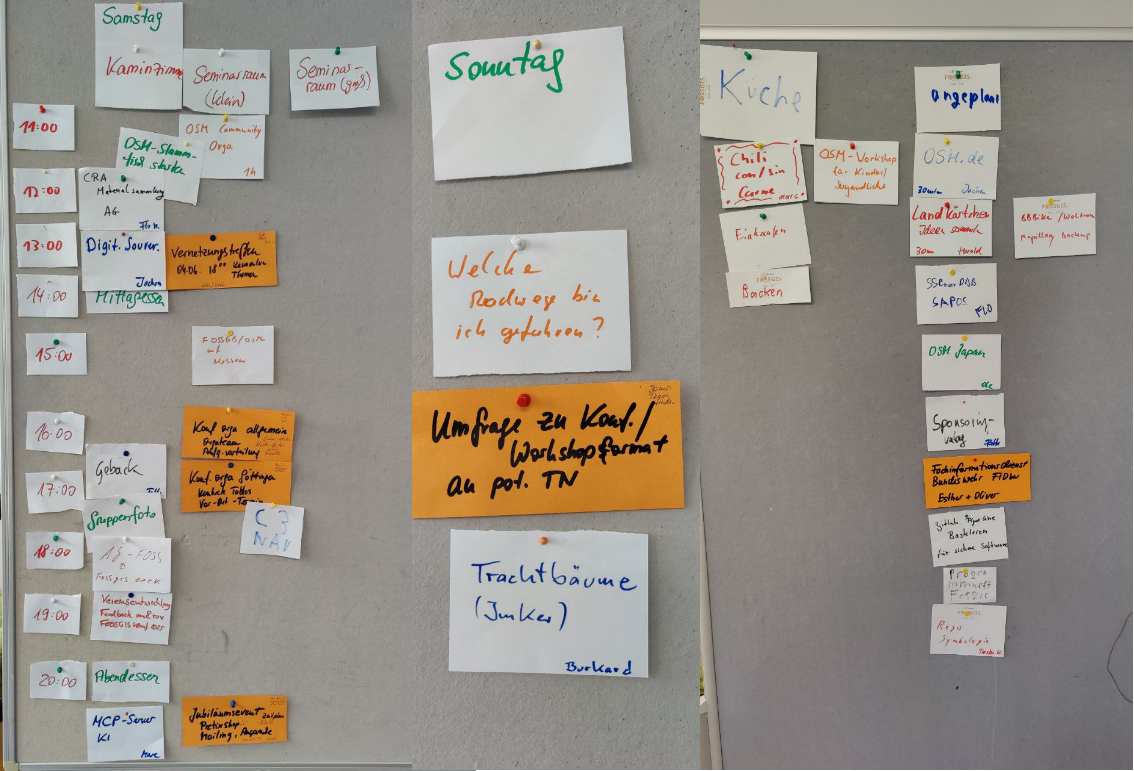
Themensammlung und Zeitplan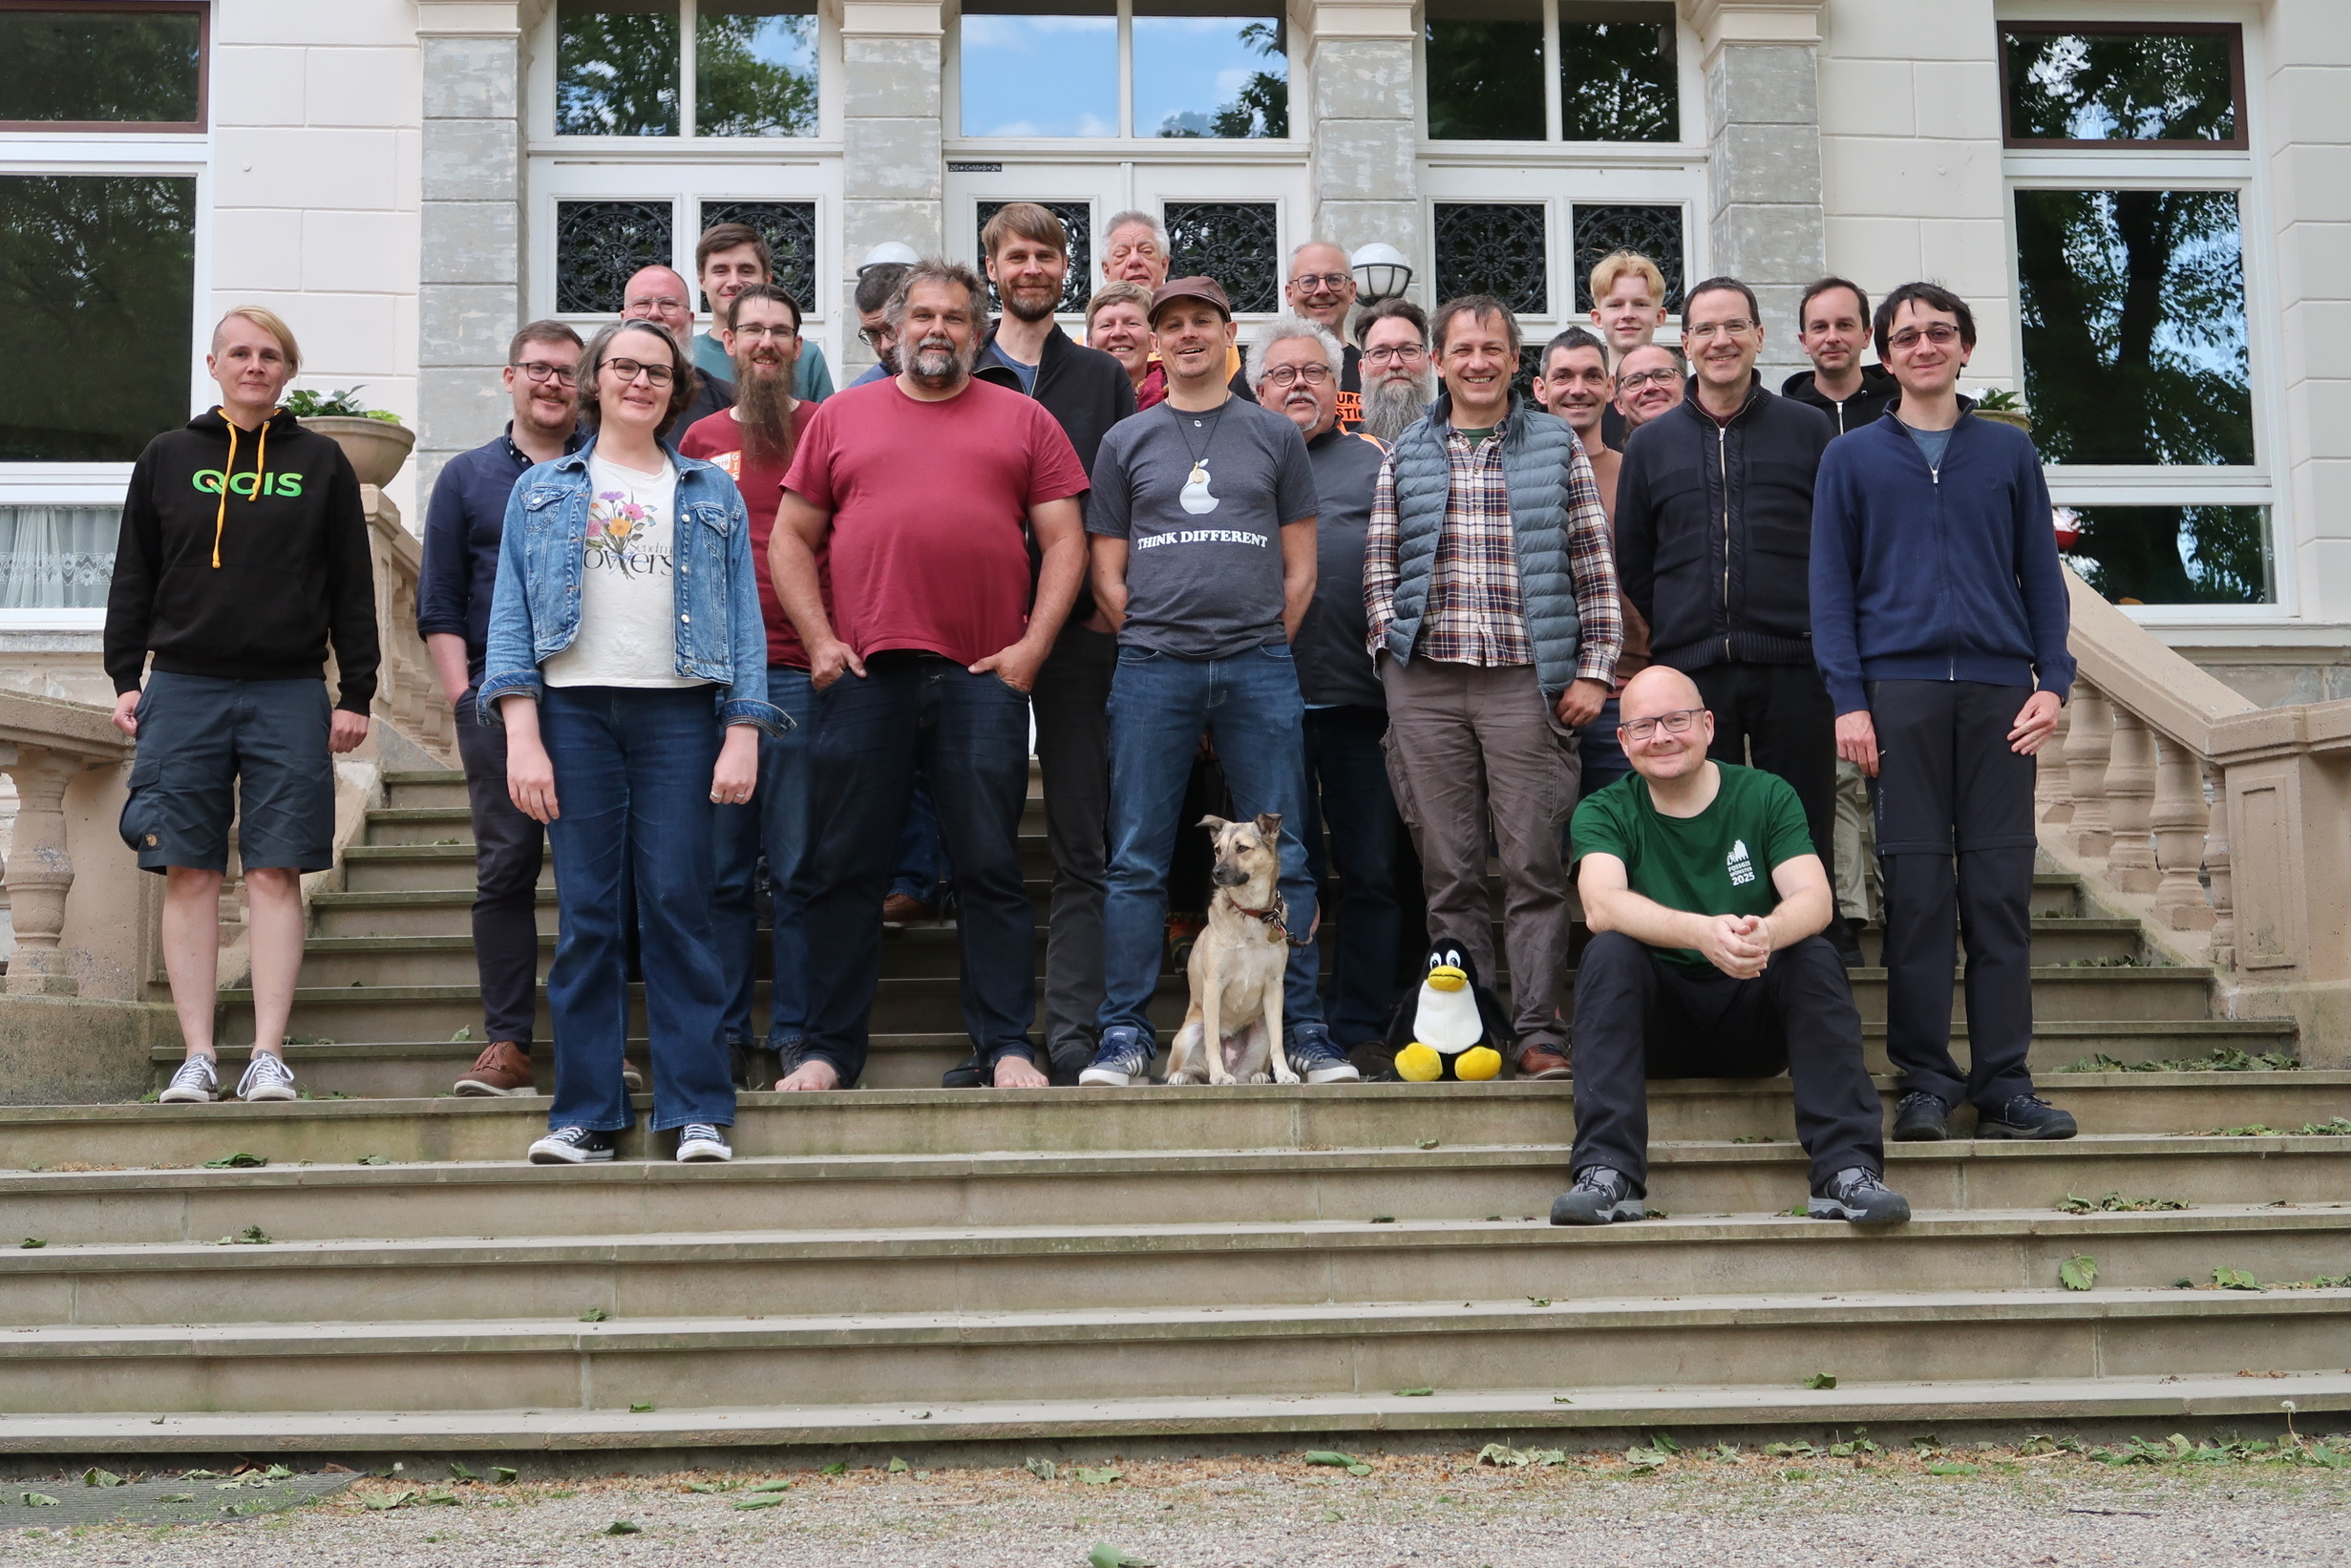
Gruppenfoto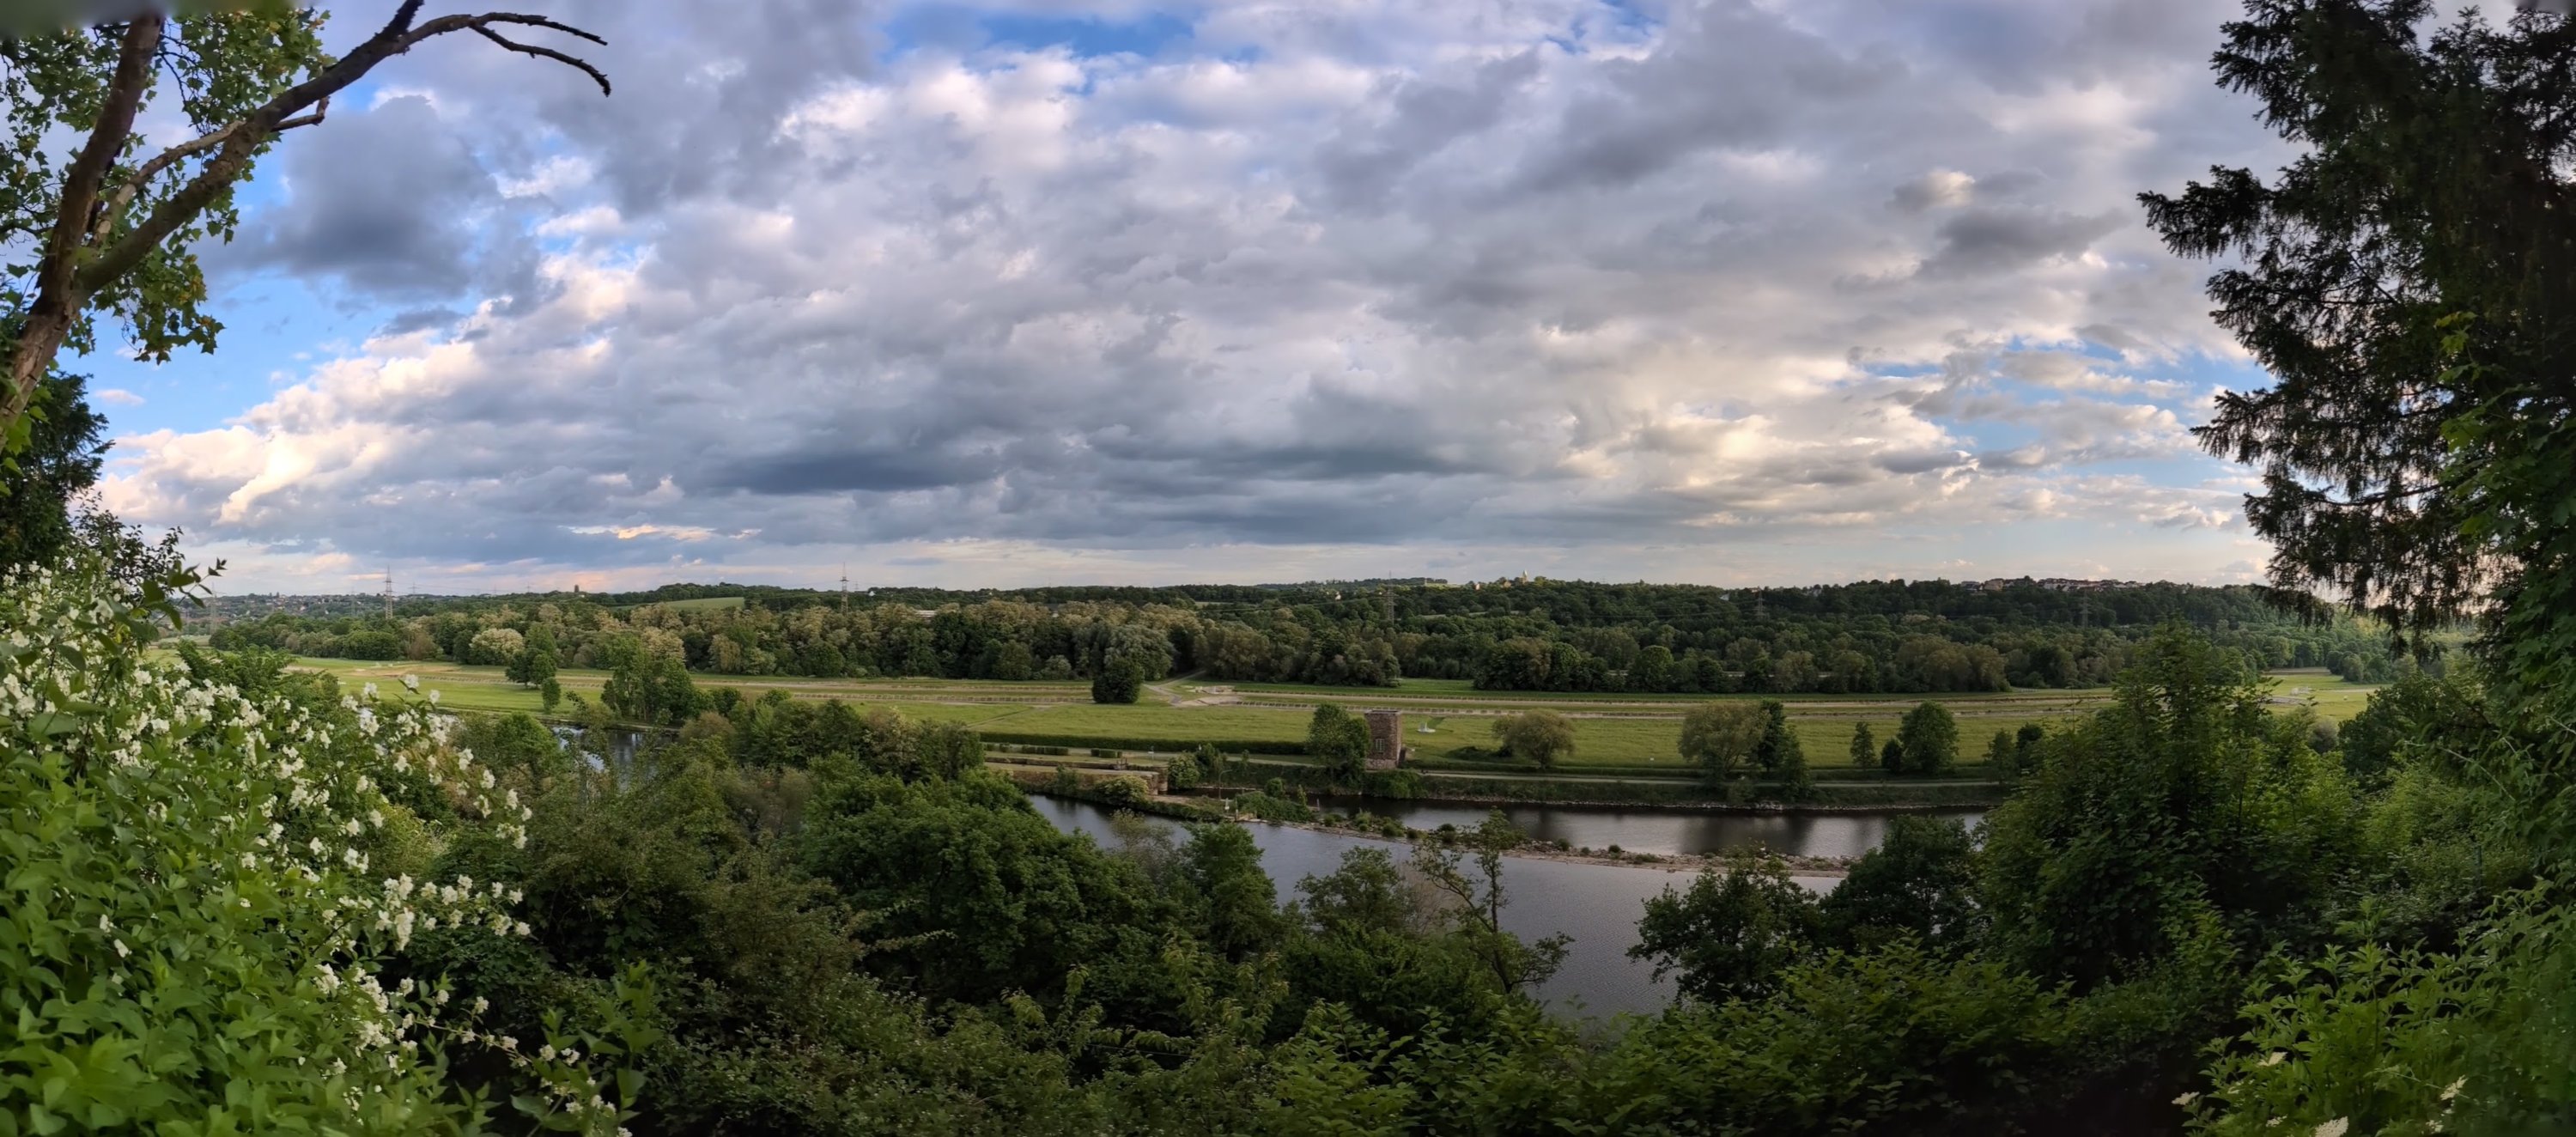
Frühlingshafter Panoramablick auf die Ruhr hinter dem Linuxhotel -
sur OPENGIS.ch: QGIS & Industry Solutions Developer | 80 – 100% (Remote)
Publié: 28 May 2025, 3:58am CEST
Location: Remote, preferably in Switzerland or with at least 4 h overlap with CEST office hours
Employment Type: Full-time (80-100%)

About OPENGIS.ch:
OPENGIS.ch is a dynamic team of Full-Stack GeoNinjas delivering tailored open-source geodata solutions to Swiss and international clients. We are passionate about using and developing open-source tools, providing flexibility, scalability, and future-proof solutions, and we play an active role in the open-source geospatial community. Our agile, distributed team thrives on collaboration, diversity, and mutual support.
Job Description:
We are looking for a skilled and motivated C++ and Python Developer to join our industry solutions team. In this role, you will contribute to QGIS core development (C++), build QGIS plugins (Python), and deliver custom solutions for our clients. You’ll help design, develop, and maintain robust applications that address real-world geospatial challenges. If you enjoy working in a collaborative, client-focused environment and value code quality, we’d love to meet you!
Key Responsibilities:
- Develop, test, and maintain QGIS and related applications using C++, Python, PostgreSQL, and other technologies.
- Collaborate with cross-functional teams to design and deliver new features.
- Ensure application quality, stability, and maintainability.
- Troubleshoot, identify, and resolve bottlenecks and bugs.
- Contribute to code quality, organisation, and automation through CI/CD best practices.
- Optionally, engage directly with clients to understand and address their needs.
Your Profile:
- Strong experience with C++, Python, and SQL.
- Proficient in desktop application development (Qt is an advantage).
- Experience with Linux, Docker (Compose), Git, CI/CD, PostgreSQL, and REST APIs.
- Familiarity with geospatial concepts and web GIS is a plus; training will be provided if needed.
- Solid understanding of software deployment, containerization, and continuous integration.
- Excellent problem-solving skills and ability to work independently.
- Collaborative mindset and good communication skills.
- Fluent in English; knowledge of German, French, or Italian is a significant advantage.
- Living in Switzerland is an advantage.
Application Questions:
- What is your experience with software development and C++ APIs?
- Can you describe a project where you used Python, maybe to interact with REST APIs?
- What is your experience or familiarity with geospatial concepts, tools, or data formats?
- What is the most recent thing you learned out of personal interest?
How to Apply:
If you are excited about this opportunity and meet the qualifications, please apply at opengis.ch/jobs
Join OPENGIS.ch and help us shape the future of open-source geospatial solutions!

-
sur Mappery: Living with Dragons in South Africa – Cape Town Contours
Publié: 27 May 2025, 1:00pm CEST


Gregory said “The contour letters in Cape Town – I don’t know if that counts as a map, but each one was a specific local mountain” Yes, that definitely counts!

Neat use of contours?
-
sur Sean Gillies: Bear training weeks 13-14 recap
Publié: 26 May 2025, 6:24pm CEST
Thirteen and fourteen were another two weeks of tempo-focused training with minimal running. The 13th included a long day of hiking and trail maintenance work. Lots of time on my feet in the company of other trail runners. It was a bit like a trail race in that way, but much easier.
4.5 miles running
13 hours, 51 minutes all training
289 ft D+ running
Week 14 was a planned rest week, and somewhat lighter.
4.5 miles running
8 hours, 8 minutes all training
361 ft D+ running
Even though my left Achilles tendon won't let me run much, and working out indoors isn't very effective or satisfying, I've been managing to increase my training volume by doubling up on workouts. Both weeks were similarly structured. I biked and did a heated "power" Vinyasa yoga class at the gym on Monday, with some hot tubbing afterwards. Wednesdays I did a short tempo run outside at Pineridge Open Space and then went back into the gym for another tempo session on an elliptical trainer and some sets of back squats or box step-ups and jumps. This was my biggest day each week. Thursdays I paired an hour long lunchtime bike ride with an evening Pool HIIT (high intensity interval training) class and a sauna session. Fridays I went back to the gym for an hour long tempo workout on the elliptical and more soaking of my lower legs. This all adds up to 75 minutes of effort at 8-8.5 out of 10 RPE (rate of perceived exertion). I'd like to be at 90 minutes, but I'm doing the best I can.
I'm going to see my doctor tomorrow and inquire about an intervention for my chronically inflamed Achilles. The steroids I took last fall to treat my pinched femoral nerve and associated back pain also cured, as a side effect, the last nagging irritation in my right Achilles (that flared in July 2024 and ended my running plans for the year). I don't believe my left is seriously injured, and that it can bear more stress if I can get the inflammation down. I may be referred to a specialist about this.
The other specialists I'm seeing soon are the folks at a local eye wear shop to get sporty, photochromic prescription sunglasses. I tried and failed with contact lens in April. I can get them on my eyes easily enough, but I can't get them out by myself for the same reason that I have always struggled with opening produce bags at the grocery store: faint fingerprints. I just can't get a grip on the contacts. If the local shop doesn't have what I need, I may try sending my prescription to Julbo, the French company. I've been considering the company's reactive glasses for a while, and Bryon Powell's recommendation here is convincing.
I'll wrap up this longish recap with more about the trail work day. There is no trail running without trails (that would be fell running), and trails need regular care and maintenance. If trails are eroded, not passable, or persistently muddy, people will route around them and create new social trails. This leads to trail "braiding" and degradation of the natural landscape and ecosystem damage. Here in arid Colorado, vegetation grows slowly, and the landscape recovers slowly from injury. In Lory State Park, the situation is compounded by soils that turn into peanut butter when saturated.
Gnar Runners, the local running events org that manages Quad Rock and other races in Lory State Park, organizes a trail work day at Lory each spring and fall. I've been participating in the spring one for the last five years. As more and more trail races require proof of trail work or other volunteering, the number have grown. This year there were 24 of us. Ten were meeting requirements of the upcoming High Lonesome event in the Sawatch Range. The Bear 100 also requires eight hours of trail work or volunteering. A lot of us would do this even if it was not required. It feels right and good to take care of a place that you enjoy and depend on.
It's also fun to make new friends and share running stories and plans. Brad Bishop and Nick Clark, the Gnar team, have directed and run more ultra marathons than I ever will and I always learn something new from them. Nick's a legend of the sport, after all. It's like I'm cleaning trail drains with Larry Bird. And some years, like this one, elite contemporary racers come out to work alongside the mere mortals. It'll be extra fun to follow the Western States Endurance Run this year, knowing somebody who is aiming for the podium.

Three humans clustered around a spot on a trail through a grassy valley under a morning sky dotted with clouds.
-
sur GRASS GIS: GRASS Developer Summit 2025
Publié: 26 May 2025, 1:42pm CEST
A week of collaboration in Raleigh The GRASS Developer Summit 2025 brought together more than 30 contributors from around the world for six days of focused collaboration in Raleigh, North Carolina. Held May 19–24 at North Carolina State University, the event served as the main annual gathering of the GRASS community, providing space for developers, researchers, and users to connect, share ideas, and move the project forward. Highlights The week featured a mix of hands-on hacking, roadmap discussions, and topic-based working sessions. -
sur Mappery: Living with Dragons in South Africa – Vineyard Map
Publié: 26 May 2025, 1:00pm CEST


You have to go on a vineyard tasting experience if you are visiting South Africa and you need a map to help you find your way!
-
sur gvSIG Team: Programa Jornada Infraestructura de Datos Espaciales en la Administración Local
Publié: 26 May 2025, 11:00am CEST
Tecnologías libres y experiencias reales con la Suite gvSIG
 Las Naves (València)
 5 de junio
 De 9:00 a 14:00 h
 Presentación General
Esta jornada tiene como objetivo mostrar experiencias reales de implantación de Infraestructuras de Datos Espaciales (IDE) en el ámbito municipal, utilizando tecnologías libres como la Suite gvSIG. A través de casos concretos, se abordará cómo diferentes ayuntamientos han estructurado y aprovechado la información geográfica para mejorar la gestión interna, facilitar el acceso ciudadano y conectar sistemas de información.
09:00 – 09:15
Bienvenida y presentación institucional 9.15 a 10.00 Bloque 1: Gestión y organización de la información territorial. Participan:
- Ayuntamiento de La Pobla de Vallbona
- Ayuntamiento de Picassent
10.00 a 11.00 Bloque 2: Conectividad entre gvSIG Online y otras plataformas de gestión municipal. De la gestión de expedientes a la de cementerios.Una visión de la suite gvSIG en la administración local: diputaciones, ayuntamientos, mancomunidades, intendencias. Participan:
- Ayuntamiento de Cullera
- Ayuntamiento de Onda
- Ayuntamiento de Cartagena
11:00 a 11:40
 Coffee Break
11.40 a 13.00 Bloque 3: Proyectos diversos de implantación de IDE en contextos municipales. Participan:
Coffee Break
11.40 a 13.00 Bloque 3: Proyectos diversos de implantación de IDE en contextos municipales. Participan:
- Scolab – La Suite gvSIG como motor de cambio en la administración local
- Ayuntamiento de Talavera
- Ayuntamiento de Albacete
13.00 a 13.30
 Novedades: Presentación de nuevas funcionalidades de la Suite gvSIG
 Mirada al futuro: Inteligencia artificial integrada en gvSIG Online
13.30 a 14:00
Mirada al futuro: Inteligencia artificial integrada en gvSIG Online
13.30 a 14:00Cierre
¿Te interesa conocer cómo las tecnologías libres están transformando la gestión municipal? No pierdas la oportunidad de asistir a la jornada “Tecnologías libres y experiencias reales con la Suite gvSIG”.
Descubre casos reales de ayuntamientos que ya están aprovechando la Suite gvSIG para mejorar su gestión territorial, conectar sistemas y facilitar el acceso ciudadano. Además, podrás conocer las últimas novedades, incluyendo la integración de inteligencia artificial en gvSIG Online.¡No te quedes fuera!
-
sur Adam Steer: Identifying deformed sea ice using geomorphons
Publié: 26 May 2025, 8:05am CEST
I’ve been working around sea ice for close to two decades on and off – and have had the privilege of being up close and personal with floating chunks of frozen ocean in both the Arctic and Antarctic. An enduring geophysical question about sea ice is “how much ice floats on the ocean?” Sea ice,… Read More »Identifying deformed sea ice using geomorphons -
sur Mappery: Living with Dragons in South Africa – Table Top Mountain
Publié: 25 May 2025, 1:00pm CEST


Last year Gregory Marler (aka on social media as Living with Dragons) went to South Africa, he found lots of mappy stuff to share with us, so good that I thought `I would make a short series of his pics.
This one is a tactile map at the top of Table Mountain [https:]] (Greg is a long-time contributor to OSM and added links to all of the locations)
-
sur Mappery: Lose Hill
Publié: 24 May 2025, 1:00pm CEST


Lose Hill is situated in the Peak District on a nice trail from Mam Tor. This hill offers a 360-degree landscape.

-
sur Mappery: Cartographic book cover design
Publié: 23 May 2025, 1:00pm CEST
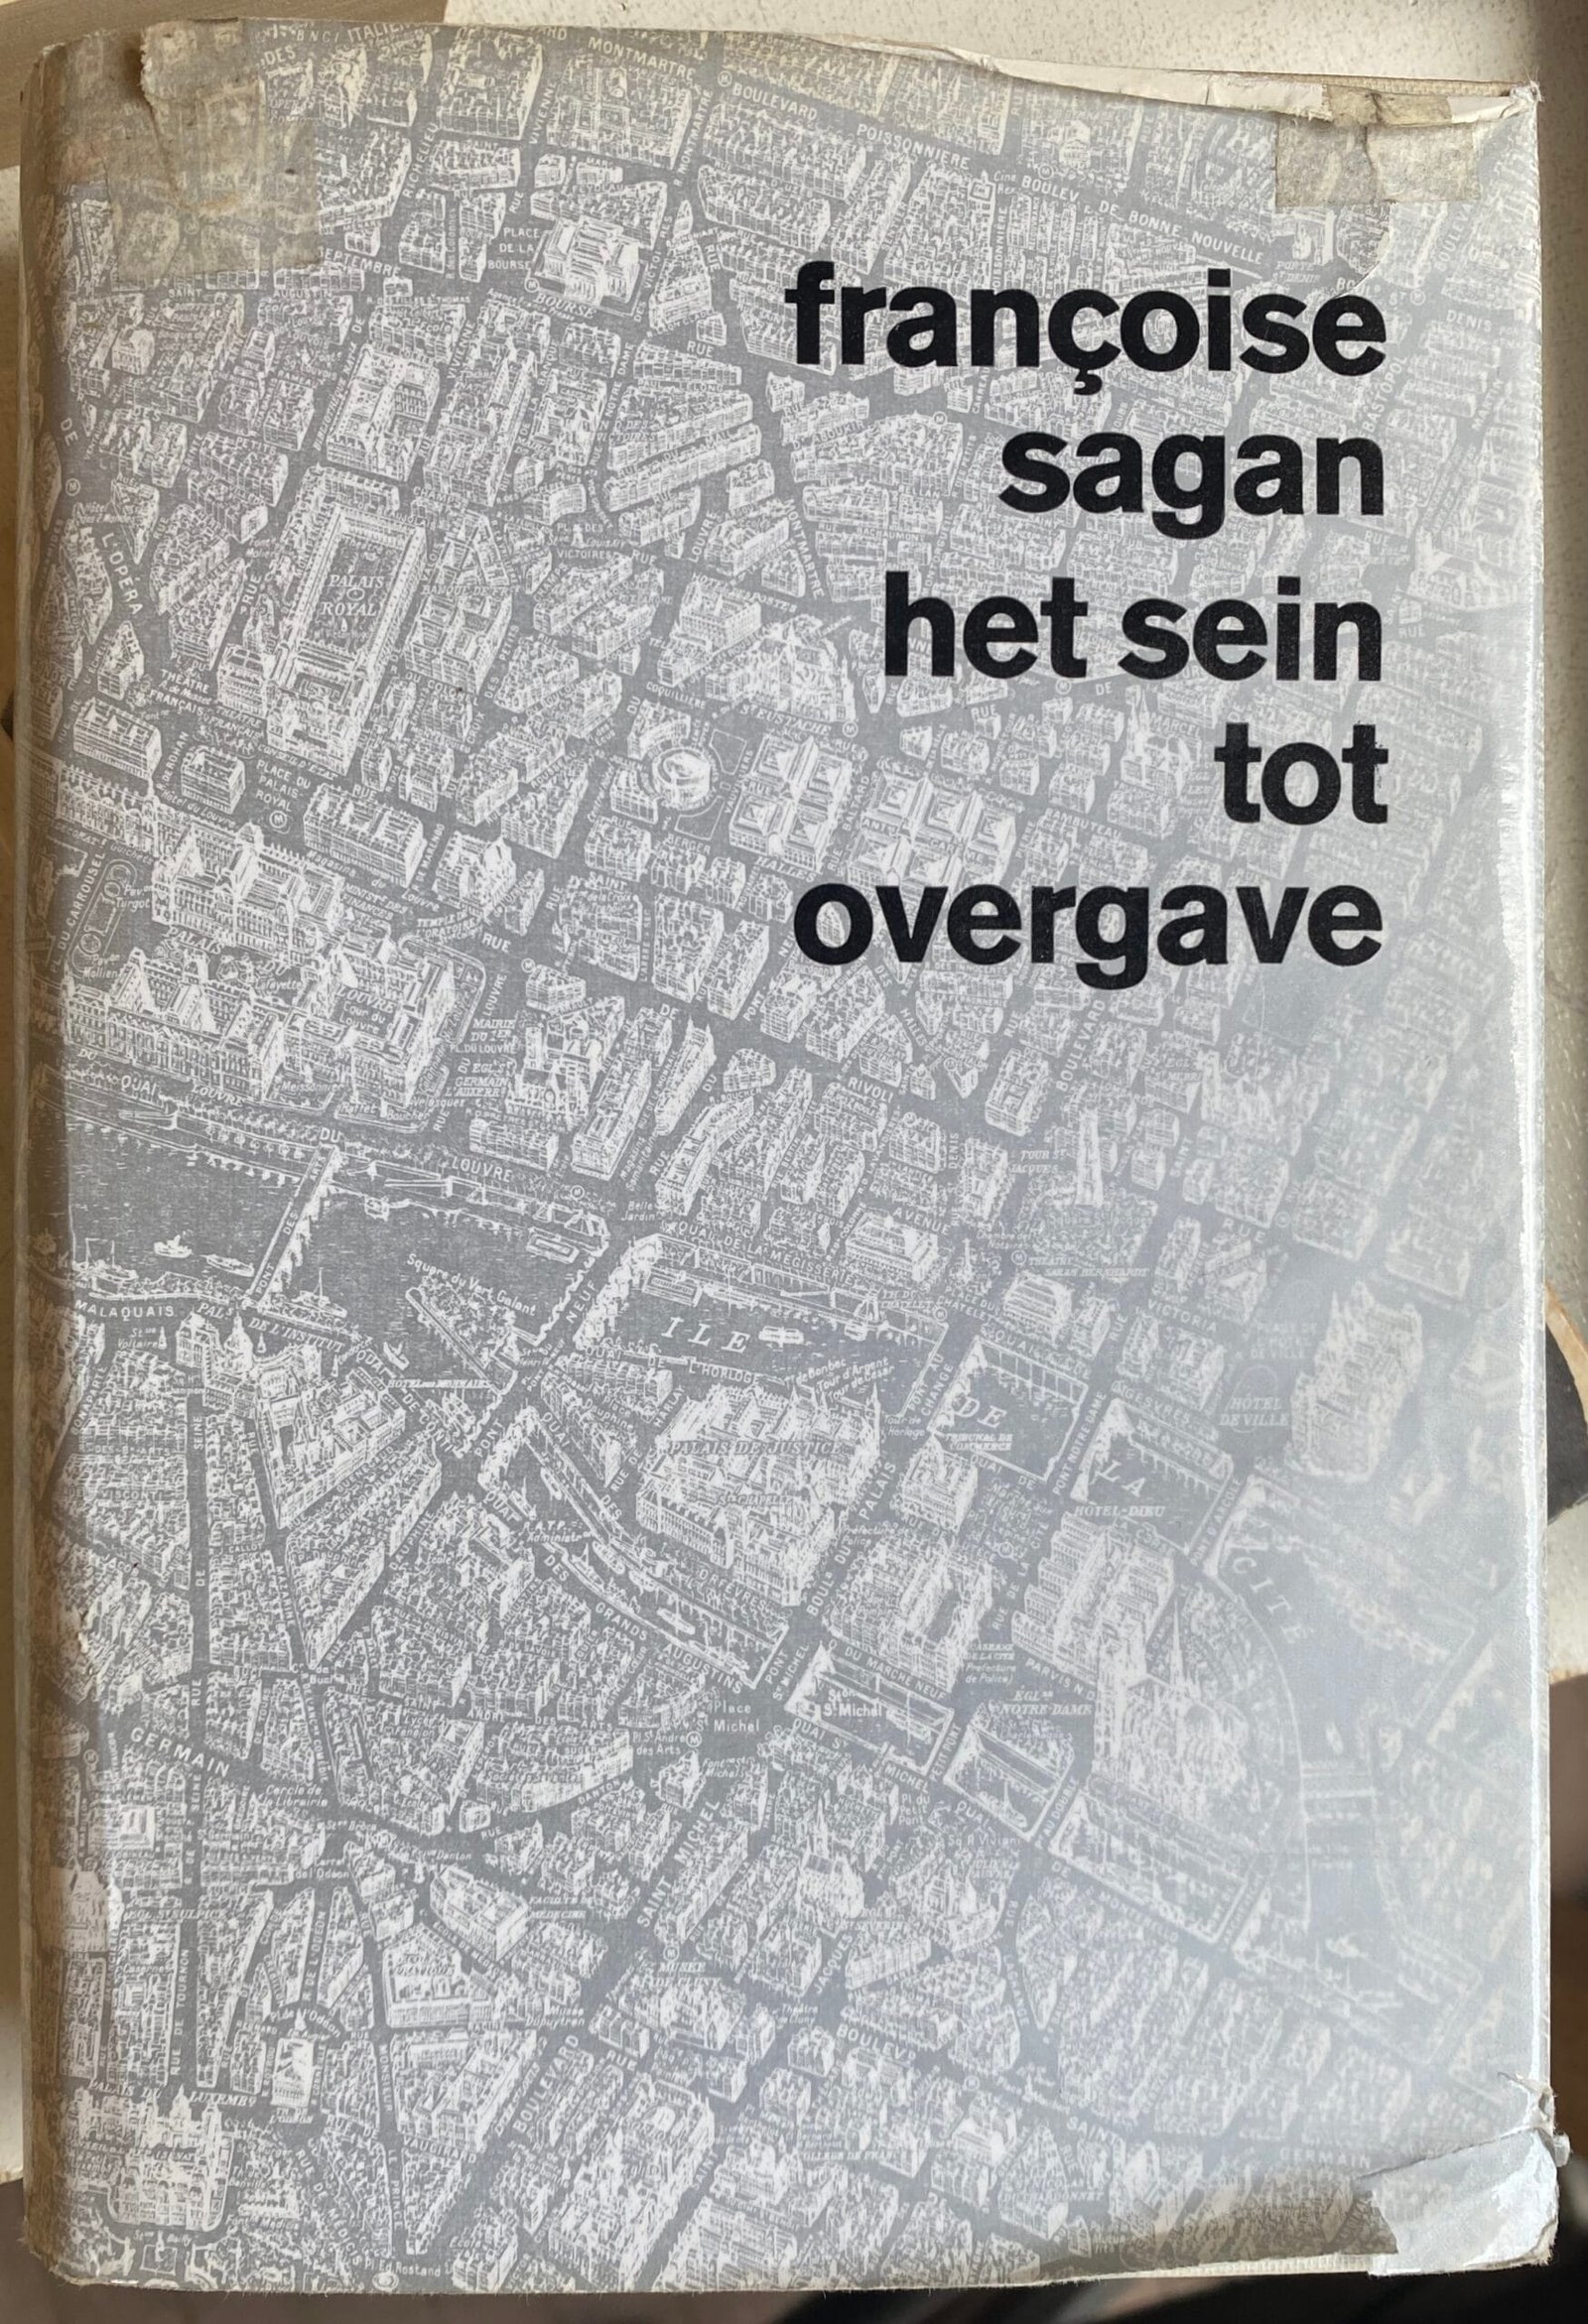

Reinder spotted this book cover, the title is “The Signal to Surrender”.
Reinder explained “It’s not a perfect copy – but still attractive though, according to me. The design is by none other than the great Dutch graphic artist Dick Bruna. [https:]]
Personally I think the book title is a little too stark and something softer would have worked better but the map relief style is excellent
-
sur Mappery: Picnic blanket
Publié: 22 May 2025, 1:00pm CEST
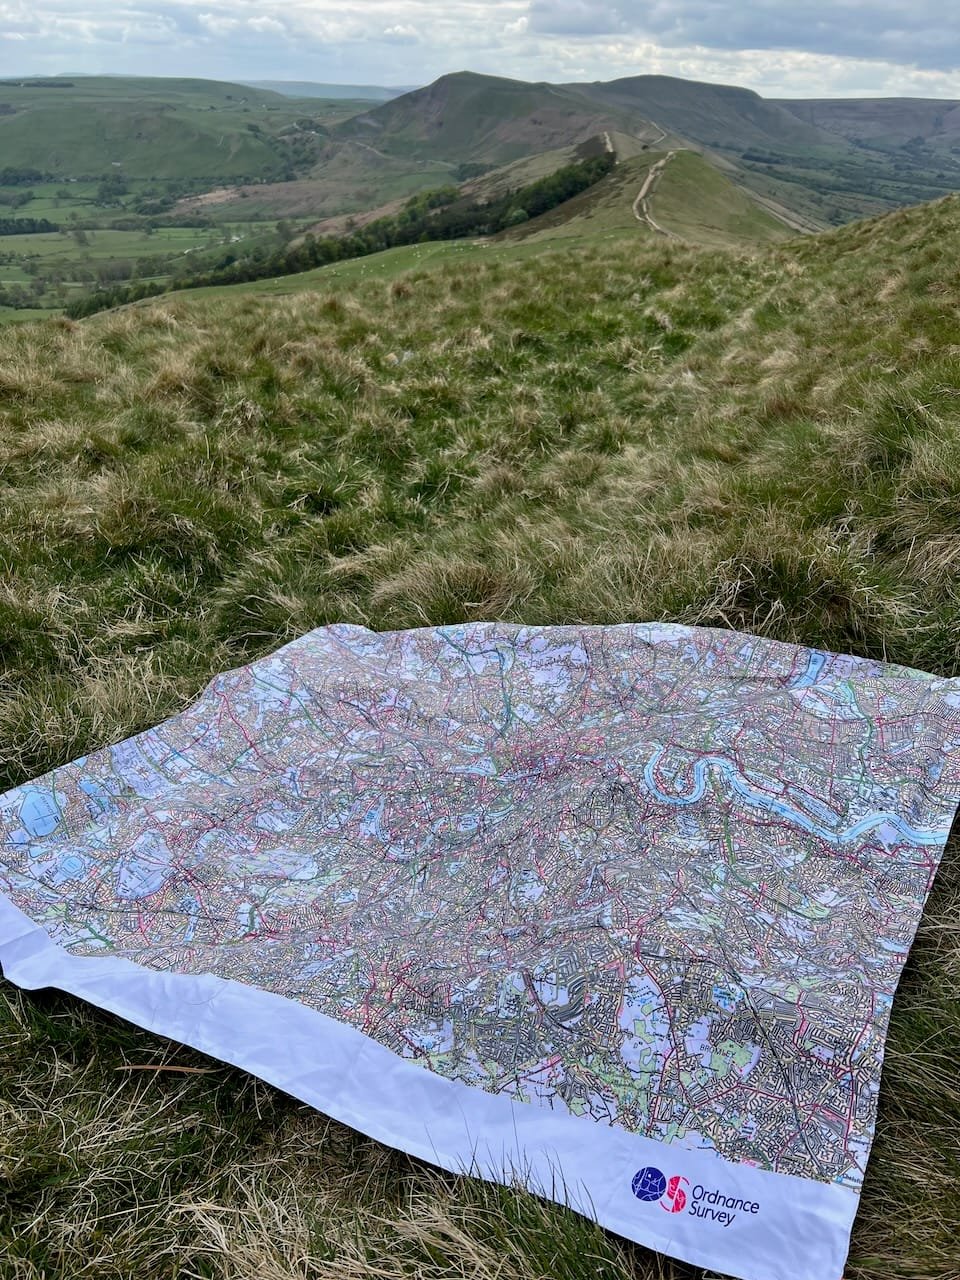

Our followers will recognise the view from a few days ago with my Hip Flask. Now here is the OS Picnic Blanket standing on a proper map in the wilderness of the Peak District.
-
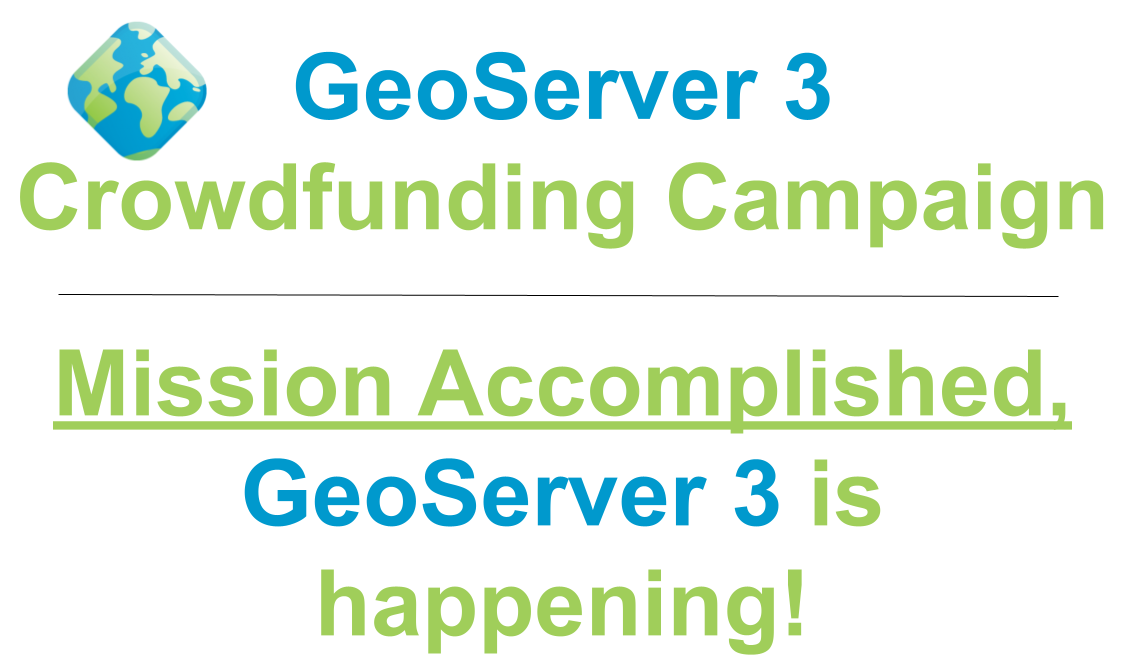
sur GeoCat: GeoServer 3: Crowdfunding Goal Surpassed!
Publié: 22 May 2025, 12:35pm CEST
We are thrilled to announce that the GeoServer 3 crowdfunding campaign has not only met but exceeded its funding target! This remarkable achievement is a testament to the unwavering support and commit...


-
sur [Équipe Oslandia] Catherine Prêtre, Directrice administrative, financière et RH
Publié: 22 May 2025, 8:45am CEST par Caroline Chanlon
Diplômée en comptabilité, Catherine débute son parcours professionnel au sein de grands groupes avant de (vite!) préférer travailler en cabinet comptable, séduite par la diversité des entreprises et des missions (comptabilité, fiscalité, RH, paie). Elle poursuit ensuite son parcours au cœur de start-ups, PME et PMI, où elle apprécie la dimension transversale des postes et la vision globale qu’ils offrent sur l’entreprise.
« Ses douze dernières années, j’ai eu la chance d’intégrer Akuiteo qui m’a fait découvrir le domaine du développement et ensuite Oslandia avec le monde du SIG orienté open source. Ces expériences m’ont fait réaliser à quel point je suis attirée par les structures à taille humaine, pour leur diversité, leur dimension collaborative et la richesse des échanges. «
Chez Oslandia, Catherine s’occupe de l’ensemble des aspects financiers et administratifs (gestion budgétaire, bilan, organisation des corpos, COPIL…) et a également dans ses missions un gros volet RH en participant activement aux entretiens annuels, les prises de pouls, le recrutement, au CSE, au Comité RH …
« Ce que j’aime c’est la confiance et la vraie bienveillance. On se remet constamment en question, dans une dynamique constructive, pour progresser ensemble. J’aime particulièrement le caractère transversal de mon poste »
Projet emblématiquePas un projet emblématique à proprement parler, mais la mise en place de l’ERP Dolibarr a été une étape clé. Cet outil nous a permis de structurer notre comptabilité tout en gagnant en autonomie et en efficacité au quotidien.
Ta philosophie« Trouver le juste équilibre, ensemble, pour avancer collectivement. »
Oslandia en 1 motLe champ des possibles !
-
sur Mappery: T-shirt store in Rome
Publié: 21 May 2025, 1:00pm CEST


I found this t-shirt in a Store in Rome
-
sur GeoServer Team: GeoServer Installation and Upgrade Guide on Windows
Publié: 21 May 2025, 4:00am CEST
GeoSpatial Techno is a startup focused on geospatial information that is providing e-learning courses to enhance the knowledge of geospatial information users, students, and other startups. The main approach of this startup is providing quality, valid specialized training in the field of geospatial information.
( YouTube | LinkedIn | Facebook | X )
GeoServer Installation and Upgrade GuideIn this session, we will install GeoServer on Windows using the Web Archive installation method and upgrade to a new version, while retaining existing data.
If you want to access the complete tutorial, click on the link.
Introduction
GeoServer is a versatile, Java-based application compatible with various operating systems, provided a suitable Java Virtual Machine (JVM) is available. The latest versions of GeoServer have been tested with both Oracle JRE and OpenJDK.
The GeoServer WAR file is a platform-independent web archive designed for deployment on application servers. Apache Tomcat is the recommended servlet container due to its robust integration capabilities and comprehensive documentation. This setup allows multiple web applications to run concurrently, enabling GeoServer to operate alongside other Java-based services, enhancing server versatility.
Note. This guide outlines the installation of GeoServer 2.25.x using Java 17 and Apache Tomcat 9, followed by upgrade instructions. To ensure you have the latest release, please visit this link and avoid using older versions of GeoServer.
Preparing for InstallationBefore proceeding, follow the steps below:
-
Backup the existing GeoServer folder (if upgrading).
The folder
webapps/geoserver/datais the data directory containing your configuration settings you wish to preserve.The folder
webapps/geoserver/WEB-INF/libcontains the deployed GeoServer web application, along with an extensions you have manually installed. - Check the Modules tab under the Server Status page to see all installed extensions.
- Uninstall previous versions of Java and Apache Tomcat.
To download JDK 17, navigate to adoptium.net and select:
- Operating System: Windows
- Architecture: x64
- Package Type: JDK
- Version: 17-LTS
Download the
Installing Apache Tomcat.msifile and run it as an administrator. During installation, accept default settings and complete the setup.To download and install Apache Tomcat software, navigate to tomcat.apache.org and select Tomcat 9 from the Download section.
Choose the 32-bit/64-bit Windows Service Installer and run it as an administrator.
During setup:
- Configure the ports (default recommended).
- Set a secure username and password for administration (avoiding common defaults like
adminortomcat). - The installer should auto-detect the installed JDK; if not, the user manually selects the Java installation path.
To configure JVM memory allocation, navigate to
C:\Program Files\Apache Software Foundation\Tomcat 9.0\binand run Tomcat9w.exe as an administrator.In the Java tab, the user sets:
- Initial Memory Pool: 512 MB
- Maximum Memory Pool: 1024 MB
-
Java Options: As required for running on Java 17.
     --add-exports=java.desktop/sun.awt.image=ALL-UNNAMED
     --add-opens=java.base/java.lang=ALL-UNNAMED
     --add-opens=java.base/java.util=ALL-UNNAMED
     --add-opens=java.base/java.lang.reflect=ALL-UNNAMED
     --add-opens=java.base/java.text=ALL-UNNAMED
     --add-opens=java.desktop/java.awt.font=ALL-UNNAMED
     --add-opens=java.desktop/sun.awt.image=ALL-UNNAMED
     --add-opens=java.naming/com.sun.jndi.ldap=ALL-UNNAMED
     --add-opens=java.desktop/sun.java2d.pipe=ALL-UNNAMED
Switch to the General tab, and set Startup Type to Automatic, and start the Tomcat service.
Deploying GeoServerDownload the latest GeoServer WAR file from geoserver.org.
Extract the
.warfile and copy it toC:\Program Files\Apache Software Foundation\Tomcat 9.0\webapps.To start GeoServer:
- Navigate
http://localhost:8080/manager. - Login with the Tomcat credentials.
- Click Start next to the GeoServer application.
The user accesses GeoServer at
http://localhost:8080/geoserverand logs in using the default credentials:- Username: admin
- Password: geoserver
Stop GeoServer via the Tomcat Manager App, then replace the existing
webapps/geoserver/datadirectory with the one from your backup.Reinstall any compatible extensions for the new version, and restart GeoServer and verifies functionality.
In this session, we took a brief journey to installation of GeoServer using the Web Archive method. If you want to access the complete tutorial, click on the link.
Reference:
- Web archive (User Manual)
- Java Considerations (User Manual)
-
-
sur GeoTools Team: GeoTools 33.1 Released
Publié: 20 May 2025, 10:13pm CEST
The GeoTools team is pleased to announce the release of the latest stable version of GeoTools 32.3: geotools-33.1-bin.zip geotools-33.1-doc.zip geotools-33.1-userguide.zip geotools-33.3-project.zip This release is also available from the OSGeo Maven Repository and is made in conjunction with GeoWebCache 1.27.1 and GeoServer 2.27.1. Thanks to Jody Garnett (GeoCat) and Andrea Aime ( -
sur GeoTools Team: GeoTools 32.3 Released
Publié: 20 May 2025, 10:13pm CEST
The GeoTools team is pleased to announce the release of the latest stable version of GeoTools 32.3: geotools-32.3-bin.zip geotools-32.3-doc.zip geotools-32.3-userguide.zip geotools-32.3-project.zip This release is also available from the OSGeo Maven Repository and is made in conjunction with GeoWebCache 1.26.3, and GeoServer 2.26.3. Thanks to Jody Garnett (GeoCat) and Andrea Aime ( -
sur GeoTools Team: GeoTools 31.7 Released
Publié: 20 May 2025, 10:13pm CEST
The GeoTools team is pleased to announce the release of the latest stable version of GeoTools 31.7: geotools-31.7-bin.zip geotools-31.7-doc.zip geotools-31.7-userguide.zip geotools-31.7-project.zip This release is also available from the OSGeo Maven Repository and is made in conjunction with GeoServer 2.25.7.This series has reached end-of-life, release published to address a security -
sur gvSIG Team: Integración entre gestores de expedientes e Infraestructuras de Datos Espaciales
Publié: 20 May 2025, 7:03pm CEST

En la Jornada de IDE en la Administración Local del día 5 de junio vamos a conocer casos reales de integración entre gestores de expedientes e Infraestructuras de Datos Espaciales (IDE).
Veremos cómo diversos ayuntamientos como los de Albacete o Cartagena ya están aprovechando la potencia de gvSIG Online para conectar su información geográfica con los procedimientos administrativos, mejorando así la eficiencia y transparencia en la gestión municipal.
Integrar expedientes con mapas no es el futuro, es el presente… y en la jornada nos mostraran ejemplos concretos de integración de gvSIG Online con gestores de expedientes como Segex/Sedipualba o Gestiona.
Si trabajas en una administración local, ¡esto te interesa!
La inscripción es gratuita, pero las plazas son limitadas. Formulario de inscripción
5 de junio en Las Naves, Valencia. Más información aquí.
-
sur Mappery: Coffee table
Publié: 20 May 2025, 1:00pm CEST
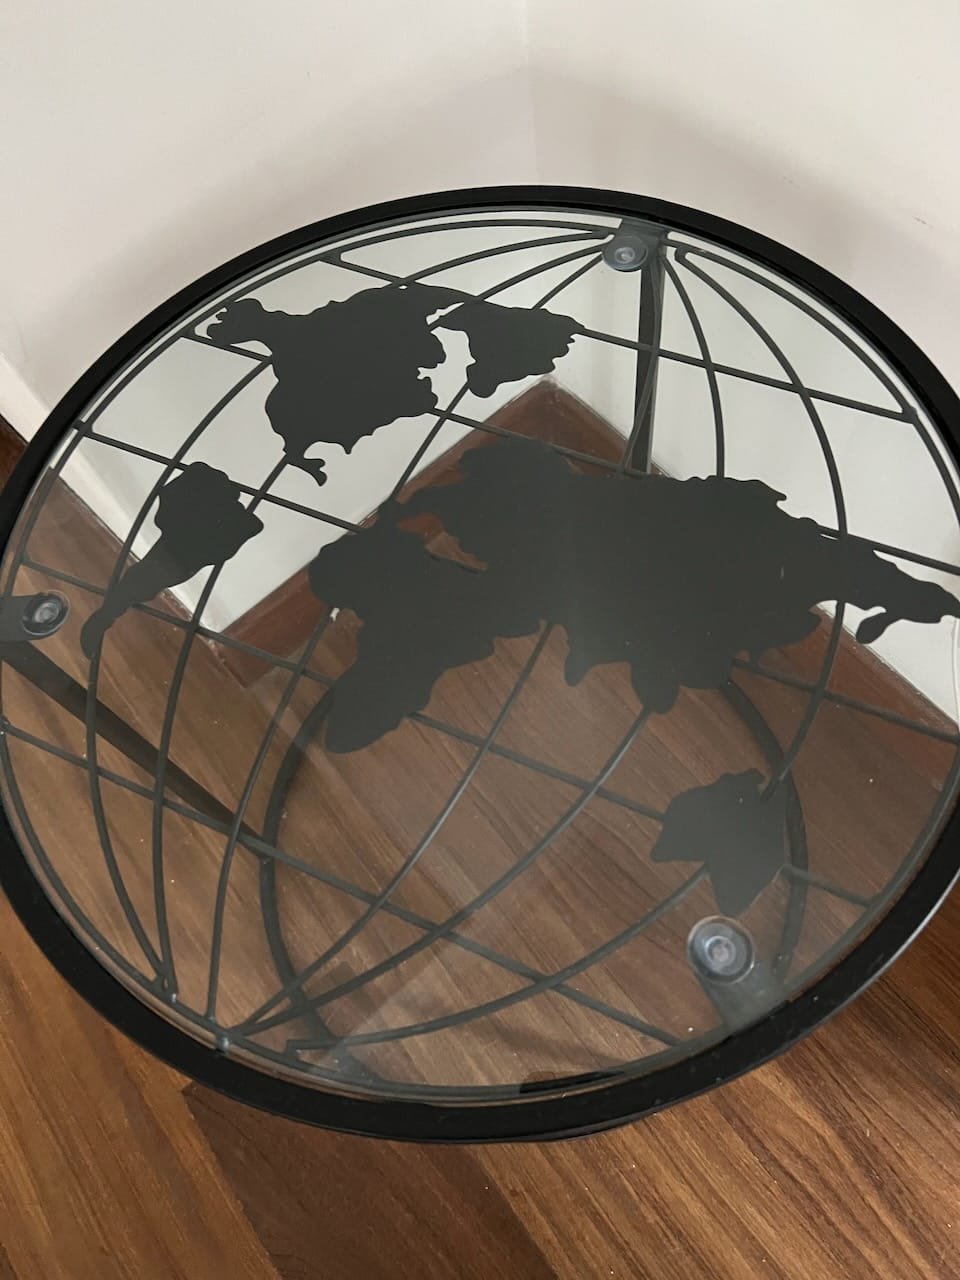

A nice coffee table with the usual missing NZ and MZ, but Central America has vanished; nonetheless, the British Isles are gone. I will not buy it.
-
sur gvSIG Team: Bloques temáticos y Ayuntamientos confirmados en la Jornada de IDE en la Administración Local
Publié: 20 May 2025, 11:22am CEST
El próximo 5 de junio celebramos en Las Naves (València) una jornada dirigida a ayuntamientos y entidades locales que están explorando o ya utilizan tecnologías libres para la gestión de su información geográfica.
A lo largo de la mañana, varios municipios compartirán experiencias reales de implantación de Infraestructuras de Datos Espaciales (IDE) basadas en la Suite gvSIG, mostrando cómo han estructurado y aprovechado sus datos espaciales para mejorar la gestión interna, conectar sistemas de información y facilitar el acceso ciudadano.
La jornada se organizará en tres bloques:
Gestión y organización de la información territorial Integración de gvSIG con plataformas como SEDIPUALBA, GESTIONA, KEYCLOUD o aplicaciones específicas (como cementerios) Casos de uso en ayuntamientos de distintos perfiles y tamañosEntre otros, contaremos con la participación de:
- Ayuntamiento de Albacete ? Visor IDE Albacete
- Ayuntamiento de Cartagena ? Visor IDE Cartagena
- Ayuntamiento de Picassent ? Visor IDE Picassent
- Ayuntamiento de Onda ? Visor IDE Onda
En los próximos días publicaremos el programa completo, con todos los ponentes y horarios detallados.
La inscripción es gratuita, pero las plazas son limitadas. Formulario de inscripciónSerá una oportunidad para compartir aprendizajes, resolver dudas, y conocer de primera mano cómo otros municipios están modernizando su gestión con herramientas libres y accesibles.

-
sur [Webinar] Open source 3D: a new dimension!
Publié: 20 May 2025, 11:19am CEST par Caroline Chanlon
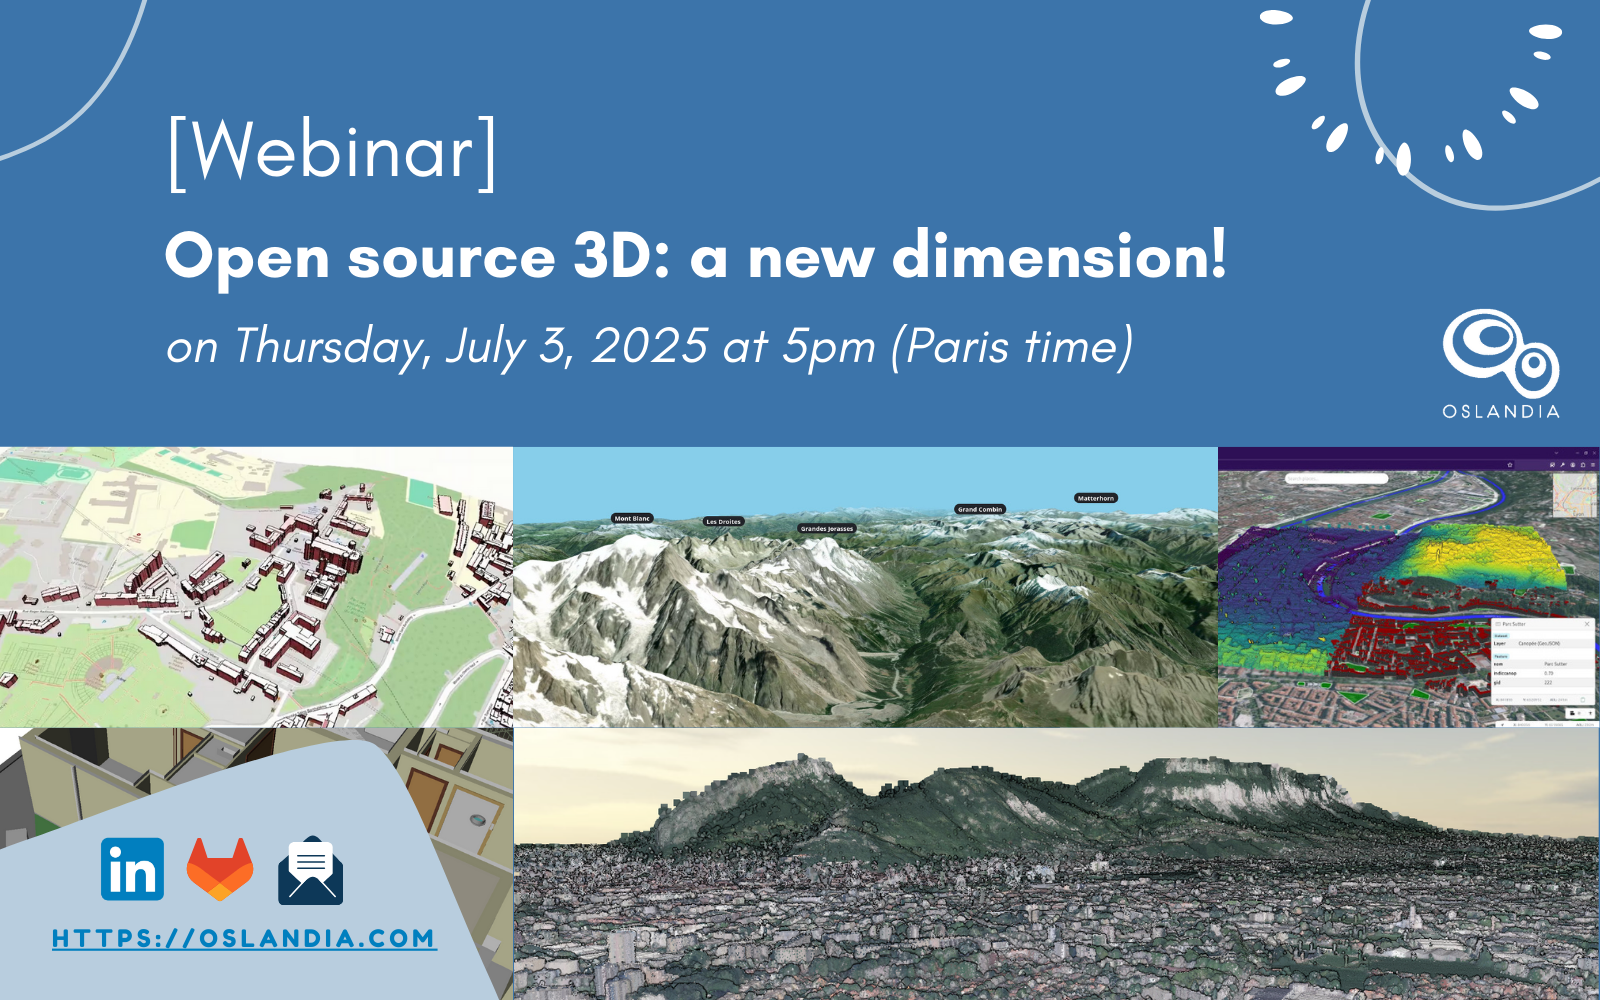
Oslandia is pleased to invite you to a webinar dedicated to open source 3D on Thursday, July 3, 2025 at 5pm (Paris time).
[in English] Program:- 3D challenges in 2025: digital twins, publishing data on the web, sharing data, managing volume, sharing OpenSource tools
- Use cases
- Technical architecture
- Presentation of OpenSource components Giro3D, Piero, py3Dtiles, CityForge
- Question and answer session
Registration is free but mandatory. The webinar access link will be emailed to you after registration: [https:]]
-
sur Plugin French Locator : sortie de la version 1.3.0
Publié: 20 May 2025, 8:42am CEST par Jean-Marie Kerloch
Pièce jointe: [télécharger]
Nous n’avons pas eu le temps de communiquer sur la version 1.2.0 du plugin French Locator Filter qu’une version 1.3.0 vient tout juste de sortir !
Pour rappel ce plugin permet simplement une recherche sur la BAN (Base Nationale des Adresses) depuis la barre de recherche de QGIS (en bas à gauche de l’interface principale).
On en profite donc pour vous faire un petit point sur les nouvelles fonctionnalités.
En version 1.2.0:
- support de Qt6, le plugin est prêt pour QGIS 4
- passage vers l’API Géoplateforme qui remplace maintenant l’API BAN
En version 1.3.0 les fonctionnalités sont plus visibles:
- utilisation de l’interface QgsGeocoderInterface pour permettre une intégration plus poussée à QGIS. L’adresse sélectionnée est maintenant affichée dans QGIS.
- ajout d’un traitement QGIS pour du géocodage d’adresse en lot.
Pensez à réinitialiser des paramètres par défaut pour utiliser les nouvelles valeurs par défaut pour l’API Géoplateforme.
Toutes ces nouvelles fonctionnalités sont financées par l’IGN dans le cadre du développement de plugins utilisant la Géoplateforme.
De nouveaux développements sont prévus pour les prochains mois, toujours sur le thème de l’utilisation de la Géoplateforme. Restez connectés !
-
sur pgPointcloud, un compromis différent pour le stockage de nuage de points
Publié: 16 May 2025, 8:43am CEST par Augustin Trancart
 Késako
pgPointcloud est une extension PostgreSQL permettant de stocker des nuages de points dans une base PostgreSQL. Cet article présente ses différentes caractéristiques, ses compromis et cas d’usages principaux.
ProblématiqueLe besoin de créer pgPointcloud est venu de l’émergence de l’acquisition de nuages de points très volumineux, pouvant contenir des centaines de millions, voire des milliards de points. Comment stocker ces points ainsi que leurs attributs tout en profitant de la puissance de PostgreSQL et de PostGIS ?
Un stockage naïf en format
POINTest à déconseiller. En effet, cela implique d’avoir une ligne par point dans la table, ce qui ne passera pas à l’échelle pour les index géographiques lorsque la quantité de points sera supérieure à quelques dizaines de millions.De plus, l’index géographique de PostGIS est peu adapté aux points. Il se base, en effet, sur une hiérarchie de boîtes englobantes. Si cette hiérarchie est toujours utile pour les points, le calcul d’une boîte englobante d’un point est… le point lui-même ! On se retrouve donc à dupliquer le stockage de la table dans l’index.
On préfère ainsi les solutions qui regroupent les points en ensembles géographiques cohérents permettant de garder une taille d’index raisonnable.
MULTIPOINTUne solution possible est bien sûr d’utiliser le type géographique
MULTIPOINT, en regroupant les points en suivant un découpage géographique. Cette solution permet de faire passer à l’échelle l’index géographique, mais a deux limitations :- Ce format n’est pas compressé
- Il ne permet pas de stocker facilement les métadonnées liées à chaque point.
Pour ce dernier point, on peut utiliser un
pgPointcloudMultiPointMet détourner cette dimension M pour stocker un identifiant de métadonnée pouvant participer à la condition d’unJOINpar exemple.pgPointcloud offre une autre façon de stocker les points en les groupant dans des « patchs ». Par comparaison avec le
MULTIPOINT, pgpointcloud permet deux choses supplémentaires :- la compression d’un patch de point ;
- la définition d’un format spécifique de points.
pgPointcloud peut donc se comparer au multipoint, tout en apportant un compromis différent en termes de stockage et de format de donnée.
La compressionpgPointcloud supporte la configuration d’une méthode de compression. Les trois possibles sont :
- pas de compression ;
- compression LAZ ;
- compression dimensionnelle. Elle regroupe les données par dimension (X, Y, Z) car elles ont plus de chance d’être similaires, puis utilise différentes stratégies de compression.
Le site officiel de pgPointcloud détaille davantage ces méthodes. Ces compressions permettent de compresser avec un ratio entre 3:1 et 5:1.
Déclaration du formatpgPointcloud permet de déclarer un format de point. Principalement utile pour déclarer des attributs supplémentaires aux classiques X, Y et Z. Il est ainsi possible d’embarquer dans chaque point l’intensité, la classification, le nombre de retour, etc. sans recourir à des jointures. La déclaration du format se fait avec un schéma XML.
AvantagesStocker des points en base de données avec PostGIS apporte deux principaux bénéfices :
- la possibilité d’avoir des mises à jour et des modifications transactionnelles, ce qui apporte une sécurité et de meilleures garanties de cohérence?;
- la possibilité de faire des croisements avec d’autres tables géographiques en utilisant les index géographiques.
Ce type de stockage peut ne pas convenir à tous les cas d’usage. En effet, le fait de stocker un grand nombre de points dans une base de données va mécaniquement l’alourdir, ce qui peut complexifier les opérations de maintenance et de maintien en condition opérationnelle (sauvegarde, restauration, migration, etc.).
Par rapport à d’autres types de stockage comme le
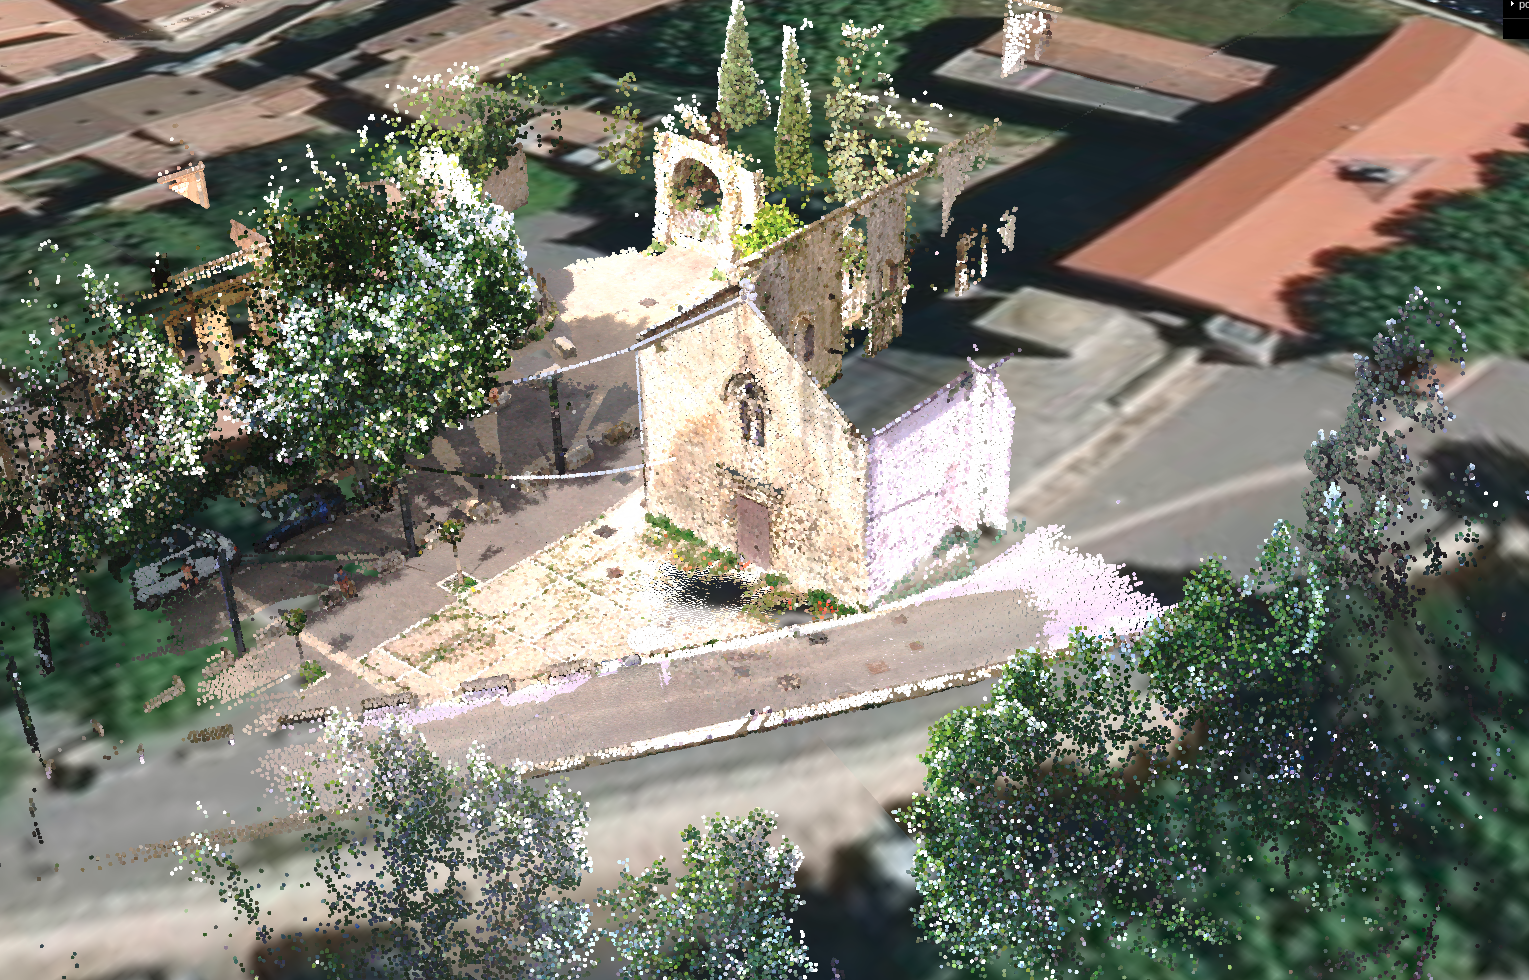
MULTIPOINT, la compression va nécessairement ralentir les opérations de lecture.Enfin, pgPointcloud, bien que permettant un requêtage par zone efficace, n’est pas utilisable seul pour de la visualisation, car il n’implémente pas de notion de niveau de détail. Ces niveaux doivent être mis en place par ailleurs, par exemple, avec une table additionnelle. On peut alors utiliser pg_tileserv et une fonction SQL qui interrogera la table contenant les niveaux de détails pour les vues d’ensemble et la table de référence pour les vues plus détaillées.
Une table pgpointcloud branchée sur pg_tileserv et visualisée dans QGIS
Cas d’usagepgPointcloud pourra donc être choisi si :
- On souhaite absolument un stockage transactionnel
- Le croisement avec des données géographiques est fréquent et nécessaire
- On veut optimiser le stockage plutôt que la rapidité d’interrogation
- Le format de point est spécifique
Voici un petit diagramme résumant les points clés de décision.
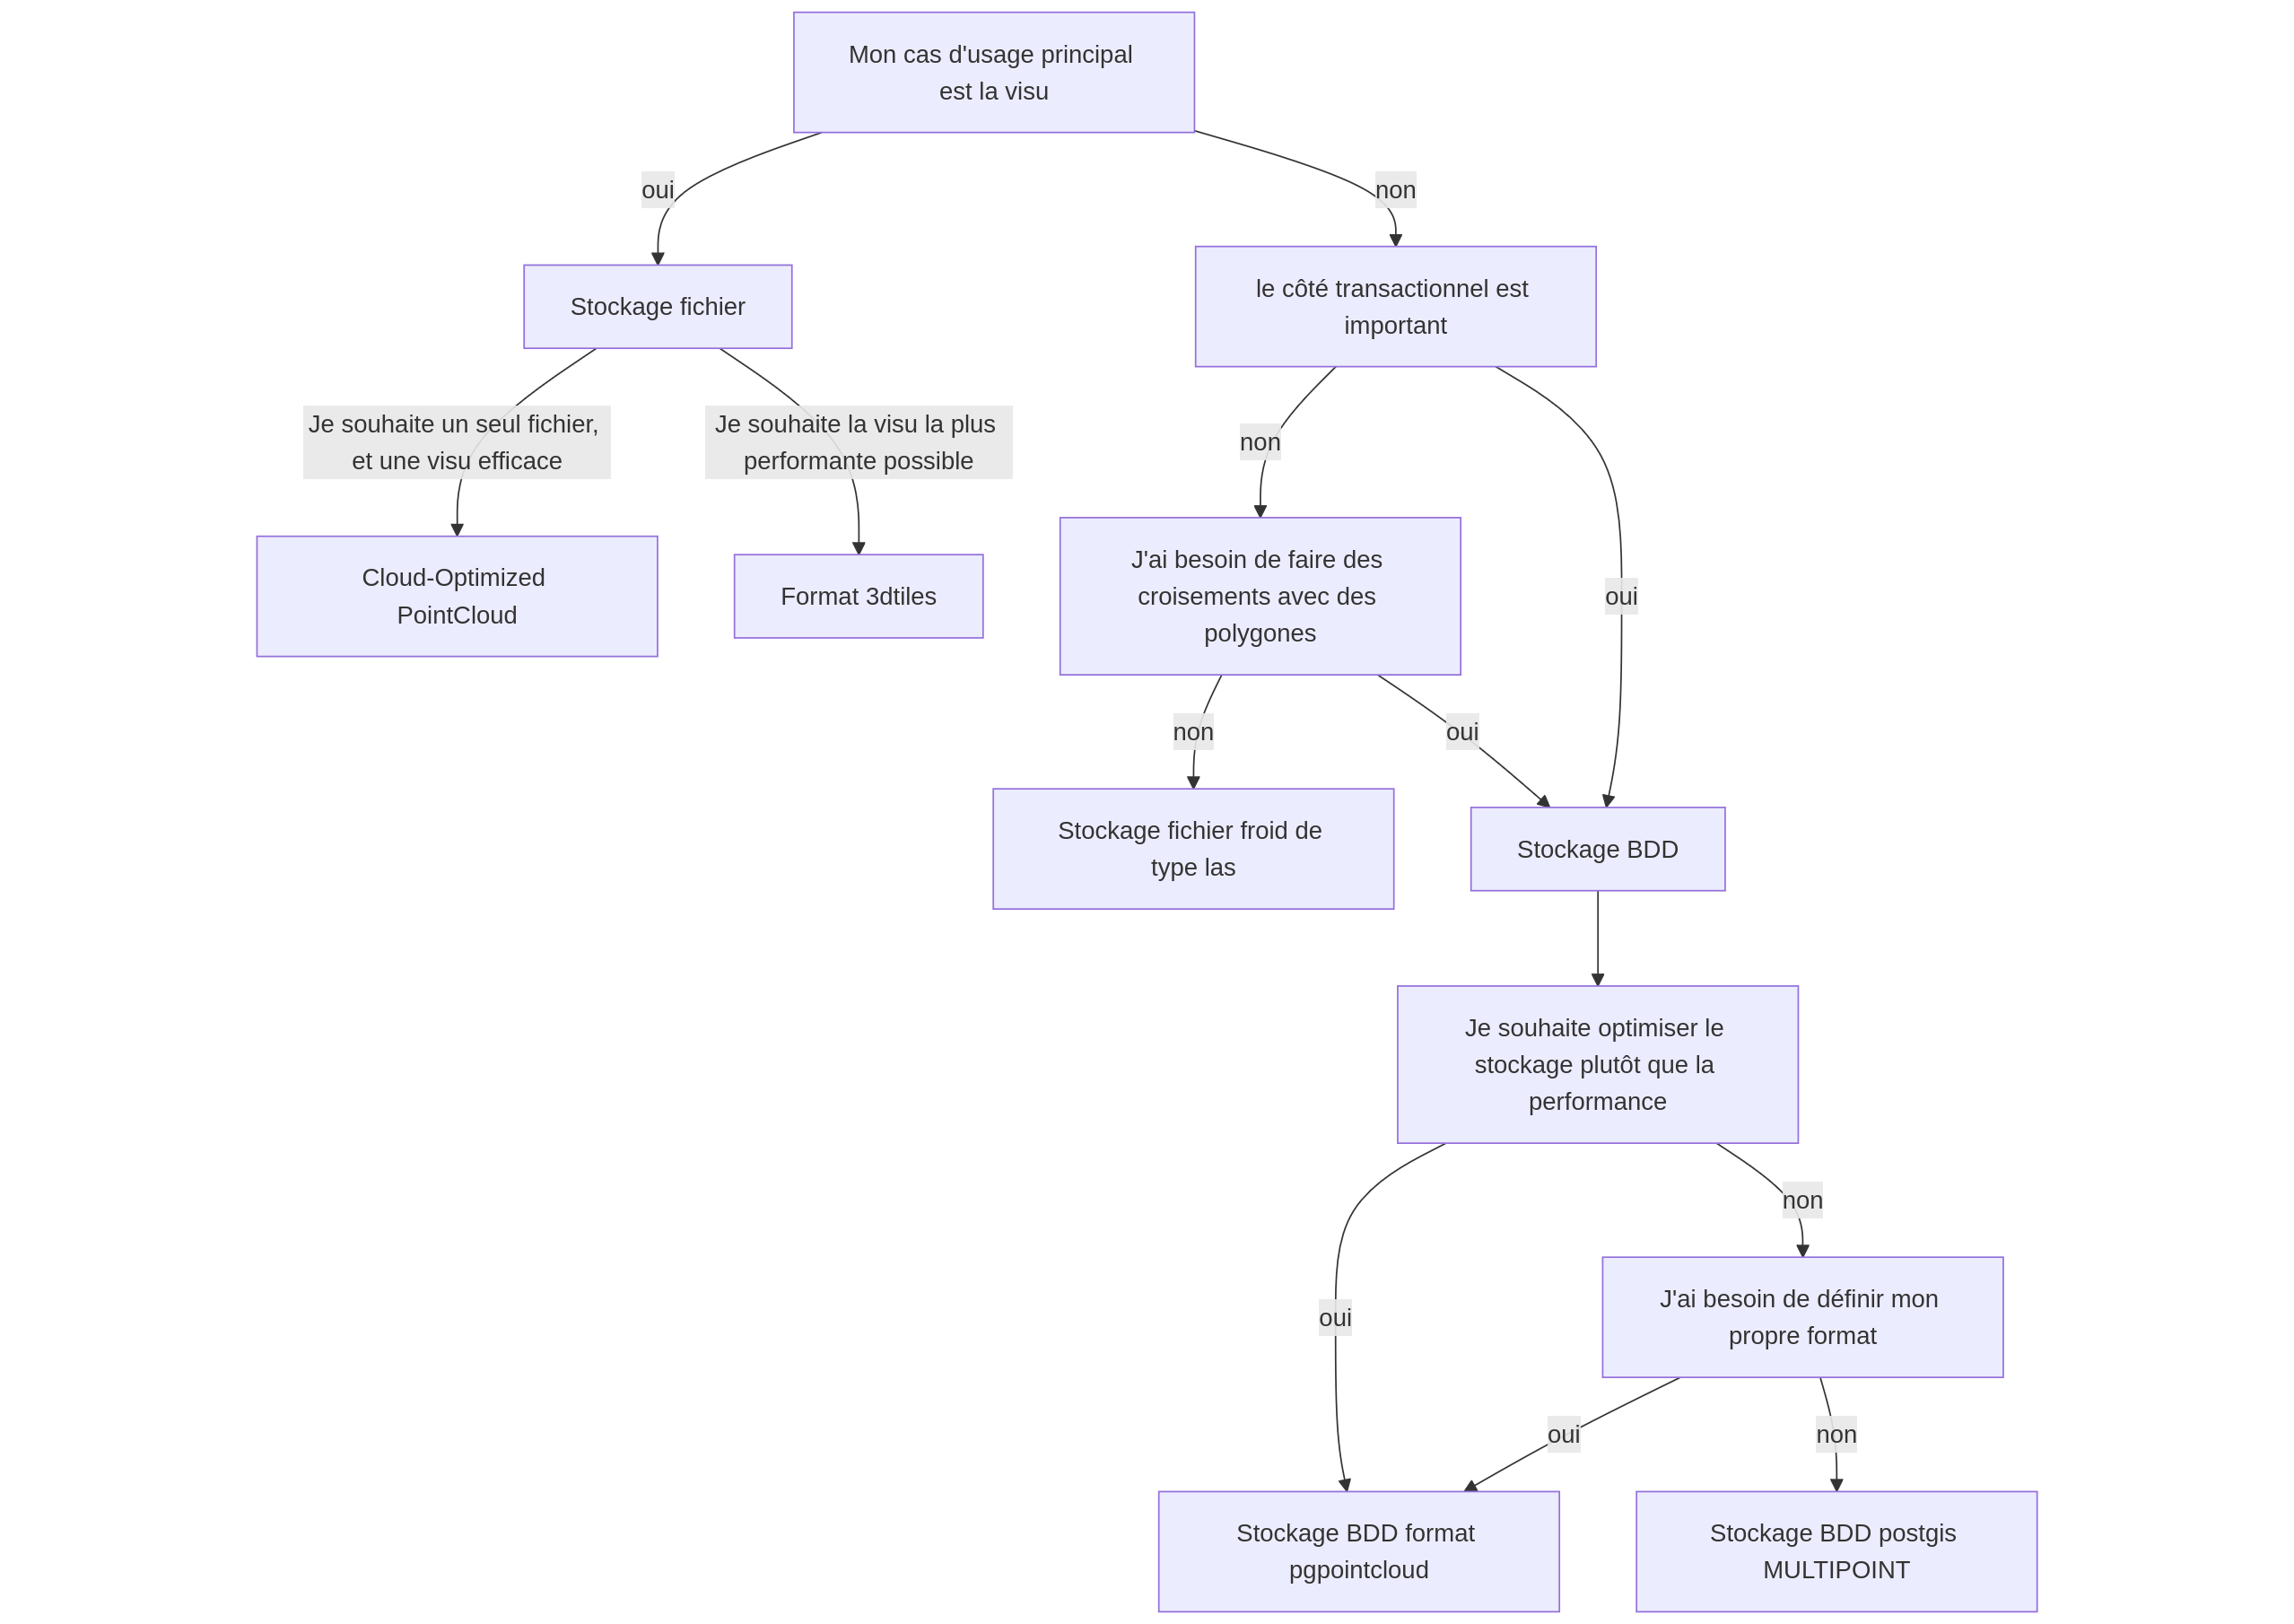
Diagramme de décision pour pgpointcloud
Ce diagramme résume les critères, mais le choix réel dépendra bien sûr du contexte d’utilisation. Retenons tout de même que pgPointcloud pourra être envisagé pour des cas d’usage comme un référentiel de donnée (où l’intégrité est très importante) ou comme étape pouvant débloquer des calculs géographiques complexes.
Infos pratiques InstallationpgPointcloud est présent dans les dépôts de paquets officiels d’Ubuntu et debian (par exemple
postgresql-16-pointcloudpour ubuntu 24.10). Pour avoir accès à plus de versions ou pour les dépôts rhel, centos etc., il est possible d’ajouter le dépôt de paquet du projet postgresql (pgdg) correspondant à votre distribution, qui contient un paquet pour pgpointcloud.Pour Windows, pgPointcloud est inclus dans le bundle PostGIS officiel.
Chargement et extractions des donnéesPour charger et extraire les données, PDAL reste un outil de choix, car il possède un reader et un writer pgPointcloud.
Toute la puissance SQL est également à votre disposition, en utilisant les fonctions pgPointcloud et les fonctions PostGIS.
Par exemple, voici une requête extrayant les points au format MVT sur une étendue donnée, en incluant le Z comme propriété :
ConclusionWITH mvtgeom AS ( SELECT pc_get(points, 'z') AS z, st_asmvtgeom(st_transform(points::geometry, 3857), bounds.geom) point FROM points, -- pc_explode "ouvre" le patch de points pour traiter chaque point séparement LATERAL pc_explode(sonde.patch) v(points) WHERE pc_intersects(patch, polygon) ) SELECT st_asmvt(mvtgeom) FROM mvtgeom;pgPointcloud présente une solution intéressante pour le stockage et le traitement de nuage de point. Profitant de la puissance de SQL, de la sécurité de PostgreSQL et des fonctionnalités de PostGIS, il offre un compromis intéressant lorsqu’on souhaite construire un référentiel ou croiser des couches entre elles.
Si cette technologie vous intéresse, n’hésitez pas à nous contacter pour évaluer si elle répond à votre cas d’usage.
Pour aller plus loin :
-
sur Webinar « Security Project for QGIS »
Publié: 14 May 2025, 11:23am CEST par Caroline Chanlon

Oslandia and partners ( e.g. OPENGIS.ch) publicly launch the « Security Project for QGIS » : a mutualized funding effort to increase QGIS cybersecurity.
Oslandia is pleased to invite you to a webinar presenting the “Security Project for QGIS” on Thursday June 19th at 5pm (Paris time).
During this 45 min talk, will detail the project with the following program.
The context : new regulations are coming ( CRA, NIS2 ), cyberattacks increase, software see a growing complexity, and QGIS legacy makes it difficult to increase security.
Benefits :
- Tech & process security enhancement
- Compliance with CRA & modern requirements
- Security risk reduction
- Improved trust
- Better enterprise IT integration
- Control software supply chain
Do not miss this opportunity, and register soon : [https:]]
-
sur SFCGAL 2.1.0 : Nouvelles fonctionnalités et améliorations
Publié: 14 May 2025, 9:14am CEST par Loïc Bartoletti
Pièce jointe: [télécharger]
SFCGAL 2.1.0 : Nouvelles fonctionnalités et améliorationsLa version 2.1.0 de SFCGAL sera bientôt disponible, apportant avec elle un lot de nouvelles fonctionnalités et d’améliorations pour cette bibliothèque dédiée à la géométrie spatiale 3D.
Quoi de neuf ?SFCGAL 2.1.0 introduit plusieurs ajouts significatifs :
- Alpha Wrapping 3D : Un nouvel algorithme qui permet de reconstruire des surfaces à partir de nuages de points.
- Wrapper pour la simplification 2.5D de CGAL : Ce wrapper prend en charge les coordonnées Z et M, facilitant ainsi les simplifications géométriques.
- Traitement unifié des surfaces : Les PolyhedralSurface et TriangulatedSurface sont désormais traitées comme une seule entité, plutôt que comme une simple collection de polygones ou de triangles.
Dans un souci de standardisation et pour répondre à des besoins plus courants, cette version propose également :
- Nouvelles opérations sur les coordonnées : Ajout des fonctions
force_z,
force_m,dropZ,dropMetswapXY. - Fonctions d’analyse géométrique : De nouvelles fonctions pour calculer le centroïde, la
longueur, la frontière et la dimension.-
AlphaWrapping 3D :
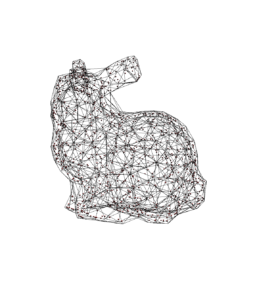
« Standford Bunny de CGAL »
Lapin 3D vue maillée avec le nuage de points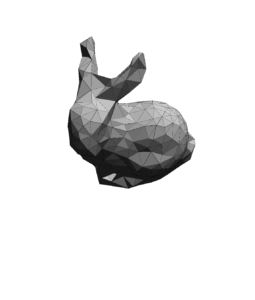
« Standford Bunny de CGAL »
Lapin 3D vue du dessus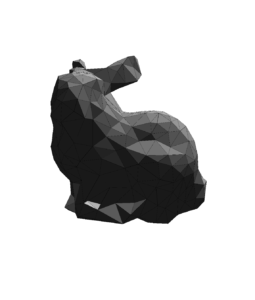
« Standford Bunny de CGAL »
Lapin 3D vue de face
-
Simplification :
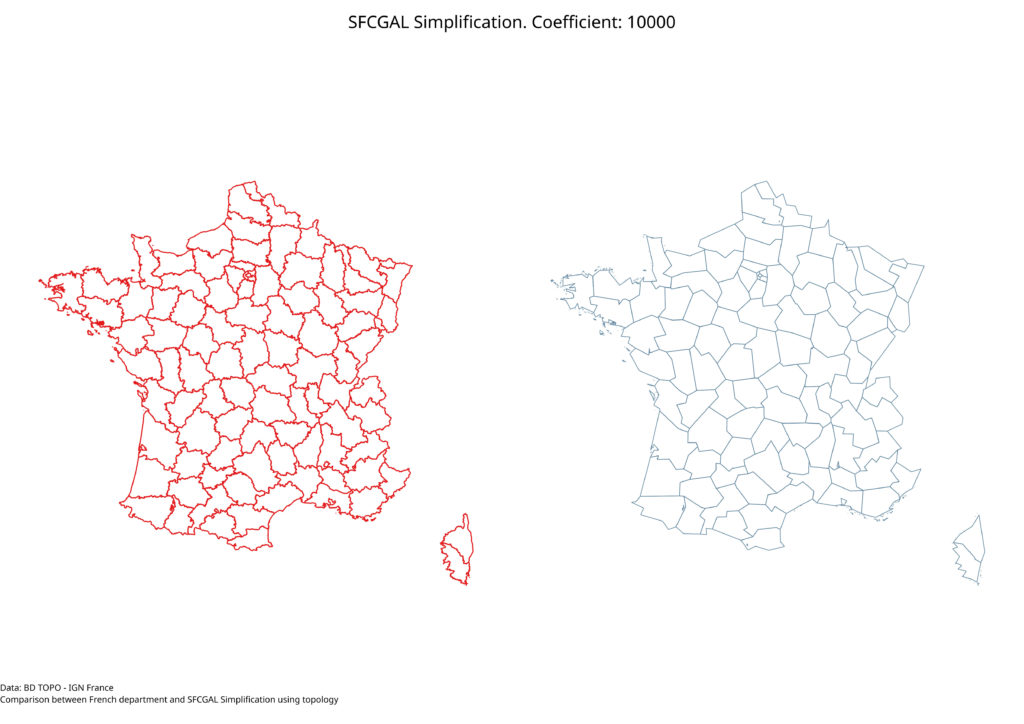
France Simplification 10000
-
AlphaWrapping 3D :
Cette mise à jour comprend également de nombreuses corrections et optimisations :
- Correction d’un problème de segmentation : Résolution d’un bug dans l’algorithme d’Alpha
Wrapping avec gcc 15.1. - Optimisations des allocations : Améliorations dans la gestion des allocations mémoire dans les
fonctions géométriques pour une meilleure performance. - Vérifications de validité : Ajout de contrôles dans l’algorithme de partition.
- Documentation enrichie : Amélioration de l’API C pour une meilleure compréhension.
- Modernisation du système de build : Mise à jour avec CMake pour une intégration plus fluide.
PySFCGAL, la version Python de SFCGAL, a également été mise à jour afin d’incorporer l’ensemble des nouveautés apportées par cette nouvelle version de SFCGAL. Autre nouveauté : un guide d’utilisation est désormais disponible. Il propose des extraits de code et plusieurs exemples concrets pour illustrer l’usage de PySFCGAL en complément de la documentation existante. Nous prévoyons de l’enrichir dans les prochaines versions.
Intégration avec d’autres outils SIGLes nouvelles fonctionnalités de SFCGAL 2.1.0 seront intégrées dans PostGIS 3.6.0 et devraient également être
disponibles dans les prochaines versions de QGIS. Cela permettra aux utilisateurs de ces logiciels de profiter de
traitements avancés en matière de géométries 3D.Cette version renforce les outils disponibles pour gérer des géométries 3D complexes dans les systèmes d’information
Infrastructure et maintenance
géographique.La version 2.1.0 améliore également l’infrastructure de développement :
- Mise à jour des pipelines d’intégration continue : Pour garantir une meilleure qualité de code.
- Tests sur de nouvelles plateformes : Cette fois, nous avons élargi notre compatibilité aux
systèmes BSD, notamment FreeBSD, NetBSD et OpenBSD, ainsi qu’à macOS. - Documentation et contrôles de qualité : Renforcement des ressources documentaires et des
processus de vérification.
Si vous êtes intéressé par l’utilisation de SFCGAL pour vos projets SIG 3D ou si vous souhaitez contribuer à son
développement, n’hésitez pas à nous contacter !
-
sur GeoTools Team: GeoTools 33.0 release
Publié: 13 May 2025, 9:20am CEST
The GeoTools team is pleased to announce the release of the latest stable version of GeoTools 33.0: geotools-33.0-bin.zip geotools-33.0-doc.zip geotools-33.0-userguide.zip geotools-33.0-project.zip This release is also available from the OSGeo Maven Repository and is made in conjunction with GeoServer 2.27.0 and GeoWebCache 1.27.0. We thank Gabriel Roldan (Camptocamp) and Jody -
sur GeoServer Team: GeoServer 3 Crowdfunding Goal Surpassed!
Publié: 13 May 2025, 4:00am CEST
We are thrilled to announce that the GeoServer 3 crowdfunding campaign has not only met but exceeded its funding target! This remarkable achievement is a testament to the unwavering support and commitment of our global geospatial community.
Why This Matters: GeoServer 3 represents a significant leap forward in open-source geospatial technology. With the funds raised, we will:
- Modernize the platform by upgrading to Spring 6 and JDK 17, ensuring long-term support and compatibility.
- Enhance security through improved authentication mechanisms and compliance with current standards.
- Improve performance by replacing outdated components like JAI with modern alternatives such as ImageN.
- Align with modern deployment environments, facilitating cloud-native and containerized deployments.
Acknowledging Our Community: This milestone was made possible by the collective efforts of individuals, organizations, and institutions worldwide. Your contributions—be it through funding, advocacy, or development—have been instrumental in shaping the future of GeoServer.
Looking Ahead: Surpassing our funding goal allows us to invest additional resources into further enhancements and features, as prioritized by the GeoServer Project Steering Committee (PSC). This includes a stronger focus on security and vulnerability management, ensuring GeoServer remains robust, secure, and resilient in the face of evolving threats. These efforts will help ensure that GeoServer continues to evolve in line with the needs of its diverse user base.
Thank you for being an integral part of this journey. Together, we’ve laid a robust foundation for the next generation of open-source geospatial solutions.
Stay tuned for updates as we embark on this exciting new chapter!
The following organisations have pledged their support:


Individual donations: Abhijit Gujar, Stefan Overkamp.
-
sur GeoServer Team: GeoServer 2025 Q2 Developer Update
Publié: 13 May 2025, 4:00am CEST
The GeoServer team is charging ahead with our 2025 roadmap plans.
Thanks to 2025 Sponsors:
CITE Certification


A great deal of progress has been made on CITE Certification with the most recent GeoServer 2.27.0 Release passing tests! This is great for interoperability and project stability as the CITE tests act as an external “blackbox” testing framework and this verifies that GeoServer is operating as intended.
We are presently determining how to pay for certification:
- The Open Source Geospatial Foundation has negotiated a reduced rate of $150 annual cost per standard certified.
- We are prioritizing tests where we can act as a “reference implementation” resulting in no annual cost for OSGeo.
- For Web Feature Service we pass tests for WFS 2.0, WFS 1.1, and WFS 1.0 which would add up to $450. It may be worthwhile only being certified for the latest WFS 2.0 to reduce the costs to $150.
- There are also now CITE tests for output formats. This would allow the WFS and WPS output to be certified on individual formats like GeoPackage and GeoTIFF.
While GeoServer presently “implements” these standards, our sponsorship level is not sufficient to allow us to feel comfortable paying annual costs for “certification”.
Full certification amounts to $900 a year, while certifying only the latest services amounts to $450 a year.
OGC Standard Full Certification Latest Services Services OGC API - Features $150 Certified $150 Certified WCS 2.0.1 $0 Reference $0 Reference WCS 1.1.1 $0 Reference $0 Reference WCS 1.0 $0 Reference $0 Reference WFS 2.0 $150 Certified $150 Certified WFS 1.1.0 $150 Certified $0 Implements WFS 1.0.0 $0 Reference $0 Reference WMS 1.3.0 $150 Certified $150 Certified WMS 1.1.1 $150 Certified $0 Implements WMTS 1.0.0 $0 Reference $0 Reference Data formats and encodings GeoTIFF 1.1 $150 Certified $0 Implements GeoPackage 1.2 $150 Certified $0 Implements How you can help: We would really like confirmation that certification is valuable to the community. If you think it is valuable, please let us know in the Discourse forum or, even better, if you are interested in sponsoring part of the certification, please do speak up! If we do not hear from anyone, we might not pursue formal certification any further.
Many thanks to prior sponsors of this activity including Gaia3D, and OSGeo:UK.
GeoServer 3The big news is that GeoServer 3 crowdfunding campaign phase one has been successful, allowing the project plan milestones to be scheduled.
We are working around the GeoServer 2.28.0 release in September to avoid disruption to the project:
-
Milestone 1 : Preparation (May-July)
Doing everything possible ahead of time before the migration to spring-framework-6.Milestone 1 is already in progress, see the headings below for specific activities.
Milestone 1 activities will be taking place on the
mainbranch ahead of the GeoServer 2.28 release. As tasks are completed, your feedback and continuous testing of nightly builds will be highly appreciated. Please chat to us about how you can automate the testing in your non-production environments. -
Milestone 2 : Migration (August-October)
Requires a coordinated “code-freeze” across nine codebases migrating to spring-framework-6.This activity is going to take careful planning, and we anticipate scheduling an in-person sprint for the migration.
While initial work may occur on a
devbranch, GeoServer 3 will take over themainbranch after the September release of GeoServer 2.28.0. -
Milestone 3: Delivery (November - December)
The moment we have the code-base working again, Milestone 3 activities include continuing the testing of nightly builds, checking integration with downstream applications, and feedback from anyone wishing to work on restoring a community module to GeoServer 3.This pace allows GeoServer 3.0 to be ready in 2026 Q1, respecting our normal time-boxed release cycle.
Milestone 1
Checking in on Milestone 1 activities, there is lots of work to be done!
Spring Framework Preparation, Java 17, and Project and Build SupportTo get the codebase ready for widespread change, Gabriel will be looking at setting up a GeoTools “bill of materials”
pom.xmlfile providing GeoServer and other applications an easy way to manage the currently tested set of dependencies.- Updating to Java 17 is a key requirement for Spring Framework 6 and JakartaEE so expect many of these dependencies to be updated or replaced over the course of GeoServer 2.28 development.
- Spring Framework 6 also removes a lot of deprecated APIs and dependencies, providing work to do for GeoWebCache and GeoServer codebases
The biggest GeoServer 3 Milestone 1 activity is restarting the ImageN project and combining forces with JAI-Ext for a new image processing engine:
- ImageN represents the Oracle donation of the original Java Advanced Imaging codebase to the Eclipse Foundation (using a new name that does not contain “Java”).
- The ImageN project is being restarted, with Andrea and Daniele being recently added to the project.
- Project website has been updated with a slightly revised scope to reflect the addition of the JAI-Ext codebase.
- We will be cutting some unused functionality, such as RMI, and restructuring the maven build to reflect some of the lessons learned with JAI-Ext and GeoTools build practices.
- Andrea has a rough project plan which we will capture as a project board in the weeks ahead.
- Communication is taking place over on the imagen-dev mailing list.
Andrea and Jody are organizing an ImageN Online Sprint for May 26-27 where the bulk of the work will take place. We plan to follow the same approach as the OpenGIS Harmonization activity where refactor scripts are produced, and tested on the GeoTools / GeoWebCache / GeoServer codebases during development.
Spring Security and OAuth2 / OIDC Security ModulesThe next technical challenge is the work needed to update to the next version (6) of the Spring Security Framework. There have been considerable API changes, resulting in the need to completely replace the existing OAuth2 and OIDC community modules. Our existing community modules are based on the deprecated spring-security-oauth library which has now reached end of life. The Spring Security Core library now has OAuth2 support, necessitating a new GeoServer extension that makes direct use of the built-in OAuth2 support.
Andreas Watermeyer (ITS Digital Solutions) has working on these activities:
- GeoServer 2.27.0 includes the upgrade to Spring Security 5.8, and there is a checklist to complete before upgrading further to version 6.
- Andreas has a draft pull request re-implementing the OAuth2 security modules, which we are looking forward to incorporating, and we plan to port all the test cases over to ensure that it covers the same functionality.
Ideally GeoServer 2.28.0 will include both the old and the new Spring Security OAuth2 community modules, allowing everyone to upgrade easily and report back any regressions found.
WicketA big accomplishment in the recent GeoServer 2.27.0 Release is progress towards Wicket 10 by Brad and David:
- Wicket 9
- Wicket Dialog
- Wicket Content Security Policy
There are a few remaining items to work on, such as the Java 17 build, before upgrading to Wicket 10.
It is great that we have already tackled many of the technical challenges above, and have received positive responses from GeoServer 2.27.0 testers.
CrowdfundingGeoServer 3 crowdfunding has completed the Commitment Phase - thank you for your trust and support. We are now contacting supporters to engage with them further.
The following organisations have pledged their support:
Individual donations: Abhijit Gujar, Stefan Overkamp.
-
sur Mappery: You are My World – The Real Hackney Dave
Publié: 12 May 2025, 1:00pm CEST
-
sur gvSIG Team: Heatmap legend in gvSIG Online
Publié: 12 May 2025, 1:00pm CEST
In the latest version of gvSIG Online, a new type of symbology has been included: heatmap legend. This legend allows for the representation of either point density or weighted values through a continuous color gradient.

In the case of point density, it shows the areas where there are more points, which can be very useful to visualize where there are more streetlights in a municipality, where more accidents have happened, etc. In this case, all points have the same weight.
If a field is used for weighting, an example could be data collection stations, such as for temperature, pollution, etc., where the field to be weighted would correspond to those values.
Both types of legends support two gradient options: one in which the cold and warm colors are specified and a gradient is calculated between them, and another in which multiple colors and the percentage of each can be defined.
Other parameters that must be configured include the radius (in pixels), which should be calculated based on the distance between the points that are represented, and pixels per cell.
Additionally, if the layer is configured with a temporary parameter and this legend is applied, it is possible to visualize how the gradients change over time. For example, when displaying a crime layer, we could see whether the areas with the highest number of crimes have shifted over time.
You can see how it works in the following video:
-
sur Mappery: Layover
Publié: 11 May 2025, 1:00pm CEST
Pièce jointe: [télécharger]
Ken discovered these map adorned beer cans and he had to tackle some pics before he opened one.
-
sur Mappery: The MapMan at GeomobSF
Publié: 10 May 2025, 1:00pm CEST


Marc Prioleau and Silas Toms hosted the first Geomob San Francisco event on 15th April. Silas decided to get in the geo-mood with this very mappy outfit. That is some outfit!
-
sur Mappery: Hip Flask series: Peak District
Publié: 9 May 2025, 1:00pm CEST

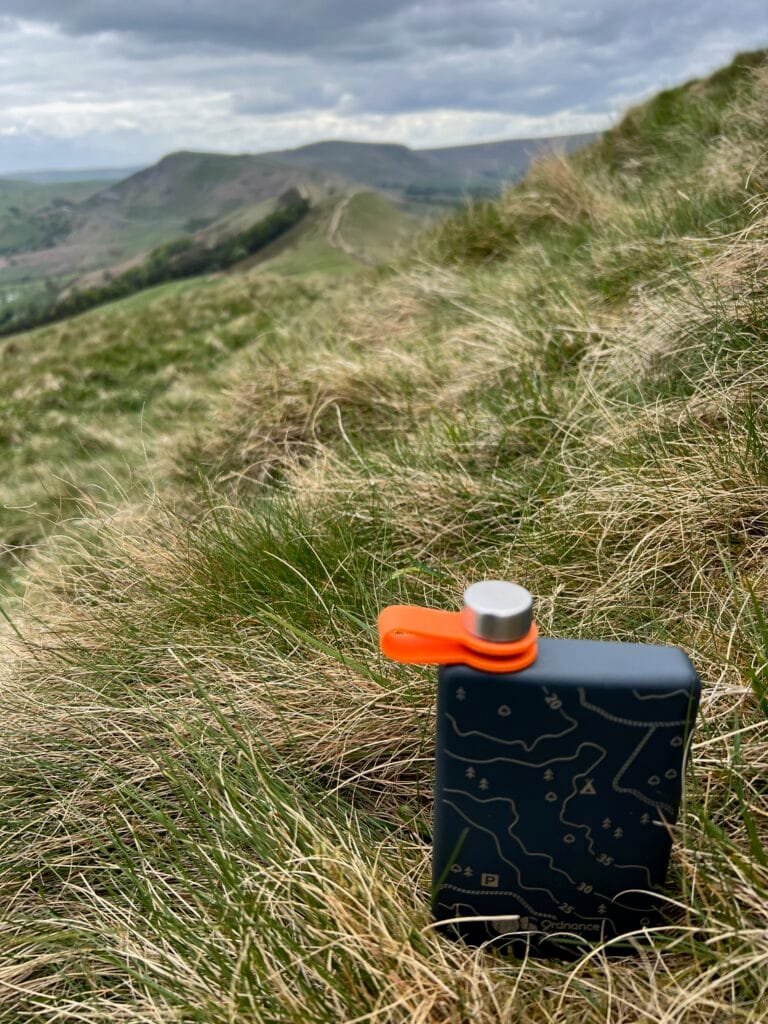
My hip flask is visiting the Peak District. This might be the beginning of a Series.
NB: We are in the UK with amazing whiskies, but the content is a Rum Agricole from Guadeloupe.
-
sur Mappery: Contoured Van
Publié: 8 May 2025, 1:00pm CEST

Ken spotted this van with custom contour decorations while on the road
-
sur Marco Bernasocchi: Crowdfunding: Kreisbögen in QGIS
Publié: 7 May 2025, 6:51pm CEST
Warum sie wichtig sind und wie du helfen kannst.

In der Welt der Geodatenverarbeitung sind Kreisbögen (engl. circular arcs) ein häufig übersehenes, aber enorm wichtiges Element. In QGIS, der führenden Open-Source-GIS-Anwendungen, sind sie bislang nur eingeschränkt unterstützt – und genau das wollen wir ändern.
Was sind Kreisbögen – und warum sind sie wichtigKreisbögen sind geometrische Elemente, die nicht aus geraden Liniensegmenten bestehen, sondern echte Rundungen darstellen. Sie sind definiert über drei Punkte: Anfangs- und Endpunkt sowie Scheitelpunkt (oder Zentrum des Kreises).
Sie finden sich:
- Kreisverkehre
- Einlenker
- bei Planungs- und CAD-Daten,
- und in der Amtlichen Vermessung
Echte Kreisbögen ermöglichen präzisere Analysen und bessere Ergebnisse bei der Weiterverarbeitung. Ohne sie müssen GIS-Systeme Rundungen oft in viele kleine Linienstücke aufteilen (segmentieren), was Genauigkeit kostet und die Daten unnötig aufbläht.
Was ist das aktuelle Problem in QGIS?Im Moment unterstützt QGIS Kreisbögen zwar nativ, in vielen Situationen aber nur bedingt. Stattdessen werden sie intern oft in kurze Liniensegmente aufgelöst – besonders dann, wenn Geometrien bearbeitet, verschnitten oder analysiert werden.
Das führt zu mehreren Problemen:
- Ungenaue Ergebnisse: Aus einer schönen Kurve wird eine gezackte Linie.
- Qualitätsverlust: Dadurch entsteht ein unnötiger Qualitätsverlust
- Fehlerquellen: Manche räumliche Operationen liefern falsche Resultate, weil die Originalgeometrie nicht korrekt erhalten bleibt.
Wenn Kreisbögen in einem Datensatz erhalten sind, in einem anderen dieselben Daten aber als segmentierte Version vorliegen führt das schnell zu Problemen.
Welche Bibliothek ist verantwortlich?Die Kernbibliothek, die geometrische Berechnungen in QGIS übernimmt, heisst GEOS (Geometry Engine – Open Source). GEOS ist extrem leistungsfähig – aber bislang kann sie echte Kreisbögen noch nicht vollständig verarbeiten. Alle GIS-Programme, die auf GEOS setzen, haben deshalb ähnliche Einschränkungen.
Das bedeutet: wenn wir Kreisbögen in GEOS verbessern, profitiert nicht nur QGIS, sondern die gesamte Open-Source-GIS-Community – von PostGIS bis GDAL.
Unser Crowdfunding: wir haben schon die Hälfte geschafft!Um dieses Problem nachhaltig zu lösen, haben wir im Jahr 2024 ein Vorprojekt durchgeführt und eine erste Integration von Kreisbögen ins Geometriemodell von GEOS umgesetzt. Dieses Jahr wollen wir einen Schritt weiter gehen und auch Algorithmen anpassen.
Im April haben wir dafür ein Crowdfunding gestartet. Unser Ziel:
- die Overlay Engine in GEOS fit für Kreisbögen machen
- und darauf aufbauend die Handhabung in QGIS massiv verbessern.

Die gute Nachricht: wir haben bereits die Hälfte der Finanzierung zusammen! Jetzt brauchen wir deine Hilfe, um den Durchbruch zu schaffen.
Jede Unterstützung – ob finanziell, durch Teilen der Kampagne oder einfach durch Weitererzählen – bringt uns einen Schritt näher an ein besseres QGIS für alle.
 Hier geht’s zum Crowdfunding
 Zusammen können wir es schaffen
Die Open-Source-Welt lebt davon, dass Menschen zusammen an etwas Grossem arbeiten. Mit echter Unterstützung für Kreisbögen wird QGIS nicht nur präziser und schneller, sondern auch ein noch stärkeres Werkzeug für die Praxis.
Hilf mit – für bessere Geodaten, für bessere Analysen, für bessere Ergebnisse!
-
sur Mappery: Bever Map Shop
Publié: 7 May 2025, 1:00pm CEST


Reinder sent me this “… at Bever’s: a local shop in The Hague where you can buy stuff for trekking, walking and other forms of leisure and active outdoor life. Looked really nice. “
I’m guessing that Bever’s is the Den Haag equivalent of Stanfords
-
sur FOSSGIS e.V. News: Dienstleister-Liste
Publié: 7 May 2025, 4:00am CEST
Wegweiser für Ansprechpartner zu Lösungen im Bereich OpenStreetMap und Geo-Open-Source-SoftwareSeit November 2021 stellt der FOSSGIS e.V. eine Liste von Firmen und Selbständigen zusammen, die Institutionen und Unternehmen Hilfestellung bei der Suche nach Dienstleistern zu FOSS (Free and Open Source Software) im GIS-Bereich, OpenStreetMap und offenen Geodaten geben soll. In den letzten Monaten haben wir diese Liste aktualisiert und erweitert.
Open Source funktioniert nur dann, wenn alle etwas dazu beitragen, und die “kostenlose” Software und Daten nicht nur benutzen. Viele Unternehmen auf unserer Liste entwickeln selbst bei Open-Source-Software mit, manche Mitarbeiter dieser Unternehmen sind sogar verantwortliche Maintainer von Projekten. Andere Firmen unterstützen das Ökosystem mit Sponsorings oder auf andere Weise. Das wollen wir unterstützen und besser sichtbar machen. Wir haben daher die Firmen auf der Liste gebeten, dass jeweils auf ihren eigenene Webseiten darzustellen, wo das bisher nicht eh schon der Fall war. Und in unserer Liste kann man jetzt nicht nur vermerken, welche Projekte die Firma benutzt, sondern auch ob sie selber aktiv mitentwickeln oder sogar verantwortliche Maintainer stellen.
Jeder Auftraggeber soll selber entscheiden können welcher Dienstleister der richtige ist. Wir können und wollen Ihrer Entscheidung für das eine oder andere Unternehmen nicht vorgreifen. Wir wollen mehr Transparenz in die Entscheidung bringen und es Ihnen leichter machen, die Dienstleister auszuwählen, die Ihren Kriterien genügen. Und wir hoffen natürlich, dass Sie auch explizit nach den Unternehmen schauen, die nicht nur von der Arbeit einer großen Open-Source- und Open-Data-Community profitieren, sondern die sich auch aktiv einbringen.
Für die Dienstleister heißt das: Schreiben Sie auf, was sie tun. Diese Angaben sollten so konkret wie möglich sein und aufzeigen, welche Organisationen oder Projekte (mit Link zu Projekt- und Github-Seiten) wie unterstützt werden. Ihre potentiellen Kunden wollen sich ein Bild von Ihren Aktivitäten machen. Das kann zum Beispiel auf einer speziellen “Open Source”-Seite sein oder ein Teil einer allgemeinen “Über uns”-Seite. Es ist dabei nicht so wichtig, ob sie das Ökosystem durch Spenden oder Sponsoring-Gelder unterstützen oder ihre Mitarbeiter zu Open-Source-Projekten beitragen oder diese sogar maintainen, oder ob sie auf ganz andere Weise etwas tun. Wichtig ist, dass Sie es darstellen und diese Informationen gut zu finden sind.
Die Dienstleisterliste finden Sie unter: [https:]] .
Ihr Unternehmen tragen Sie hier ein: [https:]] . -
sur Mappery: Portolan Charts
Publié: 6 May 2025, 1:00pm CEST
Pièce jointe: [télécharger]

In the Ponta Delgado museum they had these really old navigation charts
-
sur GeoSolutions: GeoSolutions Exhibiting at GEOINT 2025 Symposium
Publié: 6 May 2025, 12:27pm CEST
You must be logged into the site to view this content.
-
sur Camptocamp: Join us at geOcom 2025!
Publié: 6 May 2025, 4:00am CEST
Pièce jointe: [télécharger]
Join geOcom 2025 in Rennes! A key event for geOrchestra users and developers. Talks, demos, and a community sprint. Free registration. -
sur Mappery: Parque Ribeira dos Caldeiroes
Publié: 5 May 2025, 1:00pm CEST
Pièce jointe: [télécharger]

Parque Ribeira dos Caldeiroes is a nature reserve in the north-west corner of San Miguel, Azores centred around an impressive river and waterfall. Thought I would include a pic of me and Toby by the waterfall because …

-
sur Sean Gillies: Bear training week 11 recap
Publié: 5 May 2025, 3:48am CEST
Week 11 was light on running. I balanced workouts, my nagging left Achilles strain, and an extra gnarly project at work. Almost all of my tempo effort was on an elliptical trainer or stationary bike. The level of effort was better than the raw numbers, so I'm not concerned.
7.8 miles running
7 hours, 22 minutes all training
335 ft D+ running
Today I got up extra early to start the Colorado Marathon's 5K event with my family. We parked downtown, took a shuttle bus to the starting line, and ran down the Poudre River Trail to the center of town. My effort was a little disappointing. Heel pain, a massive bout of hay fever, and an unfortunate need to visit a port-o-let held me back. Nonetheless, we had fun seeing the half marathon leaders and cheering other runners from the finish line while waiting for the first marathon finisher to arrive.
-
sur Mappery: At the Bank of Portugal
Publié: 4 May 2025, 1:00pm CEST
Pièce jointe: [télécharger]

There was a small exhibition about the Azores at the Bank of Portugal branch in Ponta Delgada. This lovely old map was in a display case with a model galleon, here is a better pic

We also drooled over this 19C map of Terceira
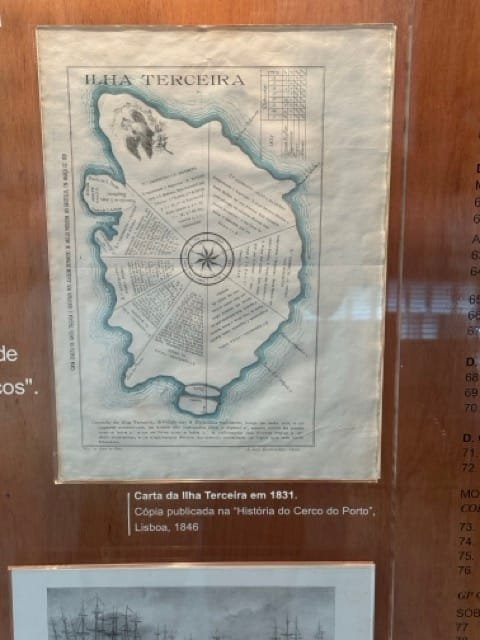
-
sur Mappery: Military Fortifications
Publié: 3 May 2025, 1:00pm CEST
Pièce jointe: [télécharger]

We walked up to these ancient military fortifications on San Miguel island in the Azores, the name means literally “military fortification of the face of the dog” but I have a hunch that isn’t quite correct.
-
sur Mappery: You are standing here
Publié: 2 May 2025, 1:00pm CEST
Pièce jointe: [télécharger]

Had to stop here when we were walking in the Azores and looking out towards America. And yes, I was standing there..

I used Lat Long Data to do the conversion
-
sur Mappery: The Bar that has travelled around the world
Publié: 1 May 2025, 1:00pm CEST
Pièce jointe: [télécharger]
This is one of my son’s favourite bars in Ponta Delgado, Azores, the name translates as Angels’ Corner. Next to the sign it says “The bar that has travelled around the world”
-
sur Martin Davis: Coverage Cleaning in JTS
Publié: 1 May 2025, 12:38am CEST
The JTS Topology Suite has been rolling out the capability to manage polygonal coverages. It supports modelling polygonal coverages as arrays of discrete polygonal geometries. This is simple to work with and allows using all of the wide variety of JTS algorithms. Coverage topology allows operations such as CoverageSimplifier and CoverageUnion to be highly performant and effective.
The key requirement for coverage operations is that the input is a valid polygonal coverage. JTS provides the CoverageValidator to check a dataset to see if it is a valid coverage, and provide full information on the location of topology errors. However, this leaves the question of how to convert a dataset with errors into a valid coverage.
There are two options for fixing coverages: manual editing, and automated cleaning. CoverageValidator provides information to identify the location of all errors. However, manually fixing them is time-consuming, and difficult in environments which lack convenient editing tools. And of course it simply isn't feasible in automated workflows.
What users really want is automated coverage cleaning. This is a major pain point (witness the numerous questions about how to do this; for example, this and this and this). Clearly, cleaning coverages is considered critical!
There are several existing tools to do this:
- mapshaper is perhaps the most popular tool currently. It supports snapping to improve dataset quality, along with overlap and gap merging. It is written in Javascript, which provides surprisingly good performance, but makes it awkward to integrate in other tools.
- pprepair is an academically-advanced algorithm which uses triangulation as the basis for cleaning. It relies on CGAL, which limits appeal for integration
- GRASS v.clean is a long-standing cleaning tool with an extensive set of options for carrying out various kinds of cleaning
But in the JTS/GEOS ecosystem it's been a gap that needs filling (so to speak). So I'm excited to announce the the arrival of the JTS CoverageCleaner.
JTS CoverageCleaner classThe JTS CoverageCleaner class provides the essential capabilities of cleaning polygonal data to form a valid coverage:
- Snapping: snapping vertices and lines eliminates small discrepancies and narrow gaps, and improves the robustness of subsequent processing
- Overlap Merging: of two or more polygons are merged with a neighbouring polygon. The merge target can be chosen to be the neighbour with the longest shared border, the largest or smallest area, or the one with minimum input index (which allows priority-based merging).
- Gap Detection and Merging: Gaps are defined as enclosed empty areas with width less than a distance tolerance. Width is computed as the diameter of the Maximum Inscribed Circle of the gap polygon. (This is an improvement over other tools, which only offer cruder area or roundness-metric tests to identify gaps to be merged.) Gaps can be filled and merged with an adjacent polygon.

Other aspects of cleaning data are provided by separate JTS classes. Invalid polygonal geometries can be preprocessed with GeometryFixer to repair them. CoverageSimplifier can be used to reduce the vertex size of cleaned datasets. And a forthcoming coverage precision reducer will allow controlling the amount of precision maintained (which can reduce the space required for some storage formats).
Algorithm DescriptionThis is a good example of how the breadth of JTS capabilities makes it easier to develop new algorithms:- the SnappingNoder was developed for OverlayNG, and turned out to be ideal for eliminating minor errors and providing a robust basis for the rest of the process
- the Polygonizer allows fast recreation of a coverage topology from the noded linework
- Spatial indexes (STRtree and Quadtree) and the fast predicates of RelateNG provide performance for operating in the discrete geometric domain
- the new fast MaximumInscribedCircle.isRadiusWithin predicate allows using polygon width for gap detection
- Result area: one parent (which identifies the associated input polygon)
- Overlap: multiple parents
- Gap: no parents
 Identifying narrow gaps to be merged via Maximum Inscribed Circle radius
OutputThe output is an array of the same size as the input array. Each element is the cleaned version of the corresponding input element, and the entire array forms a valid polygonal coverage. Due to snapping very small inputs may disappear. The output may still contain gaps larger than the gap width tolerance used. (One way to to detect these is to union the coverage - the result will have holes where gaps exist.) Cleaning can be re-run with a larger tolerance to remove more gaps.ExamplesGiven the number of tools available to clean polygonal coverages, it's slightly surprising that you don't have to look hard to find datasets containing coverage topology errors. But that's good for testing! Here are some examples demonstrating the behaviour and performance of CoverageCleaner.Example 1: Montana County Commissioner DistrictsThis is one of the jurisdiction coverages available here. The dataset contains 177 areas with 470,229 vertices. Running CoverageValidator finds errors at over 12,000 locations: Zooming in on an area containing errors using the JTS TestBuilder Magnify Topology tool shows that errors are caused by small misalignments in the linework of adjacent polygons, creating both gaps and overlaps:
Running the Coverage Cleaner with the default snapping tolerance and a gap width of 10 produces a clean coverage in 0.88 seconds. The effect of snapping removes 2043 overlaps and 1793 gaps. After topology building, merging removes a further 14 overlaps and 12 gaps. (This is determined by running the cleaning process with both default snapping tolerance and a tolerance of 0, and counting the merged overlaps and gap polygons available from the cleaner instance.)Example 2: Communes in France Department 71This example is a dataset representing communes in the French department 71 (Saône-et-Loire). It may have been assembled by aggregating cadastral parcels, which is a common cause of discrepancies due to different data origins. The dataset contains 564 areas with 612,238 vertices. Validating the coverage reveals over 362,000 error locations (and in fact this doesn't represent all of the gaps present).
Zooming shows some example overlaps and gaps. Magnify Topology is not needed since the discrepancies are on the order of metres in size.
Running the Coverage Cleaner with default snapping tolerance and a Gap Width of 50 produces a clean coverage in 23 seconds. The slower performance over Example 1 is due to the much larger number of gaps and overlaps: 29,307 overlaps and 28,409 gaps. They are almost all too wide to be handled by snapping, so they must be merged, which requires more processing.
Here's a before-and-after view of an area of the cleaned coverage, showing the effect of merging gaps and overlaps:

Gap Merging Quality IssuesGiven the size and number of issues in the France-71-communes dataset, it's not surprising that it exhibits two known problems with the current gap merging strategy: spikes creating by merged gaps, and unmerged narrow gap parts.
Here is an example of how merging a gap to an adjacent polygon can create a spike in the result polygon. (Merging overlaps does not produce these kinds of errors, since the overlap was part of the merge target originally.)
 This is an example of a wide gap which is not merged, but which has narrow portions which could be "clipped off" and merged:
Improving the quality of gap merging is an area for further research and development.GEOS and PostGIS PortsAs usual, this work will be ported to GEOS soon, and then exposed in PostGIS as a new coverage function, It should also show up in downstream projects such as Shapely and hopefully QGIS.
Further EnhancementsOverlap and Gap HandlingThere are other possibilities for controlling overlap merging and gap filling. Choosing merge targets could be determined by a priority value on each input area. Gaps could be determined by area or roundness measure criteria, as provided in other systems (although they seem less precise than using polygon width.)
Gap Partitioning and Spike Removal Gaps which are very long can extend along multiple polygons. If a gap of this nature is merged to single polygon it will create a spike in the merged polygon. Instead, it would be better to partition the gap into multiple pieces at polygon nodes and merge the parts separately.
A more complex situation is when a gap contains both narrow and wide portions. An example of this is a parcel coverage with blocks separated by narrow streets and wider intersections and squares. Ideally the narrow parts could be partitioned off and merged, leaving the wide portions unmerged. Gore RemovalGores are narrow "inlets" along the border of in a coverage. They have a similar shape to gaps, but since they are not closed they are not identified as gaps by the cleaning process. They could be identified by a different process, closed off, and then merged (ideally with partitioning as discussed above).
Coverage precision reductionA common requirement in data management is to reduce the precision of data coordinates. For coverages this cannot be done piecewise, but must be performed as a global operation over the entire coverage, since rounding coordinates independently can create line intersections. The SnapRoundingNoder provides an effective way of doing this.
-
sur Mappery: Atlantic Crossing
Publié: 30 April 2025, 1:00pm CEST
Pièce jointe: [télécharger]
We visited my son in the Azores a few weeks ago.
The Azores are pretty much the centre point for any sailors crossing the Atlantic, so lots of sailors stop there to rest, repair and rewstock. Along the edge f the harbour on St. Miguel are a lot of paintings done by people who stopped there and several, inevitably featured some kind of map. Maps painted on stone on an island in the middle of the Atlantic seem like pretty fine Maps in the Wild to me.
-
sur Kartoza: Mapping My World: A Journey with OpenStreetMap
Publié: 30 April 2025, 4:00am CEST
OpenStreetMap is a free, editable map of the world made by a community of mappers. Used for navigation, planning, and more, anyone can contribute, making it valuable for local and global project. -
sur GRASS GIS: GRASS Refreshed Branding
Publié: 29 April 2025, 7:12pm CEST
GRASS has a new logo—and a simpler name We’re excited to share some fresh updates to the GRASS project: a new logo and a small but meaningful change to our name. What’s new The updated logo retains the two most recognizable elements of the GRASS visual identity: The grass — a stylized depiction with multiple narrow leaves and a compact, elongated seed head. The square — rotated 45°, forming the background shape behind the grass. -
sur Lutra consulting: 3D editing tools for Point Clouds
Publié: 29 April 2025, 6:43pm CEST
Edit point cloud (LiDAR) data directly in QGIS 3.42 and later. Discover new 3D editing tools, workflows, and demos for efficient point cloud classification. -
sur Mappery: Lutettia and the Stranger, Wandering in Paris
Publié: 29 April 2025, 1:00pm CEST

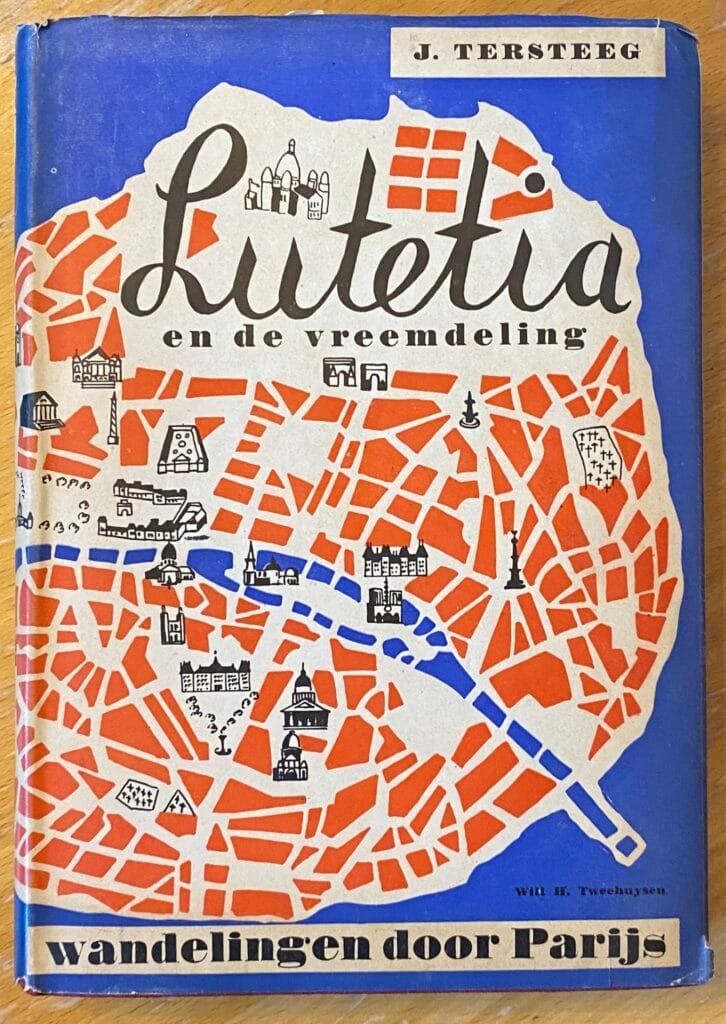
Reinder spotted this beautiful book cover, he said “… cartographically inspired design of a book cover. Book with walks through Paris (in Dutch). Quite charming don’t you think? ” Very very charming!
-
sur Mappery: New Jersey meets Pennsylvania meets New York
Publié: 28 April 2025, 1:00pm CEST

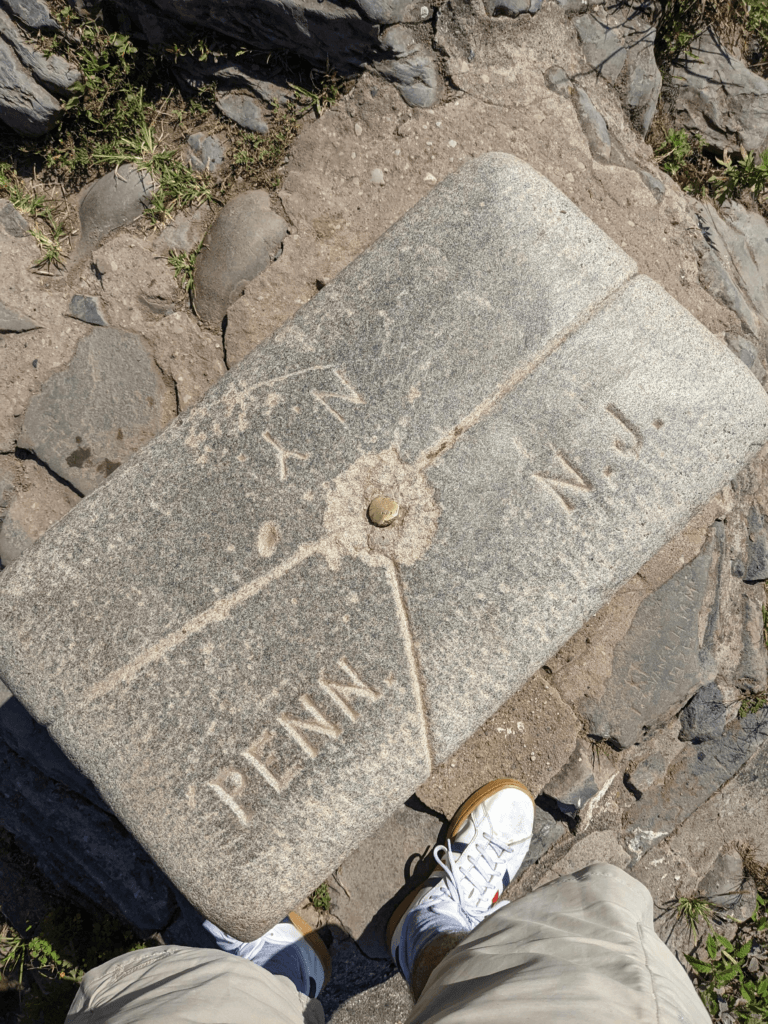
Atanas Enchev shared this with us – standing on the junction of three states.
This is the automatically generated AltText which seems pretty impressive to me (Provided by @altbot, generated privately and locally using Ovis2-8B) “The image shows a stone marker with the inscription “PENN” on the left and “N.J.” on the right, indicating the point where Pennsylvania and New Jersey meet. The marker is rectangular with rounded corners and features a central hole, possibly for a survey marker pin. The stone is gray with visible weathering and etchings. The background consists of a rocky terrain with some grass and dirt. A person’s feet are visible in the foreground, wearing white sneakers with brown soles and beige pants, standing on the stone marker. The perspective is from above, looking down at the marker and the person’s feet.“
So where do you go from here Atanas?
-
sur Sean Gillies: Bear training week 10 recap
Publié: 28 April 2025, 5:51am CEST
Week ten was a fun and productive one. I ran five days in a row, one on the treadmill, with 80 minutes of tempo and hard running or elliptical pedaling.
33.5 miles running
10 hours, 30 minutes all training
4,304 ft D+ running
Sunday I logged my biggest elevation gain and longest run of the season in Horsetooth Mountain Park. After a few days of rain and drizzle, there was water in the creeks, no dust on the trails, and the scents of damp soil and pine bark were in the air. The sand lily and springbeauty continue to bloom, and I saw the first flowering larkspur. At the end of the last long ramp on Towers Road, aka Creeping Death, I found some mountain ball cactus with bright fuschia flowers.

A plump hemisphere-shaped cactus with bright magenta blossoms.
My friend John Bender came along as I was photographing the cactus and we ran together for more than an hour. He has lived adjacent to the park for almost 40 years and is one of the founders of the local trail running community. I'll be cheering him on at Quad Rock in two weeks.
Week 11 will have more tempo running, and instead of a weekend long run, a 5K race with my family, all four of us in the same running event for the first time.

Arthur's Rock in Lory State Park, Colorado, under a clear blue sky.
-
sur Stefano Costa: I libri e le altre cose che ho fatto nel 2024
Publié: 27 April 2025, 2:35pm CEST
Questa è la solita rubrica che scrivo da molti anni. Ci sono quindi delle puntate precedenti per chi volesse leggerle, non sempre brillanti e non sempre cose che riscriverei oggi.
Quest’anno per la prima volta mi sono reso conto che scrivere solo la lista dei libri sarebbe stato un po’ riduttivo, perché ho fatto altre cose di categoria “consumi culturali” e non mi piacciono troppo le barriere artificiali. Perché dovrei elencare un libro brutto ma non dire niente di un podcast che mi è piaciuto e di una mostra per cui mi sono messo in viaggio? O perché dovrei fare tanti articoli separati per ogni categoria?
I libri che mi sono piaciutiAvevo iniziato l’anno leggendo L’incendio di Cecilia Sala e Tutta intera di Espérance Hakuzwimana. Il primo mi è piaciuto ma non in modo esagerato, in vari punti e soprattutto nei capitoli dedicati all’Ucraina mi sono reso conto di non essere il destinatario di questo libro, di non fare parte del “noi” collettivo in cui l’autrice ci butta tutti dentro per farci capire la distanza siderale tra l’Italia e i tre paesi in cui ha lavorato (Iran, Ucraina, Afghanistan). E non ne faccio parte un po’ perché alcune delle cose che il libro racconta già le conosco da tempo (perché gli iraniani odiano gli USA…) e so già cosa non va in quello che “gli italiani” nel loro insieme sanno, nel modo in cui lo stato italiano si pone rispetto a tutte queste altre nazioni. Almeno sapevo qualcosa su Cecilia Sala quando è stata imprigionata, sul suo rapporto con l’Iran.
Tutta intera ha molte sfaccettature. Il libro inizia in modo lieve e poi come un tamburo di guerra inizia a fare sempre più rumore, a narrare le lacerazioni del “fiume calmo” che la protagonista via via prova su se stessa e sul gruppo di ragazz? che, prima a sua insaputa e poi sempre più alla luce del sole le faranno da guida. Una storia vivida di razzismo sulla propria pelle, di una ricchezza umana (e quindi culturale, nel senso più nobile di cultura) che noi, quelli “tutti interi”, non ci sogniamo nemmeno da svegli. La scansione temporale dei capitoli è studiata in modo accurato e le ultime pagine lasciano senza fiato per la ferocia e la speranza che suscitano.
Raja Shehadeh : Dove sta il limite. Attraversare i confini della Palestina occupataQuesto libro era in casa da qualche anno, già letto da Elisa. Leggerlo nel 2024 è solo leggermente più assurdo, insensato, mentre lo sterminio del popolo palestinese prosegue senza sosta con la connivenza di tanti Stati occidentali. La finestra di tempo è sempre la stessa, l’unica con cui si può guardare quella parte di mondo, e inizia nel 1948.
Silvia Avallone: AcciaioIncredibile, veramente incredibile.
Laura Pugno : Sirene
Riuscire in mezzo a queste pagine a stare male, malissimo per la tragedia smisurata che vivono le persone, tutte a modo loro protagoniste. Riuscire a gioire con le lacrime agli occhi per le loro felicità, il loro amore…
Mi ha fatto male solo cercare in rete il nome dell’autrice e scoprire che ha esattamente l’aspetto che mi immaginavo per una delle due protagoniste. Ha reso in qualche modo ancora più lucido tutto il profondo senso di realtà e di umanità.
Come in Cuore nero ho trovato toccante il racconto finemente tessuto di una adolescenza viva, piena, dolorosa e al tempo stesso carica di felicità incontenibile. Mi tocca anche leggere nero su bianco le strade che si dividono nei percorsi scolastici e di vita. Le vite spezzate per sempre e quelle spezzate da sempre nel logorio della provincia (come Tre).
Mi ricordo quando passavo parecchio tempo vicino a Piombino ed era uscito questo libro. Come sempre senza un motivo, non l’ho letto e non mi sono nemmeno domandato se mi potesse interessare. Ogni cosa ha il suo tempo, anche i libri. Anche le navi.Inquietante e meraviglioso. Mi è piaciuto il tema apocalittico tessuto tra biologia e psicologia. Mi è piaciuto che sia un racconto distopico con elementi fantastici. Ho trovato ripugnante il modo in cui la Yakuza e soprattutto gli uomini sguazzano in un potere cruento e senza limiti, ripugnante il modo in cui le donne sono trattate come merce.
Victoire Tuaillon : Fuori le palle. Privilegi e trappole della mascolinità
E le sirene: incredibili creature, descritte in modo un po’ preciso e un po’ vago, con questo comportamento riproduttivo che mette in posizione dominante le femmine/madri. Mi ha colpito il modo inquietante in cui attirano tutt? l? uman?, in cui mandano in tilt sia le élite dominanti che smaniano per controllarle sia i gruppi marginali che vorrebbero difenderle.
Samuel mi è sembrato mosso da dolore e follia, la sua parabola è in gran parte crudele e assurda ma nel finale compie un sacrificio che mo è sembrato purificatore. È una figura tragica, disperata.Un libro potentissimo, pesante, faticoso, doloroso, indispensabile, scritto in modo scorrevole e fa venire voglia di ascoltare il podcast. Mi è dispiaciuto solo che si affronti poco, a maggior ragione nella bella traduzione “critica” italiana, il ruolo della religione cattolica.
Neige Sinno : Triste tigreDolorosissimo. Via via che il testo prosegue è sempre più immenso. nel libro è descritto molto bene il muro che separa chi sa di avere sempre dalla sua il privilegio di essere al sicuro, e chi sa di essere sempre in pericolo. È un muro intersezionale.
Valerie Perrin : TreErano anni che volevo capire cosa stava dietro la copertina di questo libro, un autentico best seller. E sono contento di averlo finalmente letto. C’è la provincia, la fuga dalla provincia, essere sfigat? ma avere chi ti vuole bene, tenersi dentro segreti più grandi di te per troppo tempo, i corpi delle ragazze e dei ragazzi. Fare musica. Non mangiare animali. Insomma, mi è piaciuto moltissimo! I protagonisti hanno la mia età attuale, c’è musica a pacchi, adolescenza perduta. Ci ho trovato tanti legami con Cuore nero.
Silvia Avallone : Cuore neroQuesto libro è veramente molto intenso, gonfio di purezza, liberatorio per come ad ogni pagina si smonta qualcosa di rotto per farne altro. Ho pianto almeno 30 volte durante la lettura. La costruzione della cronologia alternata tra passato e presente, che ormai è un tratto distintivo di tanta narrativa, è molto raffinata.
Viola Ardone : Grande meraviglia
A tratti ho pensato che sia più sincero sulla montagna questo romanzo di tanto Cognetti.Ho visto Oliva Denaro nella trasposizione teatrale, ma è il primo libro di Viola Ardone che leggo. L’ho trovato molto toccante e commovente, soprattutto per la fragilità del protagonista.
Mario Lodi : Il paese sbagliatoUn libro che ho conosciuto tramite Sandro Ciarlariello e che mi interessava molto visto che ho due figli all’inizio del percorso di scuola. È una vera bomba, accurato, un testo politico di altissimo livello e il racconto di una scuola come poteva essere.
bell hooks : la volontà di cambiareIl libro è di lettura scorrevole ma la forma risente molto del modo in cui sono scritti i saggi in inglese americano (un po’ come ho notato per David Graeber). Quindi la stessa frase torna più volte nel giro di poche pagine. Il contenuto di questo libro è una bomba e non stupisce che sia rimasto fino a poco tempo fa non tradotto. Andrebbe contestualizzata meglio la figura dell’autrice, perché solo dopo un po’ si capisce la profondità della condizione intersezionale di donna nera, il rapporto conflittuale con il femminismo bianco. Questo è un libro scritto per gli USA e quindi alcuni concetti presentati come universali sono forse un po’ zoppicanti altrove, ma è comunque un riferimento importante. Molte idee sono le stesse promosse dall’associazione Maschile plurale, che ho sentito sul podcast di Internazionale qualche settimana fa. Molte sono quelle raccontate dal padre di Giulia Cecchettin. Il libro parla di tanti aspetti di mascolinità tossica che mi riguardano, soprattutto nel rapporto tra genitori e figli. Ora io sono il padre.
Ho finito il 2024 leggendo l’incommensurabile Solenoide di Mircea C?rt?rescu. Piccola parentesi: erano anni che volevo trovare libri di narrativa romena ma per mia incapacità non ci ero riuscito. Quando c’è stata la premiazione del Nobel ho letto il nome di C?rt?rescu tra i possibili vincitori, e mi sono subito messo a leggerlo.
Le mostreA ottobre c’è stata una mostra sull’archeologia di Imperia a Imperia. Ci tengo molto perché l’ho fatta io insieme al mio ex collega Luigi Gambaro con un grande lavoro di tante altre persone. Non è durata molto ma è stata importante per la città.
A dicembre siamo andati a vedere una mostra di Tina Modotti a Bologna, e anche se lei è molto conosciuta non avevo mai capito attentamente l’importanza e la varietà della sua vita, come fotografa e non solo. Ne ho approfittato per andare a visitare anche quella su Dominique Goblet all’ex chiesa di San Mattia, che mi è piaciuta moltissimo, ho anche acquistato il volume pubblicato da Sigaretten.
I podcastPer una parte del 2024 ho avuto degli auricolari bluetooth funzionanti, e ho ascoltato parecchi podcast: Antennapod dice che ho passato 97,6 ore ad ascoltarli.
Sicuramente quello più notevole è stato C’è vita nel Grande Nulla Agricolo, di cui ho ascoltato le prime tre stagioni in attesa della quarta. È un podcast indipendente ma molto curato, mi ha rapito subito per la colonna sonora che mi ha fatto venire in mente Fuga da New York, l’ambientazione nella provincia profonda, l’orrore in agguato nei vecchi misteri del paese tra personaggi assurdi e atterraggi alieni. D’altra parte sono cresciuto nel “paese dei marziani”…
Ho ascoltato Polvere, dedicata all’omicidio di Marta Russo. Non amo il true crime ma qui il tema principale si sdoppia tra una giustizia che non sa funzionare e decide di accanirsi su qualcuno che deve essere colpevole, e dall’altro il funzionamento intimo della nostra memoria, che è molto molto più fragile di quello che ci hanno insegnato a credere. È scritto molto bene.
TOTALE è un podcast “varietà” che affronta in ogni puntata un tema di attualità. Jonathan Zenti è molto bravo e pungente, riesce sempre a portare il discorso oltre i limiti che uno si aspetta all’inizio. Il tema portante è che se non ci salviamo dal capitalismo tutte insieme, il capitalismo continuerà la distruzione già in atto.
Love bombing lo avevo già iniziato negli anni precedenti ma ho proseguito l’ascolto. Non è un podcast semplice, perché le storie sono sempre dolorose e a volte l’unico “lieto fine” è quello di riuscire almeno a raccontarle, ma non sempre. Io ne raccomando l’ascolto perché affronta in modo serio, documentato e rispettoso temi molto gravi che ruotano intorno alla stima di sé, alla gestione delle relazioni tossiche in coppia o in gruppo, alla ricerca del benessere, senza distinzioni di genere, di età, o altro.
Sonar è un podcast de Il Post in cinque puntate sui cetacei e sui capodogli in particolare. Racconta molte cose interessanti sui modi di comunicare tra animali e cetacei in particolare, sul modo in cui per molto tempo questi animali sono stati sterminati fino a metterne in pericolo la sopravvivenza, sulle differenze di linguaggio tra diversi gruppi sociali e clan. L’ultima puntata sull’utilizzo dell’intelligenza artificiale per la comprensione del linguaggio dei capodogli mi ha lasciato un po’ perplesso.
L’invasione è un altro podcast de Il Post, dedicato agli indoeuropei. Il titolo è molto forte, e secondo me è una scelta appropriata. Si sviluppa in cinque puntate tra archeologia, linguistica e genetica, tutte ben documentate. Lascia un po’ perplessi l’ultima puntata dove tutto quello che è stato raccontato sembra venire messo da parte per dire che in fondo gli indoeuropei si sono affermati in modo graduale e indolore (o comunque non più doloroso rispetto alle consuetudini del tempo), ma senza spiegare perché siano riusciti a cancellare quasi tutte le altre lingue della vecchia Europa. Insomma, per essere spiegato bene l’ho trovato un po’ inconcludente.
10 e 25 è un podcast di Slow News, a cui ho anche contribuito con una donazione. Parla della strage di Bologna del 2 agosto 1980, a partire dalle testimonianze di chi era lì, e poi via via si passa ai depistaggi, alle trame eversive dei fascisti, alla P2 di Licio Gelli e infine, ma non viene spiegato molto bene, anche della CIA (fatto che non può sorprendere nessuno), il più ampio dei “cerchi concentrici” che sono stati descritti dalla magistratura. Peccato che non ci sia una ultima puntata riassuntiva. C’è un archivio consultabile di tutti i documenti.
Ci sono poi alcuni podcast “correnti” come Il Mondo di Internazionale, Il giusto clima su Radio Popolare con Gianluca Ruggeri di ènostra, Stories di Cecilia Sala, il Nuovo baretto utopia di Kenobit. Tutti diversi, li ascolto spesso, anche se mai a cadenza fissa.
I filmSiamo andati al cinema a vedere Diamanti di Ozpetek, un regista che non mi piace particolarmente (da profano del cinema, i suoi film mi sembrano un po’ tutti uguali). Questo invece è molto particolare e potente, liberatorio.
Ho visto #likemeback su RaiPlay. Il film è ambientato lungo le coste della Croazia. Una vacanza estiva in barca tra tre ragazze italiane prende una brutta piega dopo la partenza spensierata. O forse la brutta piega era insita nell’incipit di un viaggio lontano dalla città, dalle famiglie e dalle altre amicizie ma costantemente rilanciato in rete tra social, stories, follower e compagnia. O forse la brutta piega è quella che hanno preso le vite delle persone di 20 anni o giù di lì, almeno questo sembra volerci dire il film. Vite schiacciate tra ansia da prestazione globale, paura di rimanere fuori e complessiva solitudine. E vite in cui essere giovani e belle non basta mai. I dialoghi misti in italiano e inglese creano una atmosfera strana e danno un ritmo tutto sommato lento, come le onde del mare.
Le serieNon sono mai stato appassionato di serie.
Nel 2024 ho guardato Silverpoint, una serie per teenager a tema fantascienza e mistero. Episodi brevi, molto semplice e leggera, ma è simpatica.
Il teatroA marzo abbiamo visto “Pa’”, uno spettacolo su Pierpaolo Pasolini, o forse sarebbe meglio dire con Pasolini. Luigi Lo Cascio interpreta Pasolini in versi e ossa. Non siamo arrivati molto preparati ed eravamo anche un po’ stanchi, ma lo spettacolo è intenso e, passatemi il termine, difficile. La recitazione è a ritmo serrato e in metrica: anche le frasi più semplici diventano piccoli scogli da scalare. Il percorso è autobiografico, da un momento antecedente al concepimento fino alla morte, forse oltre la morte stessa. Viene portato in scena un Pasolini molto intimo e profondamente lirico, anche quando questo si manifesta in modo eccessivo. Ma i passaggi politici, che ruotano intorno alla morte del fratello, sono potentissimi e tragicamente attuali.
Ad aprile abbiamo visto insieme Oliva Denaro. Ambra Angiolini è molto brava, e lo sapevo già ma non mi era ancora capitato di vederla dal vivo. È uno spettacolo forte e molto attuale.
In autunno ho visto Roberto Zucco, molto cupo e tragico. È un’opera complessa di cui non sono riuscito a capire tutto, avrei avuto bisogno di una spiegazione.
Infine ho visto La traiettoria calante. Uno spettacolo in forma di monologo che parla del crollo del Ponte Morandi a Genova. L’autore/attore è giovane e molto bravo, ma non mi è piaciuto molto il modo in cui veniva affrontata la tragedia, quasi da standup comedy.
I viaggiAbbiamo visitato diverse città: Ravenna, Milano, Roma, Bologna, in modi e tempi diversi, qualcuna in giornata, altre per più giorni.
Abbiamo fatto una vacanza estiva in Corsica, l’ultima volta ci eravamo stati nel 2007.
Un po’ è un privilegio, si capisce, poter fare così tanti viaggi con tutta la famiglia. Un po’ anche una questione di priorità, per noi soprattutto conta andare in giro e vedere posti diversi e persone diverse, anche senza fare cose complicate.
-
sur Mappery: The London Underground in Cross Stitch
Publié: 27 April 2025, 1:00pm CEST

“A Girl on the Net” shared this amazing piece of needle work, the London Underground map in cross-stitch, complete with the key to lines and interchanges.

She commented “Nerds may note that:
a) the Vicky line is unfinished (for various reasons, it was PERFECT timing for her to give this to me now, and she will finish that line later, DO NOT even THINK about being a dick and commenting on this when she’s made such an incredible thing)
b) the Overground has since been renamed and recoloured (ALL London transport stuff evolves and changes, that is the beauty of it and why I love it – she’s annoyed by this but I am not in any way).”If Giuseppe Sollazzo is reading, the challenge has been laid on your table!
-
sur Stefano Costa: Two new releases for Total Open Station
Publié: 27 April 2025, 12:44am CEST
A few weeks ago the Total Open Station repository saw a burst of activity, when one blocking issue was finally solved, and that allowed me and the other contributors to release in a short cycle the long awaited 0.6 version, followed by the 0.7 version.
Version 0.6 is almost entirely the work of psolyca, who added full support for LandXML as both input and output format. The subset of LandXML that is supported is specifically targeted to survey data and we are looking forward to seeing reports from users in the field. There are many applications that are compatible with LandXML. During the 0.6 release cycle, the project adopted a code of conduct, the creation of a Windows portable app (click-and-run, even from a USB stick) was automated, as the continuous testing of the code.
Version 0.7 is a much simpler story. We switched to the new standard pyproject.toml configuration file for the project metadata, ensuring a cleaner development environment, and we added a variant of the existing CSV output format that is compatible with the LandSurveyCodesImport plugin for QGIS.
Speaking of QGIS, our contributor Enzo Cocca has created a beautiful plugin for using Total Open Station inside QGIS, with a dedicated interface for the same underlying functionality. For our next release, we have planned to bring some changes and new features that were added in the plugin repository, and align the version that is used (currently 0.5.3).
The homepage of the project is always at [https:]] with links to the documentation and downloads. We will be happy to hear your reports and accept your contributions to the development of the software.
-
sur Mappery: All Roads Lead Home
Publié: 26 April 2025, 1:00pm CEST
Pièce jointe: [télécharger]

A beauty from Dean, can you work out the location?
-
sur Mappery: Bannau Brycheiniog Visitor Centre
Publié: 25 April 2025, 1:00pm CEST


Joe Davis shared this pic from the Brecon Beacons National Park visitor centre
-
sur QGIS Blog: QGIS Grant Programme 2025 Results
Publié: 24 April 2025, 3:53pm CEST
We are extremely pleased to announce the six funded proposals for our 2025 QGIS.ORG grant programme. Funding for the programme was sourced by you, our project donors and sponsors! Note: For more context surrounding our grant programme, please see: QGIS Grants #10: Call for Grant Proposals 2025
These are the proposals:
- Trusted Projects and Folders
- Port SQL Query History to Browser
- Add screenshots to PyQGIS reference documentation
- Coverity Scan cleanup
- SIP Incremental builds
- Adopt wasm32-emscripten as a build target for QGIS
As usual, we provide a summary of the proposal discussions.
Since the total requested budget is equal to the available budget, there is no need for a voting this year.
On behalf of the QGIS.ORG project, I would like to thank everyone who submitted proposals for this call!
-
sur Mappery: El Chalten
Publié: 24 April 2025, 1:00pm CEST
Robert Simmon shared this pic of a road sign approaching El Chalten in Argentina. It reminds me of the second post on the site when Ken and I had the idea to start Mappery.


-
sur [Équipe Oslandia] Aurélie Bousquet, ingénieur SIG
Publié: 24 April 2025, 8:40am CEST par Caroline Chanlon
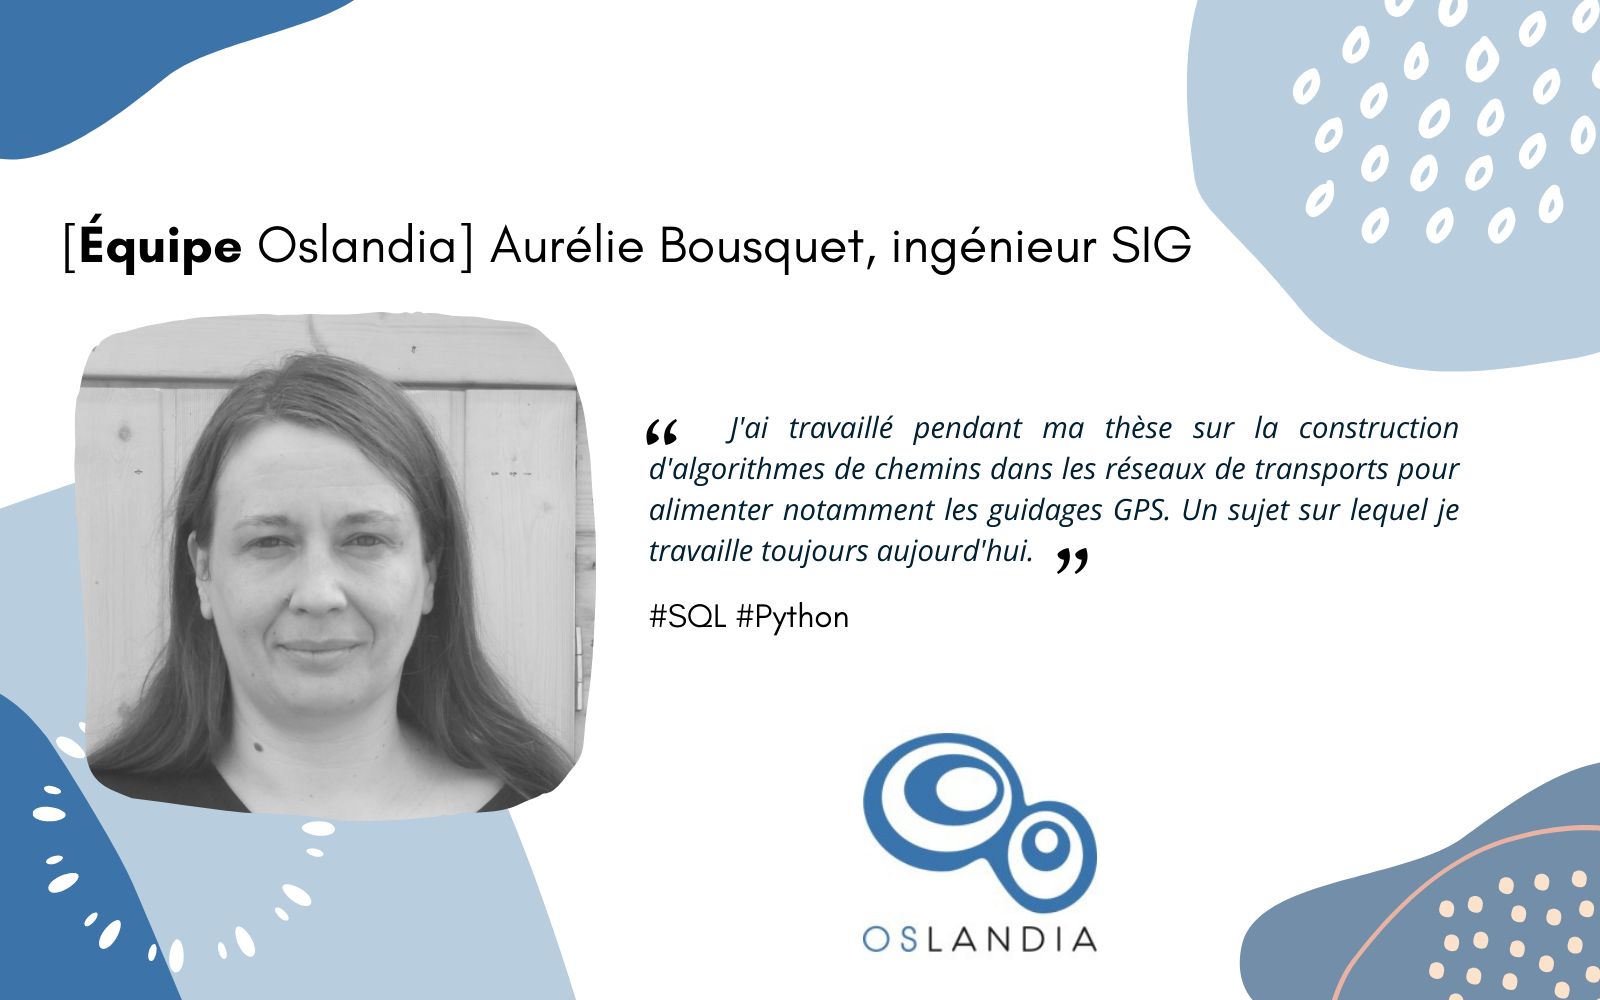
Passionnée de sciences en général, Aurélie se dirige vers une école d’Ingénieur en maths appliquées et informatique à l’INSA de Rouen. Elle réalise plusieurs stages dont un stage dans la recherche qui la motive à faire une thèse en recherche opérationnelle à Lyon à l’Institut National de Recherche sur les Transports et leur Sécurité.
« J’ai travaillé pendant ma thèse sur la construction d’algorithmes de chemins dans les réseaux de transports pour alimenter notamment les guidages GPS. Un sujet sur lequel je travaille toujours aujourd’hui. »
Après sa thèse, Aurélie passe un concours de la fonction publique « Ingénieur des travaux publics de l’État » puis travaille dans différents organismes toujours sur les thématiques transports et aménagement du territoire : DREAL à Lille, Cerema à Lyon puis dans une DDT à Mâcon.
« Pendant cette période de 13 ans, j’ai été amenée à réaliser des études, évaluer l’opportunité des aménagements, animer la communauté technique, développer des outils SIG notamment des plugins QGIS. »
Elle participe d’ailleurs à une formation dispensée par Oslandia

Aurélie fait le choix de la disponibilité pour rejoindre Oslandia en juin 2023 à un poste d’ingénieur SIG.
Son quotidien : le développement de plugins QGIS et la construction d’applications SIG en SQL et Python.
Projets emblématiques- Itineriz avec le calculateur sur la logistique urbaine : un projet développé en amont des Jeux Olympiques et Paralympiques pour orienter les livraisons des véhicules utilitaires dans Paris.
- Contribution à la bibliothèque PgRouting pour développer un algorithme de calcul d’itinéraires plus performant que ceux déjà en place. [https:]]
SQL et Python
PhilosophieFaire simple et léger quand c’est possible !
Oslandia en 1 motOpen source !
-
sur Adam Steer: Counting trees in sparse woodland with OpenDroneMap, PDAL and QGIS
Publié: 24 April 2025, 6:11am CEST
This demonstrates a method for counting trees using a backpackable mini drone, and a completely open source workflow. If you like it / find value in it, feel free to press the donate buttons at the bottom of this page – or get in touch for larger, longer term projects. What is the rationale for… Read More »Counting trees in sparse woodland with OpenDroneMap, PDAL and QGIS -
sur Nick Bearman: GISRUK 2025 in Bristol
Publié: 24 April 2025, 3:00am CEST
Last week I was fortunate to be able to attend GISRUK 2025, in Bristol, UK. I am a regular at the GISRUK conference series and it is always fascinating to see the latest work in GIS in the UK.
This year it was hosted by University of Bristol, which gave me an opportunity to see a little of Bristol as well. I had a lovely walk up Cabot Tower, Brandon Hill, with some spectacular views of the city, it being the highest point in Bristol.

The keynote presentations are always very good at GISRUK, and this year we had three fascinating ones. Urska Demsar talked about her work linking animal movement and human mobility, which is a great example of two areas that use similar techniques but have completely different terminology, and her work to create a new framework to link these two areas will create gains in both fields by the sharing of techniques.
Michele Acuto gave a fascinating insight into Data after Dark: Shedding (Geospatial) Light onto the Night-time Economy. It is a world who we can easily forget, those who work at night. About 26% of UK employed people work at night, and often they are ignore from our analysis of cities. Transport networks can provide some insights, with many global cities transport networks non-existent from ~2am - ~5am. Transaction data can provide an interesting insight into this, but about 25% of night-time activity doesn’t involve a financial transaction, so there are large segments of this activity that are difficult to capture in data. Michele encouraged us go out at night and think about who we see - particularly those who are working.
Stef De Sabbata gave the final keynote titled What is geo/spatial about (geo)ai? Here she talked about going back to the basics of AI and thinking about what is the prior knowledge (“priors”) that AI has about geospatial data. There appear to be more than we might initially think, for example, the concept of ‘cities’ appears to be present, as well as some concept of latitude and longitude.
This year I was also presenting a paper, Location-allocation and public transit: An update on UCL student teacher placements, which was an update on the location allocation work I have been doing with spopt and UCL IOE. It was great to share some of the experiences and challenges of working in such a diverse team, as well as sharing the benefits the tool would bring to the Placements team in IOE. See Writing & Presentations for links to the paper and the slides.
Finally it was a great opportunity to network and link up with new and existing colleagues and catch up on the latest developments.
I also had two other roles during the conference. Firstly, I, along with Jonny Huck, was judging entries for the GISRUK & OSGeo:UK GoFundGeo Award, a grant to help the recipient to make spatial analysis code easily adoptable by others through the provision of an open source code repository, tool or plugin. We are very happy to confirm that the GoFundGeo winner is Melissa Barrientos Triñanes, with her work on Utilising open data to enhance park safety for women and girls in Bradford: A spatial analysis approach.. We liked this as a nice clear project with clearly identifiable outputs that could be useful to a wider audience.
Secondly, a new initiative this year is that the GIScRG (GISc Research Group) of the RGS-IBG is putting on a session ‘Best of GISRUK’ at the RGS Annual International Conference, which this year is at University of Birmingham from Tue 26 to Fri 29 Aug. We are inviting all of the prize winners to present their work in our session, in order to get more people outside GIS to hear about how GIS can be useful. Congratulations to all of the winners:
- Best Poster - Sam Denney - School-level factors influencing NEET outcomes in England
- Best Paper by ECR - Jessica Hepburn - Parks, Place and Equality: Mapping access to different park typology in Britian’s 20-minute neighbourhood
- Best Paper - Adam Dennett - GIS vs. The City Council: Data analytics, collective intelligence and policy dust-ups
- Best Paper in Spatial Analysis - Chris Larkin - Integrating Low Traffic Neighbourhoods into UK Cycle Network Planning
Congratulations to all the winners and we hope to see you at the RGS conference in Birmingham.
-
sur Mappery: NoCal
Publié: 23 April 2025, 1:00pm CEST

Cartonaut spotted this map of San Francisco peninsula for exclusivefresh.com on the back of their fish delivery van. A great pic at 60mph!
-
sur Mappery: Frico Wines
Publié: 22 April 2025, 1:00pm CEST


Doug Greenfield said “Bottle of red cuz dry January is over thank goodness”. Who are we to disagree?
-
sur gvSIG Team: Integración del Gestor de Expedientes de SEDIPUALBA con gvSIG Online
Publié: 22 April 2025, 12:17pm CEST
Hace un tiempo atrás, hablamos del nuevo plugin ETL (Extract, Transform and Load) integrado en la plataforma de gvSIG Online,que permite realizar cualquier integración, transformación, edición… geoespacial de datos.
Hoy queremos compartir una integración que se ha estado desarrollando recienteemente y que mejora significativamente la gestión administrativa y geográfica en las entidades locales: la conexión entre el gestor de expedientes SEGEX de SEDIPUALBA y la plataforma gvSIG Online.
El resultado es una potente funcionalidad que permite, por ejemplo, identificar todos los expedientes asociados a una parcela o localizar en el mapa los elementos vinculados a un expediente concreto. Todo ello sin necesidad de duplicar información ni modificar los sistemas de origen.
En el siguiente vídeo mostramos cómo se realiza la conexión entre ambas plataformas y los beneficios que aporta.
Esta iniciativa refuerza el compromiso de la Asociación gvSIG con el desarrollo de soluciones abiertas, interoperables y orientadas a mejorar la eficiencia en la administración pública.
-
sur gvSIG Team: Curso-Concurso gvSIG Batoví: Lanzamiento de un proyecto que trasciende fronteras
Publié: 22 April 2025, 10:42am CEST

En el Ministerio de Transporte y Obras Públicas (MTOP) de Uruguay se realizó el lanzamiento oficial de la 8ª edición del curso-concurso gvSIG Batoví, una iniciativa que desde sus comienzos ha convocado a cientos de estudiantes y docentes de todo el país, además de participantes de Colombia, México, Cuba y Madrid.
El proyecto invita a presentar propuestas geográficas que aborden problemáticas locales desde una perspectiva territorial, en sintonía con los Objetivos de Desarrollo Sostenible (ODS) promovidos por la Organización de las Naciones Unidas (ONU). “Es un proyecto que se ha transformado en una política de Estado que ha atravesado los distintos períodos de gobierno y es nuestra aspiración que siga creciendo y fortaleciéndose durante este período”, expresó el director nacional de Topografía, Arq. Felipe de los Santos.
Desde 2011, la dirección nacional de Topografía promueve este tipo de experiencias formativas mediante un convenio con Ceibal y la Asociación gvSIG. A partir de 2017, el curso-concurso ha ofrecido oportunidades de crecimiento tanto a estudiantes como a docentes, generando impactos positivos en las comunidades participantes.
Durante el acto de lanzamiento, la subsecretaria de Transporte, Claudia Peris, destacó el potencial transformador de este proyecto y valoró su alcance. Por su parte, Felipe De los Santos, expresó que este evento representa un gran desafío y un enorme orgullo para su cartera, por dos razones fundamentales. Primero, porque “forma parte de las primeras acciones” orientadas a “fomentar el trabajo colaborativo dentro y fuera del Ministerio. Queremos consolidar espacios de sinergia entre quienes diseñamos y ejecutamos políticas públicas en todo el territorio nacional”. Segundo, porque este proyecto ha sabido sostenerse en el tiempo, “ha atravesado los distintos períodos de gobierno”, consolidándose como una verdadera “política de Estado”.
De los Santos también subrayó que la iniciativa “ha trascendido fronteras”, con participación de estudiantes y docentes de Colombia, México y Cuba, así como de referentes de universidades latinoamericanas y europeas como la Universidad Politécnica de Madrid, la Universitat Oberta de Catalunya y la Universidad Central Marta Abreu de las Villas.
Los proyectos desarrollados en el marco del concurso han abordado temáticas clave como la conservación ambiental, el mejoramiento del espacio urbano y barrial, la participación ciudadana y los derechos colectivos, contribuyendo desde una mirada integradora a la construcción de ciudad y territorio.
Las inscripciones y bases del curso-concurso estarán disponibles a partir de mayo en el sitio web institucional del MTOP. Esta convocatoria está dirigida a estudiantes y docentes de nivel medio de Educación Secundaria y de UTU.
En la actividad también estuvo presente la directora general de Secretaría, Yenny Merlo; el director nacional de Vialidad, Federico Magnone; el jefe del departamento de Geomática, Sergio Acosta y Lara; el sub gerente de Desarrollo Profesional Docente, Nicolás Ambrosi; la inspectora nacional de Geografía y Geología, Prof. Magister Mónica Canaveris.
-
sur gvSIG Batoví: Curso-Concurso gvSIG Batoví: Lanzamiento de un proyecto que trasciende fronteras
Publié: 21 April 2025, 9:48pm CEST
 Click en la imagen para abrir el enlace
