
Vous pouvez lire le billet sur le blog La Minute pour plus d'informations sur les RSS !
Canaux
5658 éléments (332 non lus) dans 55 canaux
 Dans la presse
(71 non lus)
Dans la presse
(71 non lus)
-
 Cybergeo
(15 non lus)
Cybergeo
(15 non lus) -
Revue Internationale de Géomatique (RIG)
-
SIGMAG & SIGTV.FR - Un autre regard sur la géomatique
(5 non lus)
-
Mappemonde
(30 non lus)
-
Dans les algorithmes
(21 non lus)
Du côté des éditeurs
(16 non lus)
-
Imagerie Géospatiale
-
Toute l’actualité des Geoservices de l'IGN
(11 non lus)
-
arcOrama, un blog sur les SIG, ceux d ESRI en particulier (5 non lus)
-
arcOpole - Actualités du Programme
-
Géoclip, le générateur d'observatoires cartographiques
-
Blog GEOCONCEPT FR
Toile géomatique francophone
(245 non lus)
-
Géoblogs (GeoRezo.net)
-
Conseil national de l'information géolocalisée
(171 non lus)
-
 Geotribu
(16 non lus)
Geotribu
(16 non lus) -
Les cafés géographiques
(4 non lus)
-
UrbaLine (le blog d'Aline sur l'urba, la géomatique, et l'habitat)
-
Icem7
-
Séries temporelles (CESBIO)
(1 non lus)
-
Datafoncier, données pour les territoires (Cerema)
(5 non lus)
-
Cartes et figures du monde
(15 non lus)
-
SIGEA: actualités des SIG pour l'enseignement agricole
-
Data and GIS tips
-
Neogeo Technologies
(3 non lus)
-
ReLucBlog
-
L'Atelier de Cartographie
-
My Geomatic
-
archeomatic (le blog d'un archéologue à l’INRAP)
-
Cartographies numériques
(19 non lus)
-
Veille cartographie
(1 non lus)
-
Makina Corpus (6 non lus)
-
Oslandia
(4 non lus)
-
Camptocamp
-
Carnet (neo)cartographique
-
Le blog de Geomatys
-
GEOMATIQUE
-
Geomatick
-
CartONG (actualités)

opensource
-
sur GeoServer Team: GeoServer 2.25.2 Release
Publié: 18 June 2024, 2:00am CEST
GeoServer 2.25.2 release is now available with downloads (bin, war, windows), along with docs and extensions.
This is a stable release of GeoServer recommended for production use. This release is made ahead of schedule to address an urgent bug or security vulnerability (see CVE-2024-36401 below). GeoServer 2.25.2 is made in conjunction with GeoTools 31.2, and GeoWebCache 1.25.2.
Thanks to Jody Garnett (GeoCat) for making this release on behalf of GeoCat customers.
Security ConsiderationsThis release addresses security vulnerabilities and is considered an essential upgrade for production systems.
- CVE-2024-36401 Critical
- CVE-2024-34696 Moderate
- CVE-2024-35230 Moderate
- CVE-2024-24749 Moderate
The details of this vulnerability will be made available at the end of the month providing an opportunity to update.
The use of the CVE system allows the GeoServer team to reach a wider audience than blog posts. See the project security policy for more information on how security vulnerabilities are managed.
Demo Requests page rewrittenThe Demo Request page has been rewritten to use JavaScript to issue POST examples. This provides a much better user experience:
- Show Result lists the response headers to be viewed along side the returned result (with an option for XML pretty printing).
- Show Result in a New Page is available to allow your browser to display the result.
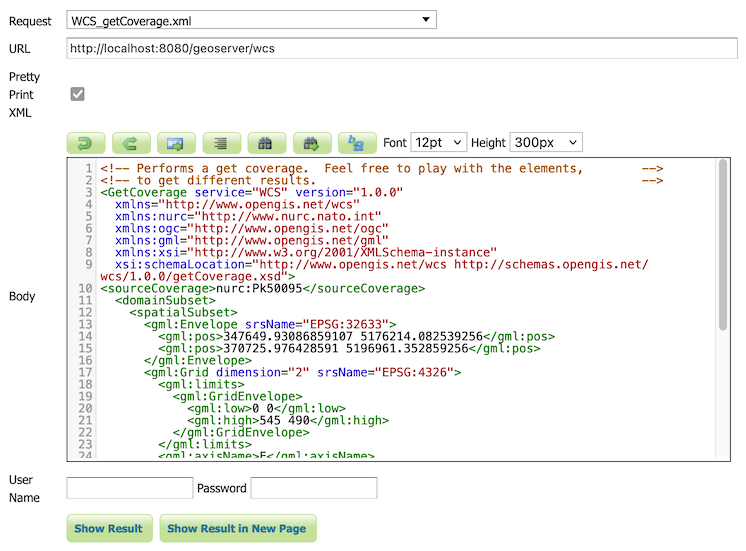
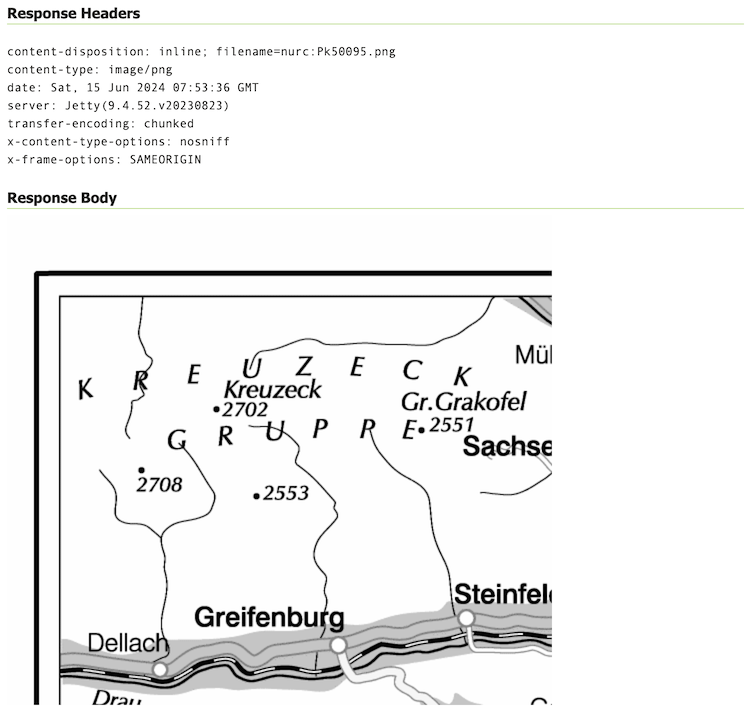
The WCS Request Builder and WPS Request Builder demos now have the option to show their results in Demo Requests page. Combined these changes replace the previous practice of using an iframe popup, and have allowed the TestWfsPost servlet to be removed.
For more information please see the Demo requests in the User Guide.
Thanks to David Blasby (GeoCat) for these improvements, made on behalf of the GeoCat Live project.
- GEOS-11390 Replace TestWfsPost with Javascript Demo Page
New Feature:
- GEOS-11390 Replace TestWfsPost with Javascript Demo Page
Improvement:
- GEOS-11351 Exact term search in the pages’ filters
Bug:
- GEOS-7183 Demo request/wcs/wps pages incompatible with [HTTPS]
- GEOS-11416 GeoPackage output contains invalid field types when exporting content from PostGIS
- GEOS-11430 CiteComplianceHack not correctly parsing the context
Task:
- GEOS-11411 Upgrade to ImageIO-EXT 1.4.11
- GEOS-11426 Rework community dependency packaging to use module’s dependencies
- GEOS-11429 Split COG community module packaging based on target cloud provider
- GEOS-11432 Upgrade to ImageIO-EXT 1.4.12
For the complete list see 2.25.2 release notes.
Community UpdatesCommunity module development:
- GEOS-11412 Remove reference to JDOM from JMS Cluster (as JDOM is no longer in use)
- GEOS-11413 STAC uses inefficient dabase queries when asking for collections in JSON format
Community modules are shared as source code to encourage collaboration. If a topic being explored is of interest to you, please contact the module developer to offer assistance.
About GeoServer 2.25 SeriesAdditional information on GeoServer 2.25 series:
-
sur GeoServer Team: GeoServer 2.24.4 Release
Publié: 18 June 2024, 2:00am CEST
GeoServer 2.24.4 release is now available with downloads (bin, war, windows), along with docs and extensions.
This is a maintenance release of GeoServer providing existing installations with minor updates and bug fixes. It also includes security vulnerability fixes.
GeoServer 2.24.4 is made in conjunction with GeoTools 30.4, and GeoWebCache 1.24.4.
Thanks to Peter Smythe (AfriGIS) for making this release.
Security ConsiderationsThis release addresses security vulnerabilities and is considered an essential upgrade for production systems.
- CVE-2024-36401 Critical
- CVE-2024-34696 Moderate
- CVE-2024-24749 Moderate
The details of this vulnerability will be made available at the end of the month providing an opportunity to update.
The use of the CVE system allows the GeoServer team to reach a wider audience than blog posts. See project security policy for more information on how security vulnerabilities are managed.
Demo Requests page rewrittenThe Demo Request page has been rewritten to use JavaScript to issue POST examples. This provides a much better user experience:
- Show Result lists the response headers to be viewed along side the returned result (with an option for XML pretty printing).
- Show Result in a New Page is available to allow your browser to display the result.
The WCS Request Builder and WPS Request Builder demos now have the option to show their results in Demo Requests page. Combined these changes replace the previous practice of using an iframe popup, and have allowed the TestWfsPost servlet to be removed.
For more information please see the Demo requests in the User Guide.
Thanks to David Blasby (GeoCat) for these improvements, made on behalf of the GeoCat Live project.
- GEOS-11390 Replace TestWfsPost with Javascript Demo Page
New Feature:
- GEOS-11390 Replace TestWfsPost with Javascript Demo Page
Improvement:
- GEOS-11311 Show a full stack trace in the JVM stack dump panel
-
GEOS-11369 Additional authentication options for cascaded WMS WMTS data stores - GEOS-11400 About Page Layout and display of build information
- GEOS-11401 Introduce environmental variables for Module Status page
Bug:
- GEOS-7183 Demo request/wcs/wps pages incompatible with [HTTPS]
- GEOS-11202 CAS extension doesn’t use global “proxy base URL” setting for service ticket
- GEOS-11331 OAuth2 can throw a “ java.lang.RuntimeException: Never should reach this point”
- GEOS-11332 Renaming style with uppercase/downcase empty the sld file
- GEOS-11382 The interceptor “CiteComplianceHack” never gets invoked by the Dispatcher Servlet
- GEOS-11385 Demo Requests functionality does not honour ENV variable PROXY_BASE_URL
- GEOS-11416 GeoPackage output contains invalid field types when exporting content from PostGIS
- GEOS-11430 CiteComplianceHack not correctly parsing the context
Task:
- GEOS-11318 Upgrade postgresql from 42.6.0 to 42.7.2
- GEOS-11374 Upgrade Spring version from 5.3.33 to 5.3.34
- GEOS-11375 GSIP 224 - Individual contributor clarification
- GEOS-11393 Upgrade commons-io from 2.12.0 to 2.16.1
- GEOS-11395 Upgrade guava from 32.0.0 to 33.2.0
- GEOS-11397 App-Schema Includes fix Integration Tests
- GEOS-11402 Upgrade PostgreSQL driver from 42.7.2 to 42.7.3
- GEOS-11403 Upgrade commons-text from 1.10.0 to 1.12.0
- GEOS-11404 Upgrade commons-codec from 1.15 to 1.17.0
For the complete list see 2.24.4 release notes.
Community UpdatesCommunity module development:
- GEOS-11040 Could not get a ServiceInfo for service Features thus could not check if the service is enabled
- GEOS-11381 Error in OIDC plugin in combination with RoleService
- GEOS-11412 Remove reference to JDOM from JMS Cluster (as JDOM is no longer in use)
Community modules are shared as source code to encourage collaboration. If a topic being explored is of interest to you, please contact the module developer to offer assistance.
About GeoServer 2.24 SeriesAdditional information on GeoServer 2.24 series:
- GeoServer 2.24 User Manual
- Control remote HTTP requests sent by GeoTools/GeoServer
- State of GeoServer 2.24.1 (foss4g-asia presentation)
- Multiple CRS authority support, planetary CRS
- Extensive GeoServer Printing improvements
- Upgraded security policy
Release notes: ( 2.24.4 | 2.24.3 | 2.24.2 | 2.24.1 | 2.24.0 | 2.24-RC )
-
sur Mappery: Orchids festival
Publié: 17 June 2024, 11:00am CEST

Barry Ruderman from raremaps.com shared this map from the Orchids Festival in Kew Gardens.
MapsintheWild Orchids festival
-
sur GeoTools Team: GeoTools 30.4 released
Publié: 16 June 2024, 6:06pm CEST
GeoTools 30.4 released The GeoTools team is pleased to announce the release of the latest maintenance version of GeoTools 30.4: geotools-30.4-bin.zip geotools-30.4-doc.zip geotools-30.4-userguide.zip geotools-30.4-project.zip This release is also available from the OSGeo Maven Repository and is made in conjunction with GeoServer 2.24.4 and GeoWebCache -
sur Mappery: Marking off the Countries Visited
Publié: 16 June 2024, 11:00am CEST
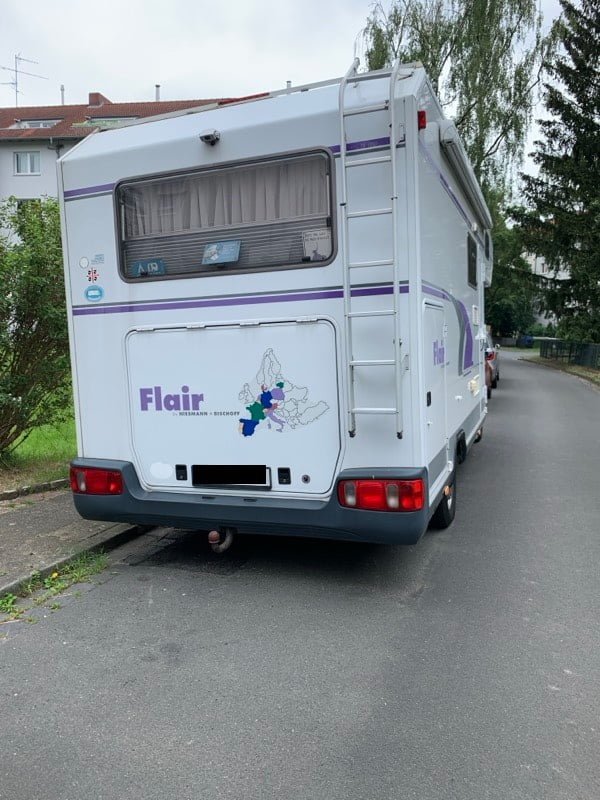
Marc-Tobias spotted this camper van in Hamburg. It looks as if the owners are marking off the countries that they have visited in it.
MapsintheWild Marking off the Countries Visited
-
sur Mappery: France on the Ceiling
Publié: 15 June 2024, 11:00am CEST
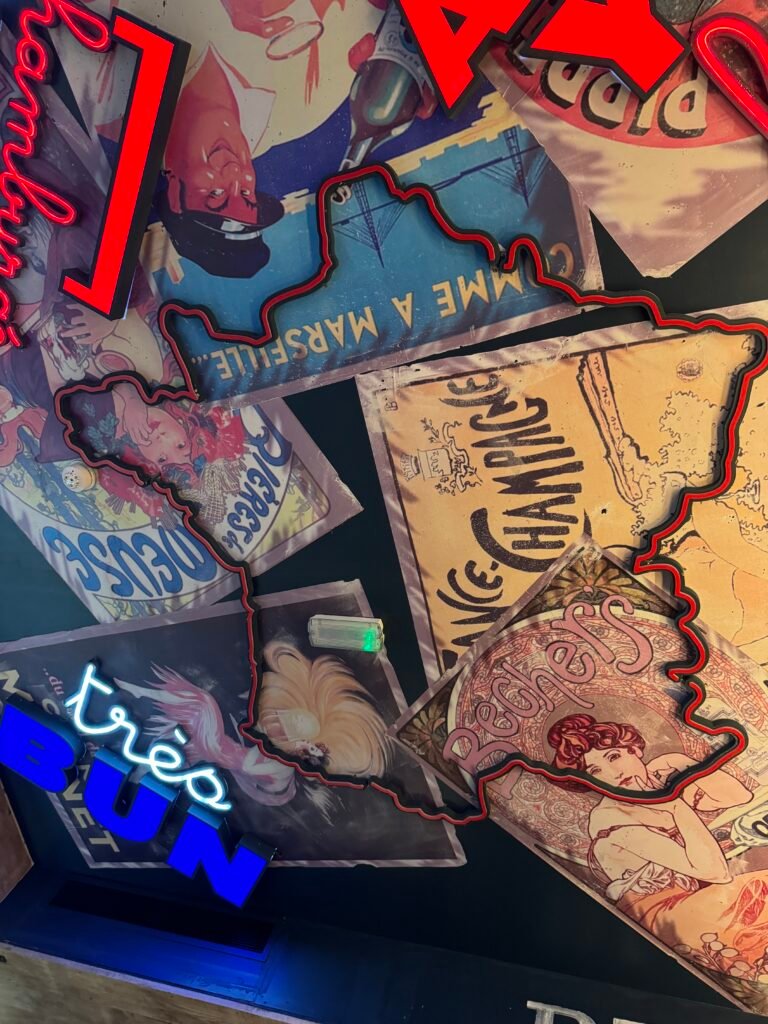
Andy Piper spotted this great collage on a ceiling. He said “Hey there, just in Big Fernand (French hamburger restaurant) in London today – they have France on the ceiling! “
Good spot Andy!
MapsintheWild France on the Ceiling
-
sur Oslandia: New release for QField : 3.3 “Darién”
Publié: 14 June 2024, 3:10pm CEST
Oslandia is the main partner of OPENGIS.ch around QField. We are proud today to forward the announcement of the new QField release 3.3 “Darién”. This release introduces a brand new plugin framework that empowers users to customize and add completely new functionalities to their favourite field application.
The plugin framework comes with other new features and improvements for this release, detailed below.
Main highlights
One of the biggest feature additions of this version is a brand new drawing tool that allows users to sketch out important details over captured photos or annotate drawing templates. This was a highly requested feature, which is brought to all supported platforms (Android, iOS, Windows, macOS, and, of course, Linux) with the financial support of the Swiss QGIS user group.
Also landing in this version is support for copying and pasting vector features into and from the clipboard. This comes in handy in multiple ways, from providing a quick and easy way to transfer attributes from one feature to another through matching field names to pasting the details of a captured feature in the field into a third-party messenger, word editing, or email application. Copying and pasting features can be done through the feature form’s menu as well as long pressed over the map canvas. Moreover, a new feature-to-feature attributes transfer shortcut has also been added to the feature form’s menu. Appreciation to Switzerland, Canton of Lucerne, Environment and Energy for providing the funds for this feature.

The feature form continues to gain more functionalities; in this version, the feature form’s value map editor widget has gained a new toggle button interface that can help fasten data entry. The interface replaces the traditional combo box with a series of toggle buttons, lowering the number of taps required to pick a value. The German Archaeological Institut – KulturGutRetter sponsored this feature.
Other improvements in the feature form include support for value relation item grouping and respect for the vector layer attributes’ « reuse last entered value » setting.

Finally, additional features include support for image decoration overlay, a new interface to hop through cameras (front, back, and external devices) for the ‘non-native’ camera, the possibility to disable the 3-finger map rotation gesture, and much more.
User experience improvementsLong-time users of QField will notice the new version restyling of the information panels such as GNSS positioning, navigation, elevation profile, and sensor data. The information is now presented as an overlay sitting on top of the map canvas, which increases the map canvas’ visibility while also achieving better focus and clarity on the provided details. With this new version, all details, including altitude and distance to destination, respect user-configured project distance unit type.
The dashboard’s legend has also received some attention. You can now toggle the visibility of any layer via a quick tap on a new eye icon sitting in the legend tree itself. Similarly, legend groups can be expanded and collapsed directly for the tree. This also permits you to show or hide layers while digitizing a feature, something which was not possible until now. The development of these improvements was supported by Gispo and sponsored by the National Land Survey of Finland.
Plugin frameworkQField 3.3 introduces a brand new plugin framework using Qt’s powerful QML and JavaScript engine. With a few lines of code, plugins can be written to tweak QField’s behaviour and add new capabilities. Two types of plugins are possible: app-wide plugins as well as project-scoped plugins. To ensure maximum ease of deployment, plugin distribution has been made possible through QFieldCloud! Amsa provided the financial contribution that brought this project to life.

Our partner OPENGIS.ch will soon offer a webinar to discover how QField plugins can help your field (and business) workflows by allowing you to be even more efficient in the field.
Users interested in authoring plugins or better understanding the framework, can already visit the dedicated documentation page and a sample plugin implementation sporting a weather forecast integration.
A question concerning QField ? Interested in QField deployment ? Do not hesitate to contact Oslandia to discuss your project !
-
sur Sortie de QField 3.3 « Darién »
Publié: 14 June 2024, 3:05pm CEST par Vincent Picavet
Oslandia est le partenaire principal d’OPENGIS.ch pour QField. Nous sommes fiers aujourd’hui de relayer l’annonce de la nouvelle version 3.3 « Darién » de QField. Cette version introduit un tout nouveau framework de plugins qui permet aux utilisateurs de personnaliser et d’ajouter des fonctionnalités complètement nouvelles à leur application de terrain préférée.
Le framework de plugins est accompagné d’autres nouvelles fonctionnalités et améliorations pour cette version, détaillées ci-dessous.
Les points marquants
L’une des plus grandes nouveautés de cette version est un tout nouvel outil de dessin qui permet aux utilisateurs d’annoter des détails importants sur des photos capturées ou de prendre des notes sur des modèles de dessin. Cette fonctionnalité, très demandée, est désormais disponible sur toutes les plateformes prises en charge (Android, iOS, Windows, macOS et, bien sûr, Linux) grâce au soutien financier du groupe d’utilisateurs QGIS suisse.
Cette version inclut également la prise en charge du copier-coller de features vectorielles dans et depuis le presse-papiers. Cela est utile de plusieurs manières, offrant un moyen rapide et facile de transférer des attributs d’une fonctionnalité à une autre via des noms de champs correspondants ou de coller les détails d’une fonctionnalité capturée sur le terrain dans une application de messagerie tierce, de traitement de texte ou de courrier électronique. Le copier-coller de features peuvent se faire via le menu du formulaire des features, ainsi que par un appui long sur la carte. De plus, un nouveau raccourci de transfert d’attributs de feature à feature a également été ajouté au menu du formulaire de feature. Remerciements au canton Suisse de Lucerne, Environnement et Énergie pour le financement de cette fonctionnalité.
Also landing in this version is support for copying and pasting vector features into and from the clipboard. This comes in handy in multiple ways, from providing a quick and easy way to transfer attributes from one feature to another through matching field names to pasting the details of a captured feature in the field into a third-party messenger, word editing, or email application. Copying and pasting features can be done through the feature form’s menu as well as long pressed over the map canvas. Moreover, a new feature-to-feature attributes transfer shortcut has also been added to the feature form’s menu. Appreciation to Switzerland, Canton of Lucerne, Environment and Energy for providing the funds for this feature.
Le formulaire de feature continue de gagner en fonctionnalités ; dans cette version, le widget de l’éditeur de carte de valeurs du formulaire de features a gagné une nouvelle interface de bouton qui peut accélère la saisie des données. L’interface remplace la boîte combo traditionnelle par une série de boutons-bascule, réduisant le nombre de clics nécessaires pour choisir une valeur. L’Institut archéologique allemand – KulturGutRetter a parrainé cette fonctionnalité.
D’autres améliorations du formulaire de fonctionnalité incluent la prise en charge du regroupement des éléments de relation de valeurs et le respect du paramètre « réutiliser la dernière valeur entrée » des attributs de la couche vectorielle.
Enfin, des fonctionnalités supplémentaires incluent la prise en charge de la superposition de décorations d’images, une nouvelle interface pour basculer entre les caméras (avant, arrière et dispositifs externes) pour la caméra « non native », la possibilité de désactiver le geste de rotation de la carte à trois doigts, et bien plus encore.
Améliorations d’interface utilisateur
Les utilisateurs de longue date de QField remarqueront le nouveau style des panneaux d’information tels que le positionnement GNSS, la navigation, le profil d’élévation et les données des capteurs. Les informations sont désormais présentées sous forme de superposition sur la carte, ce qui augmente la visibilité de la carte tout en améliorant la mise en avant et la clarté des détails fournis. Avec cette nouvelle version, tous les détails, y compris l’altitude et la distance jusqu’à la destination, respectent le type d’unité de distance configuré par l’utilisateur dans le projet.
La légende du tableau de bord a également reçu de l’attention. Vous pouvez désormais basculer la visibilité de n’importe quelle couche via un simple clic sur une nouvelle icône en forme d’œil située dans l’arbre de la légende. De même, les groupes de légendes peuvent être développés et réduits directement dans l’arbre. Cela vous permet également de montrer ou de masquer des couches tout en numérisant une fonctionnalité, ce qui n’était pas possible jusqu’à présent. Le développement de ces améliorations a été soutenu par Gispo et parrainé par le Service national du cadastre de Finlande.
The dashboard’s legend has also received some attention. You can now toggle the visibility of any layer via a quick tap on a new eye icon sitting in the legend tree itself. Similarly, legend groups can be expanded and collapsed directly for the tree. This also permits you to show or hide layers while digitizing a feature, something which was not possible until now. The development of these improvements was supported by Gispo and sponsored by the National Land Survey of Finland.
Framework de plugins
QField 3.3 introduit un tout nouveau framework de plugins utilisant le puissant moteur QML et JavaScript de Qt. Avec quelques lignes de code, des plugins peuvent être écrits pour ajuster le comportement de QField et ajouter de nouvelles fonctionnalités. Deux types de plugins sont possibles : des plugins au niveau de l’application ainsi que des plugins spécifiques au projet. Pour assurer une facilité maximale de déploiement, la distribution des plugins a été rendue possible via QFieldCloud ! Amsa a fourni la contribution financière qui a permis de réaliser ce projet.
Notre partenaire OPENGIS.ch proposera bientôt un webinaire pour découvrir comment les plugins QField peuvent améliorer vos workflows de terrain (et votre activité au sens large) en vous permettant d’être encore plus efficace sur le terrain.
Les utilisateurs intéressés par la création de plugins ou une meilleure compréhension du framework peuvent déjà visiter la page de documentation dédiée et un exemple d’implémentation de plugin intégrant une prévision météorologique.
Vous avez des questions sur QField ? Intéressés par sa mise en œuvre, n’hésitez pas à contacter Oslandia !
-
sur Mappery: Babelroth anno 1776
Publié: 14 June 2024, 11:00am CEST
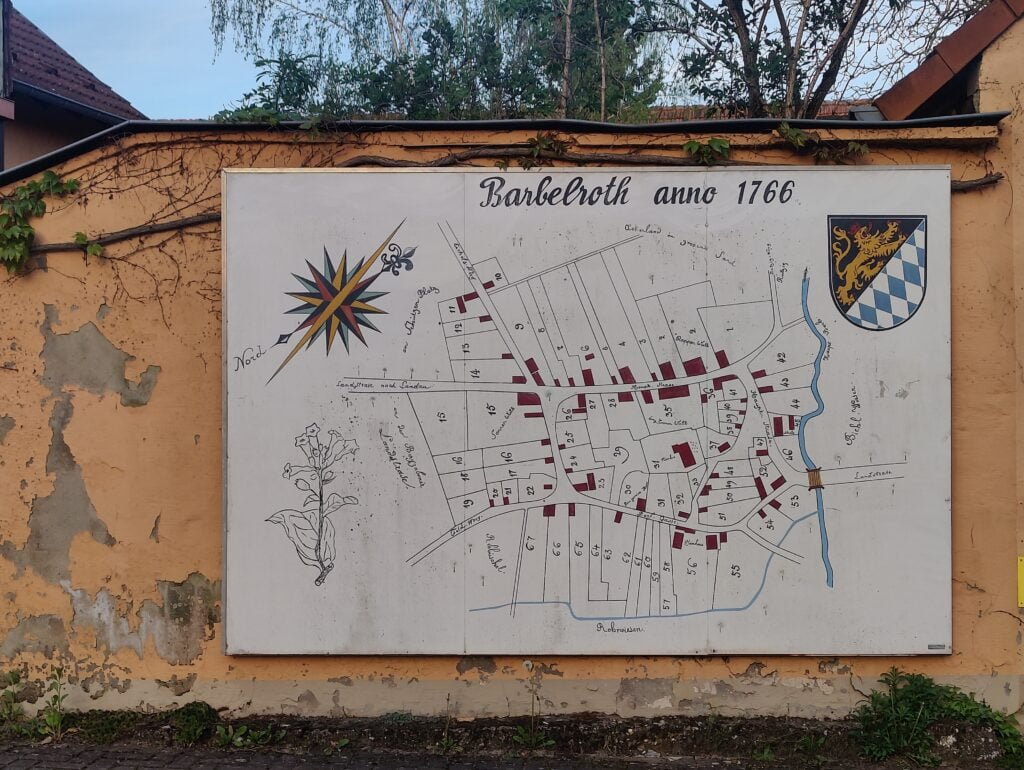
Ekki Plicht sent us this pic from Babelroth in Germany
“Here is a nice mural which can be seen in the village of Barbelroth in
Germany. It is mounted on the wall at the corner of Hauptstraße and
Mühlstraße, and it is already mapped in OSM, object. [https:]]Cheers.
Ekki”MapsintheWild Babelroth anno 1776
-
sur QGIS Blog: QGIS Grant Programme 2024 Update no. 2
Publié: 14 June 2024, 8:30am CEST
Thanks to generous supporters, we are in the wonderful position to be able to announce that another project is successfully funded:
Our thanks go out to:
- Gis3W
- QTIBIA Engineering and QCooperative
- QGIS User Group Germany (QGIS Anwendergruppe Deutschland e.V.)
- Hytech-imaging spectral imaging for environmental mapping and monitoring in civil and defence applications
for providing the additional funding to top up the QGIS Grant Programme contribution for QEP#248.
The next proposals on the wait list are:
- QEP#294 Fix access to remote data sources in WebAssembly builds
- QEP#265 Use pre-commit to automate installation and management of all pre-commit hooks
- QEP#295 Embedded end-user feedback
If you want to help make these improvement a reality, please get in touch.
-
sur [1’Tech by Oslandia] télétravail
Publié: 14 June 2024, 6:48am CEST par Caroline Chanlon
On sort un peu de la minute Tech pour évoquer un « mot » qui nous implique particulièrement chez Oslandia. Alors essayons de donner notre meilleure définition du télétravail !
Le télétravail est une méthode de travail s’affranchissant de la proximité géographique des collaborateurs.
Quels avantages au télétravail ?- la fin des temps de trajet domicile-travail : un meilleur confort personnel, un bilan carbone fortement réduit
- une flexibilité accrue dans la gestion de son temps et l’organisation au quotidien
- des recrutements plus libres et plus faciles
- une communication et des process organisationnels nécessairement structurés
- l’efficience du travail asynchrone
Le télétravail n’est pas un problème en soi, mais c’est souvent un catalyseur de problèmes : chaque difficulté rencontrée peut prendre beaucoup plus d’importance et de criticité en distanciel. Cela oblige à traiter les problèmes à la racine, et ne pas les mettre « sous le tapis » en se disant qu’on les résoudra à la machine à café ! Cela crée un environnement d’entreprise plus sain et plus égalitaire.
Oslandia baigne dans la culture OpenSource, où le développement logiciel s’effectue par nature de façon distribuée, mondiale, et à distance. Nous avons donc ainsi un fonctionnement interne cohérent avec l’objet de notre activité, et nous nous inspirons des fonctionnements des communautés opensource pour le fonctionnement de l’entreprise.
Les ingrédients clé d’un télétravail durable, efficient et agréable :- un travail qui a du sens, facteur de motivation
- des postes de travail au domicile adaptés et confortables
- l’accompagnement RH et psychosocial des collaborateurs
- des process de fonctionnement et de communication clairs et partagés
- la culture de l’écrit, et les outils adaptés
- des rendez-vous réguliers pour se rencontrer de visu
Oslandia fonctionne en 100% télétravail, et cela depuis sa création il y a 15 ans ! L’équipe est répartie dans la France entière, nos clients aussi, et même à l’international. Nous livrons de beaux projets par nos compétences techniques, mais aussi grâce à notre structure organisationnelle.
-
sur OPENGIS.ch: Django Full-Stack Engineer with DevOps Affinity – 80 – 100% (Remote)
Publié: 14 June 2024, 6:47am CEST
Location: Remote, preferably with at least 4h overlap to CEST office hours
Employment Type: Full-time (80-100%)

About OPENGIS.ch:
OPENGIS.ch is a team of Full-Stack GeoNinjas offering personalized open-source geodata solutions to Swiss and international clients. We are dedicated to using and developing open-source tools, providing flexibility, scalability, and future-proof solutions, and playing a key role in the free and open-source geospatial community. We pride ourselves on our agile and distributed nature, which allows us to have a motivated and multicultural team that supports each other in working together.
Job Description:
We are seeking a passionate and skilled Django Full-Stack Engineer with a strong affinity for DevOps to join our team. The ideal candidate will work primarily on QFieldCloud, our cutting-edge cloud-based solution that brings QGIS projects to the field. You will help develop and maintain the full stack of the QFieldCloud platform, ensuring high performance and stability and implementing new features.
Responsibilities:
- Develop, test, and maintain the QFieldCloud platform using Django, Python, PostgreSQL and other modern web technologies.
- Collaborate with cross-functional teams to define, design, and ship new features.
- Ensure the performance, quality, and responsiveness of the application.
- Identify and correct bottlenecks and fix bugs.
- Help maintain code quality, organization, and automation.
- Work closely with the DevOps team to manage and optimize deployment pipelines, including Docker, Kubernetes, and other containerization and orchestration technologies.
- Provide technical guidance and support to clients regarding deployment and usage of the platform.
Qualifications:
- Strong experience with Django and Python in a full-stack capacity.
- Proficiency in front-end technologies, including JavaScript, HTML5, and CSS3.
- Experience with Linux, Docker (compose), K8s, Git, and PostgreSQL.
- Familiarity with geospatial concepts and web GIS applications is a plus.
- Good understanding of software deployment, containerization, and continuous integration practices.
- Excellent problem-solving skills and ability to work independently.
- Strong communication skills and ability to work in a distributed team environment.
- Fluency in English; knowledge of German, French, Italian, Spanish, or Romansh is a plus.
Perks:
At OPENGIS.ch, we enjoy a variety of perks that make our work experience rewarding. Here’s what we get:
- Flexible Work Hours: We have the freedom to set our own schedules, which helps us better manage our personal and professional lives.
- Remote Work Opportunities: We can work from anywhere, giving us the flexibility to choose our work environment.
- Learning and Development: We are encouraged to grow professionally with access to training programs and workshops.
- Innovative Environment: We thrive in an atmosphere that’s at the forefront of GIS technology, which keeps our work exciting.
- Collaborative Team: We value teamwork and the exchange of ideas, making our workplace dynamic and supportive.
Questions for Applicants:
- What’s your experience with software deployment and containers?
- What is your favourite Django app? Why? Have you ever upstreamed a patch in Django or an app? if so, please provide a link to the pull request.
- What is the error in the featured image of this post?
- What did you last learn out of interest?
How to Apply:
If you are excited about this opportunity and meet the qualifications, please submit an application at opengis.ch/jobs
Join us at OPENGIS.ch and become a part of our mission to provide innovative open-source geospatial solutions!


-
sur Mappery: 17th C Antwerp Street Scene
Publié: 13 June 2024, 11:00am CEST

Reinder sent us this massive 17C repro of a street map of Antwerp on a hoarding. The info on the side says “art historians, developed especially for the festival and pastor of Sint-Andries, a city walk along many landmarks in the city.”
MapsintheWild 17th C Antwerp Street Scene
-
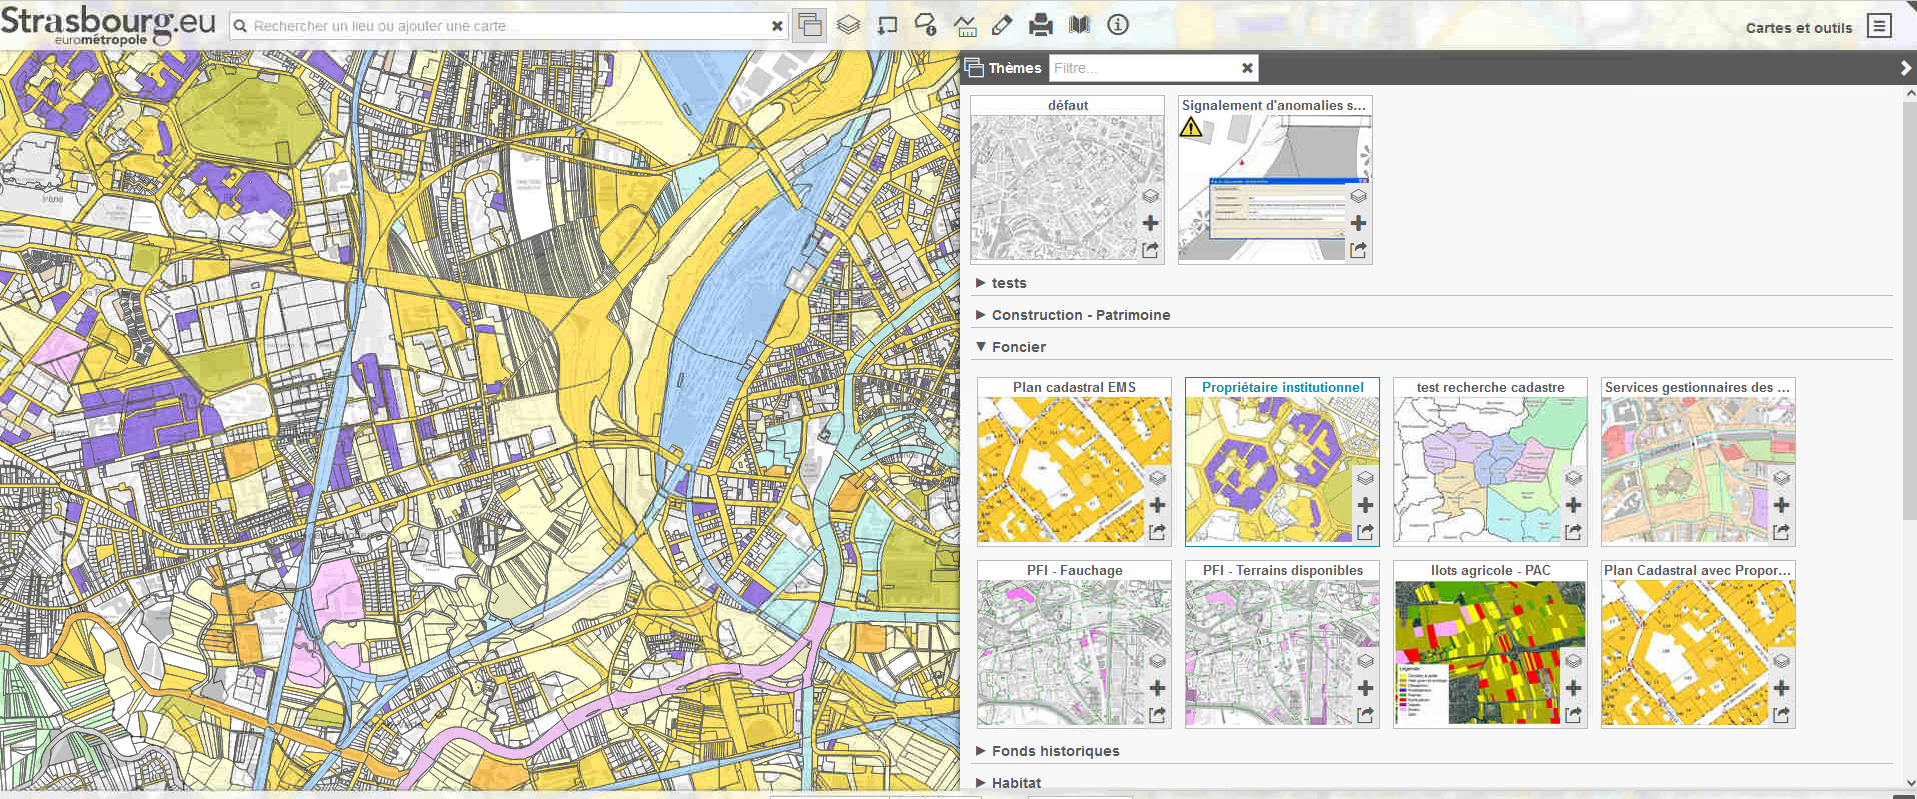
sur Eurométropole de Strasbourg : une plateforme facilitant le partage et la diffusion interne des données géographiques
Publié: 13 June 2024, 7:16am CEST par Caroline Chanlon
L’Eurométropole de Strasbourg a fait appel à Oslandia pour se doter d’une plateforme intranet de nouvelle génération facilitant le partage et la diffusion interne des données géographiques.
Ce projet bien que porté par un seul service est à destination de l’ensemble de la collectivité.
De nombreuses données géographiques produites par les géomaticiens n’étaient accessibles que par des clients lourds ayant une interface relativement complexe qui bridait leur utilisation aux personnes initiées.
De plus la publication des projets QGIS sur la plateforme web nécessitait plusieurs étapes de conversion et vérification.Le projet avait donc pour but de simplifier la publication et de populariser l’accès aux données géographiques du SIG au travers de la mise en œuvre d’outils simples d’utilisation, intuitifs, performants et Open Source.
De plus afin de respecter les normes de sécurité de l’Eurométropole et d’être transparent pour les utilisateurs, la solution recherchée doit être compatible avec le système d’authentification et de gestion de droits de la collectivité.
Nous avons répondu à cette demande en utilisant et interfaçant plusieurs briques Open Source : QGIS Server, QGIS Web Client 2 (QWC2), Geonetwork, Map proxy et Keycloak.
Cyle de vie de la donnée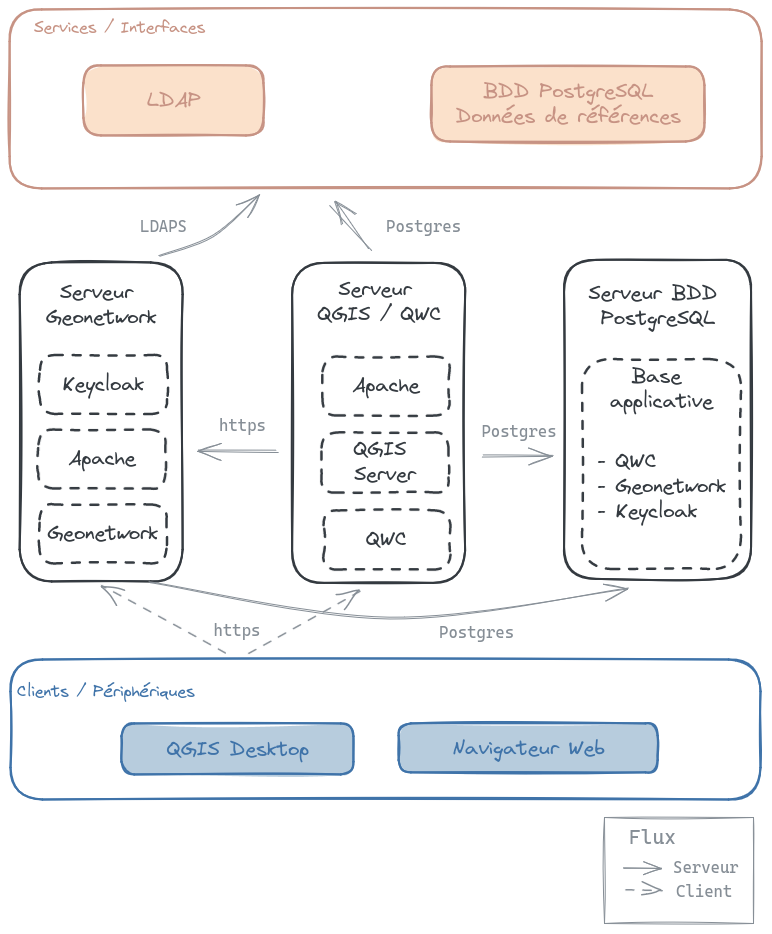
Le besoin initial de l’Eurométropole était d’avoir un cycle de vie complet allant de la création à la diffusion en passant par le référencement de leurs données géographiques.
Tout d’abord, les données sont créées depuis le logiciel QGIS Desktop dans une base de données PostgreSQL/PostGIS.
Pour chaque groupe de données thématique, il est nécessaire de produire une fiche de métadonnée dans le géocataloque de l’EMS (Geonetwork), un fichier .qlr afin de pouvoir charger ces données de manière simple dans QGIS Desktop, un projet qgis pour la diffusion dans la plateforme web (QGIS Server/QWC2).
Connexion et sécurité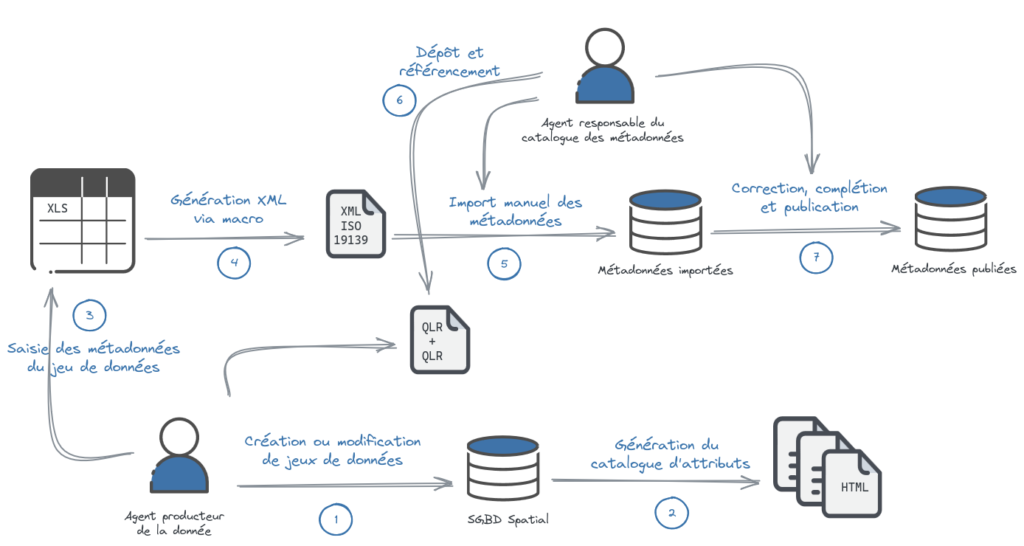
Afin de gérer les droits d’accès aux données ainsi qu’aux applications, l’EMS possède un SSO Kerberos basé sur un annuaire AD.
Durant l’ensemble du projet, la sécurité a été un point majeur afin que ce SSO puisse être intégré dans chaque étapes du cycle de vie de la donnée.
Tout d’abord l’ensemble des groupes de la base PostgreSQL sont synchronisés avec l’annuaire AD, afin de sécuriser l’accès direct à la donnée.
Ensuite, pour sécuriser la diffusion, un plugin QGIS Server initialement développé par l’EMS a été repris dans le cadre de ce projet. Les droits définis en base de données (et donc dans l’AD) sont pris en compte pour autoriser ou non la lecture des données et leur affichage sur la plateforme Web selon l’utilisateur connecté.
Finalement, pour l’accès aux applications, une brique KeyCloak a été installée, elle est moins visuelle mais essentielle. Elle permet de ce connecter au SSO Kerberos et de fournir un protocole OpenIDC compatible nativement avec Geonetwork. Pour la plateforme QWC2, un micro-service spécifique a été développé afin de pouvoir récupérer l’authentification fournie par le module OpenIDC d’Apache.
La diffusion des projets : QGIS Server / MapproxyQgis Server permet de diffuser sous forme de flux OGC les projets préalablement créés dans QGIS. Il peut en effet servir les projets avec un rendu de style identique à celui paramétré dans QGIS, ces deux logiciels utilisant le même moteur cartographique. Les projets QGIS déjà existants n’ont eu besoin que de changements mineurs pour pouvoir être servis par QGIS Server et obtenir le même rendu que celui obtenu dans QGIS Desktop.
Certains fonds de plan sont très utilisés et par définition assez lourd au chargement. Pour une meilleure expérience utilisateur, surtout sur un navigateur web, il ne faut pas que la carte mette trop longtemps à charger. C’est pour cela que MapProxy a été mis en place, pour optimiser le chargement de ces fonds de plan en créant un cache paramétré sur plusieurs niveaux de zoom.
Le visualisateur cartographique web : QGIS Web Client 2QGIS Web Client 2 ou QWC2 est le visualisateur web officiel de QGIS. Il est Open Source et maintenu par la communauté QGIS.
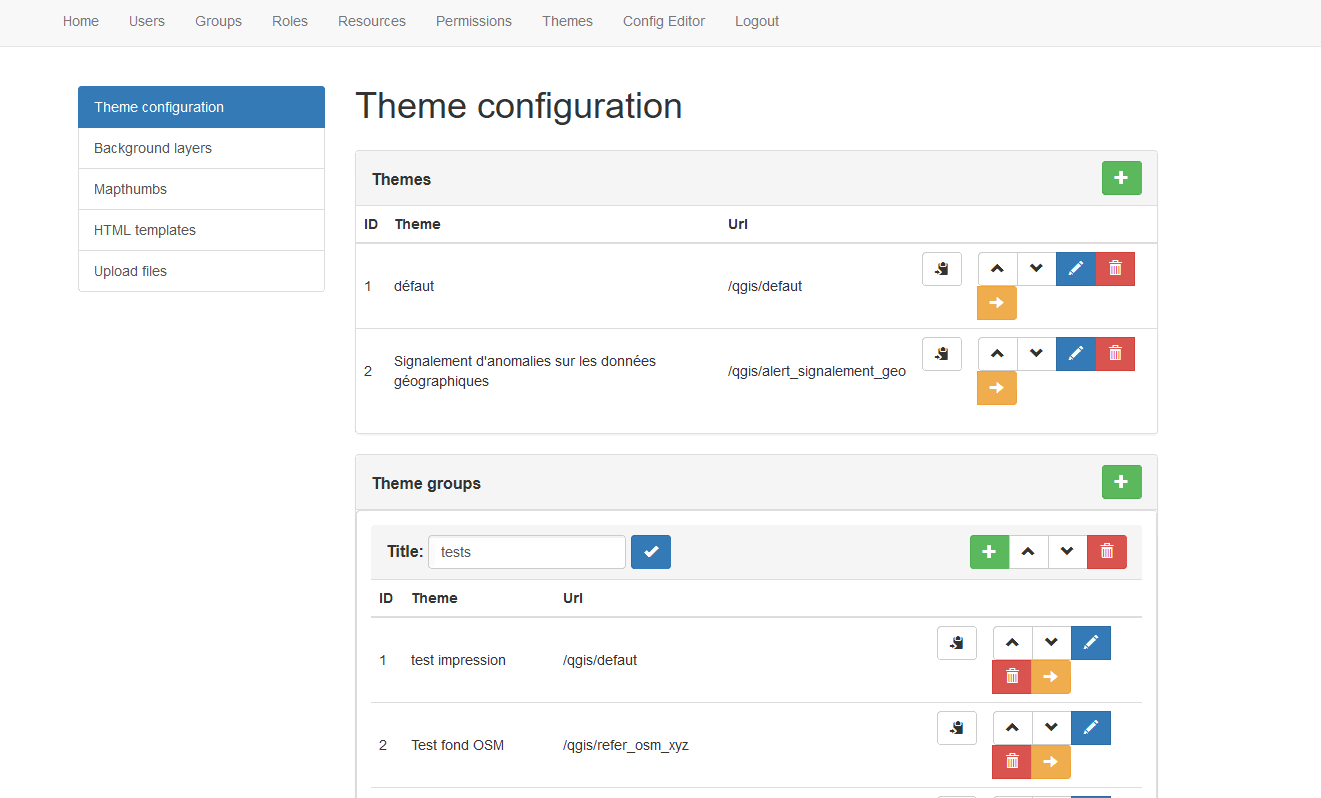
QWC2 a été installé et personnalisé pour correspondre aux besoins du projet. Plusieurs micro-services ont été utilisés et adaptées, notamment l’extension d’administration permettant ainsi à l’EMS d’être autonome dans la publication de nouveaux thèmes (projet QGIS) ou la modification d’existant en les paramétrant à souhait. En effet on peut pour un thème choisir le nom, la vignette miniature pour repésenter le thème, les fonds de plans disponibles mais également les échelles de zoom ou les échelles d’impression de carte ou le type de recherche qui s’active dans la barre de recherche.
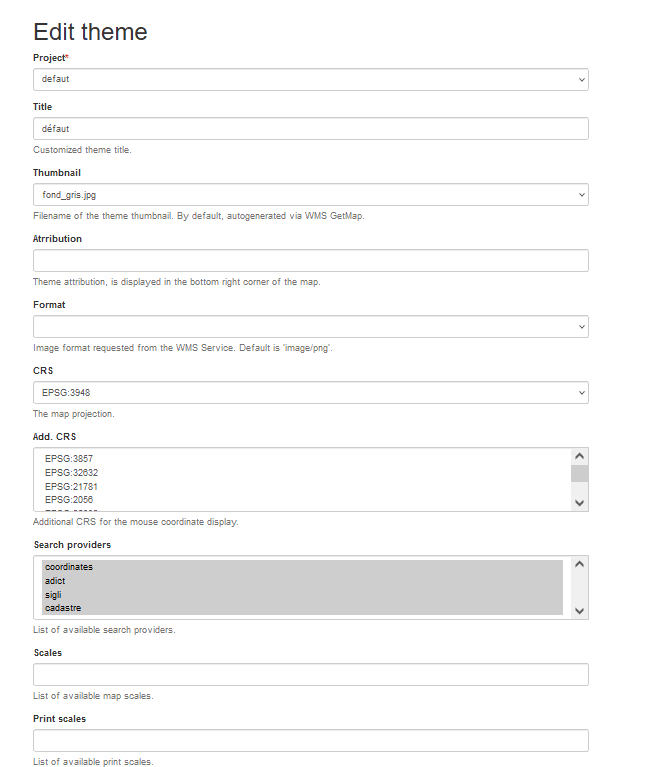
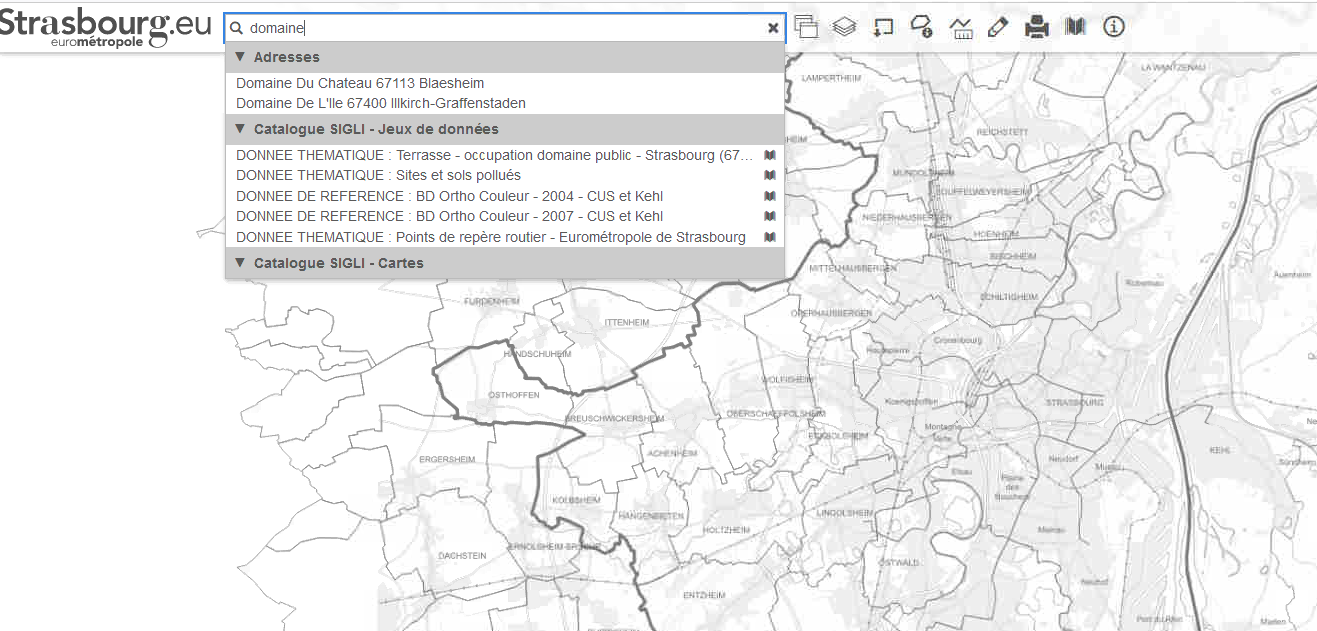
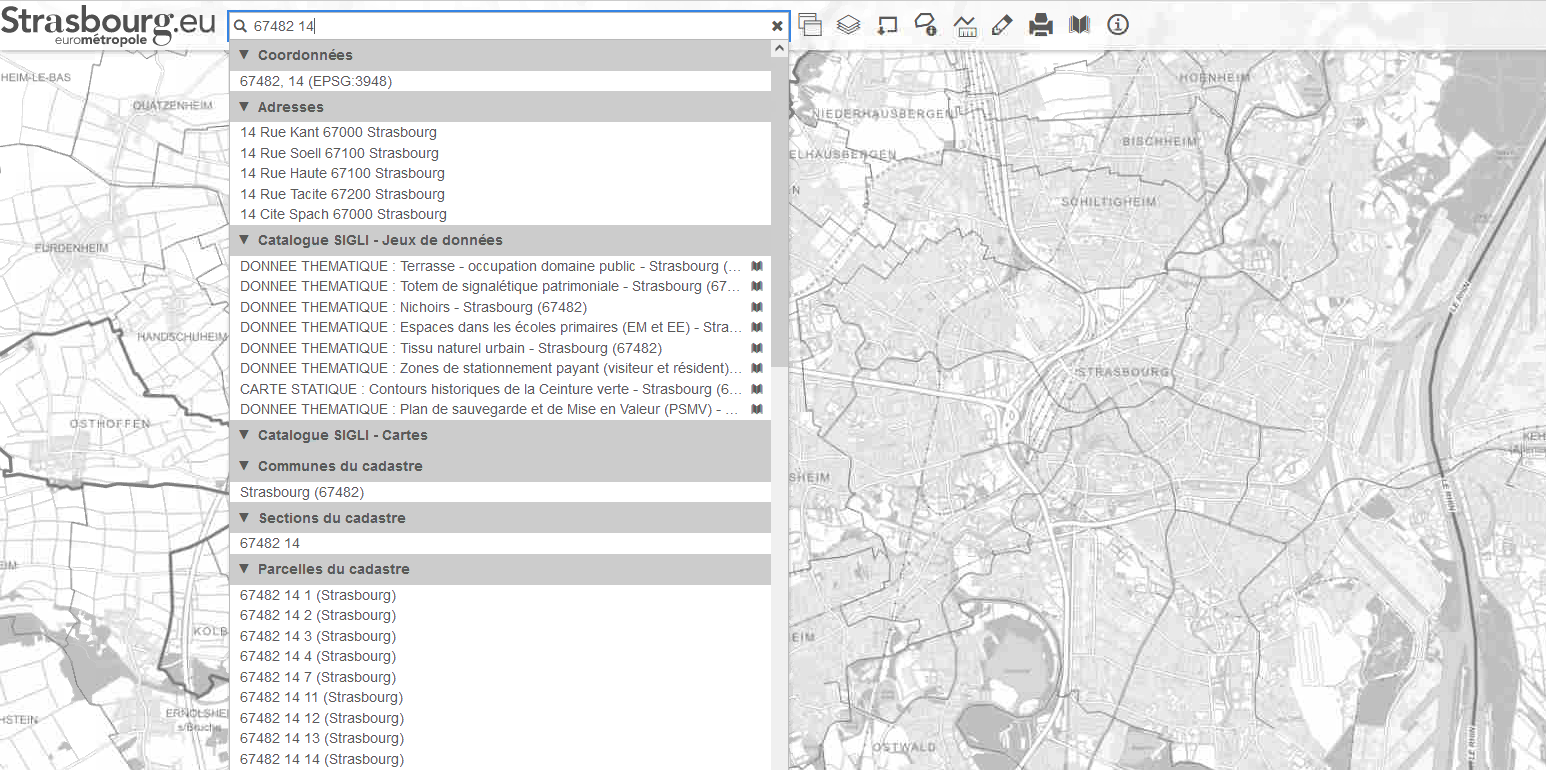
En effet pour l’EMS nous avons configuré plusieurs recherches :
- Recherche dans la BAN (Base Nationale Adresse) personnalisée de l’EMS
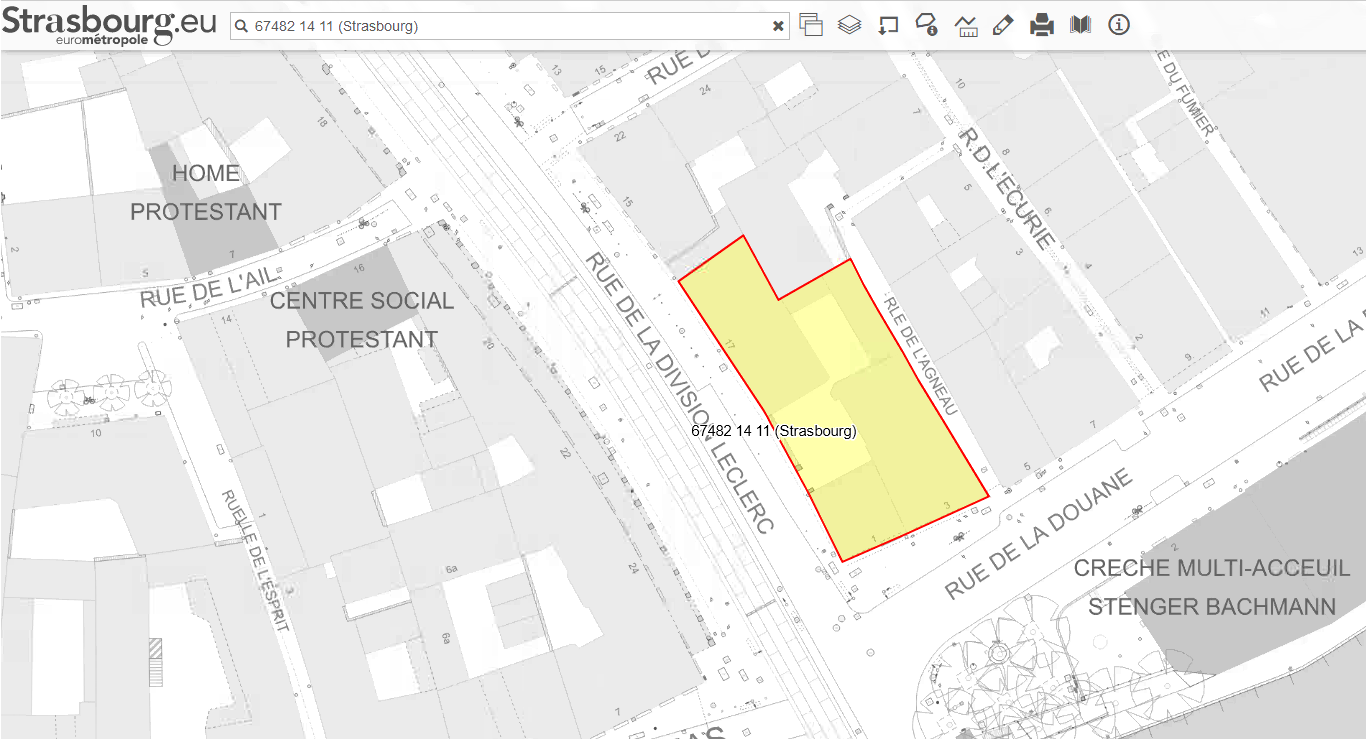
- Recherche Cadastral (commune, section, parcelle)
- Recherche dans le géocatalogue GéoNetwork (pour charger les couches ou consulter le catalogue)
Cette interface d’administration permet également à l’EMS d’organiser les différents thèmes en groupes pour correspondre aux thématiques des données ou à un classement par équipe de travail; et de rendre accessible de nouveaux fonds de plan.
Dans certains projets QGIS, des composeurs d’impression sont disponibles. Ces composeurs sont également disponibles dans l’interface Web QWC2 avec des champs personnalisables au moment de l’impression, comme le titre de la carte par exemple.
Les cartes chargées dans QWC2 ne sont pas figées. En effet l’utilisateur peut personnaliser son visuel de plusieurs manières :
- Modifier le fond de plan chargé par défaut
- Cocher et décocher des couches comme dans QGIS
- Charger quelques couches ou la totalité des couches en provenance d’un autre projet
- Ajouter des couches en provenance du GeoNetwork EMS grâce à un développement spécifique Oslandia
- Ajouter des couches en provenance d’un web service externe ou un fichier local de son ordinateur
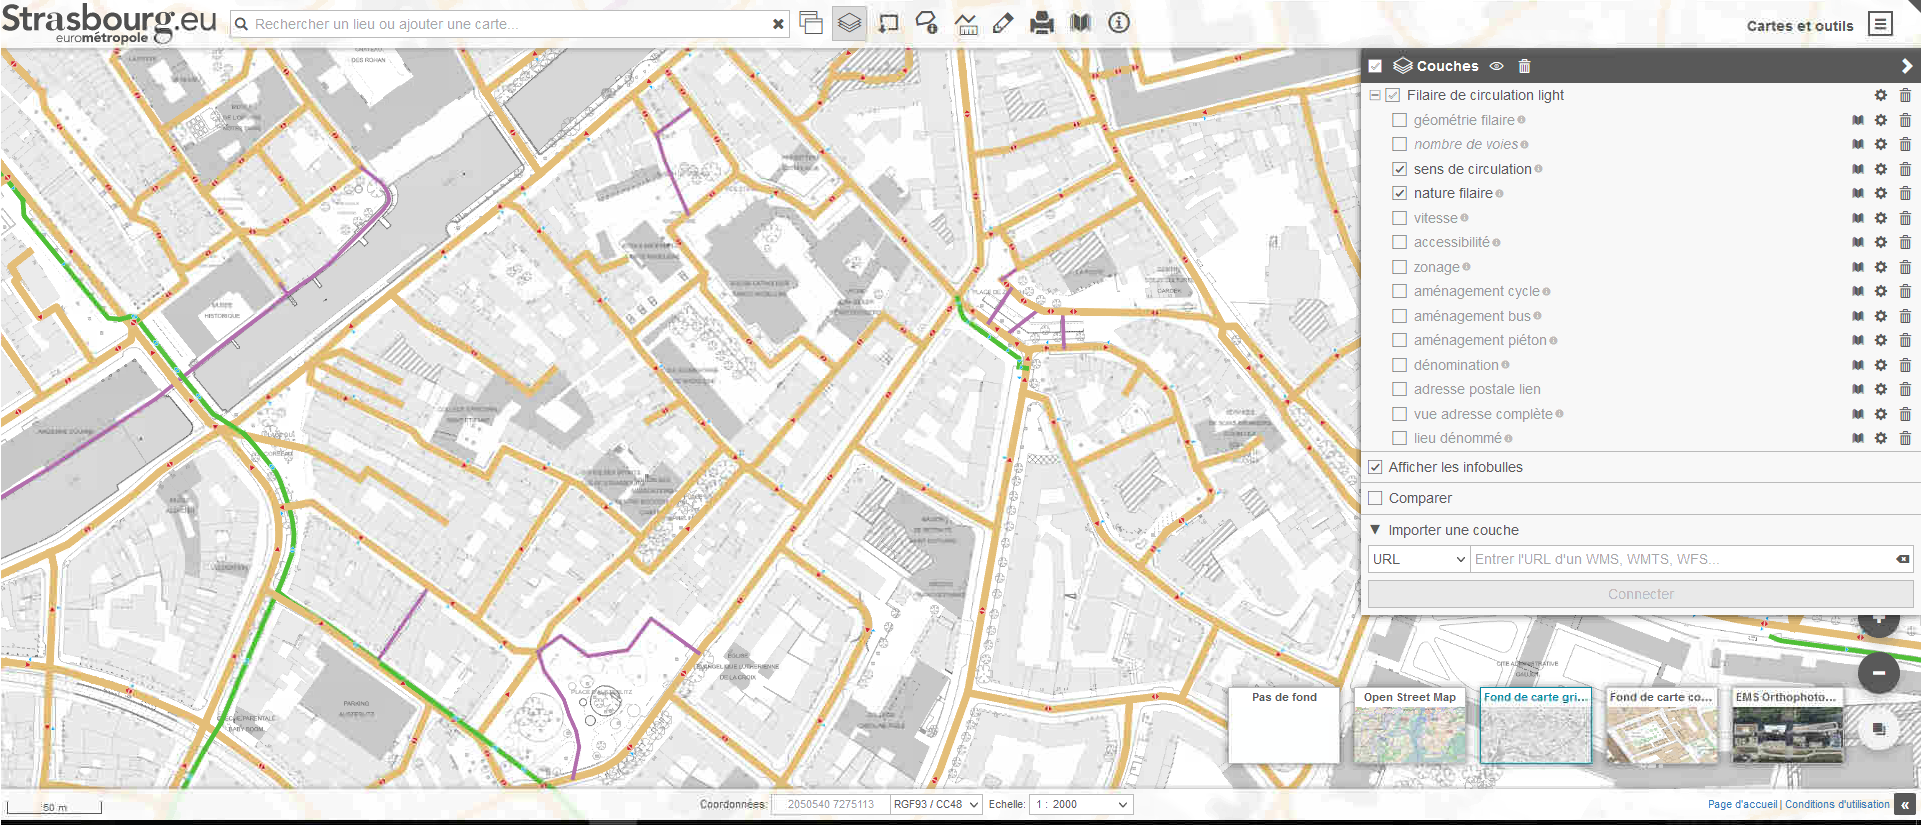
Les utilisateurs ont également la possibilité de “dessiner” sur la carte ou d’ajouter des étiquettes pour compléter les informations ou prendre des notes rapidement.
Toutes ces annotations sont enregistrables via un marque-page et partageables en générant et conservant un permalien.
Le catalogue de données géographiques : GeonetworkLe géocatalogue de l’EMS a été paramétré et modifié afin de répondre à leur besoin. En effet, Geonetwork possède une interface cartographique par défaut. Afin d’intégrer complètement le géocataloque dans le projet, cette interface à été remplacé par la plateforme web QWC2.
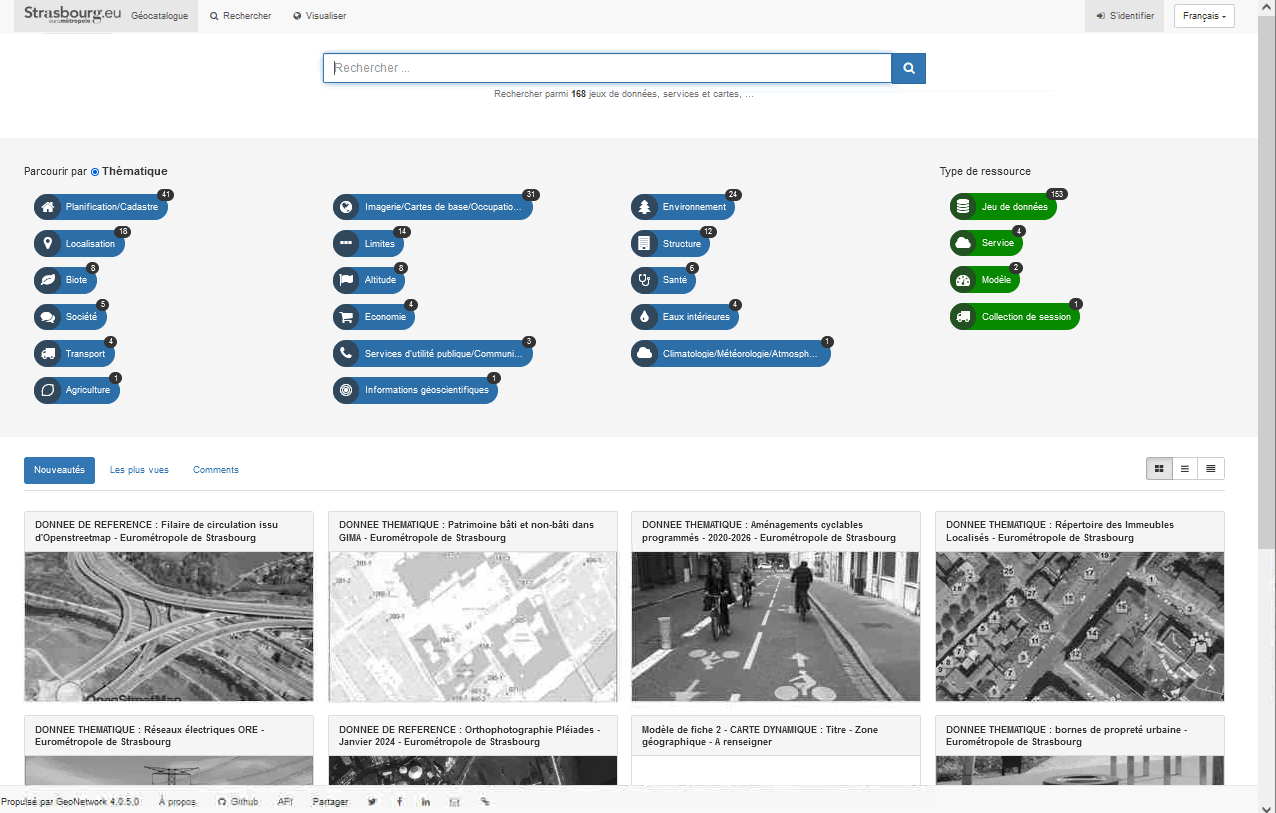
Ce couplage avec QWC2 permet également de faciliter l’ajout des couches du Géocatalogue à une carte déjà ouverte dans la visionneuse.
Contributions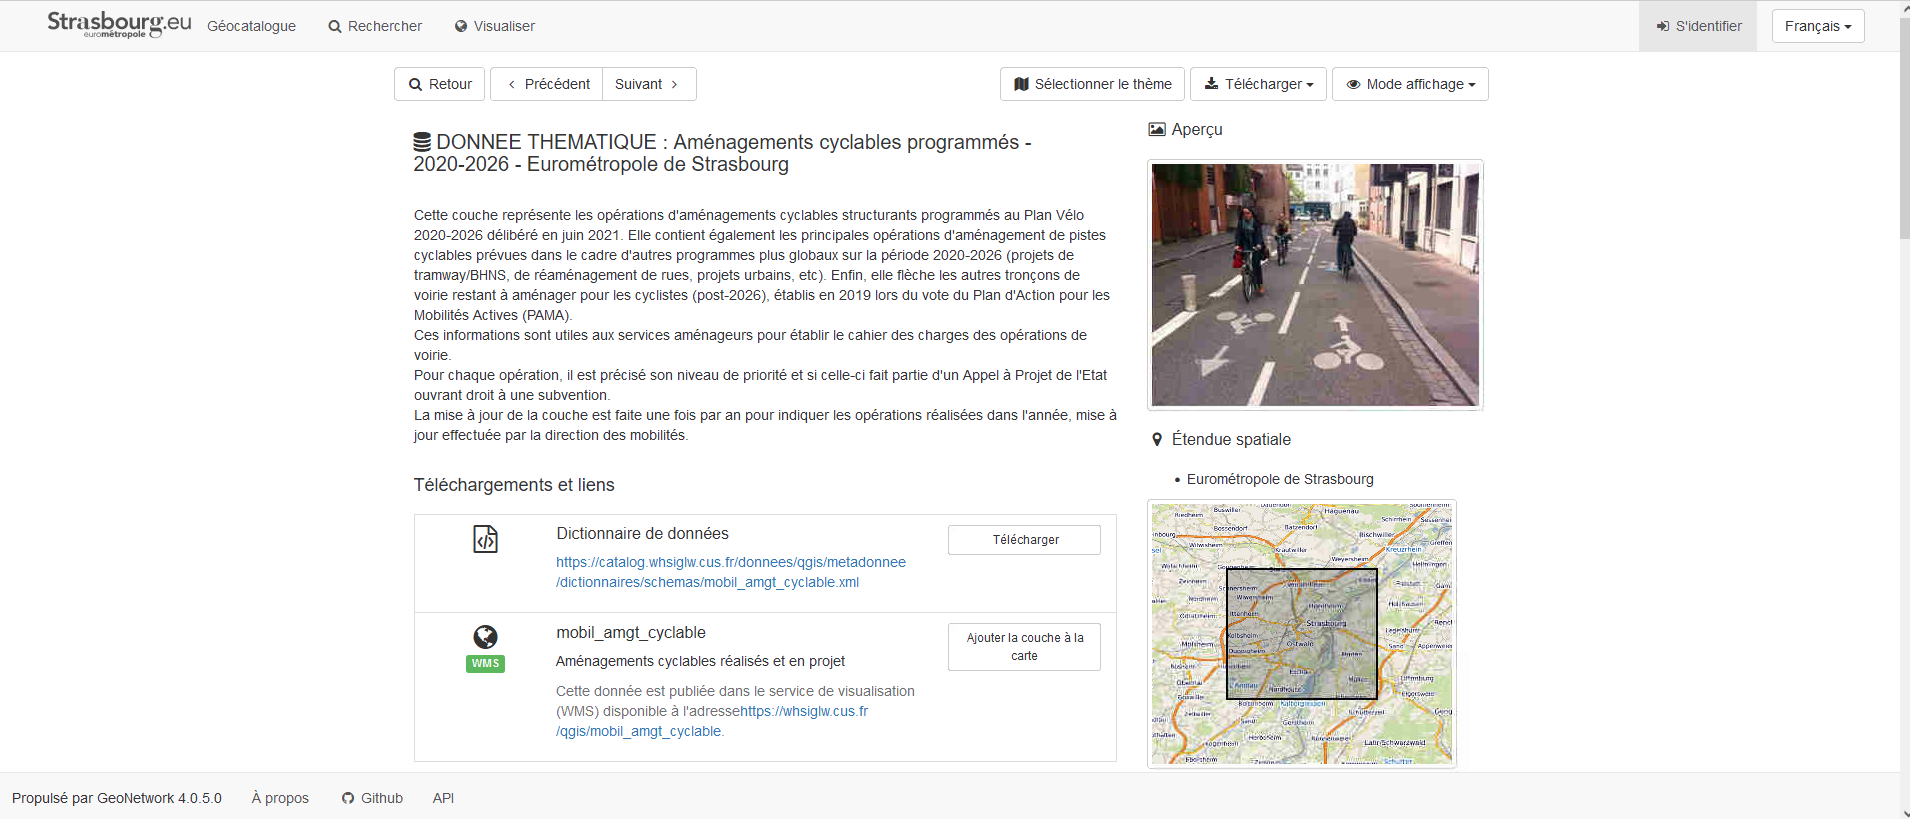
Durant cette prestation toutes les évolutions/correctifs qui n’étaient pas spécifiques à l’EMS ont été reversées à la communauté (25 Pull Request et 6 composants modifiés). Travailler avec nous c’est également travailler pour la communauté QGIS.
L’EMS a même eu envie de participer à l’effort collectif en se lançant dans la contribution opensource et réalisé certaines contributions pendant le projet :
- Ajout du support XYZ dans l’interface d’admin
- Ajout de l’option pour paramétrer l’infobulle activé par défaut dans l’ajout de projet depuis l’interface d’administrace.
- Ajout de l’option dans l’interface d’administration pour choisir si l’on veut que le rendu sur notre projet s’effectue de manière tuilé ou non.
- Ajout du support de la gestion du type Enum de postgres dans la génération des formulaires
Si la description de ce projet vous a donné des idées, n’hésitez pas à nous contacter, nous pourrons parler avec vous de vos projets.
-
sur Camptocamp: 3D Technology Serving Rennes Métropole's Solar Cadastre
Publié: 13 June 2024, 2:00am CEST
Pièce jointe: [télécharger]
Camptocamp put its expertise to work for the city, by developing a totally customized application, based on an extremely clear user experience. -
sur Camptocamp: 3D Technology Serving Rennes Métropole's Solar Cadastre
Publié: 13 June 2024, 2:00am CEST
Camptocamp put its expertise to work for the city, by developing a totally customized application, based on an extremely clear user experience. -
sur GeoServer Team: GeoServer 2.23.6 Release
Publié: 13 June 2024, 2:00am CEST
GeoServer 2.23.6 release is now available with downloads (bin, war, windows), along with docs and extensions.
This series has previously reached end-of-life, with this release issued to address an urgent bug or security vulnerability (see CVE-2024-36401 below).
This GeoServer 2.23.6 update is provided as a temporary measure. Rather plan to upgrade to a stable GeoServer 2.25.2 or maintenance GeoServer 2.24.4.
GeoServer 2.23.6 is made in conjunction with GeoTools 29.6, and GeoWebCache 1.23.5.
Thanks to Jody Garnett (GeoCat) for making this release on behalf of GeoCat customers.
Security ConsiderationsThis release addresses security vulnerabilities and is considered an essential update for production systems.
- CVE-2024-36401 Critical
- CVE-2024-24749 Moderate
The details of this vulnerability will be made available at the end of the month providing an opportunity to update.
See project security policy for more information on how security vulnerabilities are managed.
Release notesImprovement:
- GEOS-11327 Add warning about using embedded data directories
- GEOS-11347 STAC Landing Page links should include root link
Bug:
- GEOS-11331 OAuth2 can throw a “java.lang.RuntimeException: Never should reach this point”
Task:
- GEOS-11316 Update Spring version to 5.3.32
- GEOS-11318 Upgrade postgresql from 42.6.0 to 42.7.2
For the complete list see 2.23.6 release notes.
Community UpdatesCommunity module development:
- GEOS-11348 JMS cluster does not allow to publish style via REST “2 step” approach
- GEOS-11358 Feature-Autopopulate Update operation does not apply the Update Element filter
- GEOS-11381 Error in OIDC plugin in combination with RoleService
- GEOS-11412 Remove reference to JDOM from JMS Cluster (as JDOM is no longer in use)
Community modules are shared as source code to encourage collaboration. If a topic being explored is of interest to you, please contact the module developer to offer assistance.
About GeoServer 2.23 SeriesAdditional information on GeoServer 2.23 series:
- GeoServer 2.23 User Manual
- Drop Java 8
- GUI CSS Cleanup
- Add the possibility to use fixed values in Capabilities for Dimension metadata
- State of GeoServer 2.23
- GeoServer Feature Frenzy 2023
- GeoServer used in fun and interesting ways
- GeoServer Orientation
Release notes: ( 2.23.6 | 2.23.5 | 2.23.4 | 2.23.3 | 2.23.2 | 2.23.1 | 2.23.0 | 2.23-RC1 )
-
sur Camptocamp: 3D Technology Serving Rennes Métropole's Solar Cadastre
Publié: 13 June 2024, 2:00am CEST
Pièce jointe: [télécharger]
Camptocamp put its expertise to work for the city, by developing a totally customized application, based on an extremely clear user experience. -
sur Mappery: Anne Hathaway’s Garden
Publié: 12 June 2024, 11:00am CEST
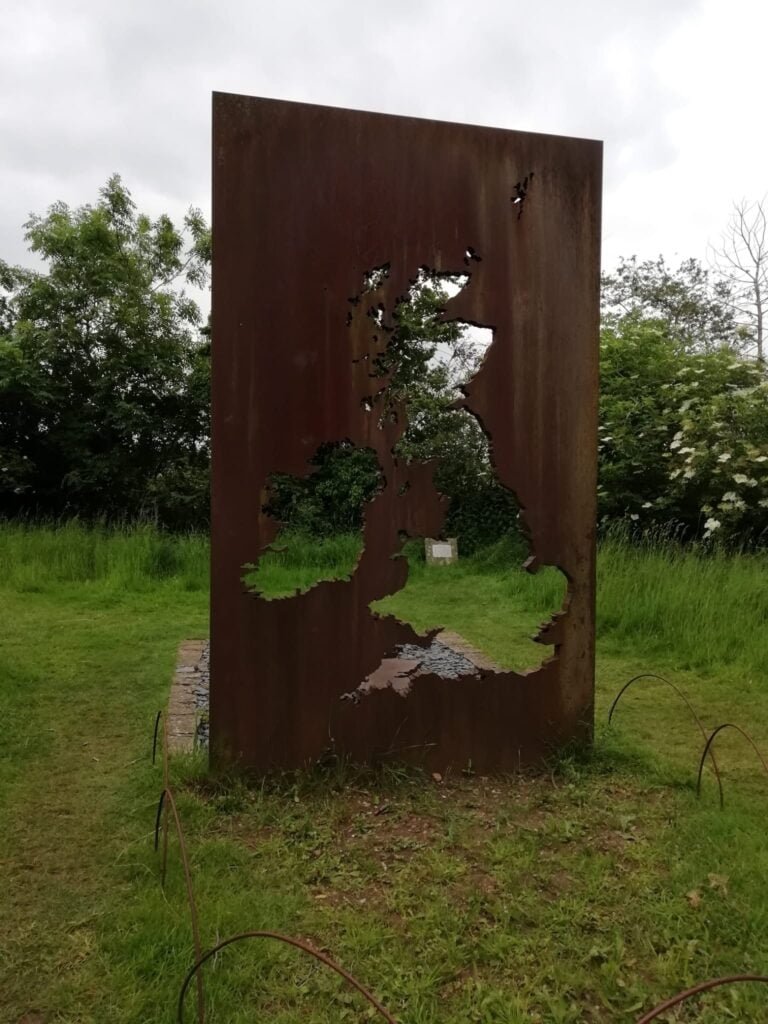
Berl spotted this map sculpture he found in the grounds of Ann Hathaway’s cottage just outside Stratford-on-Avon. It is described as:
A sculpture inspired by Shakespeare’s history plays, designed for Anne Hathaway’s Cottage Tree Garden. The sculptor is Jane Lawrence.
Not sure how this connects to the history plays with no towns depicted?
MapsintheWild Anne Hathaway’s Garden
-
sur Mappery: A Wild Map in Spitalfields
Publié: 11 June 2024, 11:00am CEST

Elizabeth spotted this cool looking bike in Spitalfields market in London
MapsintheWild A Wild Map in Spitalfields
-
sur OPENGIS.ch: QField 3.3 “Darién”: It is just the beginning
Publié: 11 June 2024, 6:50am CEST
QField 3.3 has been released, and with it, we are proud to introduce a brand new plugin framework that empowers users to customize and add completely new functionalities to their favourite field application. That’s on top of a bunch of new features and improvements added during this development cycle. What preceded this moment was just the beginning!
Main highlights
One of the biggest feature additions of this version is a brand new drawing tool that allows users to sketch out important details over captured photos or annotate drawing templates. This was a highly requested feature, which we are delighted to bring to all supported platforms (Android, iOS, Windows, macOS, and, of course, Linux) with the financial support of the Swiss QGIS user group.
Also landing in this version is support for copying and pasting vector features into and from the clipboard. This comes in handy in multiple ways, from providing a quick and easy way to transfer attributes from one feature to another through matching field names to pasting the details of a captured feature in the field into a third-party messenger, word editing, or email application. Copying and pasting features can be done through the feature form’s menu as well as long pressed over the map canvas. If copy pasting ain’t your style, a new feature-to-feature attributes transfer shortcut has also been added to the feature form’s menu. Appreciation to Switzerland, Canton of Lucerne, Environment and Energy for providing the funds for this feature.

The feature form continues to gain more functionalities; in this version, the feature form’s value map editor widget has gained a new toggle button interface that can help fasten data entry. The interface replaces the traditional combo box with a series of toggle buttons, lowering the number of taps required to pick a value. If you enjoy this as much as we do, send a virtual thanks to German Archaeological Institut – KulturGutRetter, which sponsored this feature.
Other improvements in the feature form include support for value relation item grouping and respect for the vector layer attributes’ “reuse last entered value” setting.

Finally, additional features that are sure to please include support for image decoration overlay, a new interface to hop through cameras (front, back, and external devices) for the ‘non-native’ camera, the possibility to disable the 3-finger map rotation gesture, and much more.
User experience improvementsLong-time users of QField will notice the new version restyling of the information panels such as GNSS positioning, navigation, elevation profile, and sensor data. The information is now presented as an overlay sitting on top of the map canvas, which increases the map canvas’ visibility while also achieving better focus and clarity on the provided details. While revisiting these information panels, we’ve made sure all details, including altitude and distance to destination, respect user-configured project distance unit type.
The dashboard’s legend has also received some attention. You can now toggle the visibility of any layer via a quick tap on a new eye icon sitting in the legend tree itself. Similarly, legend groups can be expanded and collapsed directly for the tree. This also permits you to show or hide layers while digitizing a feature, something which was not possible until now. The development of these improvements was supported by Gispo and sponsored by the National Land Survey of Finland.
Plugin frameworkLast but far away from least, QField 3.3 introduces a brand new plugin framework using Qt’s powerful QML and JavaScript engine. With a few lines of code, plugins can be written to tweak QField’s behaviour and add breathtaking capabilities. Two types of plugins are possible: app-wide plugins as well as project-scoped plugins. To ensure maximum ease of deployment, we have enabled project plugin distribution through QFieldCloud! We extend our heartfelt thanks to Amsa for the financial contribution that brought this incredible project to life.

Stay tuned for an upcoming webinar and a dedicated post that will dive into how QField plugins can revolutionize your field (and business) workflows by allowing you to be even more efficient in the field.
Users interested in authoring plugins or better understanding the framework can already visit the dedicated documentation page, a sample plugin implementation sporting a weather forecast integration and our latest blog article.
-
sur Mappery: Eshkol
Publié: 10 June 2024, 1:00pm CEST
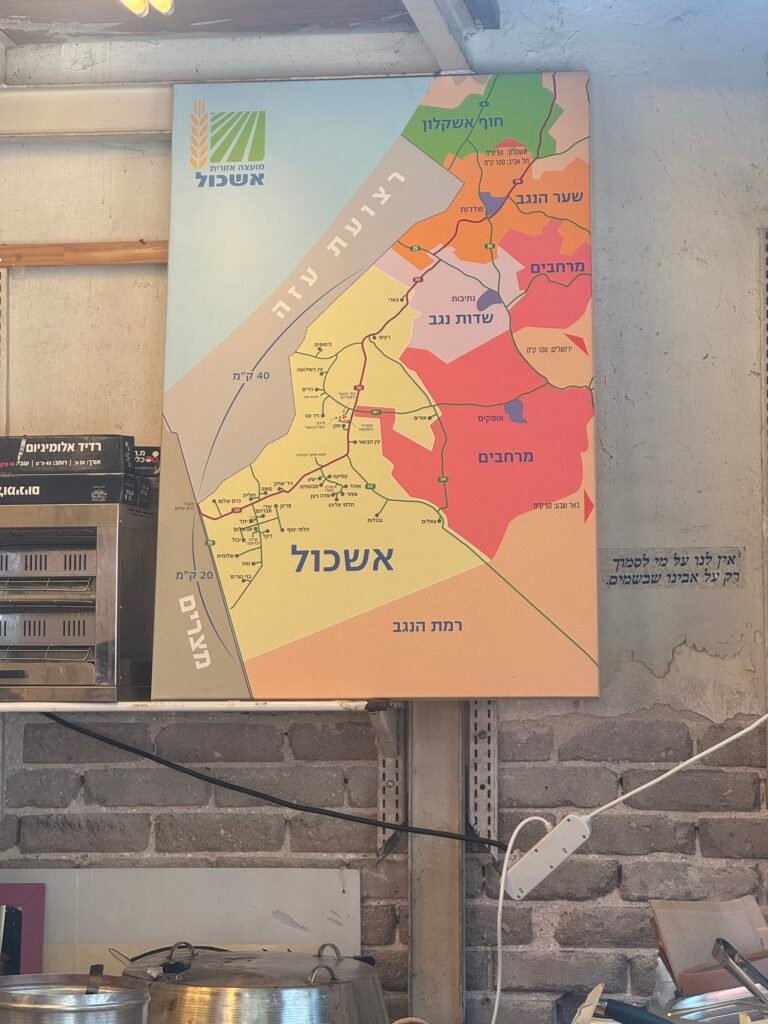
Spotted this map in a cafe in Tel Aviv.
Eshkol is the region adjacent to the Gaza Strip where the attack of 7/10 took place.
It’s a map in the wild not an endorsement of either side in this conflict
MapsintheWild Eshkol
-
sur Mappery: Breweries of the World
Publié: 9 June 2024, 11:00am CEST
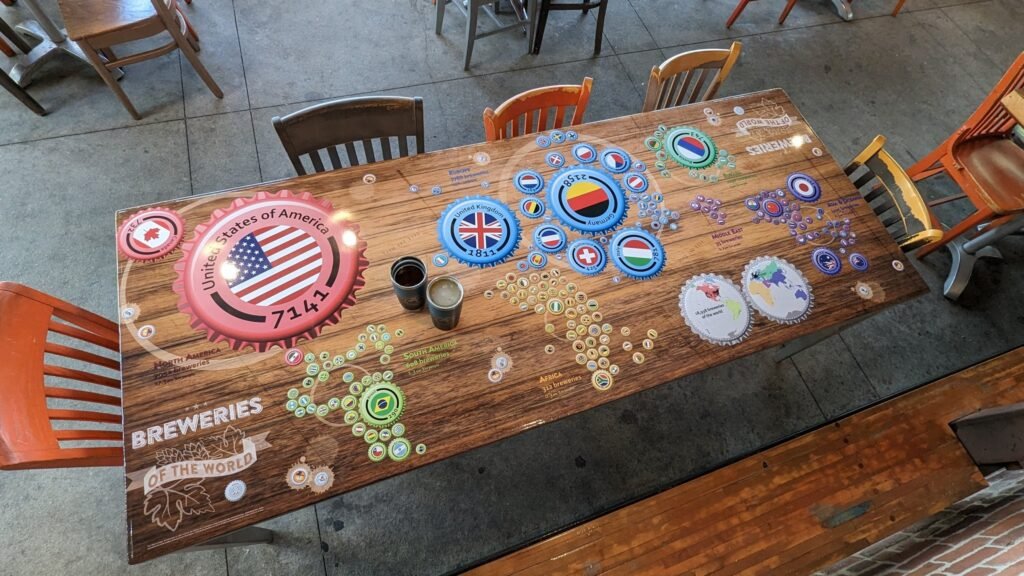
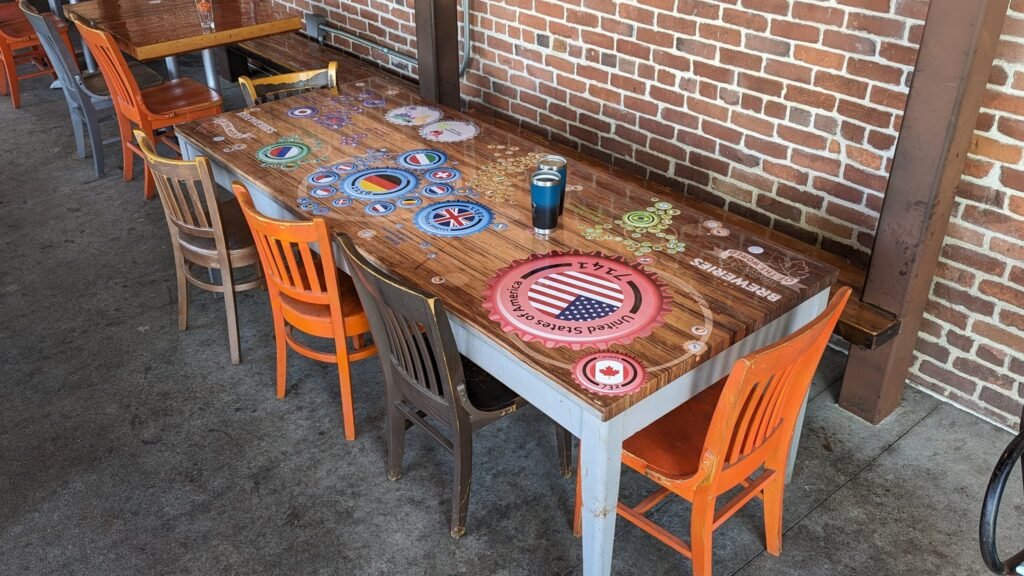
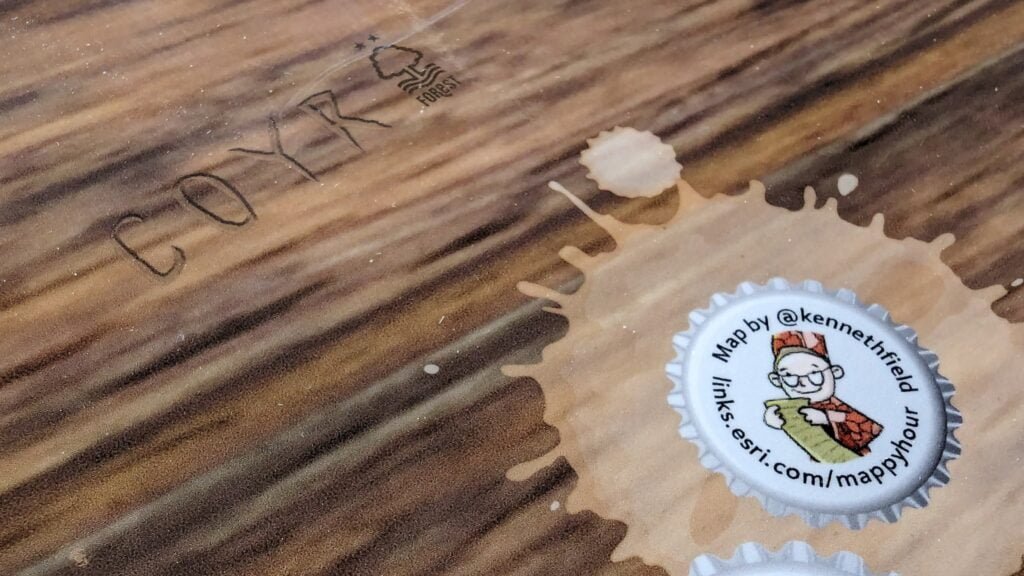

And to end the week nicely, refreshingly, I would say, here is our co-founder, who is back with some art in a bar. This is a version of Kenneth Field’s Breweries of the World.
MapsintheWild Breweries of the World
-
sur Mappery: « C215 autour de l’Inguimbertine »
Publié: 8 June 2024, 11:00am CEST

From the 8th of June to the 31st of October 2024, a temporary exhibition at the Inguimbertine, Carpentras (FR) Chrisitan Guémy, alias C215, exhibits these works, including the maps.
Chrisitan Guémy’s website (link to the English version).
About the exhibit, follow this other link (FR)
MapsintheWild « C215 autour de l’Inguimbertine »
-
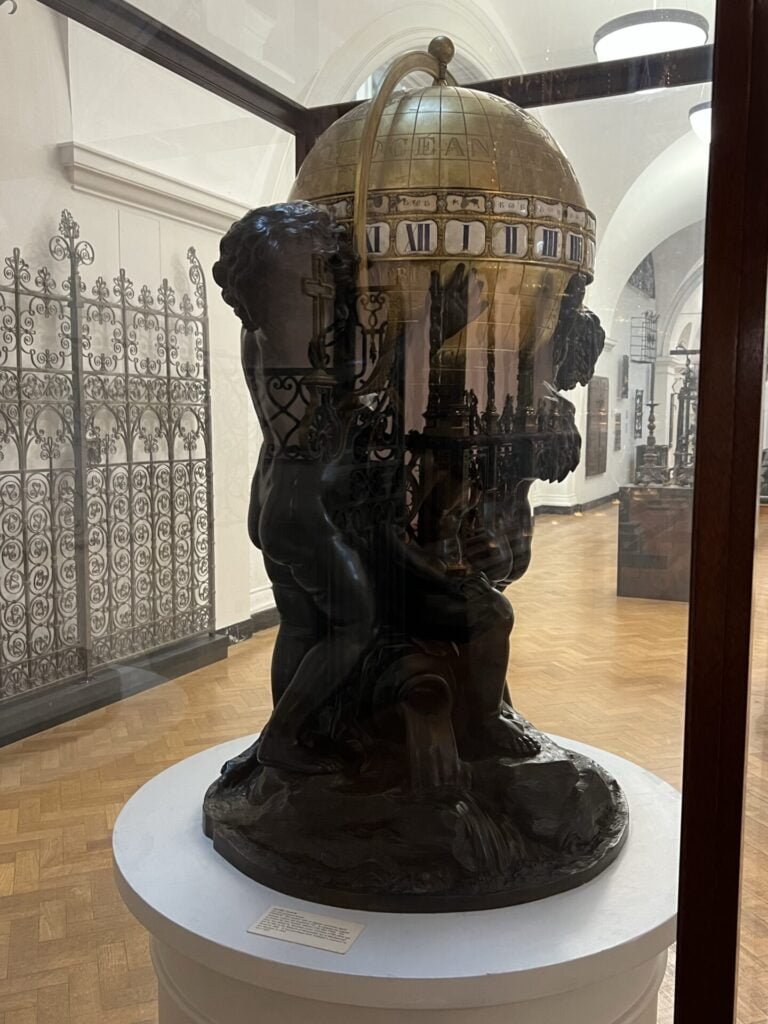
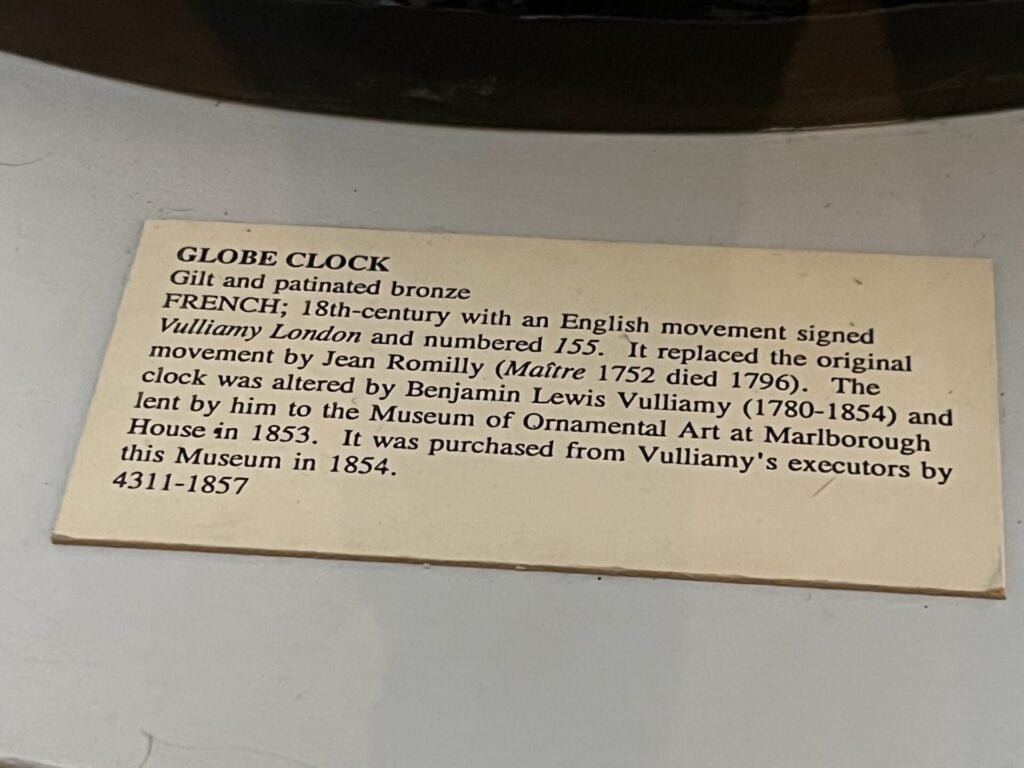
sur Mappery: Globe clock
Publié: 7 June 2024, 11:00am CEST
-
sur QGIS Blog: Danish User Group becomes Flagship Member
Publié: 7 June 2024, 7:34am CEST
QGIS User Groups all over the world have become an essential component of the QGIS community. They provide a point of contact for local users and developers and help people connect through localized communication channels or by organizing events.
Another important aspect of users groups is that many of them also have become sustaining members of QGIS.ORG. In total, their contributions account for a significant share of our project budget.
The Danish User Group now has opened a new chapter by becoming the first user group supporting QGIS on the Flagship level. And that’s a reason to celebrate
 and to reminisce. For example, about the awesome time we had at the first QGIS User Conference organized at the University of Copenhagen campus in Nødebo.
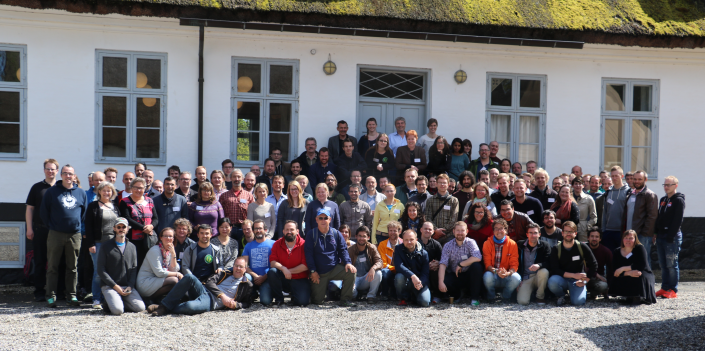
And who can forget how we all struggled to pronounce QGIS 2.16 “Nødebo”?
And how the “ø” upset some services? Good times.
Thank you very much to everyone from the Danish user group and to all the other user groups, small and large, who support QGIS our project and help make it even better for everyone.
-
sur Mapgears: Mapgears wins the regional MercadOr award in the category ‘Sustained Growth in Exportation’
Publié: 6 June 2024, 5:24pm CEST
On June 5th, SERDEX International awarded prizes to four companies that stood out in the region. Mapgears was one of the winning companies in the “Sustained Growth in Exportation” category. As mentioned by Daniel Morissette, President of Mapgears:
This award is a recognition for the entire Mapgears team: we sell software, and our raw materials to make it are the brains, skills, and creativity of the team members… without all the team members, none of this would have been possible.
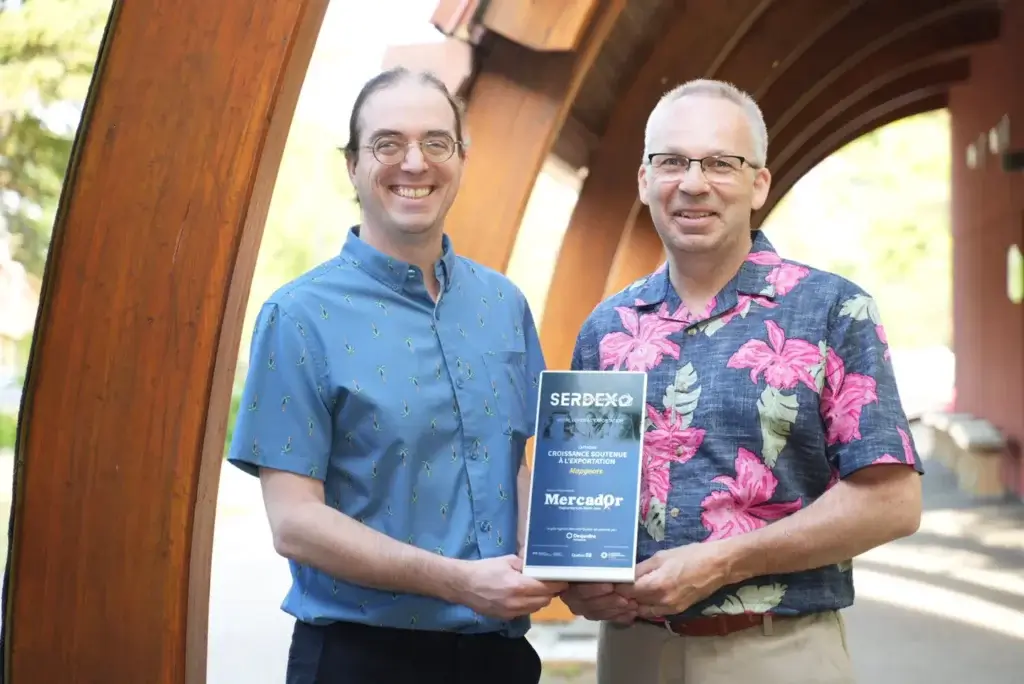
Photo Credit: Journal Le Quotidien
To learn more about this wonderful evening and the incredible companies that were honored, we invite you to read the article in Le Quotidien newspaper right here! (French only)
The post Mapgears wins the regional MercadOr award in the category ‘Sustained Growth in Exportation’ appeared first on Mapgears.
-
sur Tim Waters: Vaisigano
Publié: 6 June 2024, 5:14pm CEST
Vaisigano is a prototype citizen science project focused on fresh water resources by National University of Samoa and The Übersee Museum. On Instagram @s_vaisigano and on Facebook Citizen Science Vaisigano. Vaisigano is the name of the river in Samoa by the University.
Last year I was involved to help develop the prototype mobile-first web app for geolocated data collection ahead of a visit to the field with biologists and students.
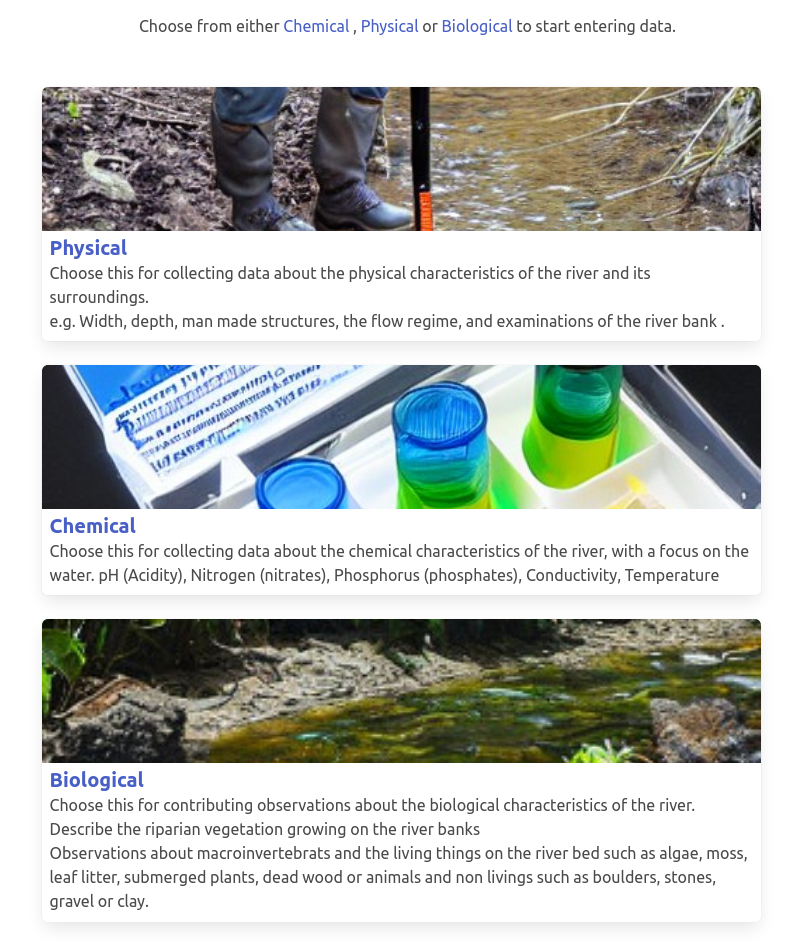
Aimed at non specialist university students to use in the field to help survey and record measurements and observations for river quality health along a river in Samoa. The purpose of this first app is to show possibilities and demonstration for future solutions. River and water quality measurements can involve surveys for invertebrates (aquatic insects), pH of the water, turbidity, velocity, temperature etc. Traditionally such surveys were taken, recorded on paper and input later back in the laboratory. A mobile device out in the field can also have documents, multimedia and tutorials to guide users. The project involved research into Citizen Science projects. Many good platforms exist, for example ODK or Kobo which can have very complex and detailed logic for forms but it was decided that a more user friendly and casual approach would be better.
The front page gives a brief outline, a call to action button “Start Collecting”, two summary tables of the latest observations and the latest active users.

The main aims:
- Sustainable – able to run on its own
- Collect data in a continuous manner
- Accessible and easy to use
- Handheld
- Benefit learning for curriculum
- Incorporate reinforcement rewards, feedback
- Surveys should be georeferenced
- Review of previous surveys
Some of the challenges included GPS variability in forest, using mobile devices and water, and bandwidth requirements in the field.
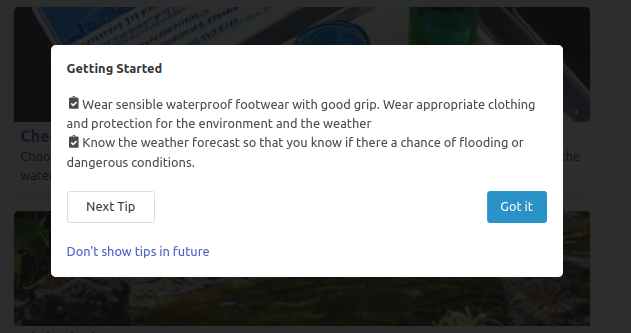
The app showed tips before starting.

The application was designed around 3 types of data forms. physical, biological and chemical
Each form had a time and location which used browser / GPS geolocation. Users could move the location if they wanted.

Physical
- River width
- River depth
- Has it been raining or not?
- What evidence of water user can you see (fishing, boats, use for homes, irrigation, etc)
- What man made structures can you see (e.g. weirds, dams, wells, bypass channels etc
- On the surface. Can you see foam, litter, oil on the surface?
- What land use is around the site (pasture, town, forest etc)
- Flow regime. (pools, ripples, waterfalls, rapids, cascade etc)
- What is the colour of the water (clear, murky etc)
- Estimate the water flow (still, slower, or faster than walking speed etc)
- Turblence of water (calm, turbulent)
- Images looking down stream showing both banks
Chemical
These needed a kit to help complete- Water temperature
- Water acidity
- Conductivity
- Nitrates
- Phosphates
Biological
- Description of the river bank and vegetation and what % of the river is shade
- What evidence of aquatic life: plants below surface, emerging, floating. Fish, insects etc
- Substrates – boulders, stones, gravel, sand, organic matter etc
- Macroinvertables
- From kick sampling
- These allowed users to add a name with a count and attach images.
- Some species would be pre-populatated in the boxes.

The site has an admin page which allows editing and reviewing of contributions and allows them to download all the data as a spreadsheet and to download the images zipped up.
The site has a simple scoring for users based on number of contributions, and shows feedback of their contributions so that people can see the reports coming in and the nature of them


code on github
-
sur GRASS GIS: Results of the GRASS GIS student grant
Publié: 6 June 2024, 1:12pm CEST
Easy command history navigation through the History browser panel Linda’s work in her own words During my master’s studies, I began contributing to the enhancement of the GRASS GIS user interface (GUI). My main goal was to increase its user-friendliness, making GRASS accessible not only to experienced users with scripting knowledge but also to GIS beginners. Over the years, I have worked on several projects, including: “Creation of a new GRASS GIS startup mechanism”, “First steps towards a new GRASS GIS Single-Window GUI “, “Redesigning a map display status bar combo box into a new settings dialog “, “Improving Single-Window GUI user experience”. -
sur Mappery: D-Day Landings
Publié: 6 June 2024, 11:00am CEST

Elizabeth spotted this advert for a special commemorative coin for the D-Day landings which took place on June 6th, 1944. The coin has a map illustrating the five landing sites – Utah, Omaha, Gold, Juno and Sword
MapsintheWild D-Day Landings
-
sur OPENGIS.ch: QField receives prestigious recognition as a digital public good from the Digital Public Goods Alliance
Publié: 6 June 2024, 8:28am CEST
We are thrilled to announce that the Best of Swiss Apps Enterprise winner 2022, QField, has been officially recognized as a Digital Public Good by the UN-endorsed Digital Public Goods Alliance. This prestigious recognition highlights QField’s significant contributions to six key Sustainable Development Goals (SDGs): SDG 6 (Clean Water and Sanitation), SDG 9 (Industry, Innovation, and Infrastructure), SDG 11 (Sustainable Cities and Communities), SDG 13 (Climate Action), SDG 15 (Life on Land), and SDG 16 (Peace, Justice, and Strong Institutions). The “Swiss Made Software” QField is the leading fieldwork application with almost 1 Million downloads worldwide.
Leading the Way in Fieldwork TechnologyQField stands out as the leading fieldwork app, designed to bring the power of geospatial data collection and management to the fingertips of users worldwide. Developed with a user-centric approach, QField allows seamless integration with QGIS, providing a robust and intuitive platform for data collection, visualization, and analysis directly in the field. This recognition as a Digital Public Good underscores QField’s vital role in advancing digital solutions for sustainable development.
 QField 3.2 Statistics
Accessible for Everyone
QField 3.2 Statistics
Accessible for Everyone
One of QField’s key strengths is its ease of use, making it accessible not only to professionals but also to students, researchers, and community members. Its intuitive interface ensures that users with varying levels of technical expertise can efficiently collect and manage geospatial data. This inclusivity promotes wider adoption and engagement, enhancing the app’s impact across different sectors and communities.
 Land surveying project Tonga
Exemplary Open Source Project
Land surveying project Tonga
Exemplary Open Source Project
At the heart of QField’s success is its commitment to technological excellence and open-source principles. As an exemplary open-source project, QField fosters a collaborative environment where developers and users alike contribute to continuous improvement and innovation. QField frequently contributes back to its upstream project, QGIS, ensuring mutual growth and enhancement of both platforms. This community-driven approach not only enhances the app’s functionality but also ensures that it remains accessible and adaptable to diverse needs across the globe.
Supporting Sustainable Development GoalsQField’s capabilities extend beyond just one aspect of the United Nations Sustainable Development Goals (SDGs); they intersect with multiple goals, enhancing efforts towards a sustainable future:
- SDG 6: Clean Water and Sanitation: QField facilitates efficient water quality monitoring and management, ensuring communities have access to clean and safe water.
- SDG 9: Industry, Innovation, and Infrastructure: By providing cutting-edge tools for infrastructure planning and development, QField drives innovation in various industries.
- SDG 11: Sustainable Cities and Communities: QField supports urban planning and sustainable development, contributing to the creation of resilient and inclusive cities.
- SDG 13: Climate Action: The app enables precise data collection for climate research and environmental monitoring, aiding in climate action initiatives.
- SDG 15: Life on Land: QField aids in biodiversity assessments and conservation efforts, promoting the sustainable use of terrestrial ecosystems.
- SDG 16: Peace, Justice, and Strong Institutions: Through its reliable and transparent data management capabilities, QField supports the development of strong institutions and governance systems.
 Post-disaster assessment Tonga
A Future of Innovation and Sustainability
Post-disaster assessment Tonga
A Future of Innovation and Sustainability
As we celebrate this recognition, we remain committed to pushing the boundaries of what is possible in fieldwork technology. QField will continue to evolve, driven by the needs of its global user base and the imperative to support sustainable development. We invite all stakeholders to join us on this journey towards a more sustainable and equitable future.
 Land surveying project Tonga
For more information about QField and its contributions to the SDGs, please visit [https:]]
Media Contact:Marco Bernasocchi is happy to receive interview requests or queries about the project.
Email: marco@opengis.ch
Phone: +41 79 467 24 70 (14:00 – 18:00 CET)OPENGIS.ch GmbH
About the OPENGIS.ch product “QField” application
Via Geinas 2
CH-7031 LaaxQField is an open-source fieldwork app that integrates seamlessly with #QGIS, providing a powerful platform for data collection, visualization, and analysis. Designed for professionals across various sectors, QField empowers users to efficiently manage and analyze geospatial data in the field, contributing to sustainable development and innovation worldwide. Link: https://qfield.org
 About the OPENGIS.ch service QFieldCloud
#QFieldCloud is a spatial cloud service integrated in #QField that allows remote provisioning and synchronisation of geodata and projects. Although “QFieldCloud” is still in an advanced beta stage, it is already being used by many groups to significantly improve their workflows. Link: https://qfield.cloud
About OPENGIS.ch:OPENGIS.ch GmbH is a Swiss software development company based in Laax. OPENGIS.ch employs 19 people and works mainly in the field of spatial software development, geodata infrastructure deployments and professional support. Personalised open-source GIS solutions are often planned and developed as desktop or mobile applications. OPENGIS.ch finances itself through tailor-made customer solutions, professional support and adaptations. Link: https://opengis.ch
 OPENGIS.ch
About Digital Public Goods Alliance (DPGA)
OPENGIS.ch
About Digital Public Goods Alliance (DPGA)
The Digital Public Goods Alliance is a multi-stakeholder initiative endorsed by the United Nations Secretary-General, working to accelerate the attainment of the Sustainable Development Goals in low- and middle-income countries by facilitating the discovery, development, use of, and investment in digital public goods.
For more information on the Digital Public Goods Alliance please reach out to hello@digitalpublicgoods.net.
Images for editorial purposes are freely available for download if the copyright ©OPENGIS.ch is mentioned: [https:]]
-
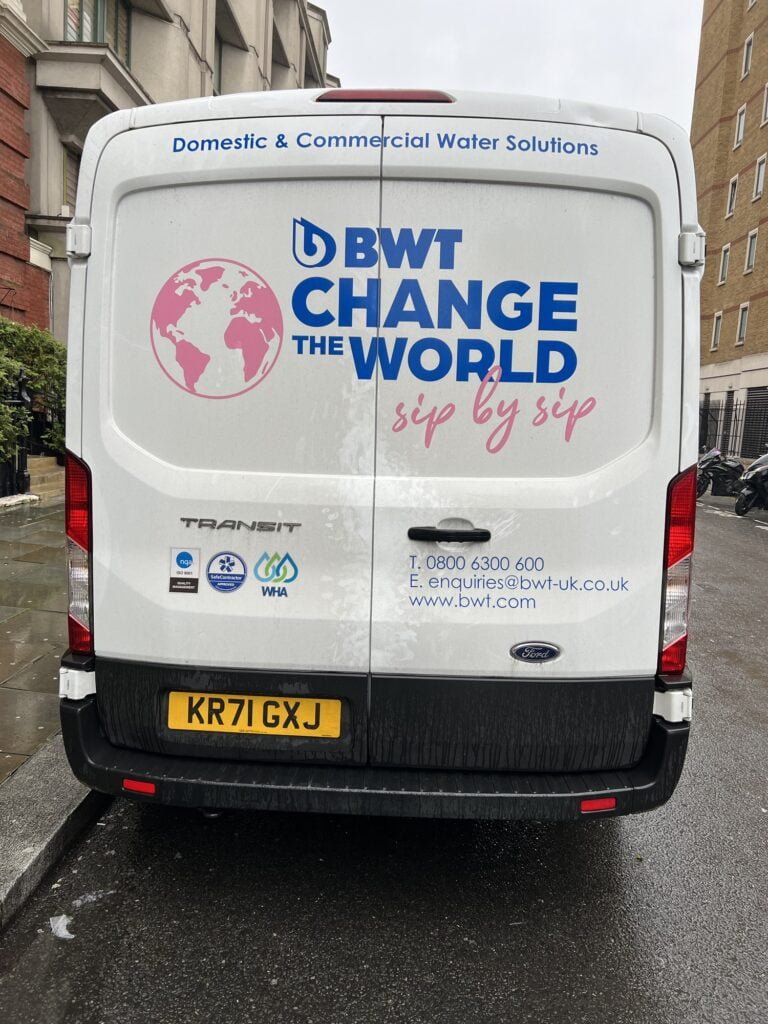
sur Mappery: Change the World sip by sip
Publié: 5 June 2024, 11:00am CEST
-
sur GeoServer Team: How to Implement Basic Security in Geoserver
Publié: 5 June 2024, 2:00am CEST
GeoSpatial Techno is a startup focused on geospatial information that is providing e-learning courses to enhance the knowledge of geospatial information users, students, and other startups. The main approach of this startup is providing quality, valid specialized training in the field of geospatial information.
( YouTube | LinkedIn | Facebook | X )
How to Implement Basic Security in GeoserverIn this session, we want to discuss the Security section in GeoServer, Defining Users, Groups, and Roles, and Granting rights to created users. If you want to access the complete tutorial, simply click on the link.
Introduction
GeoServer has a robust security subsystem. Most of the security features are available through the Web Administration interface. In the Security panel, you can find links to set user properties and bind data to security rules. The basic idea is that you create users and roles, and then combine them with data rules to enable a specific set of access policies. You can also limit read and write access by role.
Defining users, groups, and rolesSecurity in GeoServer is based on a role system where each role defines a specific set of functions. You can assign roles to users and groups; that is, assign functions to real people using your system. To ensure data security, you must identify who is accessing your layers and services.
To organize your real users, GeoServer provides you with the user, group, and role concepts. With the first two, you can insert real people into the GeoServer security subsystem, and with roles, you can grant rights to real users.
User definitionIn GeoServer, a user is someone entitled to use the system; it may be another software or a real person. When you add a user to the security system, GeoServer stores a username, uniquely identifying the user, a password, and a set of key/value pairs to store general information about it. You can disable a user at any time, preventing him from using the system.
Group definitionA group in GeoServer is a collection of users. It consists of a list of usernames that are part of the group, along with a unique group name that identifies it. Since GeoServer may have a large number of users, assigning roles to each individual user can be challenging. Therefore, groups can be created to simplify the process, allowing roles to be assigned based on the group membership of users.
Note. Considering that there are no dependencies between users, groups, and roles. A group can be disabled, but note that this only removes the roles deriving from the disabled group and does not disable the users belonging to the group.
Roles definitionGeoServer roles are associated with performing certain tasks or accessing particular resources. Roles are assigned to users and groups, authorizing them to perform the actions associated with the role.
Creating users and groupsTo fully understand how security works in GeoServer, we will use a typical scenario. We want to restrict access to this data to only the organization’s members. Inside the organization, there are a few people editing data to create new data sets or to update existing ones, and many more members who need to read data to compose maps. There is also a need for an administrator to keep it all working. Lastly, we need to consider that our GeoServer site also contains data that should remain freely available. We will now create the security organization from an unsecured GeoServer as follows:
- In the Security section of the left pane, click the Users, Groups, and Roles link. This link shows you the User Group Services configured. You will find the default service shipped with GeoServer. Click on the Name to edit it.
- Select the Groups tab, then click on Add a new group.
- Enter
group_readersas a group name and leave the group Enabled. Do not assign any role to the new group as we will create specific roles later. Press the Save button. - Repeat the previous step to create the
group_editorsandgroup_adminsgroups. Your list should now show the three groups. - Now switch to the Users tab. Obviously, it lists the only existing user, that is, admin, as shown in the screen.
- Click on the Add new user link, and add
user_adminwith a password of your choice, as Data Administrator. - Add “user_admin” to the “group_admins”, then press the Save button.
- Repeat the previous step to create a user,
user_editoras a member of the “group_editors” group, anduser_readeras a “group_readers” group member. Your list now shows the three users.
We just created three users for the three groups and this may seem overkill to you. Consider them as templates for real users. In the real world, we do not want to have too many administrators; we will probably need several “user_readers” and “user_editors” processing the data. Now, we need to define what they can do on GeoServer.
Defining rolesA user or a group without any role assigned is useless. Now it is time to create roles and assign them to our users. Please refer to the following points:
- From the User, Groups, and Roles section, select the Roles tab. You will find that two roles already exist. They are the administrative roles assigned to the admin account, and they grant access to all GeoServer configurations. Click on the Edit link
- Switch to the Roles tab, then click on Add new role.
- Enter
role_readeras a new role name. We do not need a Parent role. A child role inherits all the rights from the Parent role, making it useful when you want to extend a basic role with more rights. Indeed, we will do this in the next step. - Press the Save button and then repeat the previous step to create the
role_editorrole. This time, select “role_reader” as the Parent role. - Press the Save button and then repeat the previous step to create the
role_adminrole. This time, select “role_editor” as the Parent role. - The final step is to associate a role to users or groups. Select the User, Groups, and Roles page from the left pane, then select the Groups list and click on the “group_readers” group to edit it. Add the “role_reader” role to the group and save it.
- Now click on the “group_editors” group and associate it with the role_editor role.
- Finally, associate the “group_admins” group to the “role_admin” role.
By defining roles and associating them to the users, we completed the definition of our organization. Now, we need to explore how data is bound to roles and users.
Accessing data and servicesGeoServer supports access control at both the service level and at the per-layer or per-workspace level, allowing for restriction of service operations to authenticate users with specific roles. This helps in ensuring data security and controlling access to different layers or workspaces within the server. When working with layers, you can define rules that specify what a role can do on any specific layer.
The operations controlled are the view, write, and admin access. When granting read access on a layer, you enable a user to add it on a map; while granting write access you enable the user to update, create, and delete features contained in the layer. The admin access level enables the user to update the layer’s configuration.
Layer SecurityWe want to protect the dataset contained in the
testworkspace from unauthorized access while leaving the remaining layers freely available to all users. In this section, we will associate layers and roles:- Navigate to the Data > Security page. The rules list shows the two shipped with the default GeoServer configuration.
The
*.*.rrule is associated with the*roles. This means that “any user”, including the anonymous one, can access “any layer” from “any workspace” configured on GeoServer. The general format of the rules is: workspace.layer.accessMode. - Now click on the Add new rule link. In the rule editing page, select
testas the Workspace and leave “*” as a Layer. Since we want to protect all layers in this workspace, the Access mode should be Read. Select the “role_reader” role and move it to the right list by clicking on the arrow. Press the Save button to create the reading rule. - Repeat the previous step to create a writing rule. Select Write as the access mode and “role_editor” as the role.
- Repeat the previous step, then create the administration rule. In other words, select Admin as the Access mode and “role_admin” as the Role.
- Press the Save button, on the rule list page, and then log off from the GeoServer web interface. If you try to access the layer preview anonymously, you won’t see any layers from the
testworkspace while all the others are still listed. - Now, log on as “user_reader”, with the password you assigned to him. Going back to the layer preview, you should see the
testlayers listed. Try the Open Layers preview page for theriverlayer. It works and you can use the data to compose maps. - However, “user_reader” can’t edit the styles associated with the layer or any other property. He would need admin rights granted for it; can you guess who the proper user will be?
- Log on to GeoServer as “user_admin”. Now, the left pane is richer than it was when you were “user_reader”, but with fewer features than those visible to the GeoServer’s default admin role. Click on the Layer link; you will see only the layers belonging to the
testworkspace. - If you go on Layer preview and select the
riverslayer again, can you see the map? Of course, you can. Because of roles inheritance, which you set when creating the roles. So, “role_admin” inherits all the rights from “role_editor”, and hence from “role_reader”.
In this session, we took a brief journey through GeoServer security. we discussed the Security section, Defining Users, Groups, and Roles, and Granting rights to created users in GeoServer. If you want to access the complete tutorial, simply click on the link.
-
sur Mappery: The Mountain Goats Tour 2019
Publié: 4 June 2024, 11:00am CEST
-
sur Mappery: Clerkenwell Design Week
Publié: 3 June 2024, 11:00am CEST
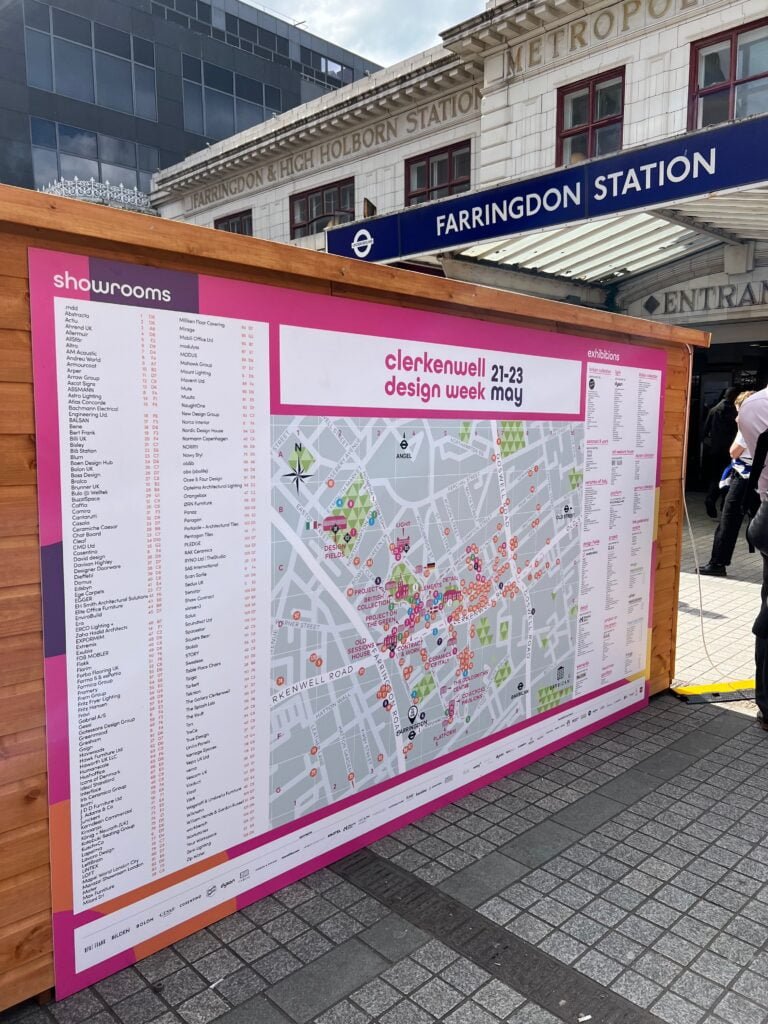
A few weeks ago, Clerkenwell Design Week took place. The website offers an interactive virtual map, but luckily, we could find some real ones, in the wild, wandering in the street during the event.
MapsintheWild Clerkenwell Design Week
-
sur Mappery: Shirts
Publié: 2 June 2024, 11:00am CEST
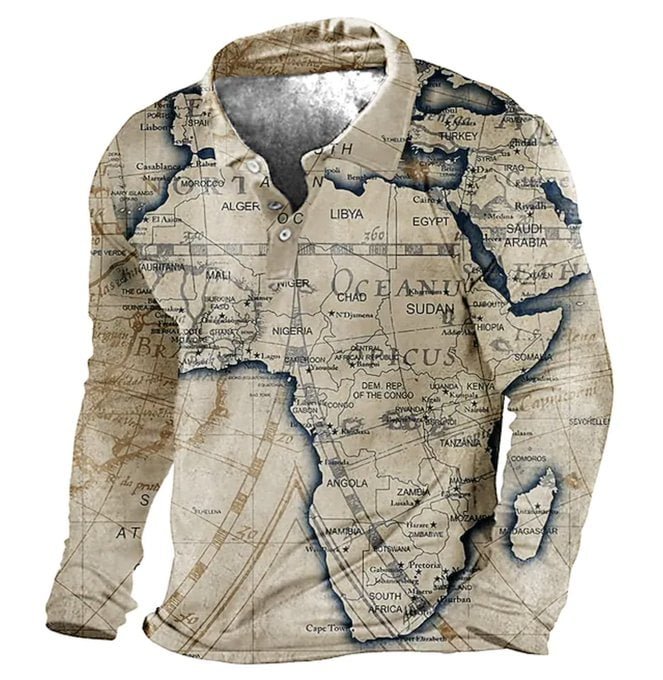
Alex Selby-Boothroyd sent us these shirts; thank you for sharing. Let’s do a bit of commercial, here is a link men-s-golf-shirt. And some other options below
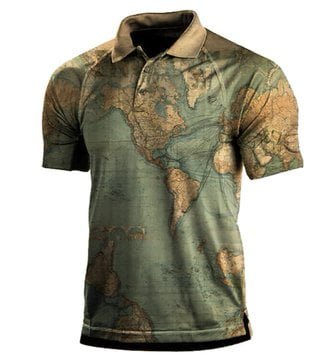
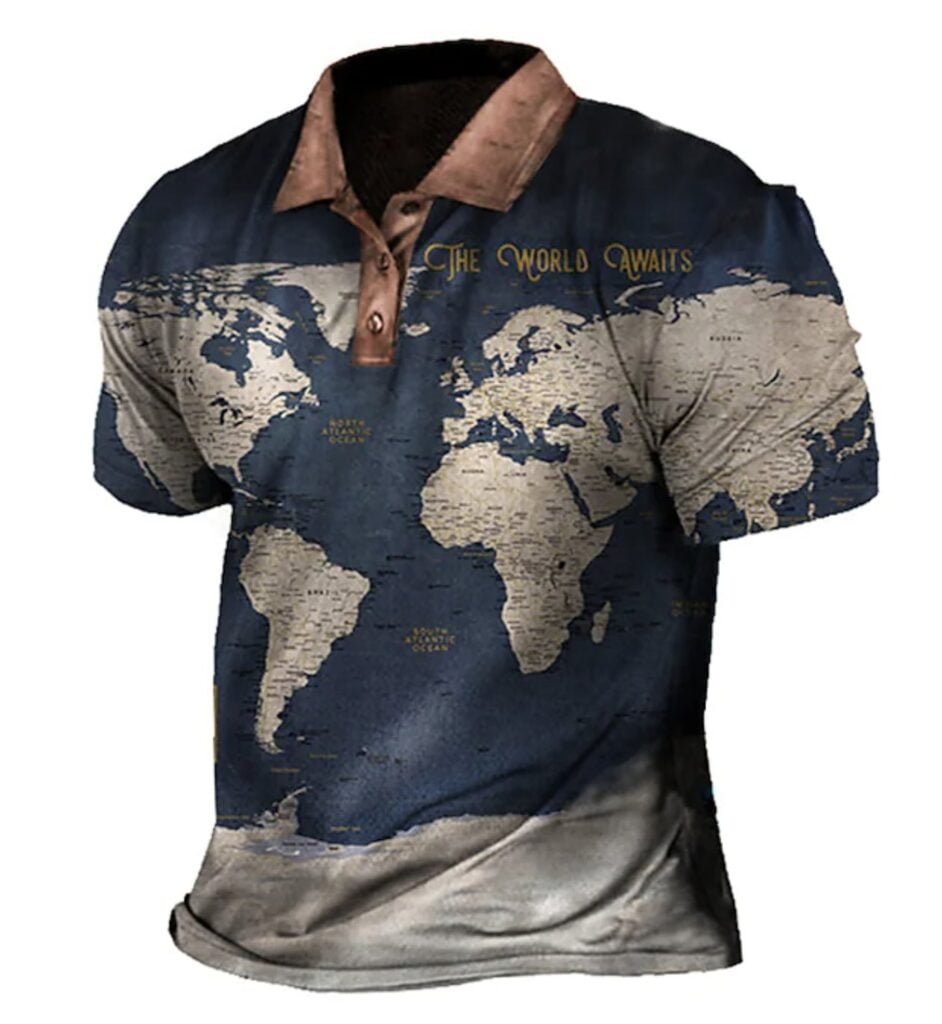
MapsintheWild Shirts
-
sur Mappery: Netherlands in a Sushi
Publié: 1 June 2024, 11:00am CEST

Reinder sent us a while ago this sushi roll; for a long time, I hesitated to publish it; is this real? Let’s have a conversation on our social. And for now let’s enjoy the sushis.
MapsintheWild Netherlands in a Sushi
-
sur Paul Ramsey: Cancer 10
Publié: 1 June 2024, 2:00am CEST
Back to entry 1
So, I got the news from pathology.
There is no cancer left in me, I am officially “cured”.
Since I am still recovering from surgery and relearning what my GI tract is going to do for the future, I don’t feel entirely cured, but I do feel the weight of wondering about the future lifted off of me.
The future will not hold any more major cancer treatments, just annual screening colonoscopies, and getting better post-surgery.
I truly have had the snack-sized experience, not that I would recommend it to anyone. Diagnosed late February, spit off the back of the conveyor belt in late May. Three months in Cancerland, three months too many.
A few days ago NBA great Bill Walton died of colorectal cancer. It’s the second most common cancer in both men and women, and you can avoid a trip to Cancerland through the simple expedient of getting screened. Don’t skip it because you are young, colorectal cancer rates amount people under 50 are going up fast, and nobody knows why (there’s something in the environment, probably).
-
sur Mappery: Palm Springs airport
Publié: 31 May 2024, 11:00am CEST
-
sur gvSIG Team: The Ministry of Transport and Sustainable Mobility awards the first National Prize for Geographic Sciences to the gvSIG association
Publié: 31 May 2024, 8:34am CEST
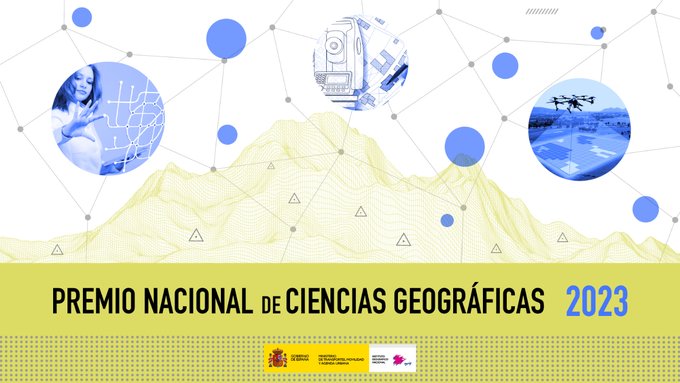
The Ministry of Transport and Sustainable Mobility has awarded the gvSIG association the first National Prize for Geographic Sciences, which honors individuals or entities that have made significant contributions through special actions or professional careers in the field of Geographic Sciences. The award resolution will be published shortly in the Official State Gazette (BOE).
This award, which includes a monetary prize of 20,000 euros, is overseen by the National Geographic Information Center at the initiative of the Superior Geographic Council, the governing body of the National Cartographic System. It aims to highlight the contribution, innovation, and impact of advancements achieved in the production, updating, and everyday use of geographic information, its infrastructures, and the derived products and services.
The gvSIG Association is a Spanish non-profit entity dedicated to research, innovation, and development of free and open-source software technologies related to geographic sciences. Based on values such as collaboration, solidarity, and shared knowledge, it has become an international reference, with its catalog of technological solutions for managing geographic information being used practically worldwide.
The gvSIG Association has made significant contributions to the open-source community and geographic technologies, as well as to the promotion of standards. It has developed a range of widely used solutions that have enabled the establishment of a new successful business model, allowing small and medium-sized Spanish companies to offer services and projects in various countries.
Thus, it has carried out projects in more than thirty countries, promoting the internationalization of Spanish companies. Examples of major projects include the Spatial Data Infrastructure of Uruguay, the SDI of the State of Tocantins in Brazil, the application for identifying risks in the movements of Blue Helmets in Mali, the SDI of Repsol for managing renewable energy projects, the Urban Expansion Atlas developed for UN-Habitat, and the current development of the multipurpose cadastral management system of the Dominican Republic.
The National Prize for Geographic Sciences thus recognizes this association for its individual and collective contributions and innovations in the field of geographic sciences and engineering, geomatics, cartography, and geospatial information, as well as its significance and impact on public administrations and society in general.
The jury that recommended granting the award made its decision unanimously after evaluating the merits of a total of fourteen candidates, which raised the deliberations to a high level of excellence. The jury was chaired by the Undersecretary of Transport and Sustainable Mobility and President of the Superior Geographic Council, with the Director General of the IGN and President of the CNIG acting as vice president, and included members representing the governing bodies of the Superior Geographic Council and professional associations in the field of geographic sciences.


-
sur Plugin QGIS French Locator Filter 1.1.0 : API Photon et personnalisation avancée !
Publié: 31 May 2024, 7:14am CEST par Jean-Marie Kerloch
Avec près de 50 000 téléchargements depuis sa première version, le plugin QGIS French Locator Filter est utilisé par de nombreux utilisateurs Français. Nous avons dernièrement eu l’occasion de le faire évoluer à l’occasion d’un projet client mais de façon significative et qui profite à tout le monde ! on prend enfin le temps de vous présenter la nouvelle version 1.1.0 !
Pour rappel ce plugin permet simplement une recherche sur la BAN (Base Nationale des Adresses) depuis la barre de recherche de QGIS (en bas à gauche de l’interface principale).

French Locator Filter dans le gestionnaire d’extensions de QGIS 3.34 LTR
Mais pourquoi une nouvelle version pour un plugin qui semble déjà répondre aux besoins des utilisateurs (on n’a quasiment aucune demande entrante) ? Tout simplement parce qu’un de nos clients avait besoin d’un autre service de géocodage et qu’on s’est dit qu’il était bien mieux de le partager avec tous plutôt que de garder ça pour nous/eux.
Encore une bonne raison pour tous d’adhérer aux principes de l’OpenSource !
- Le client : la Métropole du Grand Lyon
- Le projet : refonte de l’application Dryade (outil de gestion du patrimoine arboré) pour un passage sur QGIS
- Le besoin : permettre l’utilisation d’un outil de recherche d’adresse adossé à un service internalisé et basé sur Photon
Il s’agit d’une API de recherche d’adresse (géocodage) basée sur les données OpenStreetMap (OSM). Développé par Komoot, le service utilise ElasticSearch pour les recherches et se présente comme une alternative au vénérable Nominatim. Si vous voulez essayer, une instance publique est à disposition et disponible sur le site officiel de la solution : [https:]] .
document.createElement('video'); [https:]]L’API se rapproche de celle d’Addok, brique logicielle de géocodage développée pour les besoins de la BAN et désormais bien connue et intégrée un peu partout (notamment sur adresse.gouv.fr et la Géoplateforme de l’IGN). La Métropole du Grand Lyon a déployé une instance en interne dont on peut consulter la documentation parmi les autres services liés à Data Grand Lyon.
Plutôt que de faire un autre plugin de géocodage, nous avons décidé de mutualiser un maximum de code et d’intégrer le géocodage Photon dans les fonctionnalités du plugin QGIS French Locator Filter. Certes, un travail plus long mais plus pérenne et profitable à beaucoup plus d’utilisateur/ices.
Fonctionnellement, cet ajout permet d’avoir un service indépendant avec des résultats complémentaires.
Une personnalisation plus pousséeEn plus de l’enrichissement fonctionnel, nous avons également fait en sorte de rendre le plugin davantage configurable de façon à permettre à un organisme de configurer l’instance de l’API Addok ou Photon à utiliser. Accoutumés à travailler sur les problématiques de déploiement et de configuration de QGIS sur les parcs informatiques, nous en avons profité pour rendre ces différents paramètres réglables via des variables d’environnement.

French Locator Filter 1.1.0 – Variables d’environnement
Aidez vous à mieux géocoder dans QGISNous souhaiterions aller encore plus loin avec le French Locator Filter et nous cherchons des partenaires pour :
- ajouter un autre service normé de géocodage, par exemple celui de la Géoplateforme de l’IGN
- aller encore plus loin dans notre intégration à QGIS avec l’utilisation de l’interface (QgsGeocoderInterface)
- profiter de cette intégration pour proposer un service de géocodage inversé
- ajouter la recherche par lot via une intégration au processing QGIS
N’hésitez pas à nous contacter sur infos@oslandia.com
Encore merci à nos partenaires SmartOrigin et Métropole du Grand Lyon qui nous ont fait confiance pour cette prestation.
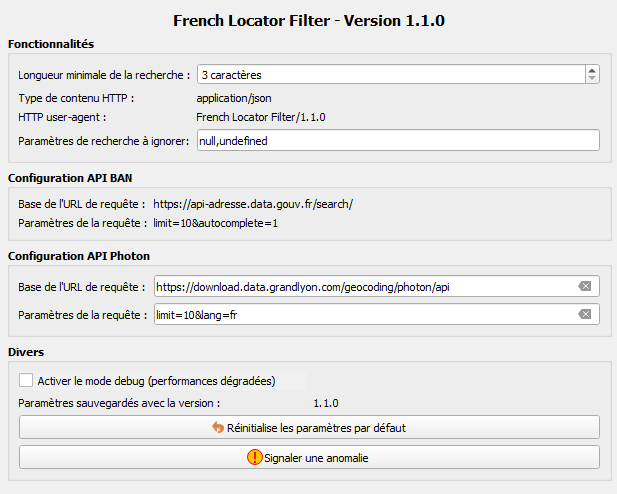
Les paramètres du plugin

-
sur Camptocamp: SUEZ 3D: First version of a multi-input Cesium viewer
Publié: 31 May 2024, 2:00am CEST
Pièce jointe: [télécharger]
SUEZ Smart Solutions is a branch of the SUEZ Group that offers technological solutions for intelligent water and waste management. In January 2024, Suez launched a Proof of Concept (POC), a significant step in its efforts to optimize interventions on its water management network. -
sur Free and Open Source GIS Ramblings: ChatGPT Data Analyst vs movement data
Publié: 30 May 2024, 4:26pm CEST
Today, I took ChatGPT’s Data Analyst for a spin. You’ve probably seen the fancy advertising videos: just drop in a dataset and AI does all the analysis for you?! Let’s see …
Of course, I’m not going to use some lame movie database or flower petals data. Instead, let’s go all in and test with a movement dataset.
You don’t get a second chance to make a first impression, they say. — Well, Data Analyst, you didn’t impress on the first try. How hard can it be to guess the delimiter and act accordingly?

Anyway, let’s help it a little:
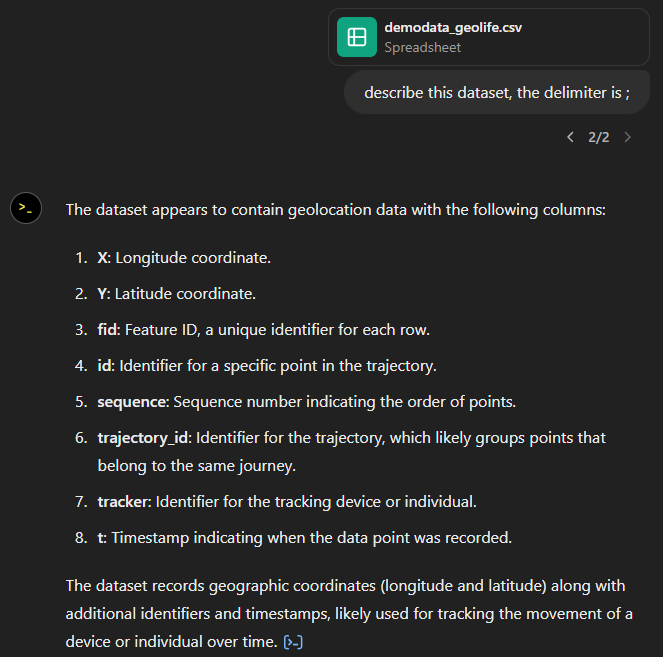
That looks much better. It makes an effort to guess what the columns could mean and successfully identifies the spatiotemporal information.
Now for some spatial analysis. On first try, it didn’t want to calculate the length of the trajectories in geographic terms, but we can make it to:
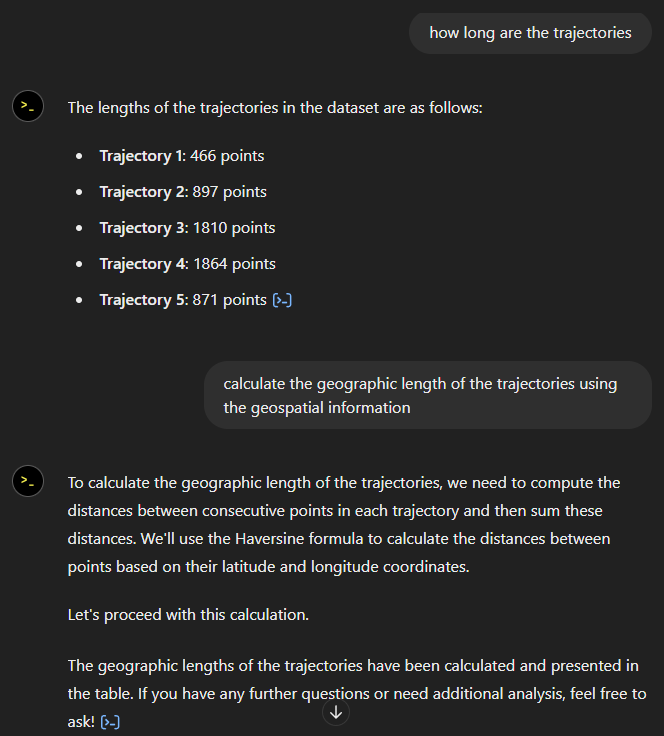
It will also show the code used to get to the results:
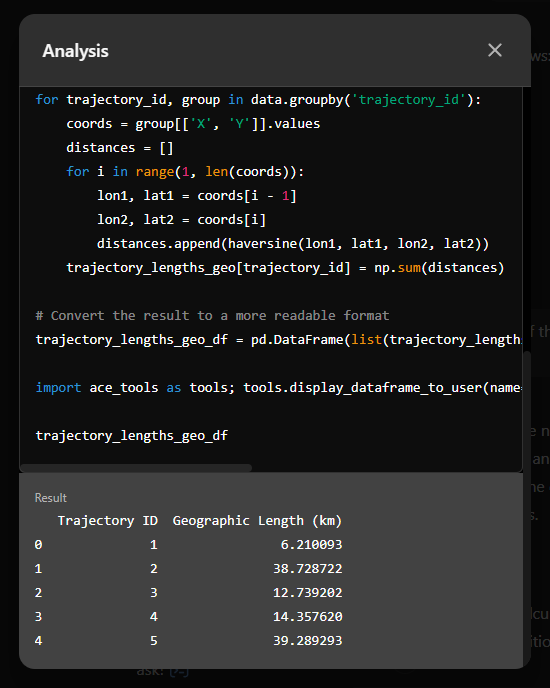
And indeed, these are close enough to the results computed using MovingPandas:
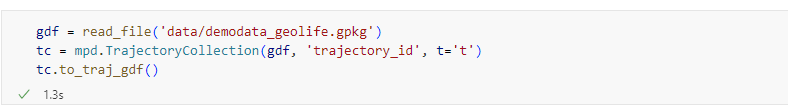

“What about plots?” I hear you ask.
For a first try, not bad at all:
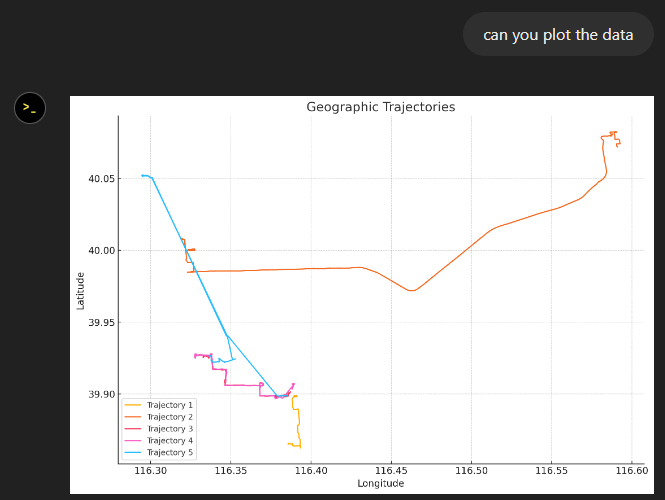
Let’s see if we can push it further:
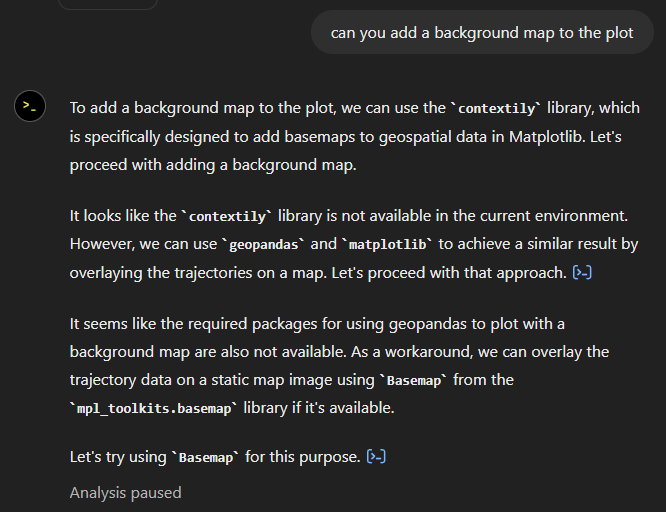
Looks like poor Data Analyst ended up in geospatial library dependency hell

It’s interesting to watch it try find a solution.
Alas, no background map appears:
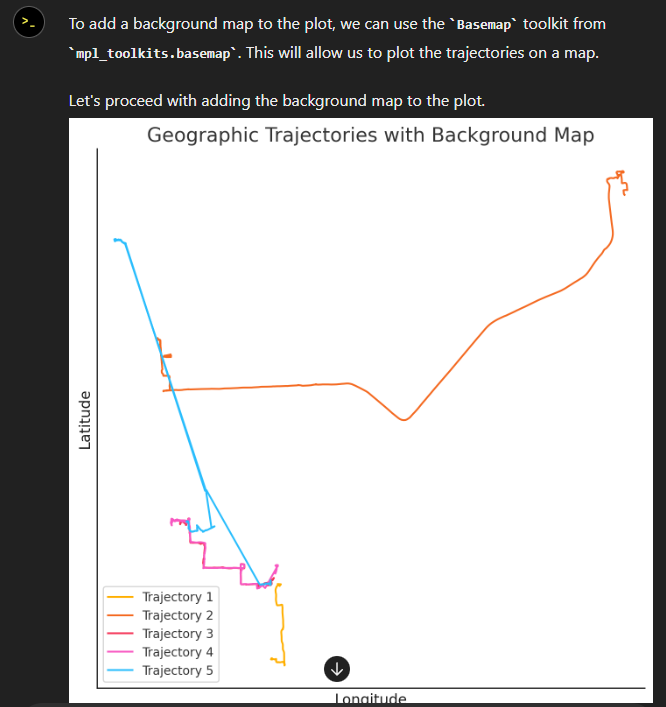
Not giving up yet :)

Woah, what happened here? It claims it created an interactive map in an HTML file.
And indeed it did:

This has been a very interesting experiment for me with many highs and lows. The whole process is a bit hit and miss. But when it does work, it’s fun.
I wasn’t sure what to expect with regards to Data Analyst’s spatial data processing capabilities. Looks like there are enough examples in its training data to find solutions for the basic trajectory analysis problems I asked it solve today, eventually, at least.
What’s the conclusion? Most AI marketing videos are severely overselling the capabilities of these tools. However, that doesn’t mean that they are completely useless, either. I’m looking forward to seeing the age of smaller open source models specifically trained for geospatial analysis to finally make it unnecessary for humans to memorize data analysis library syntax.
-
sur gvSIG Team: Algo más que software
Publié: 30 May 2024, 2:25pm CEST
Recientemente, han otorgado a gvSIG el primer Premio Nacional de Ciencias Geográficas. Un premio que se suma a la larga lista de premios recibidos y que no hace otra cosa que certificar que, sin lugar a duda, gvSIG es uno de los referentes internacionales en materia de Geomática y Geolocalización.
gvSIG tuvo su origen en 2004 en la Generalitat Valenciana. Bueno, realmente en 2004 fue cuando se liberó la primera versión del software de escritorio. La idea empezó a gestarse a finales de 2002.
Un proyecto que empezó siendo un software de escritorio y que hoy se ha convertido en una Suite que permite la gestión de integral de la información geográfica. Junto al inicial cliente de escritorio está el cliente web y la solución para dispositivos móviles; pero esto último que estoy diciendo ya os lo sabéis muy bien los asiduos de este blog.
Por mi parte, hace ya varios años que no estoy vinculado profesionalmente ni a gvSIG ni a trabajos en el ámbito de la geolocalización. Sin embargo, no ocurre así con la componente emocional. Es imposible desligarme de un proyecto que contribuí a poner en marcha desde sus orígenes y a los que he dedicado tantos años de mi vida.
Gracias a gvSIG he podido participar en numerosos congresos y sesiones de trabajo por diferentes lugares del mundo y de España. O que decir de las jornadas internacionales de gvSIG que se celebran todos los años en Valencia y de las que ya se han realizado 19 convocatorias.
Toda esta actividad me ha regalado el privilegio de conocer a mucha, pero que a mucha gente de todo el mundo. Una amplia red de personas con las que hemos colaborado sobre todo en base a unos principios compartidos.
Y es ahora, en el séptimo párrafo cuando llego a lo que realmente quería comentar. Si es que menudo rollo tengo
 . Recuerdo que en sus inicios se hablaba mucho de los valores de gvSIG. Los más antiguos posiblemente recordaran eso de “Más, mejor y de una forma más justa” “Un modelo de producción basado en la colaboración y en la solidaridad”, “conocimiento compartido vs especulación con conocimiento adquirido” etc.
En la evolución del proyecto cada vez se ha sido menos explícito con estos principios y se ha focalizado más en las dimensiones técnica y comercial. Algo por otra parte que considero natural. Pero sí recuerdo que esos valores eran parte fundamental del pegamento que fue constituyendo la red de amigos y colaboradores de gvSIG. Desde aquella gente que está más próxima al núcleo hasta aquellos colaboradores más puntuales.
Y es que no tengo ninguna duda que estos valores forman parte del ADN de la familia gvSIG. Esto, que algunos llaman capital humano, es el principal activo del proyecto. De ahí, mi alegría y trasladar mi felicitación al equipo de gvSIG por este éxito, que es uno más de los muchos recibidos y de los muchos por recibir.
-
sur Mappery: Paris, immersive experience
Publié: 30 May 2024, 11:00am CEST
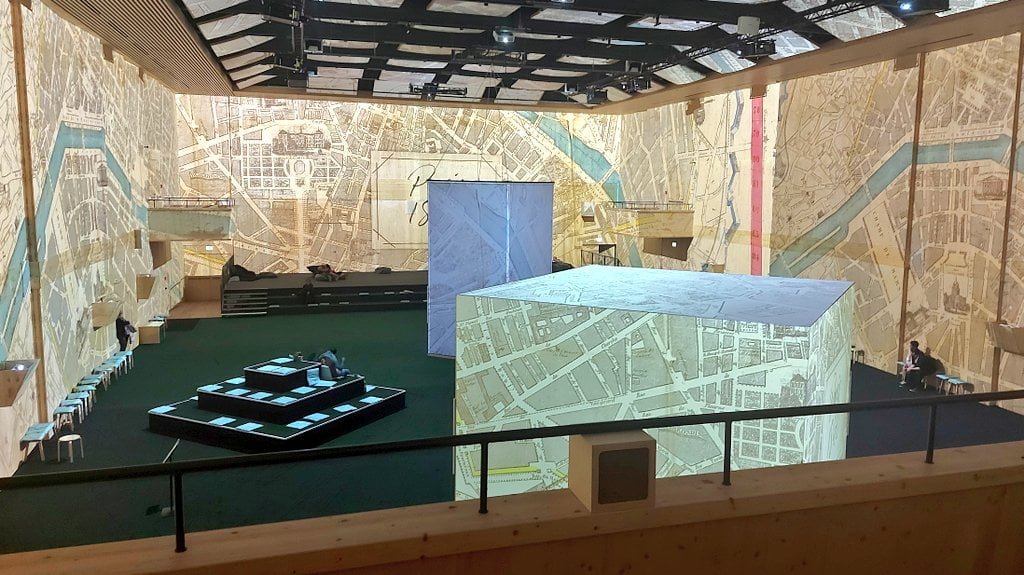
Simon Landauer shared this picture from an immersive experience in Paris
MapsintheWild Paris, immersive experience
-
sur Oslandia: (Fr) Topographie et topologie dans et autour de QGIS
Publié: 30 May 2024, 9:16am CEST
Since 2018 and the arrival of Loïc Bartoletti, Oslandia has accelerated its focus on topography and topology within and around QGIS.
Two questions have driven this focus:
- How to draw directly in GIS by integrating drawing tools inspired by the CAD world into QGIS.
- How to integrate plugins for topographic calculations directly into QGIS.
To address this, Oslandia has worked on several fronts: training, developing open-source plugins, and improvements in QGIS.
1- PluginsThe following plugins were developed by Oslandia or partners, with contributions from Oslandia:
- landsurveycodesimport : [https:]]
A plugin for surveyors working with the point coding methodology in topography. - QompliGIS : [https:]]
A tool to ensure your dataset or plan complies with a specification. - Total Open Station : [https:]]
An open-source project initiated by Italian and French archaeologists, it is a tool to convert various formats of survey field books. - Topaze : [https:]]
A topometric calculation tool developed with Jean-Marie Arsac (Azimut). It was a proof of concept that such calculations can be done within a GIS.
These plugins can be used at different stages of a project. They can be used all together or only those needed and integrated into workflows.
2- Improvements on QGISOslandia also focuses on improving the core of QGIS. Last years, our teams have worked on:
— Integration of shape tools: circles, ellipses, rectangles, regular polygons, etc.
— Improvement of snapping tools.
— Enhancement of Z and M coordinate support.
— Improvement of topological tools (relationships between geometries).Coming soon is the possibility to use geometry and topology validation and correction plugins directly in QGIS processing tools, developed by Jacky Volpès and Loïc Bartoletti.
3- TrainingOslandia is QUALIOPI certified and offers a training program around QGIS and QField:
- Drawing: Transition from CAD to GIS with QGIS: https://oslandia.com/formations/qgis3-dessiner-avec-qgis/
- Topography with QGIS (LSCI, Topaze, QompliGIS, Total Open Station)
- QField Training
- Deployment of QField Cloud
« In 2023, 89 people were trained by Oslandia, who recommend our training at 90.9%.»
4- And QField ?Since our partnership with OPENGIS.ch, Oslandia offers QField Cloud server deployment services, training, and QField support.
5- Coming Soon!Several technical posts are being prepared: how to open CAD files in a GIS? What are the differences between QField and LSCI? You will find them on our website in the coming weeks.

Additionally, we are preparing a white paper on the topic of migrating from CAD to QGIS, which we should release in September.
Stay tuned!
-
sur QGIS Blog: Felt renews their Flagship-level Sustaining Membership
Publié: 30 May 2024, 8:55am CEST
We’re delighted to announce Felt’s continued flagship-level sustaining membership of QGIS. Felt’s contributions will allow us to continuously improve QGIS’ functionality and documentation, as well as the QGIS project infrastructure, including our 2024 Grant Programme.
In addition to their membership, Felt is releasing a new version of the “Add To Felt” QGIS plugin. Developed by the talented team at North Road, the plugin makes it easy to upload your data from QGIS to the web, where you can share it with colleagues and clients. The newest release includes raster data support and more robust preservation of styles from QGIS to Felt. This enables seamless integration and a flexible workflow between your desktop and the web.
Don’t miss your chance to meet Felt’s team presenting “Add To Felt” at tomorrow’s QGIS Open Day.
Felt is the first user-friendly, collaboration tool for making and sharing the maps that drive your business. Felt makes it easy to visualize your data and communicate across teams quickly. Learn more at felt.com.
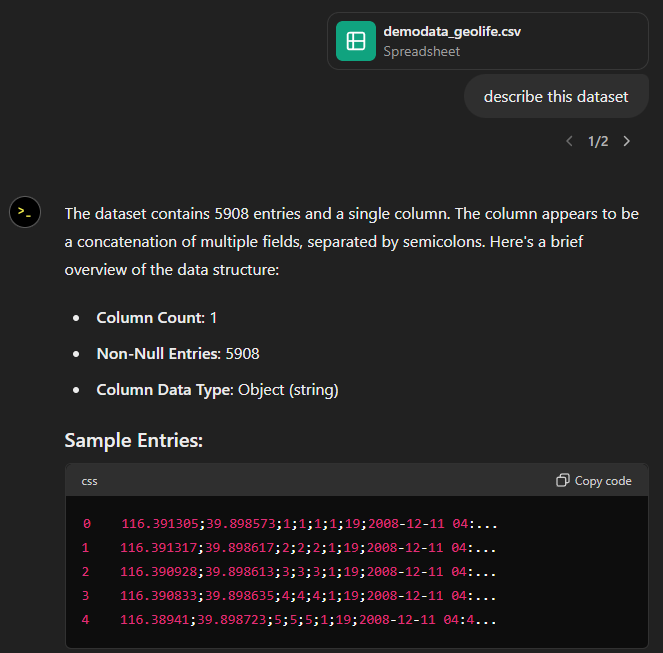


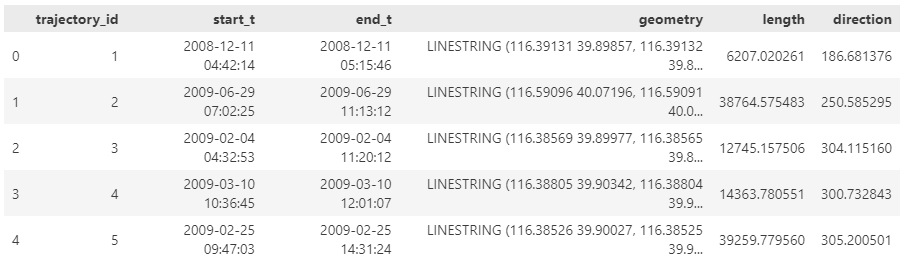


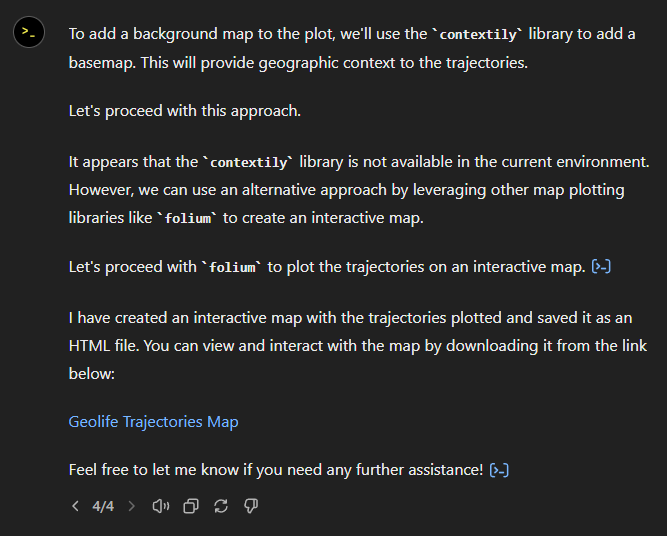
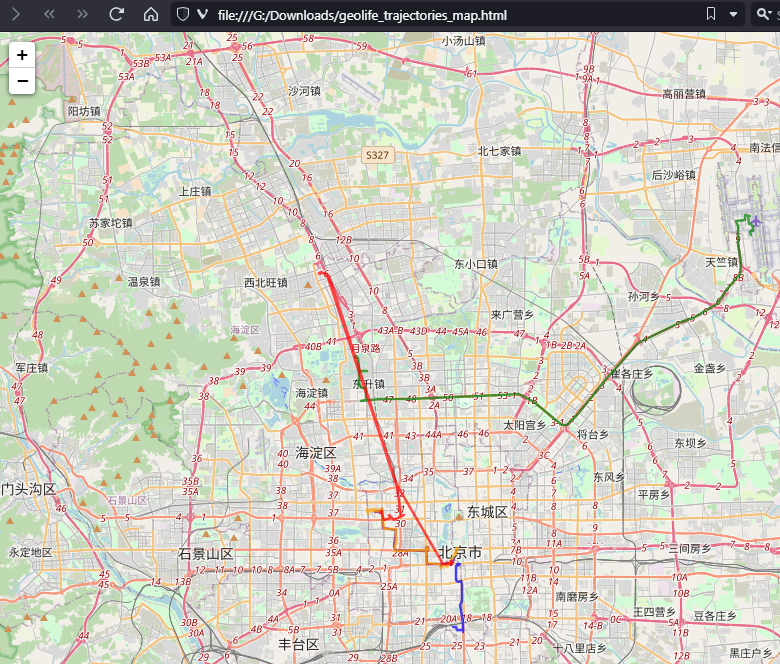
-
sur Topographie et topologie dans et autour de QGIS
Publié: 30 May 2024, 7:04am CEST par Caroline Chanlon
La réflexion sur la topographie et la topologie dans et autour de QGIS s’est accélérée chez Oslandia depuis 2018 et l’arrivée de Loïc Bartoletti.
Deux questions ont alimenté cette réflexion :
- Comment dessiner directement dans le SIG en intégrant des outils de dessin inspirés du monde de la DAO dans QGIS ;
- Comment intégrer des plugins pour les calculs topographiques directement dans QGIS.
Pour cela, Oslandia a travaillé sur plusieurs axes : formation, développement de plugins open source et améliorations dans QGIS.
1- Les pluginsLes plugins ci-dessous ont été développés par Oslandia ou par des partenaires, avec des contributions Oslandia :
- landsurveycodesimport : [https:]]
Un plugin pour les topographes qui travaillent avec la méthodologie de codification des points de topographie. - QompliGIS : [https:]]
Un outil pour conformer son jeu de données, son plan par rapport à un cahier des charges. - Total Open Station : [https:]]
Projet open source né à l’initiative d’archéologues italiens et français, c’est un outil pour convertir les différents formats de carnets de terrain des appareils des topographes. - Topaze : [https:]]
Un outil de calcul topométrique développé avec Jean-Marie Arsac (Azimut). Il s’agissait d’une preuve de concept que ce genre de calculs peut se faire dans un SIG.
Ces plugins peuvent être utilisés à différents moments d’un projet. On peut les utiliser tous ensemble ou seulement ceux dont on a besoin et les intégrer dans des traitements.
2- Les améliorations sur QGISOslandia se mobilise également pour apporter des améliorations dans le cœur QGIS. Ces dernières années, nos équipes ont notamment travaillé sur :
— intégration d’outils de forme : cercles, ellipses, rectangles, polygones réguliers, … ;
— amélioration des outils d’accrochage ;
— amélioration du support des coordonnées Z et M ;
— amélioration des outils topologiques (relations entre les géométries).À venir, la possibilité d’utiliser les plugins de vérification et de correction de la géométrie et de la topologie directement dans les outils de traitements de QGIS développé par Jacky Volpès et Loïc Bartoletti.
3- Les formationsOslandia est certifié QUALIOPI et propose un programme de formations autour de QGIS et QField :
- Dessin : passer de la DAO au SIG avec QGIS : [https:]]
- La topographie avec QGIS (LSCI, Topaze, QompliGIS, Total Open Station)
- Formation à QField
- Déploiement de QField Cloud
« En 2023, 89 personnes ont été formées par Oslandia, qui recommandent nos formations à 90,9% »
4- Et QField ?Depuis la mise en œuvre du partenariat avec OPENGIS.ch, Oslandia propose des prestations de déploiement de serveurs QField Cloud, des formations et de l’assistance QField.
5- À venir !Plusieurs billets techniques sont en cours de préparation : comment ouvrir les fichiers DAO dans un SIG ? Quelles différences entre QField et LSCI ? Vous pourrez les retrouver sur notre site dans les prochaines semaines.
Par ailleurs, nous préparons un livre blanc sur le thème de la migration de la DAO vers QGIS que nous devrions sortir en septembre.
Restez connectés !
-
sur Oslandia: (Fr) Plugin QGIS French Locator Filter 1.1.0 : API Photon et personnalisation avancée !
Publié: 29 May 2024, 6:52pm CEST
Sorry, this entry is only available in French.
-
sur Mappery: London dressing gown
Publié: 29 May 2024, 11:00am CEST
-
sur gvSIG Team: Premio Nacional de Ciencias Geográficas… agradecimientos
Publié: 29 May 2024, 9:03am CEST
Estamos sobrepasados emocionalmente por el número de agradecimientos y apoyos recibidos al darse a conocer que la Asociación gvSIG ha recibido el primer Premio Nacional de Ciencias Geográficas que se otorga en España.

Sin duda este premio está compuesto de muchos pedacitos, de muchas organizaciones y personas que han ido sumando a este proyecto. Este post quiere agradecer a algunas de estas entidades que han dado su apoyo a la candidatura de la Asociación gvSIG en una lista que tiende a infinito. ¡Gracias!
Universidad Autónoma del Estado de México (UAEM), Universidad Nacional de Misiones de Argentina (UNaM), Universidad Católica de la Santísima Concepción de Chile (UCSC), Instituto Tecnológico de Informática (ITI), Gaia-X, Centro de Investigação em Ciências Geo-Espaciais (CICGE) – Faculdade de Ciências da Universidade do Porto, North Carolina State University (NC State University), Universidad Politécnica de Madrid (UPM), Massachusetts Institute of Technology (MIT), Universidad Politécnica de Cartagena (UPCT), University of New Hampshire, Universidad Central “Marta Abreu” de Las Villas – Cuba, Asamblea de Cooperación por la Paz (ACPP), Instituto de Geografía de la Universidad de Buenos Aires, Centro de Investigaciones en Geografía Ambiental de la Universidad Nacional Autonóma de México (UNAM), Colegio Profesional de Delineantes y Diseñadores Te?nicos de Andalucía (CODTA), European Commission open source programme office, Universitat Jaume I de Castellón, Infraestructura de Datos Espaciales del Uruguay, Institute of Applied Physics (IFAC) – National Research Council (CNR) de Italia, Ordnance Survey (United Kingdom National Mapping Agency), Universidad Nacional de General Sarmiento de Argentina, Open Source Geospatial Foundation (OSGeo), Diputación de Albacete, Laberit Sistemas, DISID Corporation, SCOLAB Software Colaborativo, Ayuntamiento de Talavera de la Reina, Universidad Don Bosco de El Salvador, Universitat de València, Green Urban Data, eGeoMapping, Revista Internacional de Geomática y Ciencias de la Tierra MAPPING, Grupo MERCATOR: Tecnologías de la GeoInformación y Agentes inteligentes, Universidad Nacional de Moreno, Instituto Federal do Pará de Brasil, Observatorio de Estudios sobre Convivencia y Seguridad Ciudadana – Gobierno de la provincia de Córdoba de Argentina, Universidad de Santiago de Chile, Universidad de La Laguna, Universidade da Coruña, Universidad de Coimbra – Portugal, Instituto Panamericano de Geografía e Historia (IPGH), Mundialis GmbH & Co, Kalios Geospatial Technologies – India, Ayuntamiento de Castellón, Consorcio Provincial de Bomberos de Valencia (CPBV), Smart to People Solutions, Comunidade Intermunicipal do Alto Tâmega e Barroso, Tresca Ingeniería, Avansig, Intendencia de Montevideo – Uruguay, Ayuntamiento de Valencia, Instituto Nacional de Estadística y Geografía de México (INEGI), Conselleria de Medio Ambiente, Agua, Infraestructuras y Territorio de la Generalitat Valenciana, Washington State Department of Transportation, Pavapark Movilidad, Innovación, Cooperación, Cartografía y Territorio (iCarto), Politecnico Milano, Ayuntamiento de Cartagena, Istanbul University, Ayuntamiento de Albacete, Universitat Politècnica de Catalunya (UPC), Universidad de las Azores, Fundación Forjando Futuros, Universidad de Costa Rica, Ion Creanga State Pedagogical University – República de Moldavia, Sociedad de Ingenieros Geodestas, Geomáticos y Agrimensores de Venezuela (SIGGMA), Asociación Española de Geómetras Expertos (GEX), Ayuntamiento de Úbeda, Empresa Brasileira de Pesquisa Agropecuária (EMBRAPA), GIZ cono Sur, Universidad de Playa Ancha – Chile, LandNetwork GmbH, Universitat Politècnica de València, Ajuntament d’Onda, ASECRIM, Laboratorio Internacional de Tecnología e Investigación Espacial (ISTAR) – México, Gobierno de la República Dominicana, Universidad Regional Amazónica Ikiam, Comunidad gvSIG Uruguay, Confederación Empresarial de la Comunitat Valenciana (CEV), Ayuntamiento de l’Eliana, IdeasG – Perú, Hímaco (História, Mapas e Computadores) – Universidade Federal de São Paulo (UFSP), Instituto de Geografía UNAM, Instituto Valenciano de Competitividad Empresarial (IVACE), Mancomunitat del Pla de Mallorca, DALEPH, Alkante – Francia, Geospatial Enabling Technologies, Universidad Filadelfia de México, Geomática del Golfo, Université Rennes 2 – Francia, Universitat Oberta de Catalunya, Infraestructura de Datos Espaciales de Santa Fe (IDESF), Asociación para la prevención de incendios forestales (PREVIFOR), Universidad Internacional de Valencia (VIU), Universidad de Castilla – La Mancha (UCLM), Map4Business, GAUSSGEO Geotecnologia e Engenharia LTDA, Intendencia Departamental de Durazno, NISR, VinfoVAL, Geodireito – Planejamento e Regulação Ltda, Governo do Estado Tocantins – Brasil, Ajuntament d’Alzira, Universidad de Belgrano, Universidad de las Fuerzas Armadas ESPE – Ecuador, MundoGEO, Ajuntament de Torrent, Indromeda, Corredor Mediterráneo del Gobierno de España (MITMA-Adif), Programa Iberoamericano de Ciencia y Tecnología para el Desarrollo (CYTED), Instituto Tecnológico de Canarias, Alumni UPV, Universidad de La Rioja, Diputació de Barcelona, Geoscan Consultoría, Universidad Autonóma de Sinaloa,…
-
sur OPENGIS.ch: The PostgreSQL Connection Service File and Why We Love It
Publié: 28 May 2024, 3:18pm CEST
The PostgreSQL Connection Service File
What is the Connection Service File?pg_service.confis nothing new. It has existed for quite some time and maybe you have already used it sometimes too. But not only the new QGIS plugin PG service parser is a reason to write about our love for this file, as well we generally think it’s time to show you how it can be used for really cool things.The Connection Service File allows you to save connection settings for each so-called “service” locally.
So when you have a database called
gison a local PostgreSQL with port5432and username/password isdocker/dockeryou can store this as a service calledmy-local-gis.
[my-local-gis]# Local GIS Database for Testing purposeshost=localhost port=5432 dbname=gis user=docker password=docker
This Connection Service File is called
pg_service.confand is by client applications (such as psql or QGIS) generally found directly in the user directory. In Windows it is then found in the user’s application directorypostgresql.pg_service.conf. And in Linux it is by default located directly in the user’s directory~/.pg_service.conf.But it doesn’t necessarily have to be there. The file can be anywhere on the system (or on a network drive) as long as you set the environment variable
PGSERVICEFILEaccordingly:export PGSERVICEFILE=/home/dave/connectionfiles/pg_service.confOnce you have done this, the client applications will search there first – and find it.
If the above are not set, there is also another environment variable
PGSYSCONFDIRwhich is a folder which is searched for the filepg_service.conf.Once you have this, the service name can be used in the client application. That means in psql it would look like this:
~$ psql service=my-local-gis
psql (14.11 (Ubuntu 14.11-0ubuntu0.22.04.1), server 14.5 (Debian 14.5-1.pgdg110+1))
SSL connection (protocol: TLSv1.3, cipher: TLS_AES_256_GCM_SHA384, bits: 256, compression: off)
Type "help" for help.

gis=#
And in QGIS like this:

If you then add a layer in QGIS, only the name of the service is written in the project file. Neither the connection parameters nor username/password are saved. In addition to the security aspect, this has various advantages, more on this below.
But you don’t have to pass all of these parameters to a service. If you only pass parts of them (e.g. without the database), then you have to pass them when the connection is called:
$psql "service=my-local-gis dbname=gis"
psql (14.11 (Ubuntu 14.11-0ubuntu0.22.04.1), server 14.5 (Debian 14.5-1.pgdg110+1))
SSL connection (protocol: TLSv1.3, cipher: TLS_AES_256_GCM_SHA384, bits: 256, compression: off)
Type "help" for help.

gis=#
You can also override parameters. If you have a database
gisconfigured in the service, but you want to connect the database web, you can specify the service and explicit the database:$psql "service=my-local-gis dbname=web" psql (14.11 (Ubuntu 14.11-0ubuntu0.22.04.1), server 14.5 (Debian 14.5-1.pgdg110+1)) SSL connection (protocol: TLSv1.3, cipher: TLS_AES_256_GCM_SHA384, bits: 256, compression: off) Type "help" for help. web=#Of course the same applies to QGIS.
And regarding the environment variables mentioned, you can also set a standard service.
export PGSERVICE=my-local-gisParticularly pleasant in daily work with always the same database.
And why is it particularly cool?$ psql psql (14.11 (Ubuntu 14.11-0ubuntu0.22.04.1), server 14.5 (Debian 14.5-1.pgdg110+1)) SSL connection (protocol: TLSv1.3, cipher: TLS_AES_256_GCM_SHA384, bits: 256, compression: off) Type "help" for help. gis=#There are several reasons why such a file is useful:
- Security: You don’t have to save the connection parameters anywhere in the client files (e.g. QGIS project files). Keep in mind that they are still plain text in the service file.
- Decoupling: You can change the connection parameters without having to change the settings in client files (e.g. QGIS project files).
- Multi-User: You can save the file on a network drive. As long as the environment variable of the local systems points to this file, all users can access the database with the same parameters.
- Diversity: You can use the same project file to access different databases with the same structure if only the name of the service remains the same.
For the last reason, here are three use cases.
Support-CaseSomeone reports a problem in QGIS on a specific case with their database. Since the problem cannot be reproduced, they send us a DB dump of a schema and a QGIS project file. The layers in the QGIS project file are linked to a service. Now we can restore the dump on our local database and access it with our own, but same named, service. The problem can be reproduced.
INTERLISWith INTERLIS the structure of a database schema is precisely specified. If e.g. the canton has built the physical database for it and configured a supernice QGIS project, they can provide the project file to a company without also providing the database structure. The company can build the schema based on the INTERLIS model on its own PostgreSQL database and access it using its own service with the same name.
Test/Prod SwitchingYou can access a test and a production database with the same QGIS project if you have set the environment variable for the connection service file accordingly per QGIS profile.
You create two connection service files.
The one to the test database
/home/dave/connectionfiles/test/pg_service.conf:[my-local-gis] host=localhost port=54322 dbname=gis-testAnd the one for the production database
/home/dave/connectionfiles/prod/pg_service.conf:[my-local-gis] host=localhost port=54322 dbname=gis-productiveIn QGIS you create two profiles “Test” and “Prod”:
And you set the environment variable for each profile
PGSERVICEFILEwhich should be used (in the menu Settings > Options… and there under System scroll down to Environmentor
If you now use the service
The authentication configurationmy-local-gisin a QGIS layer, it connects the databaseprodin the “Prod” profile and the databasetestin the “Test” profile.Let’s have a look at the authentication. If you have the connection service file on a network drive and make it available to several users, you may not want everyone to access it with the same login. Or you generally don’t want any user information in this file. This can be elegantly combined with the authentication configuration in QGIS.
If you want to make a QGIS project file available to multiple users, you create the layers with a service. This service contains all connection parameters except the login information.
This login information is transferred using QGIS authentication.
You also configure this authentication per QGIS profile we mentioned above. This is done via Menu Settings > Options… and there under Authentication:
(or directly where you create the PostgreSQL connection)
If you add such a layer, the service and the ID of the authentication configuration are saved in the QGIS project file. This is in this case
mylogin. Of course this name must be communicated to the other users so that they can also set the ID for their login tomylogin.Of course, you can use multiple authentication configurations per profile.
QGIS PluginAnd yes, there is now a great plugin to configure these services directly in QGIS. This means you no longer have to deal with text-based INI files. It’s called PG service parser:
It finds the connection service file according to the mentioned environment variables
PGSERVICEFILEorPGSYSCONFDIRor at its default location.As well it’s super easy to create new services by duplicating existing ones.
And for the Devs
And what would a blog post be without some geek food? The back end of this plugin is published on PYPI and can be easily installed with
pip install pgserviceparserand then be used in Python.For example to list all the service names.
>>> import pgserviceparser
>>> pgserviceparser.service_names()
['my-local-gis', 'another-local-gis', 'opengisch-demo-pg']
Optionally you can pass a config file path. Otherwise it gets it by the mentioned mechanism.
Or to receive the configuration from the given service name as a dict.
>>> pgserviceparser.service_config('my-local-gis')
{'host': 'localhost', 'port': '54322', 'dbname': 'gis', 'user': 'docker', 'password': 'docker'}
There are some more functions. Check them out here on GitHub or in the documentation.
Well thenWe hope you share our enthusiasm for this beautiful file – at least after reading this blog post. And if not – feel free to tell us why you don’t in the comments

-
sur GeoSolutions: GeoSolutions presenting at FOSS4G 2024 Europe in Tartu (Estonia)
Publié: 28 May 2024, 2:53pm CEST
You must be logged into the site to view this content.
-
sur gvSIG Team: Transportes concede el primer Premio Nacional de Ciencias Geográficas a la asociación gvSIG
Publié: 28 May 2024, 2:44pm CEST
Reproducimos la nota de prensa oficial:
El Ministerio de Transportes y Movilidad Sostenible ha galardonado a la asociación gvSIG con el primer Premio Nacional de Ciencias Geográficas, que recompensa a personas o entidades que hayan contribuido de forma especial o mediante su actuación singular o trayectoria profesional al campo de las Ciencias Geográficas. La resolución de concesión se publicará próximamente en el Boletín Oficial del Estado (BOE).
Este galardón, con una dotación económica de 20.000 euros, es instruido por el Centro Nacional de Información Geográfica a iniciativa del Consejo Superior Geográfico, órgano de dirección del Sistema Cartográfico Nacional, y trata de poner en valor la aportación, innovación e impacto de los avances conseguidos en la producción, actualización y uso cotidiano de la información geográfica, sus infraestructuras y los productos y servicios derivados de ella.
La Asociación gvSIG es una entidad española sin ánimo de lucro, dedicada a la investigación, innovación y desarrollo de tecnologías de software libre y código abierto relacionadas con las ciencias geográficas. Basándose en valores como la colaboración, la solidaridad y el conocimiento compartido, se ha convertido en un referente internacional, siendo su catálogo de soluciones tecnológicas para la gestión de información geográfica utilizado en la práctica totalidad del planeta.
La Asociación gvSIG ha contribuido notablemente a la comunidad de código abierto y a las tecnologías geográficas, así como al impulso de estándares, desarrollando una serie de soluciones de amplio uso que han permitido constituir un nuevo modelo de negocio exitoso que permite a pequeñas y medianas empresas españolas ofrecer servicios y proyectos en diversos países.
De este modo, ha realizado proyectos en más de treinta países, fomentando la internacionalización de empresas españolas. Entre los ejemplos de grandes proyectos se encuentran la Infraestructura de Datos Espaciales de Uruguay, la IDE del Estado de Tocantins en Brasil, la aplicación para identificación de riesgos en los desplazamientos de los Cascos Azules en Malí o la IDE de Repsol para la gestión de proyectos de energías renovables, el Atlas de Expansión Urbana desarrollado para ONU-Habitat o el actual desarrollo del sistema de gestión de Catastro Multipropósito de la República Dominicana.
Aportación a las Ciencias GeográficasEl Premio Nacional de Ciencias Geográficas reconoce así a esta asociación su aportación e innovación, individual y colectiva, en el campo de las ciencias e ingeniería geográficas, la geomática, la cartografía y la información geoespacial, y su trascendencia, e impacto en el conjunto de las administraciones públicas y de la sociedad en general.
El jurado que ha informado el otorgamiento del galardón ha adoptado su decisión por unanimidad, tras valorar los méritos aportados por un total de catorce candidaturas que elevaron las deliberaciones a un nivel de gran excelencia. Ha estado presidido por el subsecretario de Transportes y Movilidad Sostenible y presidente del Consejo Superior Geográfico, actuando como vicepresidente el director general del IGN y presidente del CNIG, y contando como miembros a los representantes de los órganos de gobierno del Consejo Superior Geográfico y de colegios profesionales en el ámbito de las ciencias geográficas.
-
sur Mappery: Maps rock!
Publié: 28 May 2024, 11:00am CEST

In case there would be any doubts, Maps Rock! Thanks, Dean, for sharing this badge.
MapsintheWild Maps rock!
-
sur OPENGIS.ch: The PostgreSQL Connection Service File and Why We Love It
Publié: 28 May 2024, 6:55am CEST
The PostgreSQL Connection Service File
What is the Connection Service File?pg_service.confis nothing new. It has existed for quite some time and maybe you have already used it sometimes too. But not only the new QGIS plugin PG service parser is a reason to write about our love for this file, as well we generally think it’s time to show you how it can be used for really cool things.The Connection Service File allows you to save connection settings for each so-called “service” locally.
So when you have a database called
gison a local PostgreSQL with port5432and username/password isdocker/dockeryou can store this as a service calledmy-local-gis.# Local GIS Database for Testing purposes [my-local-gis] host=localhost port=5432 dbname=gis user=docker password=dockerThis Connection Service File is called
pg_service.confand is by client applications (such as psql or QGIS) generally found directly in the user directory. In Windows it is then found in the user’s application directorypostgresql.pg_service.conf. And in Linux it is by default located directly in the user’s directory~/.pg_service.conf.But it doesn’t necessarily have to be there. The file can be anywhere on the system (or on a network drive) as long as you set the environment variable
PGSERVICEFILEaccordingly:export PGSERVICEFILE=/home/dave/connectionfiles/pg_service.confOnce you have done this, the client applications will search there first – and find it.
If the above are not set, there is also another environment variable
PGSYSCONFDIRwhich is a folder which is searched for the filepg_service.conf.Once you have this, the service name can be used in the client application. That means in psql it would look like this:
~$ psql service=my-local-gis
psql (14.11 (Ubuntu 14.11-0ubuntu0.22.04.1), server 14.5 (Debian 14.5-1.pgdg110+1))
SSL connection (protocol: TLSv1.3, cipher: TLS_AES_256_GCM_SHA384, bits: 256, compression: off)
Type "help" for help.

gis=#
And in QGIS like this:
If you then add a layer in QGIS, only the name of the service is written in the project file. Neither the connection parameters nor username/password are saved. In addition to the security aspect, this has various advantages, more on this below.
But you don’t have to pass all of these parameters to a service. If you only pass parts of them (e.g. without the database), then you have to pass them when the connection is called:
$psql "service=my-local-gis dbname=gis"
psql (14.11 (Ubuntu 14.11-0ubuntu0.22.04.1), server 14.5 (Debian 14.5-1.pgdg110+1))
SSL connection (protocol: TLSv1.3, cipher: TLS_AES_256_GCM_SHA384, bits: 256, compression: off)
Type "help" for help.

gis=#
You can also override parameters. If you have a database
gisconfigured in the service, but you want to connect the database web, you can specify the service and explicit the database:$psql "service=my-local-gis dbname=web" psql (14.11 (Ubuntu 14.11-0ubuntu0.22.04.1), server 14.5 (Debian 14.5-1.pgdg110+1)) SSL connection (protocol: TLSv1.3, cipher: TLS_AES_256_GCM_SHA384, bits: 256, compression: off) Type "help" for help. web=#Of course the same applies to QGIS.
And regarding the environment variables mentioned, you can also set a standard service.
export PGSERVICE=my-local-gisParticularly pleasant in daily work with always the same database.
And why is it particularly cool?$ psql psql (14.11 (Ubuntu 14.11-0ubuntu0.22.04.1), server 14.5 (Debian 14.5-1.pgdg110+1)) SSL connection (protocol: TLSv1.3, cipher: TLS_AES_256_GCM_SHA384, bits: 256, compression: off) Type "help" for help. gis=#There are several reasons why such a file is useful:
- Security: You don’t have to save the connection parameters anywhere in the client files (e.g. QGIS project files). Keep in mind that they are still plain text in the service file.
- Decoupling: You can change the connection parameters without having to change the settings in client files (e.g. QGIS project files).
- Multi-User: You can save the file on a network drive. As long as the environment variable of the local systems points to this file, all users can access the database with the same parameters.
- Diversity: You can use the same project file to access different databases with the same structure if only the name of the service remains the same.
For the last reason, here are three use cases.
Support-CaseSomeone reports a problem in QGIS on a specific case with their database. Since the problem cannot be reproduced, they send us a DB dump of a schema and a QGIS project file. The layers in the QGIS project file are linked to a service. Now we can restore the dump on our local database and access it with our own, but same named, service. The problem can be reproduced.
INTERLISWith INTERLIS the structure of a database schema is precisely specified. If e.g. the canton has built the physical database for it and configured a supernice QGIS project, they can provide the project file to a company without also providing the database structure. The company can build the schema based on the INTERLIS model on its own PostgreSQL database and access it using its own service with the same name.
Test/Prod SwitchingYou can access a test and a production database with the same QGIS project if you have set the environment variable for the connection service file accordingly per QGIS profile.
You create two connection service files.
The one to the test database
/home/dave/connectionfiles/test/pg_service.conf:[my-local-gis] host=localhost port=54322 dbname=gis-testAnd the one for the production database
/home/dave/connectionfiles/prod/pg_service.conf:[my-local-gis] host=localhost port=54322 dbname=gis-productiveIn QGIS you create two profiles “Test” and “Prod”:
And you set the environment variable for each profile
PGSERVICEFILEwhich should be used (in the menu Settings > Options… and there under System scroll down to Environmentor
If you now use the service
The authentication configurationmy-local-gisin a QGIS layer, it connects the databaseprodin the “Prod” profile and the databasetestin the “Test” profile.Let’s have a look at the authentication. If you have the connection service file on a network drive and make it available to several users, you may not want everyone to access it with the same login. Or you generally don’t want any user information in this file. This can be elegantly combined with the authentication configuration in QGIS.
If you want to make a QGIS project file available to multiple users, you create the layers with a service. This service contains all connection parameters except the login information.
This login information is transferred using QGIS authentication.
You also configure this authentication per QGIS profile we mentioned above. This is done via Menu Settings > Options… and there under Authentication:
(or directly where you create the PostgreSQL connection)
If you add such a layer, the service and the ID of the authentication configuration are saved in the QGIS project file. This is in this case
mylogin. Of course this name must be communicated to the other users so that they can also set the ID for their login tomylogin.Of course, you can use multiple authentication configurations per profile.
QGIS PluginAnd yes, there is now a great plugin to configure these services directly in QGIS. This means you no longer have to deal with text-based INI files. It’s called PG service parser:
It finds the connection service file according to the mentioned environment variables
PGSERVICEFILEorPGSYSCONFDIRor at its default location.As well it’s super easy to create new services by duplicating existing ones.
And what would a blog post be without some geek food? The back end of this plugin is published on PYPI and can be easily installed with
pip install pgserviceparserand then be used in Python.For example to list all the service names.
>>> import pgserviceparser
>>> pgserviceparser.service_names()
['my-local-gis', 'another-local-gis', 'opengisch-demo-pg']
Optionally you can pass a config file path. Otherwise it gets it by the mentioned mechanism.
Or to receive the configuration from the given service name as a dict.
>>> pgserviceparser.service_config('my-local-gis')
{'host': 'localhost', 'port': '54322', 'dbname': 'gis', 'user': 'docker', 'password': 'docker'}
There are some more functions. Check them out here on GitHub or in the documentation.
Well thenWe hope you share our enthusiasm for this beautiful file – at least after reading this blog post. And if not – feel free to tell us why you don’t in the comments
-
sur Martin Davis: RelateNG Performance
Publié: 28 May 2024, 1:14am CEST
A previous post introduced a new algorithm in the JTS Topology Suite called RelateNG. It computes topological relationships between geometries using the Dimensionally-Extended 9 Intersection Model (DE-9IM) model.
This algorithm is fundamental to a large proportion of spatial queries executed in numerous geospatial environments. It would not be surprising to learn that the Relate algorithm is executed billions of times per day across the world's data centres. Given this, performance is a critical metric.
The original JTS RelateOp algorithm was hamstrung by its design, which required computing a full topology graph for each relationship evaluation. The subsequent development of PreparedGeometry provided a significant performance boost for common spatial predicates such as intersects and covers. A useful side-effect is that it is less susceptible to geometric robustness problems. However, it has some drawbacks:
- it only implements a small set of predicates
- the design does not easily extend to more complex predicates
- it does not support GeometryCollection inputs
- it is a completely separate codebase to the general-purpose RelateOp, which increases maintenance effort and increases the risk of bugs and behaviour discrepancies
The test data metrics are:- Query MultiPolygon: 461 polygons, 22,675 vertices
- Target Points: 10,000 points
 Timings
Op Intersects Intersects Prep Relate 61.7 s 21 ms RelateNG 0.1 s 19 ms
The result clearly shows the enormous improvement in the stateless case, since RelateNG does not build topology on the input polygon. The results are very similar in the prepared case. This is as expected, since both codebases run a simple Point-in-Polygon test using a cached spatial index.Line / LineThis test uses a dataset of major rivers of the continental United States. A single river mainstem is queried against a subset of river branches using the intersects and touches relationships, in stateless and prepared modes.
The test data metrics are:- Query Line: 6,975 vertices
- Target Lines: 407 lines with 47,328 vertices
 Timings (per 100 executions of the operation)
This shows the much better performance of RelateNG. RelateNG can evaluate touches in prepared mode, but the performance is similar to stateless mode, since currently indexes are not cached for Line/Line cases. This could be improved in a future release.Polygon / PolygonThis test uses data from two polygonal datasets:Op Intersects Intersects Prep Touches Touches Prep Relate 38.2 s 133 ms 36 s N/A RelateNG 1.18 s 142 ms 2.05 s 2.03 s - The Britsh Columbia Bedrock Geology polygonal coverage
- The GADM Level 2 boundaries for Canada
The test data metrics are:- GADM unit: 4,017 vertices
- Bedrock polygons: 4,318 polygon with 337,650 vertices
 Timings (per 100 executions of the operation)
Polygon / Polygon - Custom Relate PatternThe tests shows the ability of RelateNG to efficiently evaluate arbitrary Relate Intersection Matrix patterns. In this case, the pattern used is F***0****, which corresponds to a relationship which could be called "point-touches": two geometries have boundaries which intersect in only one (or more) points (dimension 0), but whose interiors do not intersect.Op Intersects Intersects Prep Covers Covers Prep Relate 61.7 s 534 ms 54.9 s 842 ms RelateNG 5.8 s 595 ms 6.4 s 943 ms
This test uses data from The GADM Level 1 boundaries for Canada. This has the advantage that Canada contains a rare example of 4 boundaries meeting at a single point (the jurisdictions of Saskatchewan, Manitoba, Northwest Territories, and Nunavut).
The test data metrics are:- GADM Canada Level 1: 13 polygons, 4,005,926 vertices
 Timings
Op F***0**** F***0**** Prep Relate 504 s N/A RelateNG 9.8 s 6.6 s
As expected, for this test RelateNG is far more performant than Relate. This is due to its ability to analyze Intersection Matrix patterns and perform only topology tests that are necessary, as well as not building a full topological structure of the inputs. The test shows the effect of caching spatial indexes in prepared mode, although stateless mode is very efficient as well. Analysis of ResultsClearly RelateNG is far more performant than Relate when running in non-prepared mode. The PreparedGeometry implementation is slightly faster (which confirms the efficiency of its original design), but not by very much. The difference may be a consequence of the general-purpose and thus more complex code and data structures in RelateNG. Closing this gap may be an area for future research.One thing is certain: the RelateNG algorithm design provides much more scope for adding case-specific optimizations. If you have a significant use case which could be improved by further targeted optimization improvements, let me know in the comments!It will be interesting to re-evaluate these tests once RelateNG is ported to GEOS. Sometimes (but not always) a C++ implementation can be significantly faster than Java, due to more opportunities for code and compiler optimization. -
sur GRASS GIS: Google Summer of Code 2024
Publié: 27 May 2024, 9:12pm CEST
Three GSoC students will be contributing to GRASS GIS this summer! We are thrilled to announce that the GRASS GIS project has three Google Summer of Code (GSoC) students this year! They will be working together with their mentors on enhancing different GRASS tools and capabilities. Let’s go briefly through some details on each project and their forseen broader impacts. Improve GRASS user experience in Jupyter Notebook Student: Riya Saxena Mentors: Anna Petrasova, Corey White The python package grass. -
sur gvSIG Team: aanguix
Publié: 27 May 2024, 6:05pm CEST
-
sur Fernando Quadro: O que é o DATUM?
Publié: 27 May 2024, 2:00pm CEST
O DATUM é um termo utilizado na área da geodésica que se refere a um sistema de referência utilizado para determinar as coordenadas geográficas na superfície da Terra. Ele é fundamental para a realização de medições precisas e confiáveis em projetos de cartografia e geoprocessamento.
 É baseado em alguns princípios fundamentais:
 Considera a Terra como um elipsoide, ou seja, um corpo sólido de formato semelhante a uma esfera achatada nos polos e alongada no equador.
Leva em conta a gravidade terrestre, rotação da Terra e a distribuição de massa em seu interior.A diferença entre um datum e outro é baseada em modelos matemáticos distintos da forma e dimensões da Terra e do fator adicional da projeção, seja por razões históricas, seja para garantir uma representação gráfica mais proporcionada; tomando como exemplo o Japão, onde usam um ponto da projeção que não está no centro da Terra, mas em algum lugar sob o Japão, isto permite uma menor distorção numa projeção de uma esfera sobre plano quando o Japão é representado, mas no entanto o uso dessa projeção para os Estados Unidos ou para o Brasil resultaria em um mapa muito estranho.
O uso do DATUM possibilita diversos benefícios, veja: Precisão nas medições
Padronização global
Compatibilidade com Sistemas de Posicionamento Global (GPS)
Melhoria na precisão dos mapasO DATUM apresenta diversos benefícios, no entanto, seu uso também apresenta desafios, como a necessidade de atualização constante e a complexidade dos cálculos.
O futuro do DATUM está ligado ao avanço da tecnologia, o que permitirá realizar medições ainda mais precisas e eficientes.
Gostou desse post? Conte nos comentários

-
sur Mappery: Globes at the Whitechapel Gallery
Publié: 27 May 2024, 11:00am CEST
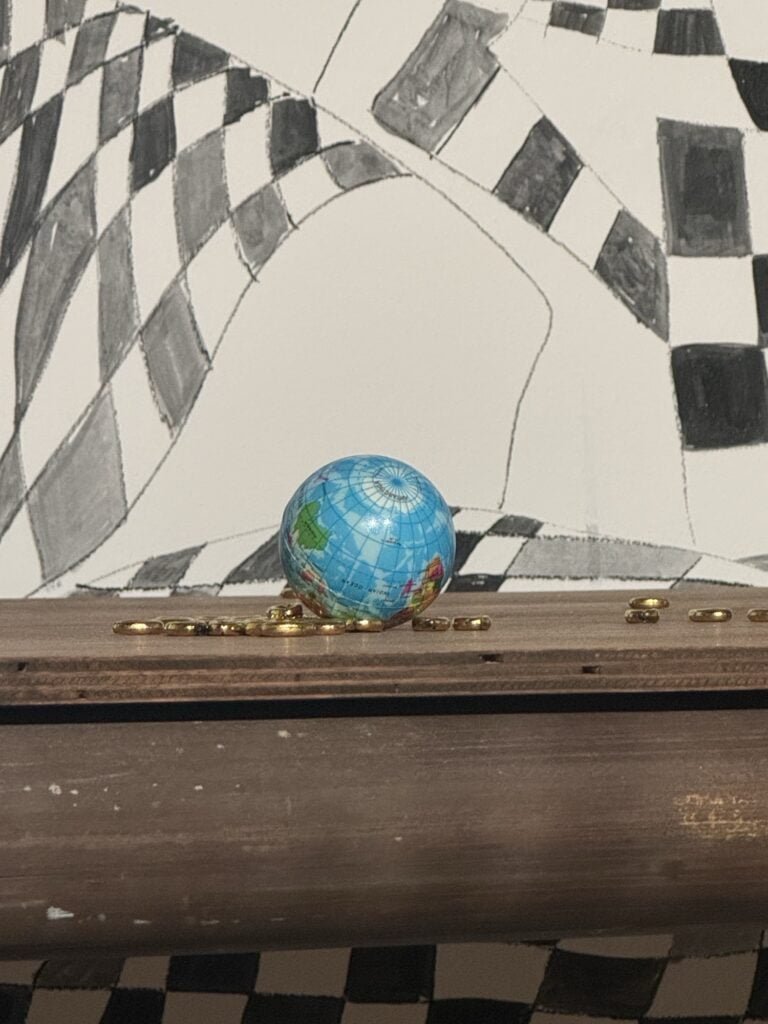
We popped into the Whitechapel Gallery yesterday and saw some uninspiring installations and performance art but as you might expect I spotted a few globes hidden in the displays.
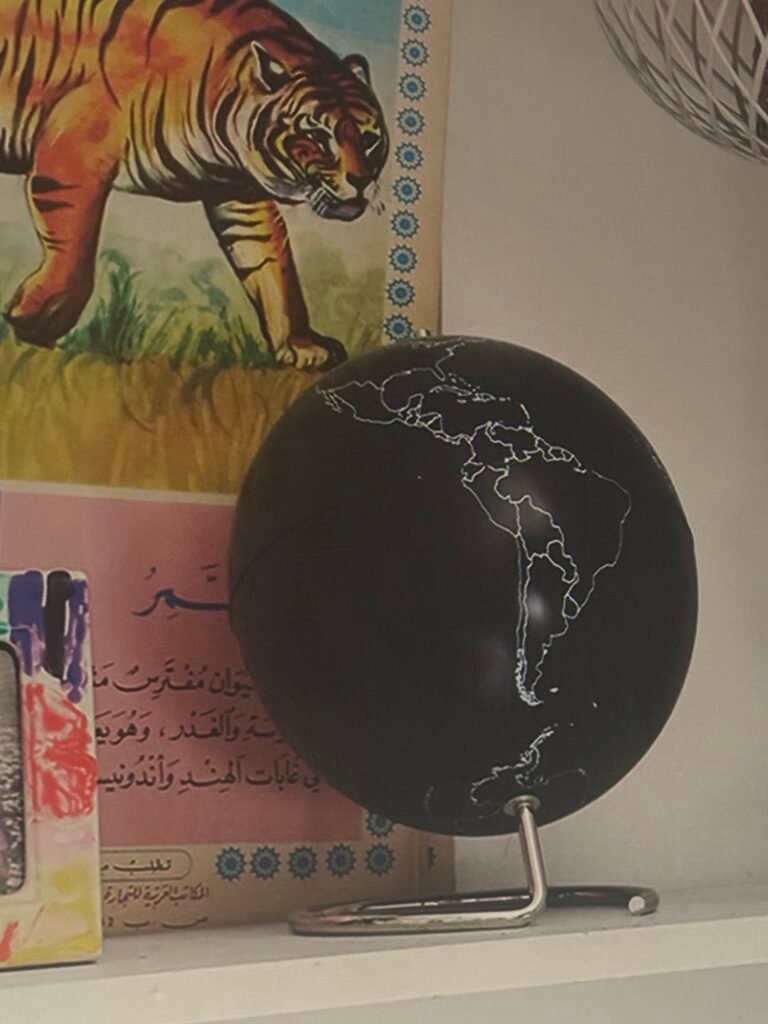
And this nice sign in the reception area
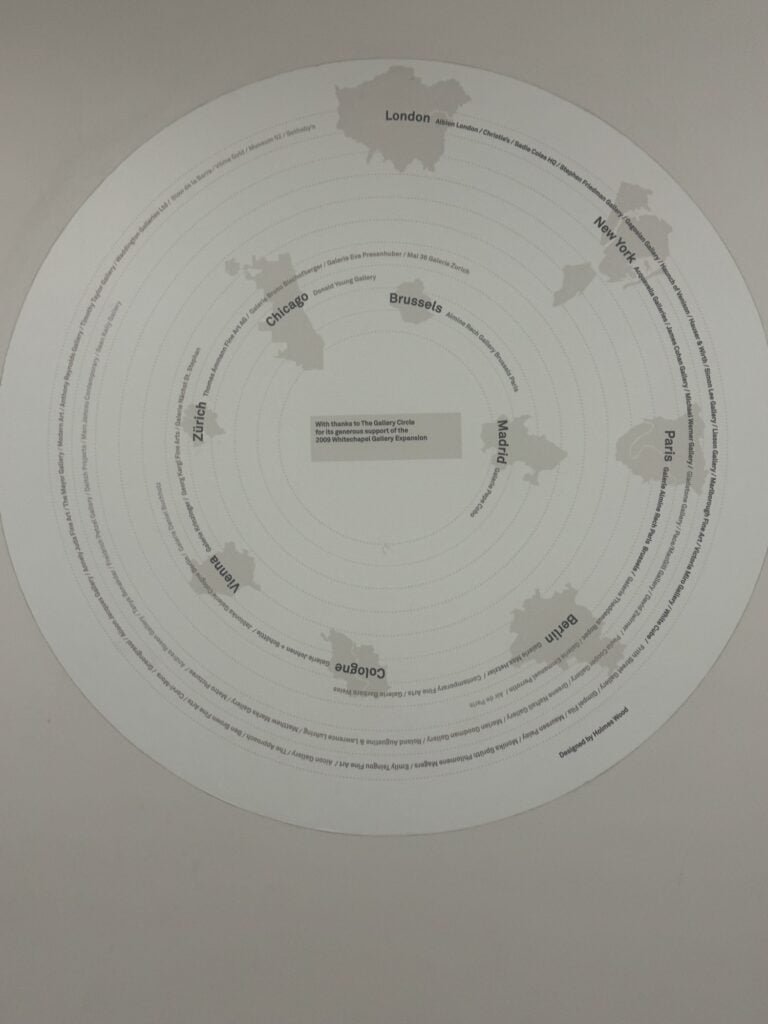
MapsintheWild Globes at the Whitechapel Gallery
-
sur Mappery: President Obama by C215
Publié: 26 May 2024, 11:00am CEST

We finish this week’s series with US President Obama. I hope you enjoyed the series. C215 has been prolific on maps and old map boards, so stay tuned; there is more to come.
C215, Christian Guemy’s website c215.fr
MapsintheWild President Obama by C215
-
sur Mappery: Ben-Gurion by C215
Publié: 25 May 2024, 11:00am CEST
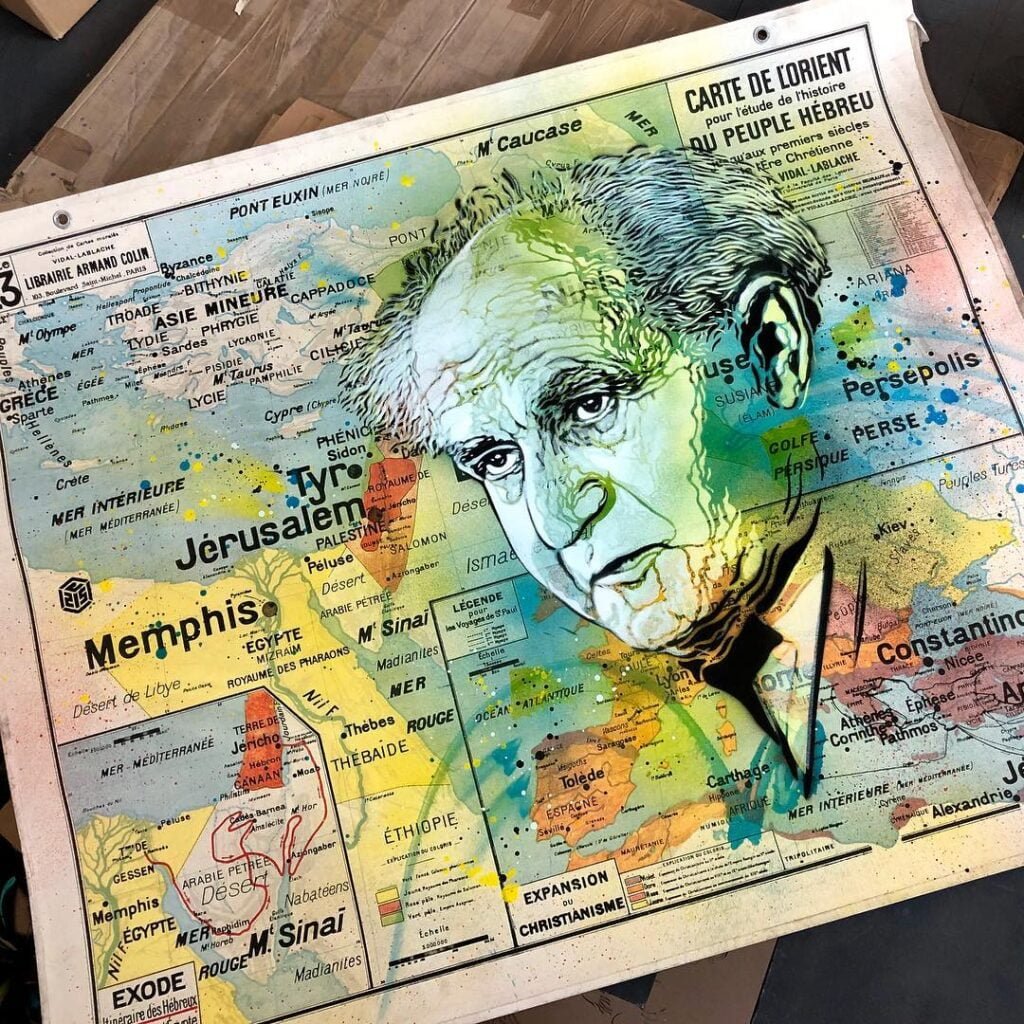
David Ben-Gurion, Israel’s first prime minister, stands resolute on a 1950s Vidal Lablache map depicting the ancient Near East and the biblical history of the Jewish people.
C215, Christian Guemy’s website c215.fr
MapsintheWild Ben-Gurion by C215
-
sur gvSIG Batoví: Nueva edición Curso – Concurso Geoalfabetización mediante la utilización de Tecnologías de la Información Geográfica
Publié: 24 May 2024, 9:10pm CEST

¡Vamos por el séptimo año!
El Curso – Concurso Geoalfabetización mediante la utilización de TIGs se desarrollará entre el 3 de junio y el 7 de noviembre y es organizado por la Dirección Nacional de Topografía (MTOP), la Inspección Nacional de Geografía y Geología (ANEP-DGES), Ceibal y la Universidad Politécnica de Madrid (España). Este año la iniciativa cuenta con la colaboración de la Dirección General de Educación Técnico-Profesional (UTU), la Asociación Nacional de Profesores de Geografía (ANPG) y la Universidad Central Marta Abreu de Las Villas (Cuba).
La iniciativa consta de 2 partes: primero: un curso denominado Tecnologías de la Información Geográfica y gvSIG Batoví dirigido a docentes de Enseñanza Media y Técnico-Profesional de Geografía y áreas relacionadas con el conocimiento geográfico, ambiental y social. La capacitación se desarrollará del 3 al 28 de junio en modalidad b-learning (plataforma + taller por videoconferencia).
Se entregará una certificación avalada por las instituciones organizadoras del curso, en la cual se reconocerá la participación satisfactoria de los cursillistas en la capacitación brindada (30 horas) y en el concurso posterior.
Para acceder a la certificación los inscriptos deberán completar el recorrido de los temas en la plataforma, asistir a los 3 días de taller, entregar las actividades propuestas y deberán también haber participado del concurso posterior.
Período de inscripción: del 27 de mayo al 2 de junio.
La segunda parte consiste en un concurso denominado Proyectos con Estudiantes y gvSIG Batoví. Los equipos de trabajo estarán integrados por estudiantes (de 3 a 5 alumnos) y al menos un docente de referencia (máx. 3), el cual debió participar en alguna edición del curso. Cada equipo deberá presentar un proyecto de trabajo que identifique y aborde una problemática de interés local, que posea una dimensión territorial y se enmarque en alguno de los Objetivos de Desarrollo Sostenible (ODS) 2030 de la Organización de las Naciones Unidas. Cada proyecto contará con un tutor que le proporcionará asesoría técnica y pedagógica.
En cuanto a la premiación, se seleccionarán 3 proyectos finalistas y de ellos el ganador del concurso. Los ganadores recibirán los premios propuestos por la organización y el resto de los equipos un certificado por su participación.
Dudas o consultas: batovi@ceibal.edu.uy
convocatoria-curso-tig-y-barovi-2024Descarga -
sur Mappery: Ho Chi Minh by C215
Publié: 24 May 2024, 11:00am CEST
Revolutionary leader Ho Chi Minh gazes out from a vintage map of Vietnam. A symbol of resilience and national pride
C215, Christian Guemy’s website c215.fr
MapsintheWild Ho Chi Minh by C215
-
sur GeoTools Team: GeoTools 31.1 Released
Publié: 23 May 2024, 8:24pm CEST
GeoTools 31.1 released The GeoTools team is pleased to announce the release of the latest stable version of GeoTools 31.1: geotools-31.1-bin.zip geotools-31.1-doc.zip geotools-31.1-userguide.zip geotools-31.1-project.zip This release is also available from the OSGeo Maven Repository and is made in conjunction with GeoServer 2.25.1 and GeoWebCache 1.25.1. Thanks to Jody Garnett -
sur Fernando Quadro: O papel do Machine Learning no GIS
Publié: 23 May 2024, 2:00pm CEST
No domínio dos Sistemas de Informação Geográfica (GIS), o Machine Learning não é apenas uma palavra da moda, é uma força transformadora. É a chave para desbloquear todo o potencial dos dados geoespaciais, transformando conjuntos de dados vastos e complexos em insights acionáveis. Vamos nos aprofundar nos tipos de algoritmos de machine learning e suas aplicações em contextos geoespaciais.
Aprendizagem supervisionada: A aprendizagem supervisionada é semelhante a ter um guia experiente no deserto de dados. Com conjuntos de dados rotulados, os algoritmos aprendem a prever resultados com base em exemplos anteriores. É perfeito para:
Mapeamento de Habitat de Espécies: Prever onde certas espécies podem prosperar.
Categorização da Cobertura do Solo: Classificação de áreas com base na vegetação, desenvolvimento urbano ou corpos d’água.
Previsão Climática: Estimativa de padrões futuros de temperatura e precipitação. Aprendizagem não supervisionada: Algoritmos de aprendizagem não supervisionados são os exploradores intrépidos, encontrando estruturas ocultas em territórios desconhecidos de dados não rotulados. Eles se destacam em:
Segmentação de imagens: Divisão de milhões de imagens de satélite em clusters significativos.
Detecção de anomalias: Identificação de padrões incomuns que possam indicar mudanças ambientais ou desenvolvimento urbano. Aprendizado profundo: O aprendizado profundo se aprofunda nos dados, usando redes neurais em camadas para processar informações de uma forma que imita o cérebro humano. Sua habilidade é evidente em:
Classificação de Imagens: Distinguir entre diferentes usos do solo em imagens de satélite.
Detecção de Objetos: Identificação e localização de objetos como veículos ou edifícios em fotos aéreas.
Análise de Séries Temporais: Monitoramento de mudanças ao longo do tempo, como desmatamento ou expansão urbana. Algoritmos Comuns: Os algoritmos mais comumente usados em análise geoespacial incluem:
Random Forest: um método de conjunto robusto, ótimo para tarefas de classificação e regressão.
Regressão Linear: Ideal para prever variáveis contínuas, como tendências de temperatura.
Regressão Logística e Árvores de Decisão: Útil para classificação binária, como áreas propensas a inundações.
K-Nearest Neighbors: Um método simples, mas eficaz para classificação com base na proximidade.
Naïve Bayes: Uma abordagem probabilística frequentemente usada para classificação de texto e filtragem de spam.
K-Means Clustering: Um algoritmo não supervisionado que agrupa dados em k clusters distintos.À medida que continuamos a aproveitar esses algoritmos, não estamos apenas mapeando o mundo, estamos moldando-o. O futuro da análise geoespacial está aqui e é inteligente, dinâmico e incrivelmente emocionante.
Gostou desse post? Conte nos comentários
-
sur Mappery: What matters is Love by C215
Publié: 23 May 2024, 11:00am CEST

A masked Parisian embrace painted over a map of the City of Lights. C215 reminds us: “l’important c’est d’aimer” (what matters is love).
C215, Christian Guemy’s website c215.fr
MapsintheWild What matters is Love by C215
-
sur GeoSolutions: Building and Consuming Urban Digital Twins with Open-Source Tools
Publié: 23 May 2024, 8:01am CEST
You must be logged into the site to view this content.
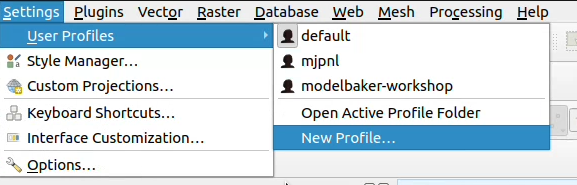

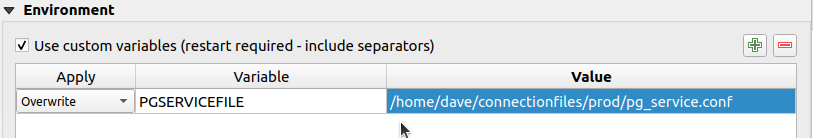
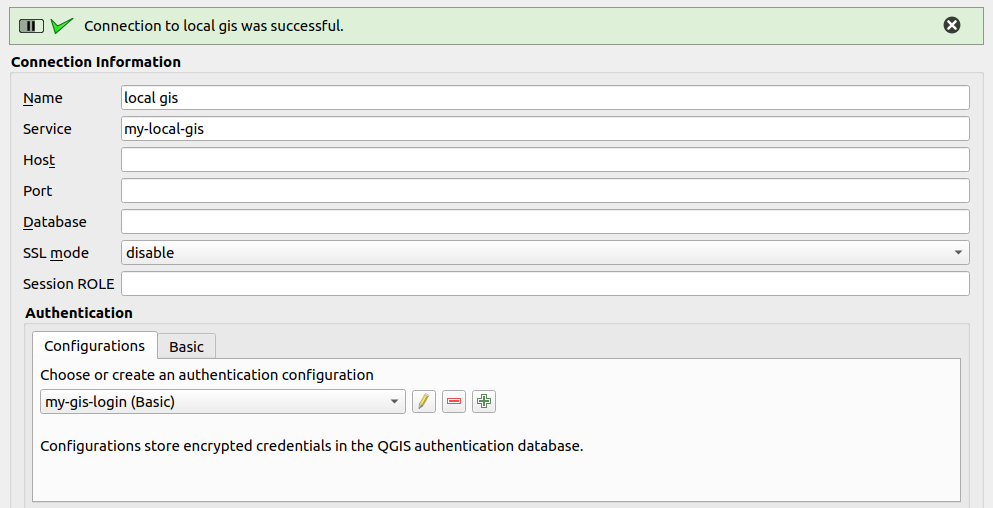
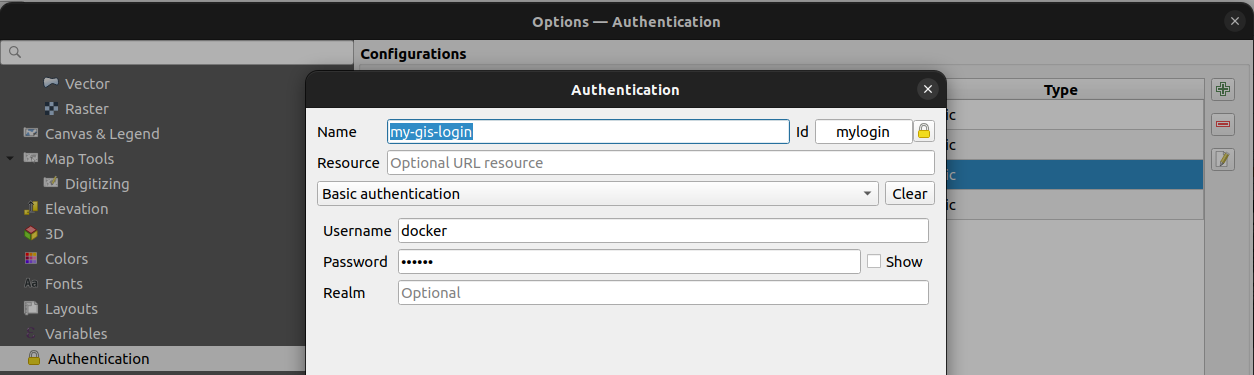
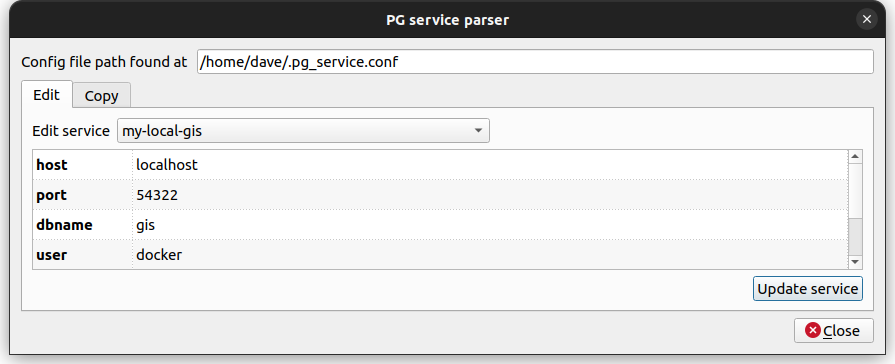


-
sur [Equipe Oslandia] Jacky, ingénieur SIG / développeur Python C++
Publié: 23 May 2024, 6:56am CEST par Caroline Chanlon
Chaque mois, nous avons le plaisir de vous présenter un membre de l’équipe, aujourd’hui c’est Jacky qui a répondu à nos questions
Jacky a effectué 7 ans de sa scolarité à la maison lui permettant de consacrer du temps à des activités plus « libres » que le cadre strict de l’enseignement traditionnel. Il découvre très jeune l’informatique, la programmation mais apprend aussi le braille, s’adonne à la pêche, à l’astronomie, à la danse ou à la musique. C’est en candidat libre qu’il obtient son Bac Scientifique. Il poursuit ses études avec un DUT Mesures Physiques, en alternance chez Schneider Electric, et un diplôme d’Ingénieur Électronique et Informatique industrielle à Polytech Grenoble en alternance chez STMicroelectronics.
Il passe 3 ans chez ST au sein du service R&D avant de rejoindre en tant qu’ingénieur / chercheur le CEA Leti et plus précisément le service lithographie à faisceau d’électrons où il travaille à anticiper la déformation sur le silicium (EBPC – Electron Beam Proximity Correction). Il reste 3 ans au CEA.
« Je voulais sortir du côté grosse entreprise, j’ai été embauché chez Unistellar, une start-up qui préparait son Kickstarter. J’ai travaillé sur son téléscope intelligent (avec traitement d’images en direct) connecté piloté par le smartphone et plus précisément sur la stabilisation du code embarqué, afin de créer le prototype assez avancé pour trouver des investisseurs »
Pour des raisons familiales, Jacky rejoint Aix en Provence et commence à travailler pour la société du Canal de Provence pour renforcer l’équipe de développeurs QGIS. Il découvre les SIG et QGIS !
« Au CEA, je travaillais dans le traitement géométrique et chez Unistellar également, je suis passé de l’infiniment petit à l’infiniment grand, pour être à l’échelle terrestre aujourd’hui. Je retrouve des traitements similaires au final. »
C’est sa collègue du Canal de Provence qui lui fait connaitre Oslandia à travers des contributions QGIS. Jacky est embauché chez Oslandia en 2021 au poste d’ingénieur SIG / développeur Python C++.
« On peut dire que je suis parti en éclaireur, Gwendoline, ma collègue nous a rejoint 6 mois après mon arrivée. »
Jacky travaille au développement de modules Python pour QGIS et depuis 6 mois, sur le développement QGIS cœur en C++.
Ses projets emblématiques- Avec L’INRAE : plugin QGIS Python d’aide à la décision pour la création de réseaux d’assainissement – [Plus d’infos]
- Avec l’agence spatiale canadienne : plugin GQIS python pour le suivi de vols de ballons stratosphériques – [Plus d’infos]
Python et C++
Sa philosophieTout est relatif !
Oslandia en 1 motPartage !
-
sur GeoTools Team: GeoTools 30.3 released
Publié: 23 May 2024, 2:51am CEST
The GeoTools team is pleased to the release of the latest stable version of GeoTools 30.3:geotools-30.3-bin.zip geotools-30.3-doc.zip geotools-30.3-userguide.zip geotools-30.3-project.zip This release is also available from the OSGeo Maven Repository and is made in conjunction with GeoServer 2.24.3. The release was made by Andrea Aime (Geosolutions). -
sur GeoServer Team: GeoServer 2.25.1 Release
Publié: 23 May 2024, 2:00am CEST
GeoServer 2.25.1 release is now available with downloads (bin, war, windows), along with docs and extensions.
This is a stable release of GeoServer recommended for production use. GeoServer 2.25.1 is made in conjunction with GeoTools 31.1, and GeoWebCache 1.25.1.
Thanks to Jody Garnett (GeoCat) for making this release.
Security ConsiderationsThis release addresses security vulnerabilities and is considered an essential upgrade for production systems.
See project security policy for more information on how security vulnerabilities are managed.
Raster Attribute Table ExtensionA new extension is available that takes advantage of the GDAL Raster Attribute Table (RAT). This data structure provides a way to associate attribute information for individual pixel values within the raster. This provides a table that links each cell value in the raster to one or more attributes on the fly.
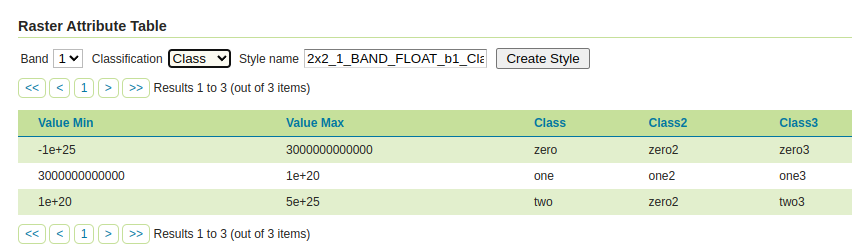
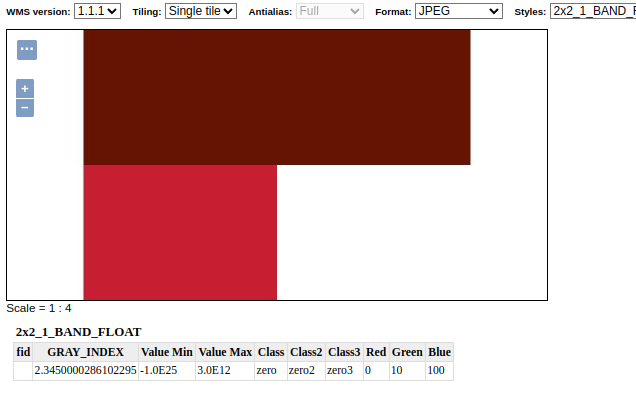
Thanks to Andrea Aime (GeoSolutions) for the development and NOAA for sponsoring this new capability. Please see the user guide Raster Attribute Table support for more information.
- GEOS-11376 Graduate Raster Attribute Table to extension
New Feature:
- GEOS-11267 CSW ISO extension multiple mappings should also have multiple queryable mappings
- GEOS-11376 Graduate Raster Attribute Table to extension
Improvement:
- GEOS-11306 Java 17 does not support GetFeature lazy JDBC count(*)
- GEOS-11311 Show a full stack trace in the JVM stack dump panel
- GEOS-11342 STAC should exclude items when the collection in path is wrong
- GEOS-11359 Update MapML viewer to release 0.13.2
-
GEOS-11369 Additional authentication options for cascaded WMS WMTS data stores - GEOS-11377 RAT module: allow to reload/recompute the RAT
- GEOS-11400 About Page Layout and display of build information
- GEOS-11401 Introduce environmental variables for Module Status page
Bug:
- GEOS-11202 CAS extension doesn’t use global “proxy base URL” setting for service ticket
- GEOS-11236 WFS 2.0.0/GetFeature - Shapefile - “We have had issues trying to flip axis”
- GEOS-11331 OAuth2 can throw a “ java.lang.RuntimeException: Never should reach this point”
- GEOS-11332 Renaming style with uppercase/downcase empty the sld file
- GEOS-11382 The interceptor “CiteComplianceHack” never gets invoked by the Dispatcher Servlet
- GEOS-11385 Demo Requests functionality does not honour ENV variable PROXY_BASE_URL
- GEOS-11392 ConcurrentModificationException while using proxy-base-ext
Task:
- GEOS-11360 Upgrade Apache POI from 4.1.1 to 5.2.5
- GEOS-11362 Upgrade Spring libs from 5.3.32 to 5.3.33
- GEOS-11374 Upgrade Spring version from 5.3.33 to 5.3.34
- GEOS-11375 GSIP 224 - Individual contributor clarification
- GEOS-11388 Update ImageIO-EXT to 1.4.10
- GEOS-11393 Upgrade commons-io from 2.12.0 to 2.16.1
- GEOS-11395 Upgrade guava from 32.0.0 to 33.2.0
- GEOS-11397 App-Schema Includes fix Integration Tests
- GEOS-11402 Upgrade PostgreSQL driver from 42.7.2 to 42.7.3
- GEOS-11403 Upgrade commons-text from 1.10.0 to 1.12.0
- GEOS-11404 Upgrade commons-codec from 1.15 to 1.17.0
For the complete list see 2.25.1 release notes.
Community UpdatesCommunity module development:
- GEOS-11040 Could not get a ServiceInfo for service Features thus could not check if the service is enabled
- GEOS-11330 OAuth2 kid verification should be optional
- GEOS-11339 Introducing the Features Autopopulate Community Plugin
- GEOS-11340 WFS Freemarker HTML Outputformat
- GEOS-11345 STAC Conformance URIs need to be updated to v1.0.0
- GEOS-11348 JMS cluster does not allow to publish style via REST “2 step” approach
- GEOS-11358 Feature-Autopopulate Update operation does not apply the Update Element filter
- GEOS-11381 Error in OIDC plugin in combination with RoleService
- GEOS-11394 OGC APIs cannot handle time extent when the source data type is java.sql.Date
Community modules are shared as source code to encourage collaboration. If a topic being explored is of interest to you, please contact the module developer to offer assistance.
About GeoServer 2.25 SeriesAdditional information on GeoServer 2.25 series:
-
sur GeoServer Team: GeoServer 2.25.1 Release
Publié: 23 May 2024, 2:00am CEST
GeoServer 2.25.1 release is now available with downloads (bin, war, windows), along with docs and extensions.
This is a stable release of GeoServer recommended for production use. GeoServer 2.25.1 is made in conjunction with GeoTools 31.1, and GeoWebCache 1.25.1.
Thanks to Jody Garnett (GeoCat) for making this release.
Security ConsiderationsThis release addresses security vulnerabilities and is considered an essential upgrade for production systems.
See project security policy for more information on how security vulnerabilities are managed.
Raster Attribute Table ExtensionA new extension is available that takes advantage of the GDAL Raster Attribute Table (RAT). This data structure provides a way to associate attribute information for individual pixel values within the raster. This provides a table that links each cell value in the raster to one or more attributes on the fly.
Thanks to Andrea Aime (GeoSolutions) for the development and NOAA for sponsoring this new capability. Please see the user guide Raster Attribute Table support for more information.
- GEOS-11376 Graduate Raster Attribute Table to extension
New Feature:
- GEOS-11267 CSW ISO extension multiple mappings should also have multiple queryable mappings
- GEOS-11376 Graduate Raster Attribute Table to extension
Improvement:
- GEOS-11306 Java 17 does not support GetFeature lazy JDBC count(*)
- GEOS-11311 Show a full stack trace in the JVM stack dump panel
- GEOS-11342 STAC should exclude items when the collection in path is wrong
- GEOS-11359 Update MapML viewer to release 0.13.2
-
GEOS-11369 Additional authentication options for cascaded WMS WMTS data stores - GEOS-11377 RAT module: allow to reload/recompute the RAT
- GEOS-11400 About Page Layout and display of build information
- GEOS-11401 Introduce environmental variables for Module Status page
Bug:
- GEOS-11202 CAS extension doesn’t use global “proxy base URL” setting for service ticket
- GEOS-11236 WFS 2.0.0/GetFeature - Shapefile - “We have had issues trying to flip axis”
- GEOS-11331 OAuth2 can throw a “ java.lang.RuntimeException: Never should reach this point”
- GEOS-11332 Renaming style with uppercase/downcase empty the sld file
- GEOS-11382 The interceptor “CiteComplianceHack” never gets invoked by the Dispatcher Servlet
- GEOS-11385 Demo Requests functionality does not honour ENV variable PROXY_BASE_URL
- GEOS-11392 ConcurrentModificationException while using proxy-base-ext
Task:
- GEOS-11360 Upgrade Apache POI from 4.1.1 to 5.2.5
- GEOS-11362 Upgrade Spring libs from 5.3.32 to 5.3.33
- GEOS-11374 Upgrade Spring version from 5.3.33 to 5.3.34
- GEOS-11375 GSIP 224 - Individual contributor clarification
- GEOS-11388 Update ImageIO-EXT to 1.4.10
- GEOS-11393 Upgrade commons-io from 2.12.0 to 2.16.1
- GEOS-11395 Upgrade guava from 32.0.0 to 33.2.0
- GEOS-11397 App-Schema Includes fix Integration Tests
- GEOS-11402 Upgrade PostgreSQL driver from 42.7.2 to 42.7.3
- GEOS-11403 Upgrade commons-text from 1.10.0 to 1.12.0
- GEOS-11404 Upgrade commons-codec from 1.15 to 1.17.0
For the complete list see 2.25.1 release notes.
Community UpdatesCommunity module development:
- GEOS-11040 Could not get a ServiceInfo for service Features thus could not check if the service is enabled
- GEOS-11330 OAuth2 kid verification should be optional
- GEOS-11339 Introducing the Features Autopopulate Community Plugin
- GEOS-11340 WFS Freemarker HTML Outputformat
- GEOS-11345 STAC Conformance URIs need to be updated to v1.0.0
- GEOS-11348 JMS cluster does not allow to publish style via REST “2 step” approach
- GEOS-11358 Feature-Autopopulate Update operation does not apply the Update Element filter
- GEOS-11381 Error in OIDC plugin in combination with RoleService
- GEOS-11394 OGC APIs cannot handle time extent when the source data type is java.sql.Date
Community modules are shared as source code to encourage collaboration. If a topic being explored is of interest to you, please contact the module developer to offer assistance.
About GeoServer 2.25 SeriesAdditional information on GeoServer 2.25 series:
-
sur Camptocamp: Camptocamp Sponsors Two PostgreSQL Events in June: pgday.fr and pgday.ch
Publié: 23 May 2024, 2:00am CEST
Pièce jointe: [télécharger]
As a company committed to supporting our clients in deploying, optimizing, monitoring, securing, and utilizing PostgreSQL, we have decided to extend our support to the PostgreSQL community by sponsoring these conferences at the "supporters" level. -
sur Fernando Quadro: Geoprocessamento na Saúde
Publié: 22 May 2024, 2:00pm CEST
A localização de eventos de saúde no espaço geográfico com base em mapas não é recente. Em 1854, o médico John Snow investigou no bairro de Soho, em Londres, um surto de cólera. Ele mapeou com base nos croquis dos quarteirões, as casas atingidas e relacionou com as pessoas que beberam água de uma fonte na Broad Street.
Logo, percebeu que aquele surto em particular ocorrera em torno de uma bomba de água compartilhada que a maioria dos habitantes usava para coletar água para beber e lavar. Essa foi a primeira vez que um mapa foi usado para melhor compreensão de uma doença e estabelecer medidas de controle.
Várias são as possibilidades do uso do geoprocessamento na saúde:
Serviços de saúde,
Saúde ambiental,
Epidemiologia de doenças crônicas não transmissíveis,
Epidemiologia de doenças transmissíveis,
Identificação de áreas de risco,
Entre outros…A melhora e o aumento na disponibilidade de bases de dados e dos SIG trouxeram ganhos importantíssimos para aplicação do geoprocessamento na área da saúde. Podemos citar os Sistemas de Informação em Saúde que abarcam dados sobre nascimentos, óbitos e doenças de notificação compulsória, entre eles:
Sistema de Informação de Mortalidade (SIM),
Sistema de Nascidos Vivos (SINASC) ,
Sistema de Informação de Agravos de Notificação (SINAN). As possibilidades de técnicas disponíveis em SIGs robustos, permitem análises que são úteis na identificação de áreas de risco para determinados agravos, bem como na análise destes que busquem relação com variáveis ambientais extraídas de informações sobre uso e ocupação do solo ou de variáveis climáticas, extraídas de produtos de sensoriamento remoto e de métodos de reanálise para o monitoramento climático; ou na combinação de variáveis, ambientais, climáticas socioeconômicas a partir do uso de modelos estatísticos espaciais que permite tratar a heterogeneidade espacial e espaço temporal, levando em conta tanto a vizinhança (a dependência espacial) como a existência de estruturas hierárquicas de dados em questão.
Em resumo, a aplicação do geoprocessamento e das técnicas de análise espacial associadas ao acesso livre e gratuito de SIGs e de inúmeras fontes de dados, vem abrindo oportunidades de uso na área de saúde pública, não somente para pesquisadores em seus estudos, mas especialmente para os profissionais que atuam na área da saúde.
Gostou desse post? Conte nos comentários
-
sur Mappery: Antoine de Saint Exupery by C215
Publié: 22 May 2024, 11:00am CEST
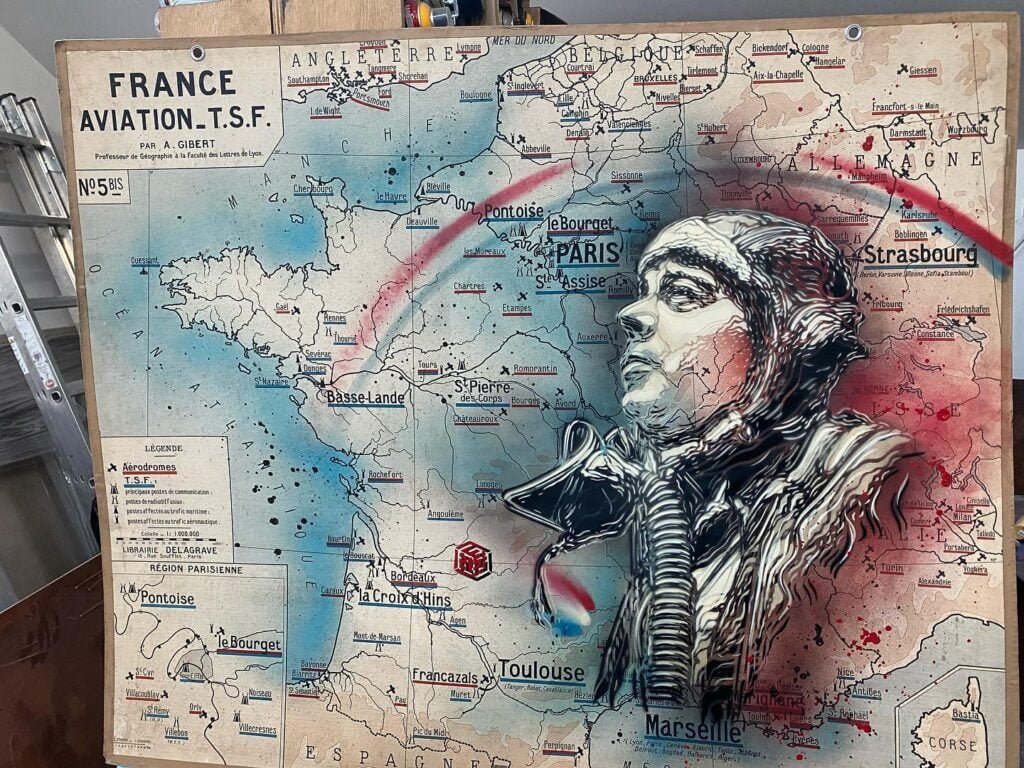
French author Antoine de Saint-Exupéry, known for “The Little Prince,” soars over his homeland on a vintage map of France. Where will imagination take you today?
C215, Christian Guemy Website : c215.fr
MapsintheWild Antoine de Saint Exupery by C215
-
sur Camptocamp: NexSIS - the Go Live!
Publié: 22 May 2024, 2:00am CEST
Pièce jointe: [télécharger]
At the start of the NexSIS project in 2019, the Digital Agency for Civil Security (ANSC) chose to entrust the development of the cartographic features of its applications to the teams at Camptocamp. -
sur Camptocamp: NexSIS - the Go Live!
Publié: 22 May 2024, 2:00am CEST
Pièce jointe: [télécharger]
At the start of the NexSIS project in 2019, the Digital Agency for Civil Security (ANSC) chose to entrust the development of the cartographic features of its applications to the teams at Camptocamp. -
sur Fernando Quadro: Curso Combo PostgreSQL, PostGIS e GeoServer
Publié: 21 May 2024, 2:00pm CEST
Neste mês de maio a Geocursos está com inscrições abertas para seu Curso Combo com PostgreSQL, PostGIS e GeoServer, uma formação completa, saindo do zero em banco de dados (PostgreSQL/PostGIS), passando pela linguagem SQL, análises espaciais no PostGIS até a publicação completa de seus mapas na internet com o GeoServer.
O mercado de trabalho está cada vez mais competitivo, e o conhecimento em banco de dados (PostgreSQL/PostGIS) e servidor de mapas (GeoServer) tem sido cada vez mais um pré-requisito para qualquer profissional na área do Geoprocessamento.
Pensando nisso, a Geocursos está disponibilizando um cupom de R$ 270 reais de desconto pra você, basta ir no nosso WhatsApp e dizer “QUERO DESCONTO“.
 Você ficou interessado?
 -
sur Mappery: Africa Lion by C215
Publié: 21 May 2024, 11:00am CEST
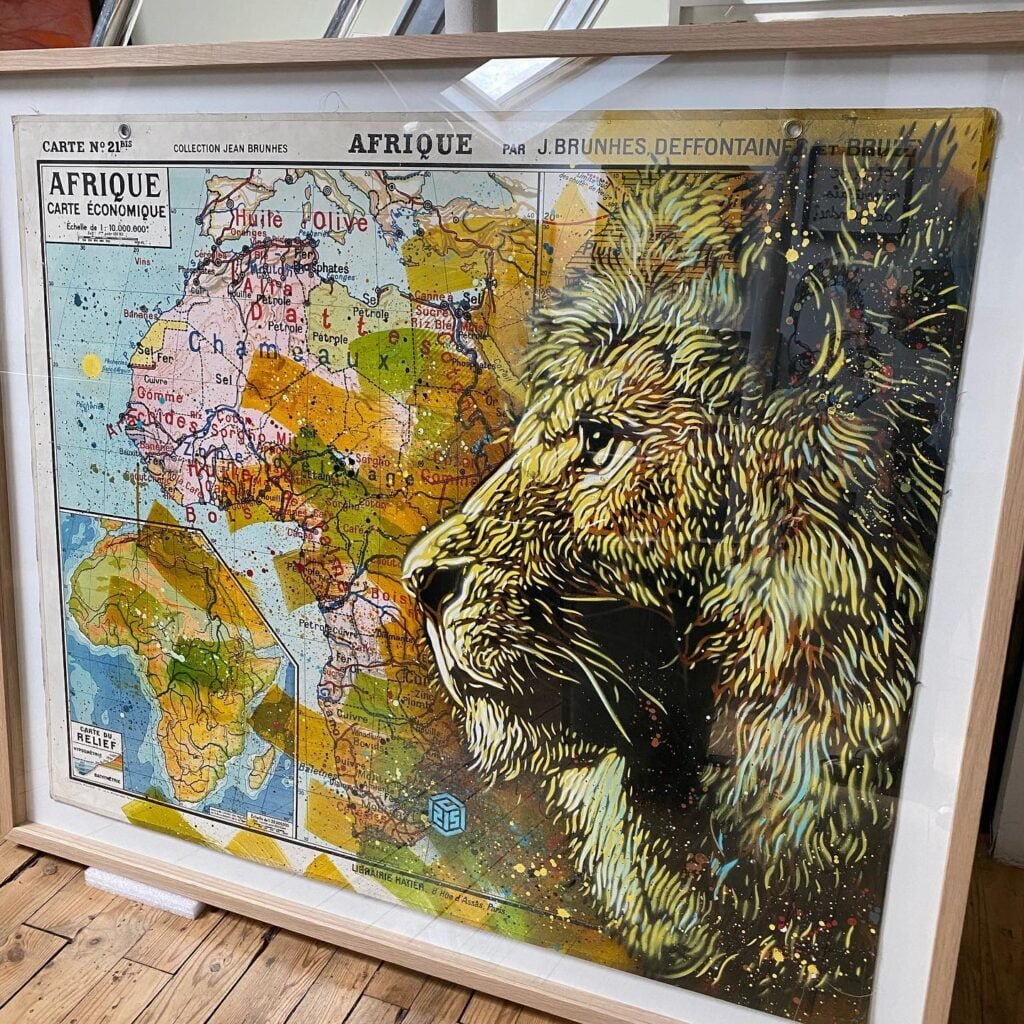
For our second episode, I chose this powerful image of a lion standing proudly over a map of Africa. It evokes the continent’s rich wildlife and the lion’s reign as the apex predator in the savannas and grasslands.
C215, Christian Guemy’s English website c215.fr
MapsintheWild Africa Lion by C215
-
sur Direction de la Sûreté SNCF x accompagnement QGIS et QGIS Server
Publié: 21 May 2024, 7:19am CEST par Caroline Chanlon
La Direction de la Sûreté, rattachée à la Direction Générale, est transverse au groupe SNCF et opère des missions de sécurisation des biens et des personnes. En appui de ses missions, la Direction de la Sûreté s’est dotée d’un système d’hypervision qui comporte une visualisation cartographique des équipements, personnels et évènements.
Afin de garantir le bon fonctionnement du système d’hypervision, la Direction a choisi de se doter d’outils et serveurs cartographiques indépendants de l’hyperviseur lui-même, et pour ce faire a choisi notre accompagnement autour de QGIS Server.
Oslandia propose en effet une maintenance forfaitaire qui garantit à la SNCF un fonctionnement inaltéré de son hyperviseur.
Contributeur essentiel de la solution open source QGIS, Oslandia dispose de la plus grande équipe française de développeurs experts QGIS et propose une offre de support unique en France [https:]] !
-
sur Free and Open Source GIS Ramblings: New Trajectools 2.1 and MovingPandas 0.18 releases
Publié: 20 May 2024, 5:07pm CEST
Today marks the 2.1 release of Trajectools for QGIS. This release adds multiple new algorithms and improvements. Since some improvements involve upstream MovingPandas functionality, I recommend to also update MovingPandas while you’re at it.

If you have installed QGIS and MovingPandas via conda / mamba, you can simply:
conda activate qgis
mamba install movingpandas=0.18
Afterwards, you can check that the library was correctly installed using:
import movingpandas as mpd
mpd.show_versions()
Trajectools 2.1
The new Trajectools algorithms are:
- Trajectory overlay — Intersect trajectories with polygon layer
- Privacy — Home work attack (requires scikit-mobility)
- This algorithm determines how easy it is to identify an individual in a dataset. In a home and work attack the adversary knows the coordinates of the two locations most frequently visited by an individual.
- GTFS — Extract segments (requires gtfs_functions)
- GTFS — Extract shapes (requires gtfs_functions)
- These algorithms extract public transport routes (GTFS shapes) and route segments between stops (GTFS segments) from GTFS ZIP files using gtfs_functions.Feed.shapes and .segments, respectively.
Furthermore, we have fixed issue with previously ignored minimum trajectory length settings.


Scikit-mobility and gtfs_functions are optional dependencies. You do not need to install them, if you do not want to use the corresponding algorithms. In any case, they can be installed using mamba and pip:
MovingPandas 0.18mamba install scikit-mobility pip install gtfs_functionsThis release adds multiple new features, including
- Method chaining support for add_speed(), add_direction(), and other functions
- New TrajectoryCollection.get_trajectories(obj_id) function
- New trajectory splitter based on heading angle
- New TrajectoryCollection.intersection(feature) function
- New plotting function hvplot_pts()
- Faster TrajectoryCollection operations through multi-threading
- Added moving object weights support to trajectory aggregator


-
sur Mappery: Aime Cesaire by c215
Publié: 20 May 2024, 11:00am CEST
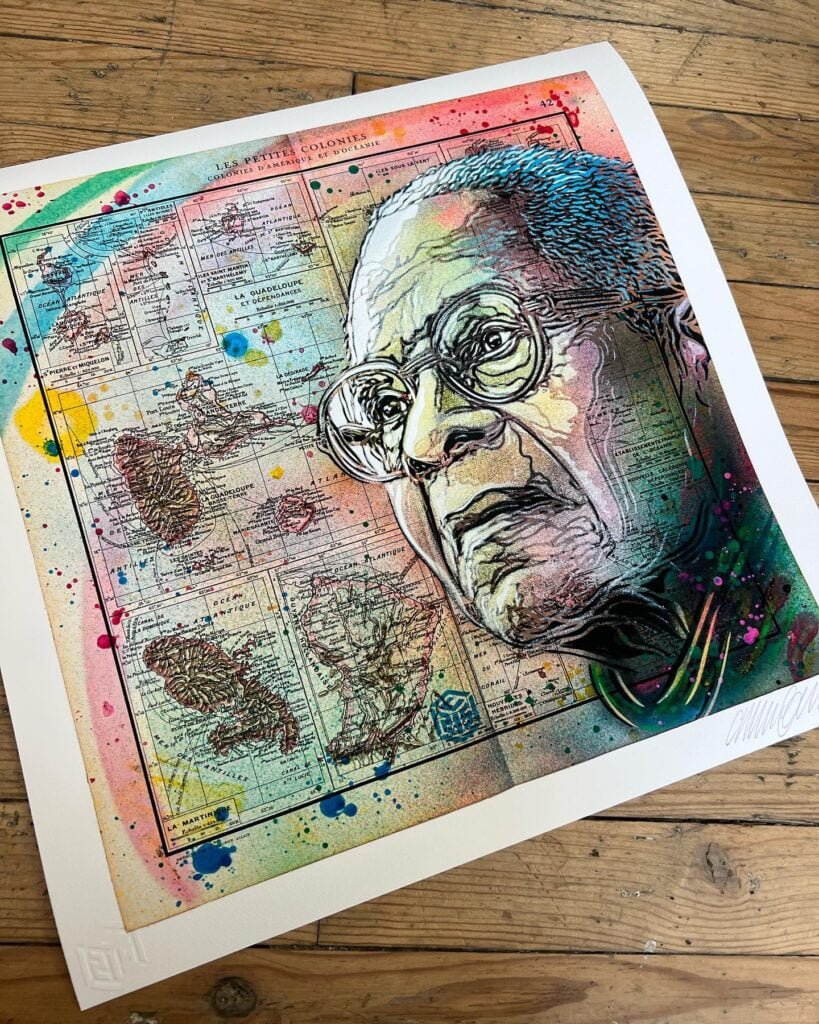
This week, we start a series with the artist Christian Guemy. C215, Christian Guemy’s artistic pseudonym, is a French street artist renowned for his unique blend of historical figures and vintage map boards. By transforming these weathered maps into canvases, C215 breathes new life into forgotten objects while leaving a powerful commentary on the passage of time and the enduring legacy of influential figures.
A Fusion of Past and Present
C215’s signature style involves meticulously stencilling portraits of iconic individuals—activists, scientists, artists, and more—directly onto the aged surfaces of map boards. These maps, often discarded or forgotten, become powerful symbols of the past. By juxtaposing these historical figures with the faded geography, C215 compels viewers to contemplate the connection between the past, present, and future.
A Street Art Pioneer
C215 is considered a pioneer of the French street art movement. He emerged in the early 2000s, bringing his art form to the streets of Paris and beyond. His work can be found adorning walls, buildings, and even abandoned spaces throughout Europe and across the globe.
More Than Just Portraits
While portraits are a defining element of C215’s art, his work delves into social commentary. He has used his stencils to address issues of war, poverty, and environmental degradation. The weathered maps themselves become a metaphor for the fragility of our world and the need to learn from the past.
C215’s art transcends the boundaries of traditional street art. By using vintage map boards as his canvas, he creates a powerful dialogue between past and present, reminding us of the enduring impact of history’s figures and the importance of learning from their legacies.
For further exploration, you can search online for:
- Images of C215’s street art
- Interviews with C215
C215 website is c215.fr (link to the English version).
MapsintheWild Aime Cesaire by c215
-
sur Mappery: Planet Gummi
Publié: 19 May 2024, 11:00am CEST
-
sur Mappery: Enter through the Mappy Doors
Publié: 18 May 2024, 11:00am CEST

Reinder sent this pic of the entrance to the Dutch National Archive, he said “It’s hard to see – but these glass doors in the Dutch National Archives in The Hague do contain a cartographic image of the Netherlands”.
Instead of through the looking glass, we have through the cartograph ?
MapsintheWild Enter through the Mappy Doors
-
sur Mappery: OS Picnic Blanket
Publié: 17 May 2024, 12:00pm CEST
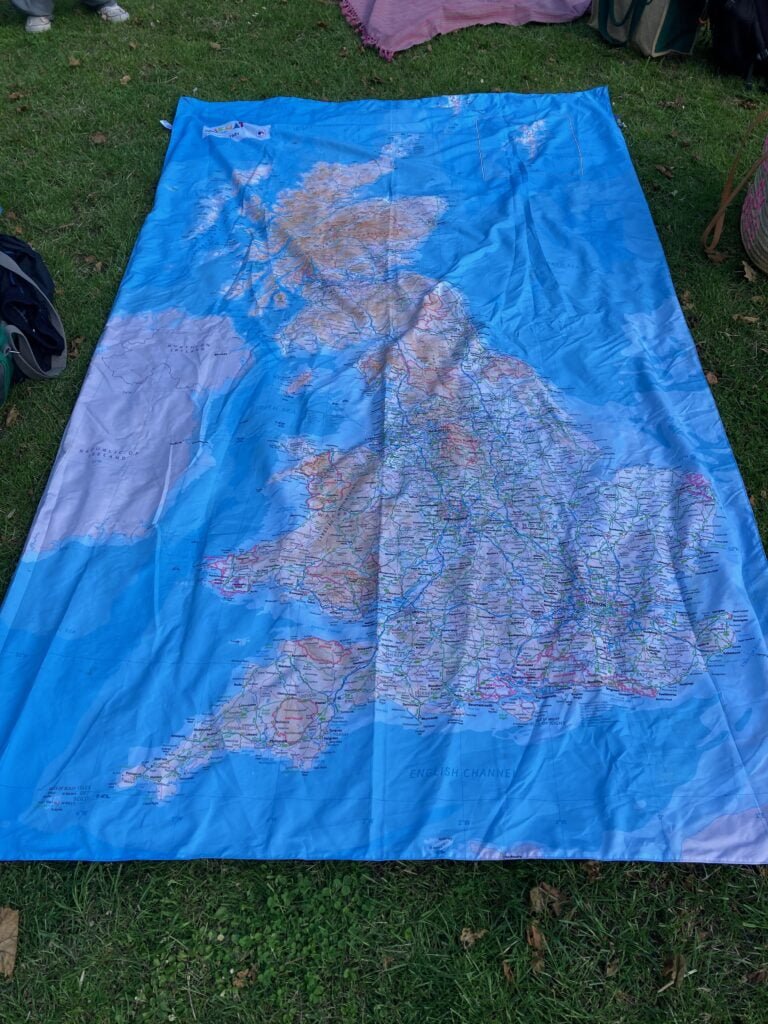
When your Canadian friends have just arrived in London and have settled in. I must admit I am still a bit jealous of their blanket.
MapsintheWild OS Picnic Blanket
-
sur Martin Davis: JTS Topological Relationships - the Next Generation
Publié: 16 May 2024, 11:41pm CEST
The most fundamental and widely-used operations in the JTS Topology Suite are the ones that evaluate topological relationships between geometries. JTS implements the Dimensionally-Extended 9 Intersection Model (DE-9IM), as defined in the OGC Simple Features specification, in the RelateOp API.
 DE-9IM matrix for overlapping polygons
The RelateOp algorithm was the very first one implemented during the initial JTS development, over 20 years ago. At that time it was an appealing idea to implement a general-purpose topology framework (the GeometryGraph package), and use it to support topological predicates, overlay, and buffering. However, some disadvantages of this approach have become evident over time:
- the need to create a topological graph structure limits the ability to improve performance. This has led to the implementation of PreparedGeometry - but that adds further complexity to the codebase, and supports only a limited set of predicates.
- a large number of code dependencies make it hard to fix problems and improve semantics
- constructing a full topology graph increases exposure to geometric robustness errors
- GeometryCollections are not supported (initially because the OGC did not define the semantics for this, and now because adding this capability is difficult)
The importance of this functionality is especially significant since the same algorithm is implemented in GEOS. That codebase is used to evaluate spatial queries in popular spatial APIs such as Shapely and R-sf, and numerous systems such as PostGIS, DuckDB, SpatialLite, QGIS, and GDAL (to name just a few). It would not be surprising to learn that the RelateOp algorithm is executed billions of times per day across the world's CPUs.During the subsequent years of working on JTS I realized that there was a better way to evaluate topological relationships. It would required a ground-up rewrite, but would avoid the shortcomings of RelateOp and provide better performance and a more tractable codebase. Thanks to my employer Crunchy Data I have finally been able to make this idea a reality. Soon JTS will provide a new algorithm for topological relationships called RelateNG.
Key Features of RelateNGThe RelateNG algorithm incorporates a broad spectrum of improvements over RelateOp in the areas of functionality, robustness, and performance. It provides the following features:
- Efficient short-circuited evaluation of topological predicates (including matching custom DE-9IM matrix patterns)
- Optimized repeated evaluation of predicates against a single geometry via cached spatial indexes (AKA "prepared mode")
- Robust computation (only point-local geometry topology is computed, so invalid topology does not cause failures)
- GeometryCollection inputs containing mixed types and overlapping polygons are supported, using union semantics.
- Zero-length LineStrings are treated as being topologically identical to Points.
- Support for BoundaryNodeRules.
The main entry point is the RelateNG class. It supports evaluating topological relationships in three different ways:
- Evaluating a standard OGC named boolean binary predicate, specified via a TopologyPredicate instance. Standard predicates are obtained from the RelatePredicate factory functions intersects, contains, overlaps, etc.
- Testing an arbitrary DE-9IM relationship by matching an intersection matrix pattern (e.g. "T**FF*FF*", which is the pattern for a relation called Contains Properly).
- Computing the full value of a DE-9IM IntersectionMatrix.
Here is an example of matching an intersection matrix pattern, in stateless mode:boolean isMatched = RelateNG.relate(geomA, geomB, "T**FF*FF*");
Here is an example of setting up a geometry in prepared mode, and evaluating a named predicate on it:RelateNG rng = RelateNG.prepare(geomA);
Rolling It Out
for (Geometry geomB : geomSet) {
boolean predValue = rng.evaluate(geomB, RelatePredicate.intersects());
}It's exciting to launch a major improvement on such a core piece of spatial functionality. The Crunchy spatial team will get busy on porting this algorithm to GEOS. From there it should get extensive usage in downstream projects. We're looking forward to hearing feedback from our own PostGIS clients as well as other users. We're always happy to be able to reduce query times and equally importantly, carbon footprints.
In further blog posts I'll describe the RelateNG algorithm design and provide some examples of performance metrics.
Future IdeasThe RelateNG implementation provides an excellent foundation to build out some interesting extensions to the fundamental DE-9IM concept.
Extended PatternsThe current DE-9IM pattern language is quite limited. In fact, it's not even powerful enough to express the standard named predicates. It could be improved by adding features like:
- disjunctive combinations of patterns. For example, touches is defined by "FT******* | F**T***** | F***T****"
- dimension guards to specify which dimensions a pattern applies to. For example, overlaps is defined by "[0,2] T*T***T** | [1] 1*T***T**"
- while we're at it, might as well support dotted notation and spaces for readability; e.g. "FT*.***.***"
A challenge with implementing algorithms over a wide variety of spatial types and use cases is how to provide general-purpose code which matches (or exceeds) the efficiency of more targeted implementations. RelateNG analyzes the input geometries and the predicate under evaluation to tune strategies to reduce the amount of work needed to evaluate the DE-9IM. It may be that profiling specific use cases reveals further hotspots in the code which can be improved by additional optimizations.
Curve SupportGEOS has recently added support for representing geometries with curves. The RelateNG design is modular enough that it should be possible to extend it to allow evaluating relationships for geometries with curves.
-
sur Fernando Quadro: O Poder da Consulta Geoespacial
Publié: 16 May 2024, 2:00pm CEST
A consulta geoespacial, ou SQL espacial, está revolucionando a maneira como conduzimos operações de Sistemas de Informações Geográficas (GIS). Ao aproveitar funções e recursos espaciais em bancos de dados SQL, podemos analisar e obter insights valiosos de dados espaciais de maneira transparente.
Uma das principais vantagens do SQL espacial é a sua capacidade de encontrar relações entre geometrias. Seja para determinar proximidade, sobreposição ou contenção, o SQL espacial nos permite desbloquear conexões significativas em conjuntos de dados espaciais. Esta funcionalidade é crucial para diversas aplicações, desde planejamento urbano até monitoramento ambiental e muito mais.
Além disso, a integração de SQL espacial em processos de back-end enriquece nosso código com poderosos recursos analíticos. Ao aplicar a análise espacial diretamente em nossas consultas de banco de dados, simplificamos os fluxos de trabalho e aumentamos a eficiência da tomada de decisões baseada em dados.
No mundo atual orientado por dados, dominar o SQL espacial abre portas para um mundo de possibilidades em GIS e muito mais. Você está pronto para aproveitar todo o potencial da análise de dados espaciais?
Gostou desse post? Conte nos comentários
-
sur Mappery: Levis go Mappy
Publié: 16 May 2024, 11:00am CEST
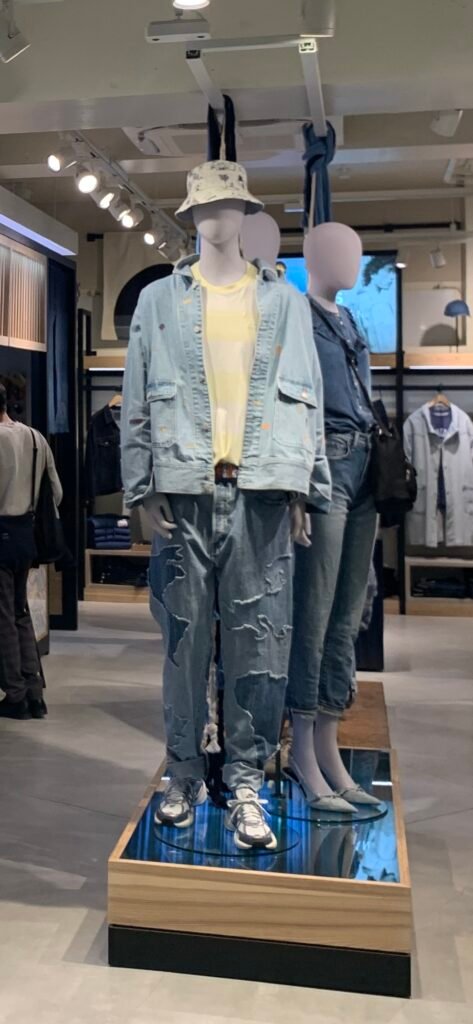
Marc-Tobias spotted these designery jeans on his travels in Japan. They are sort of must-have for map loving jeans wearers, you can buy them here
MapsintheWild Levis go Mappy
-
sur Mappery: Missions of Mexico
Publié: 15 May 2024, 11:00am CEST
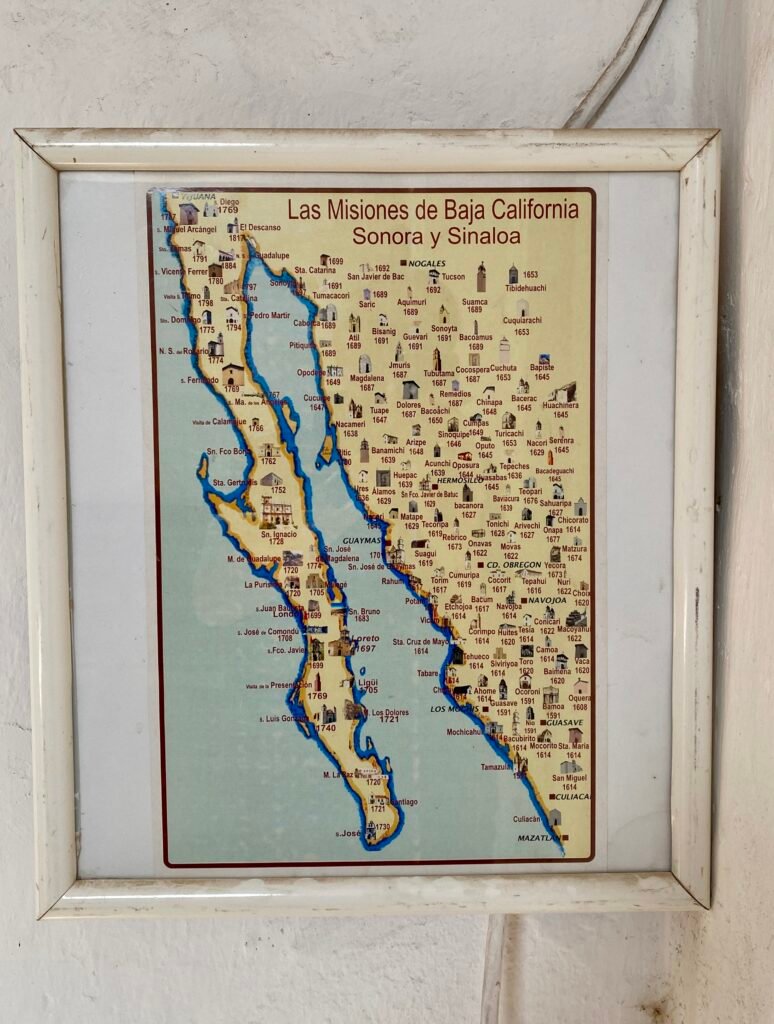
Walter Schwartz sentg us this, he said “Northwestern Mexico, where Baja, Sonora, and Sinaloa provinces are found, has been home to a *lot* of missions since at least 1591. I counted around 100 established in the 1600s and 1700s alone. This picto-map is in the pictured church, La Mision de San Ignacio in the town of San Ignacio, Baja California Sur, Mexico.
MapsintheWild Missions of Mexico
-
sur GeoSolutions: GeoSolutions Presenting at UN Maps Conference 2024
Publié: 14 May 2024, 8:04pm CEST
You must be logged into the site to view this content.
-
sur Oslandia: (Fr) Direction de la Sûreté SNCF x accompagnement QGIS et QGIS Server
Publié: 14 May 2024, 3:21pm CEST
Sorry, this entry is only available in French.
-
sur Fernando Quadro: Geoprocessamento e IA no combate à dengue
Publié: 14 May 2024, 2:00pm CEST
Um software capaz de identificar, a partir de imagens aéreas, caixas d’água sobre telhados ou lajes e piscinas em áreas abertas foi desenvolvido por pesquisadores brasileiros com o auxílio de ferramentas de Inteligência Artificial. A proposta é usar esse tipo de imagem como indicador de zonas especialmente vulneráveis a infestações do mosquito Aedes aegypti, transmissor de doenças como dengue, zika e chikungunya. Além disso, a estratégia desponta como potencial alternativa para um mapeamento socioeconômico dinâmico das cidades – um ganho para diferentes políticas públicas.
A pesquisa, apoiada pela Fapesp, foi conduzida por profissionais da USP, da Universidade Federal de Minas Gerais (UFMG) e da Superintendência de Controle de Endemias (Sucen) da Secretaria de Estado da Saúde de São Paulo.
Entre outras coisas, o grupo almeja incorporar outros elementos para serem detectados nas imagens e quantificar as taxas reais de infestação do Aedes aegypti em uma dada região para refinar e validar o modelo. “Nós esperamos criar um fluxograma que possa ser aplicado em diferentes cidades para encontrar áreas de risco sem a necessidade de visitas domiciliares, prática que gasta muito tempo e dinheiro público”.
Apesar de as fotos aéreas de Campinas terem sido obtidas com um drone, espera-se que, no futuro, a estratégia testada nessa pesquisa recorra apenas às imagens de satélite.
No estudo em Belo Horizonte, as imagens de satélite foram empregadas com sucesso – elas precisam de alta resolução para que o computador consiga identificar os padrões.
Embora esse tipo de metodologia pareça custoso, ele gera uma potencial economia ao dispensar a necessidade de visitas presenciais para mapear, casa por casa, áreas suscetíveis à dengue. Em vez disso, os agentes de saúde aproveitariam as informações obtidas remotamente – e processadas com a Inteligência Artificial – para se dirigir aos locais prioritários com mais assertividade.
-
sur Mappery: Aerial Ping Pong
Publié: 14 May 2024, 11:00am CEST

Derick Rethams spotted this beer mat in his local pub in Maida Vale. For those of you who are interested
Southern Hemisphere IPA Northern Monk Collaboration. Motueka and Wai-Iti hops bring notes of lime, stone fruits and citrus, alongside a lofty dry hopping of Eclipse and Nectaron for a vibrant mix of orange, tropical fruit and a touch of pine to finish.
[https:]MapsintheWild Aerial Ping Pong
-
sur Mappery: Stanfords Discovered
Publié: 13 May 2024, 11:00am CEST

My friend Elizabeth just discovered Stanfords store in Covent Garden, she couldn’t resist sending me a pic but asking me “do you know about this place?” really?!?
This isn’t the first time we have featured Stanfords here but it really is the place of pilgrimage for map lovers visiting London.
MapsintheWild Stanfords Discovered
-
sur OPENGIS.ch: QGIS DXF Export enhancements
Publié: 13 May 2024, 6:48am CEST
At OPENGIS.CH, we’ve been working lately on improving the DXF Export QGIS functionality for the upcoming release 3.38. In the meantime, we’ve also added nice UX enhancements for making it easier and much more powerful to use!
Let’s see a short review.
DXF Export app dialog and processing algorithm harmonizedYou can use either the app dialog or the processing algorithm, both of them offer you equivalent functionality. They are now completely harmonized!
Export settings can now be exported to an XML fileYou can now have multiple settings per project available in XML, making it possible to reuse them in your workflows or share them with colleagues.
Load DXF settings from XML. All settings are now well remembered between dialog sessionsQGIS users told us there were some dialog options that were not remembered between QGIS sessions and had to be reconfigured each time. That’s no longer the case, making it easier to reuse previous choices.
“Output layer attribute” column is now always visible in the DXF Export layer treeWe’ve made sure that you won’t miss it anymore.
 Possibility to export only the current map selection
Filter features to be exported via layer selection, and even combine this filter with the existing map extent one.

 Empty layers are no longer exported to DXF
When applying spatial filters like feature selection and map extent, you might end up with empty layers to be exported. Well, those won’t be exported anymore, producing cleaner DXF output files for you.
Possibility to override the export name of individual layersIt’s often the case where your layer names are not clean and tidy to be displayed. From now on, you can easily specify how your output DXF layers should be named, without altering your original project layers.
Override output layer names for DXF export.We’ve also fixed some minor UX bugs and annoyances that were present when exporting layers to DXF format, so that we can enjoy using it. Happy DXF exporting!
We would like to thank the Swiss QGIS user group for giving us the possibility to improve the important DXF part of QGIS
-
sur Paul Ramsey: Cancer 9
Publié: 13 May 2024, 2:00am CEST
Scanxiety.
This is where I am right now. Scanxiety.
Each stage of the cancer experience is marked by a particular set of tests, of scans.
I actually managed to get through my first set of scans surprisingly calmly. After getting diagnosed (“there’s some cancer in you”), they send you for “staging”, which is an MRI and CT scan.
These scans both involve large, Star Trek seeming machines, which make amazing noises, and in the case of the CT machine I was put through was decorated with colorful LED lights by the manufacturer (because it didn’t look whizzy enough to start with?).

I kind of internalized the initial “broad-brush” staging my GI gave me, which was that it was a tumor caught early so I would be early stage, so I didn’t worry. And it turned out, that was a good thing, since the scans didn’t contradict that story, and I didn’t worry.
The CT scan, though, did turn up a spot on my hip bone. “Oh, that might be a bone cancer, but it’s probably not.” Might be a bone cancer?!?!?
How do you figure out if you have “a bone cancer, but it’s probably not”? Another cool scan, a nuclear scan, involving being injected with radioactive dye (frankly, the coolest scan I have had so far) and run through another futuristic machine.
This time, I really sweated out the week between the scan being done and the radiology coming back. And… not bone cancer, as predicted. But a really tense week.
And now I’m in another of those periods. The result of my major surgery is twofold: the piece of me that hosted my original tumor is now no longer inside of me; and, the lymph nodes surrounding that piece are also outside of me.
They are both in the hands of a pathologist, who is going to tell me if there is cancer in the lymph nodes, and thus if I need even more super unpleasant attention from the medical system in the form of several courses of chemotherapy.
The potential long term side effects of the chemotherapy drugs used for colorectal cancers include permanent “peripheral neuropathy”, AKA numbness in the fingers and toes. Which could put a real crimp in my climbing and piano hobbies.

So as we get closer to getting that report, I am experiencing more and more scanxiety.
If I escape chemo, I will instead join the cohort of “no evidence of disease” (NED) patients. Not quite cured, but on a regular diet of blood work, scans, and colonoscopy, each one of which will involve another trip to scanxiety town. Because “it has come back” starts as a pretty decent probability, and takes several years to diminish to something safely unlikely.
Yet another way that cancer is a psychological experience as well as a physical one.
Talk to you again soon, inshalla.
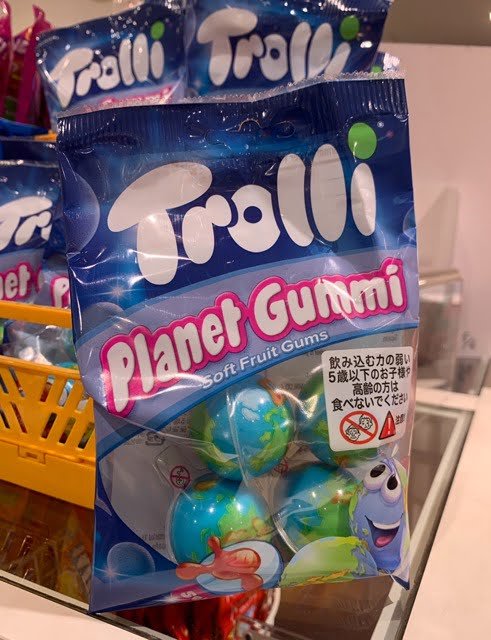

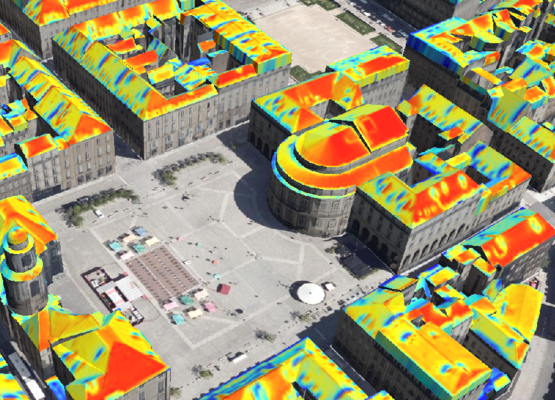
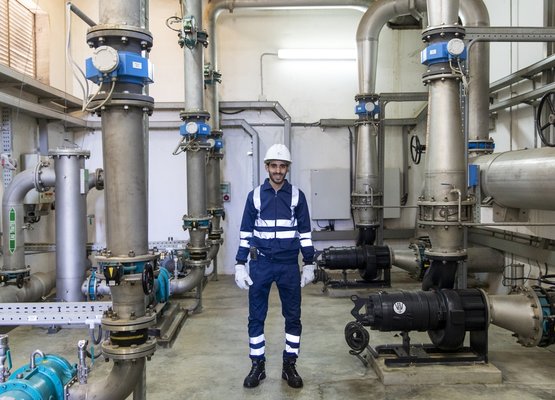