
Un Planet est un site Web dynamique qui agrège le plus souvent sur une seule page, le contenu de notes, d'articles ou de billets publiés sur des blogs ou sites Web afin d'accentuer leur visibilité et de faire ressortir des contenus pertinents aux multiples formats (texte, audio, vidéo, Podcast). C'est un agrégateur de flux RSS. Il s'apparente à un portail web.
Vous pouvez lire le billet sur le blog La Minute pour plus d'informations sur les RSS !
Vous pouvez lire le billet sur le blog La Minute pour plus d'informations sur les RSS !
Canaux
4770 éléments (3 non lus) dans 55 canaux
-
 Cybergeo
-
Revue Internationale de Géomatique (RIG)
-
SIGMAG & SIGTV.FR - Un autre regard sur la géomatique
-
Mappemonde
-
Dans les algorithmes
 Du côté des éditeurs
(1 non lus)
Du côté des éditeurs
(1 non lus)
-
Imagerie Géospatiale
-
Toute l’actualité des Geoservices de l'IGN
-
arcOrama, un blog sur les SIG, ceux d ESRI en particulier (1 non lus)
-
arcOpole - Actualités du Programme
-
Géoclip, le générateur d'observatoires cartographiques
-
Blog GEOCONCEPT FR
Toile géomatique francophone
(2 non lus)
-
Géoblogs (GeoRezo.net)
-
Conseil national de l'information géolocalisée
-
 Geotribu
(1 non lus)
Geotribu
(1 non lus) -
Les cafés géographiques
-
UrbaLine (le blog d'Aline sur l'urba, la géomatique, et l'habitat)
-
Icem7
-
Séries temporelles (CESBIO)
-
Datafoncier, données pour les territoires (Cerema)
-
Cartes et figures du monde
-
SIGEA: actualités des SIG pour l'enseignement agricole
-
Data and GIS tips
-
Neogeo Technologies
(1 non lus)
-
ReLucBlog
-
L'Atelier de Cartographie
-
My Geomatic
-
archeomatic (le blog d'un archéologue à l’INRAP)
-
Cartographies numériques
-
Veille cartographie
-
Makina Corpus
-
Oslandia
-
Camptocamp
-
Carnet (neo)cartographique
-
Le blog de Geomatys
-
GEOMATIQUE
-
Geomatick
-
CartONG (actualités)
Géomatique anglophone
 FR
FR
-
 1:00
1:00 PostGIS Development: PostGIS Patch Releases
sur Planet OSGeo -
11:00
Mappery: Candy Jar
sur Planet OSGeo

-
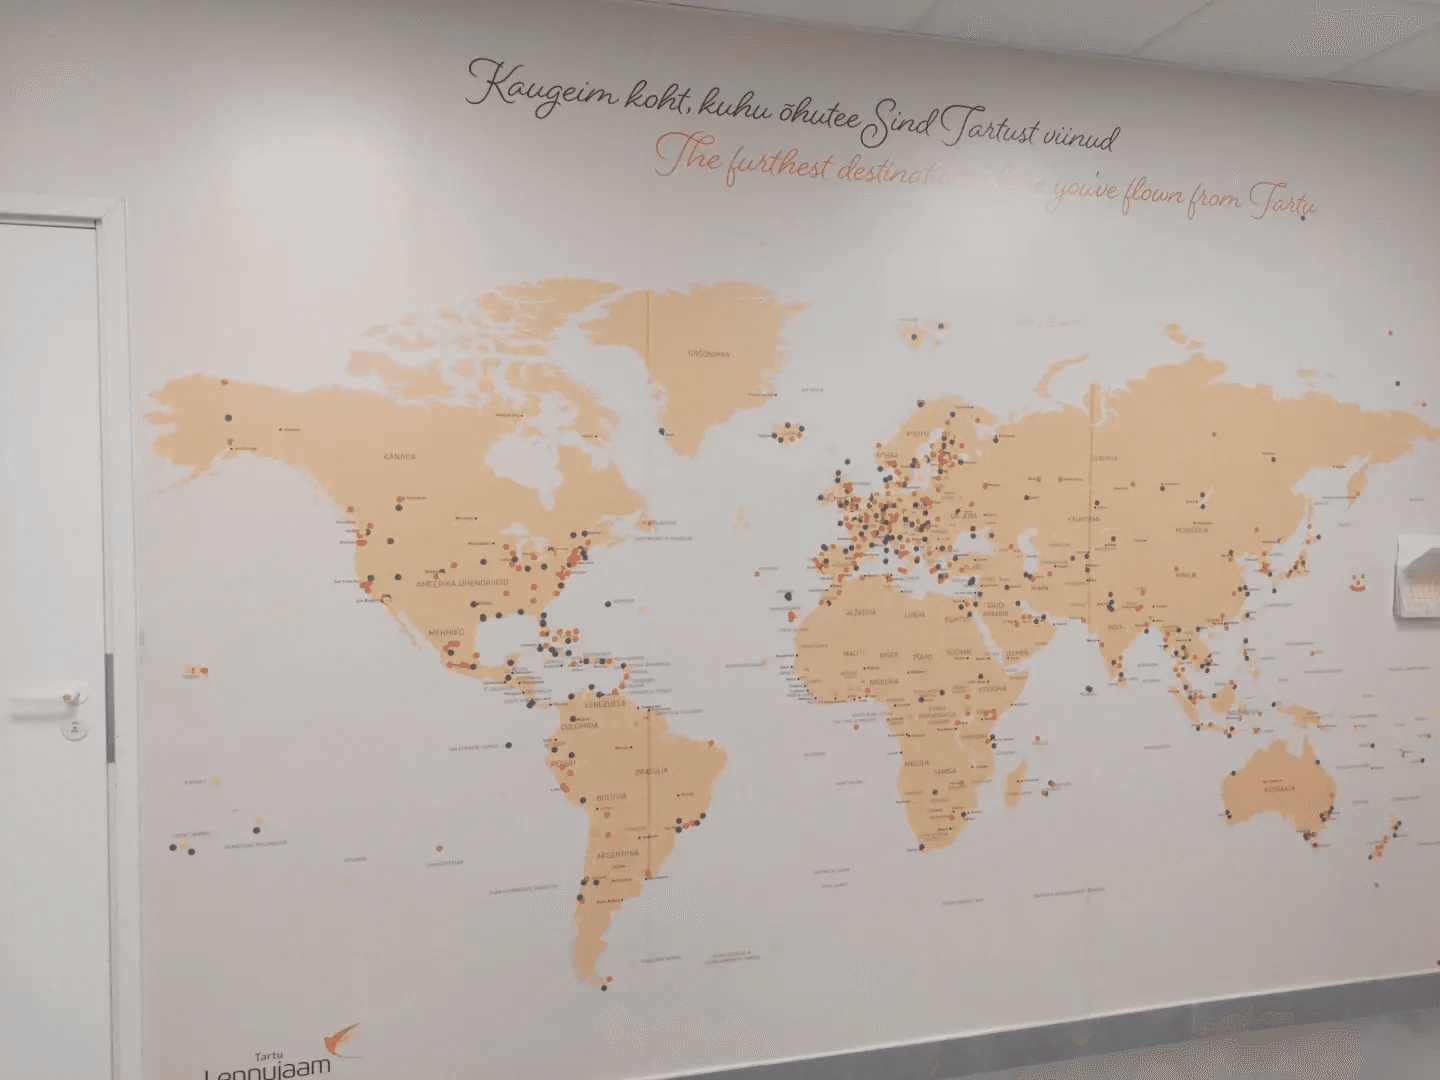
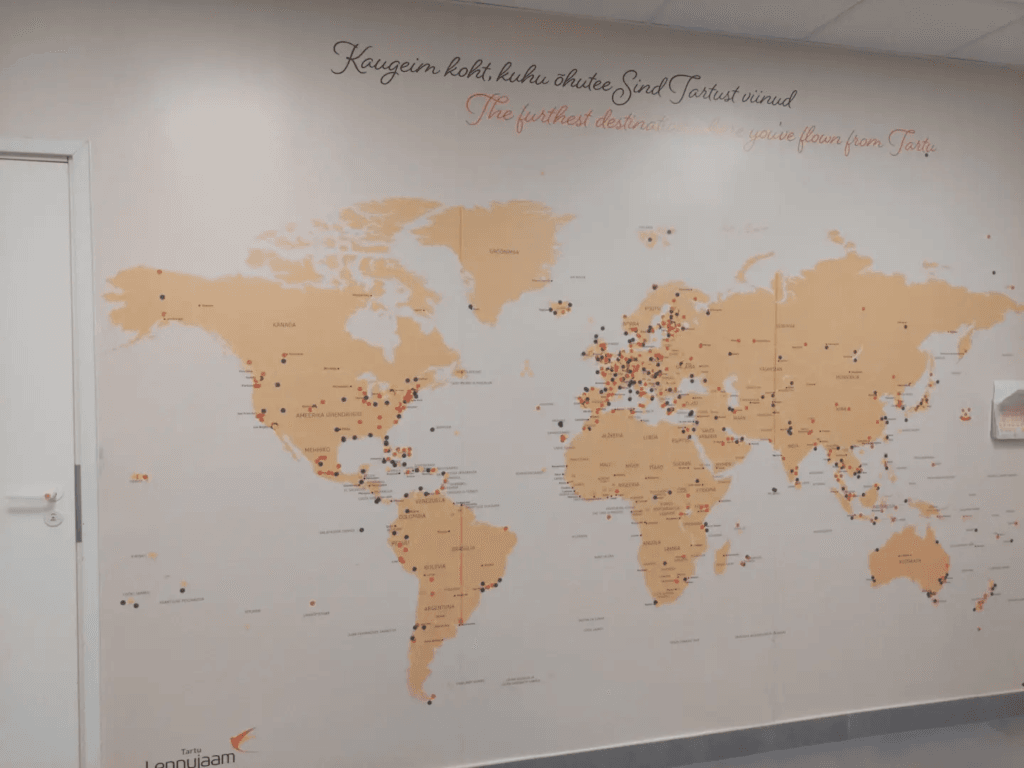
11:00
Mappery: How far have you flown from Tartu
sur Planet OSGeo -
0:22
TorchGeo: v0.6.2
sur Planet OSGeo -
11:09
GeoTools Team: GeoTools 31.5
sur Planet OSGeo
-
11:00
Mappery: Nobody Is Illegal
sur Planet OSGeo -
16:43
KAN T&IT Blog: GeoNode Cloud: Presentación oficial
sur Planet OSGeo


 ¡Ha llegado el momento! Presentamos GeoNode Cloud, la plataforma en la nube que transforma la gestión de datos geoespaciales.
 Sin necesidad de infraestructura interna.
 GeoNode Cloud te ayuda a lograr más con menos esfuerzo
 Empezá a explorar:
 -
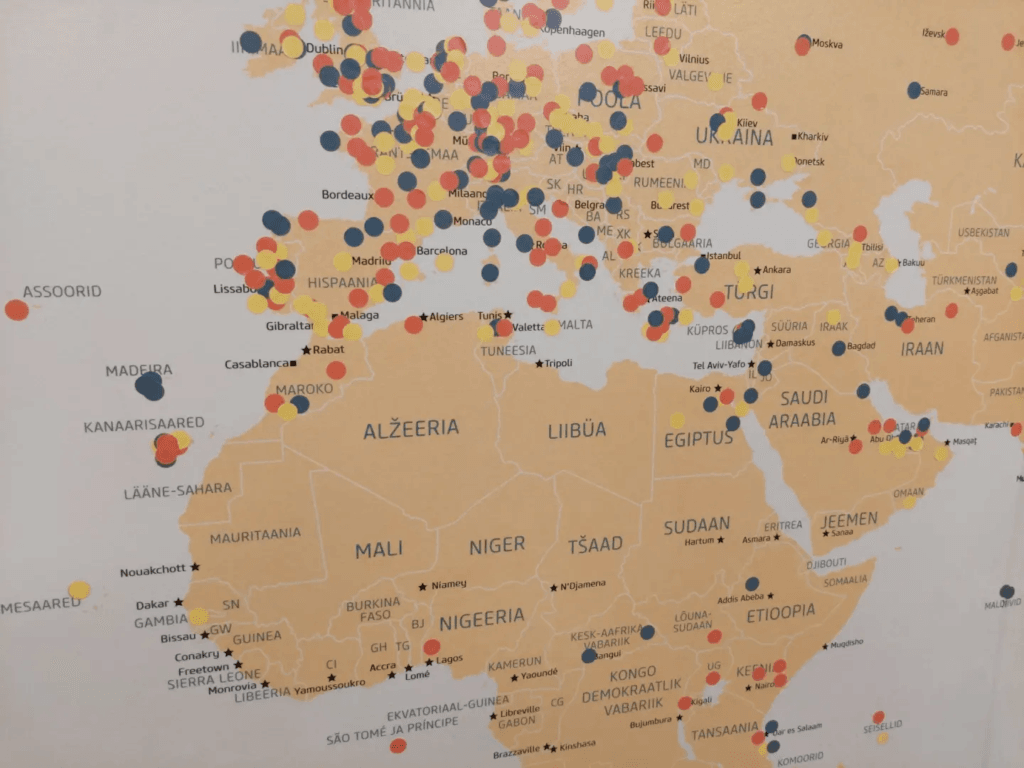
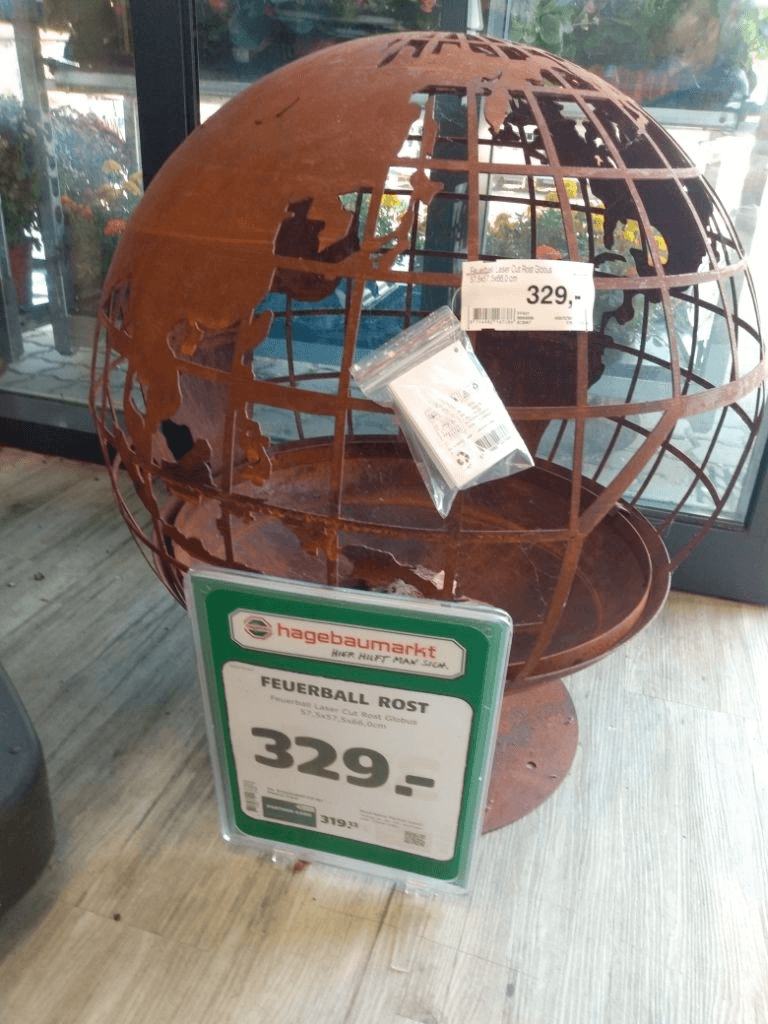
11:00
Mappery: Global Fire Pit
sur Planet OSGeo -
1:00
GeoServer Team: GeoServer 2.25.5 Release
sur Planet OSGeo
-
13:25
OSGeo Announcements: [OSGeo-Announce] pgRouting graduates OSGeo Incubation
sur Planet OSGeo -
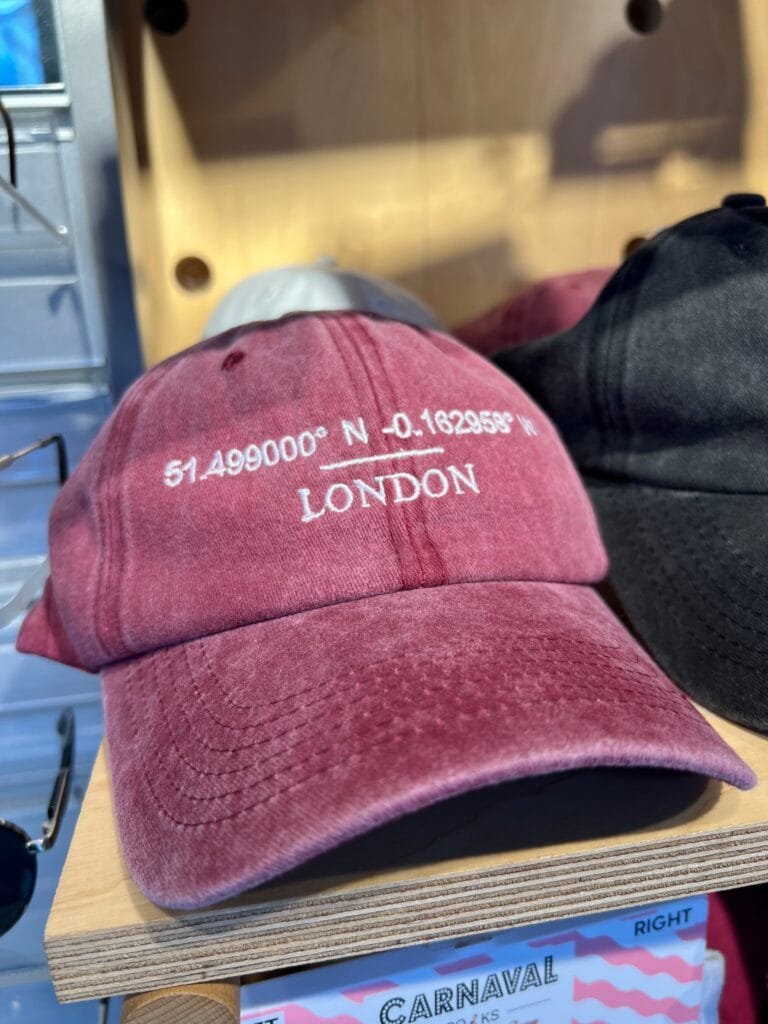
11:00
Mappery: London cap
sur Planet OSGeo -
10:59
Free and Open Source GIS Ramblings: Urban Mobility Insights with MovingPandas & CARTO in Snowflake
sur Planet OSGeo


-
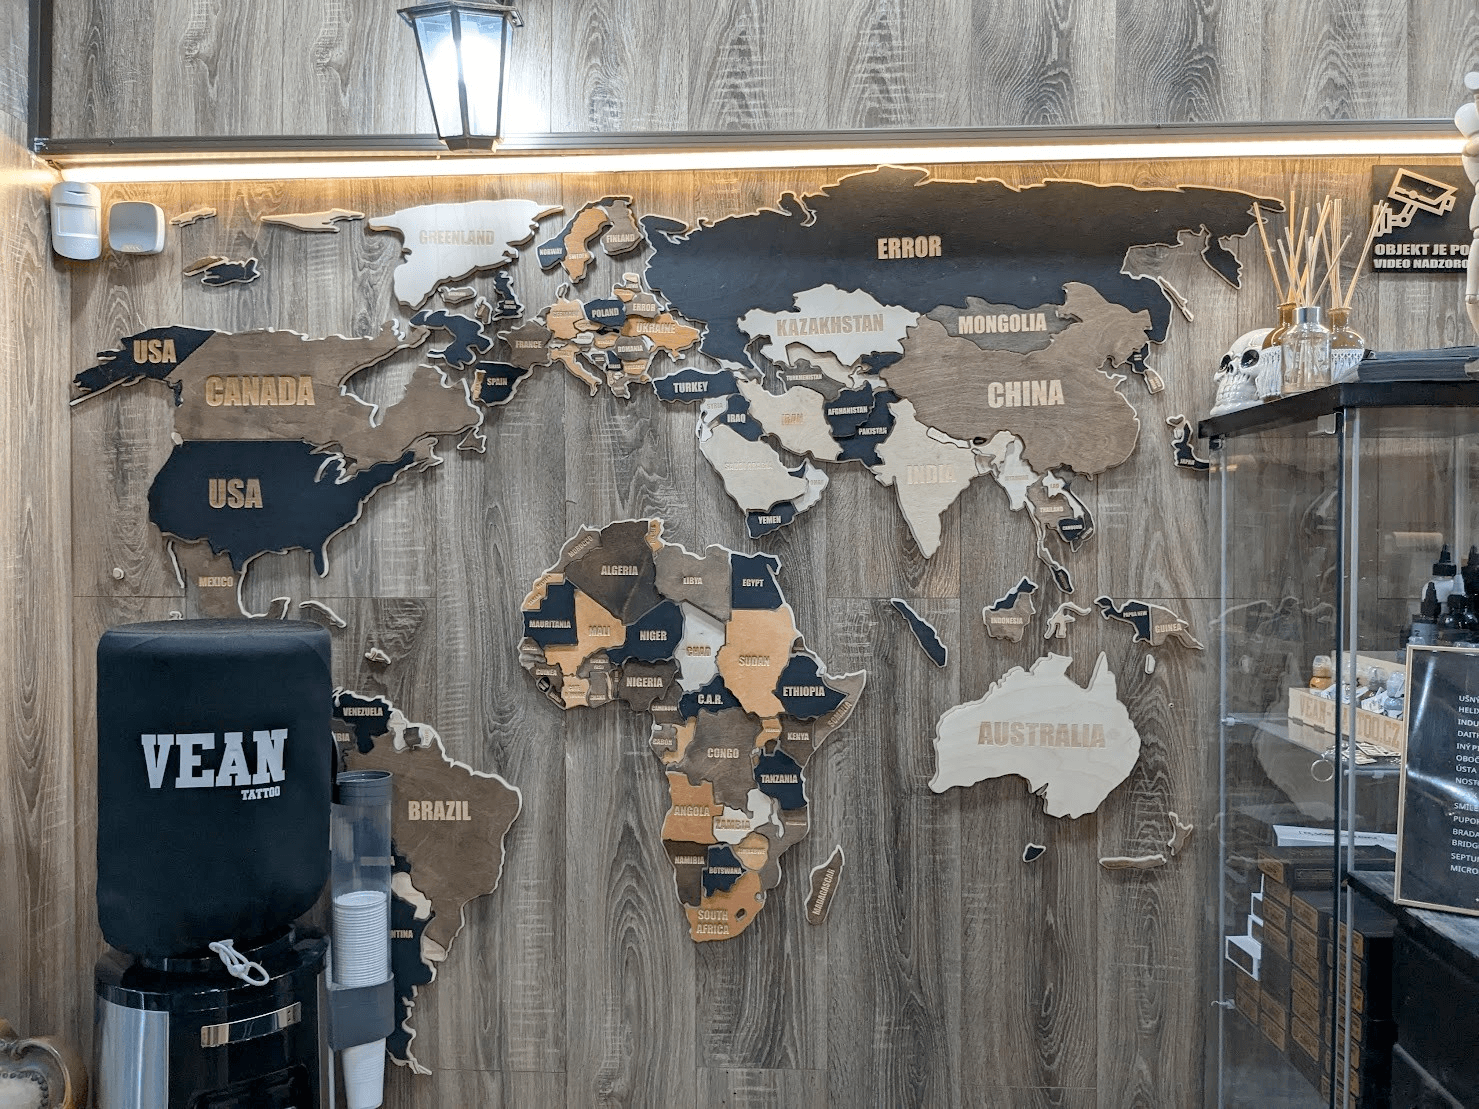
11:00
Mappery: Tattoo Shop Decor
sur Planet OSGeo -
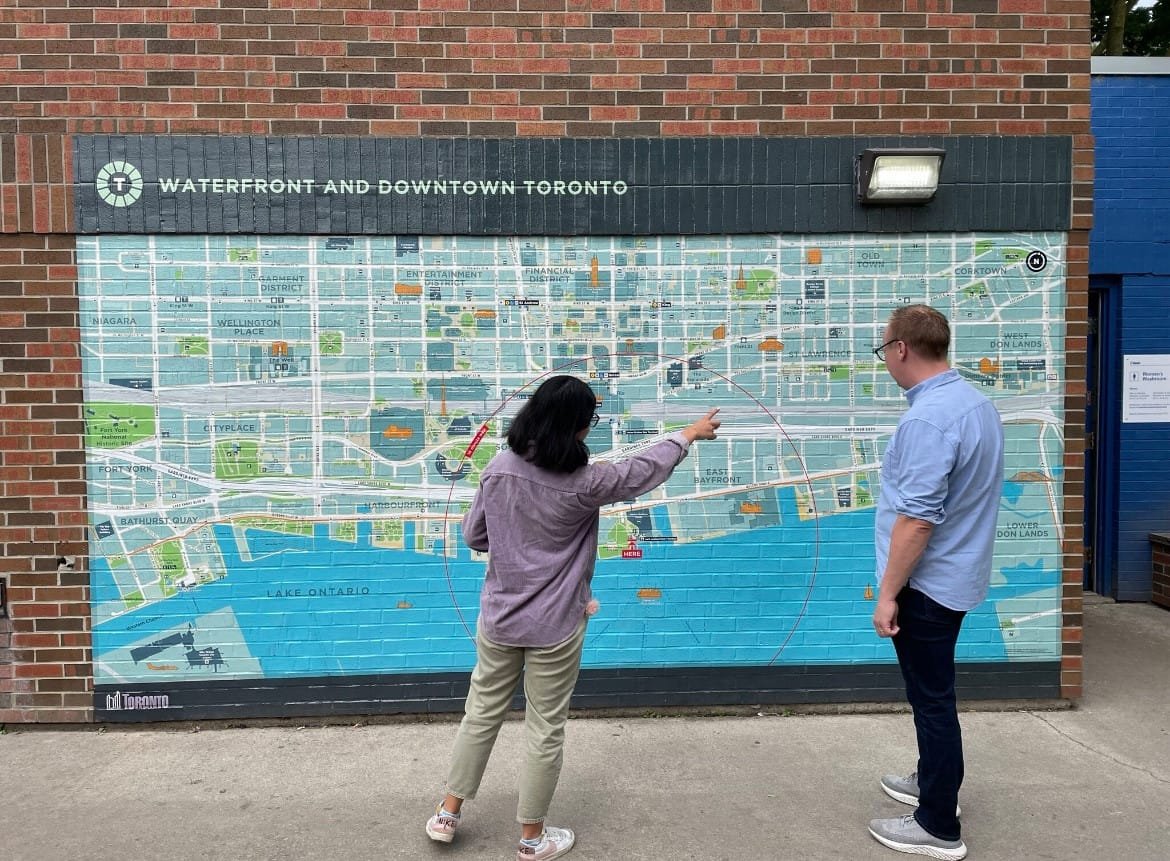
11:00
Mappery: Toronto Waterfront
sur Planet OSGeo -
4:11
BostonGIS: The bus factor problem
sur Planet OSGeo -
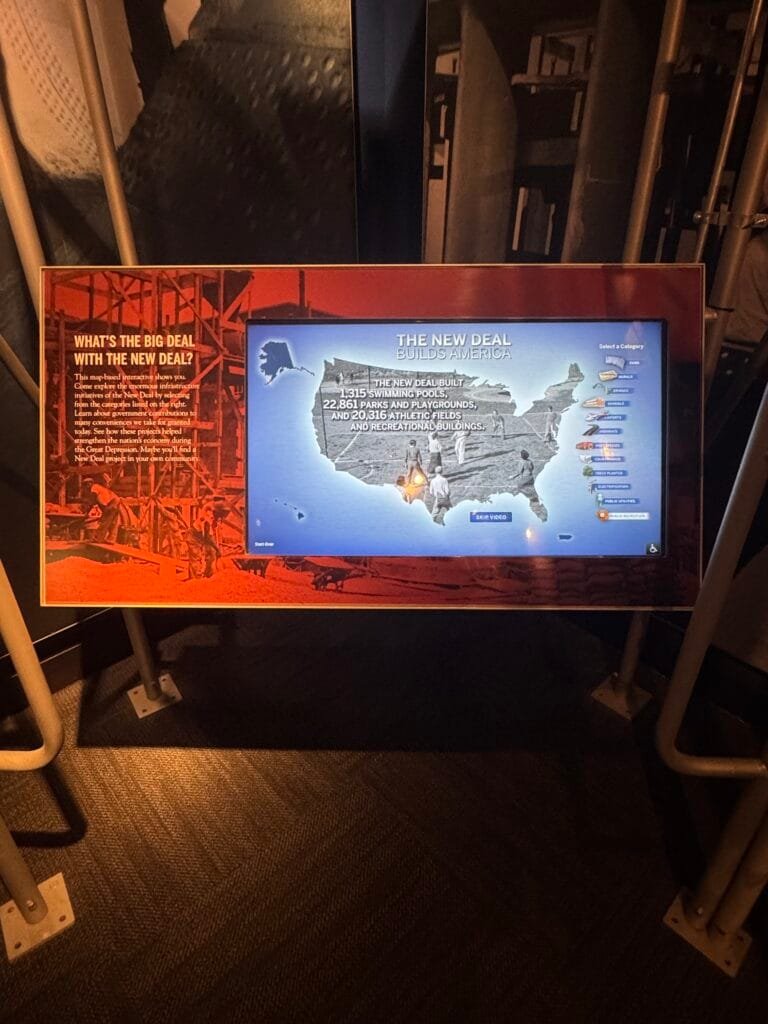
11:00
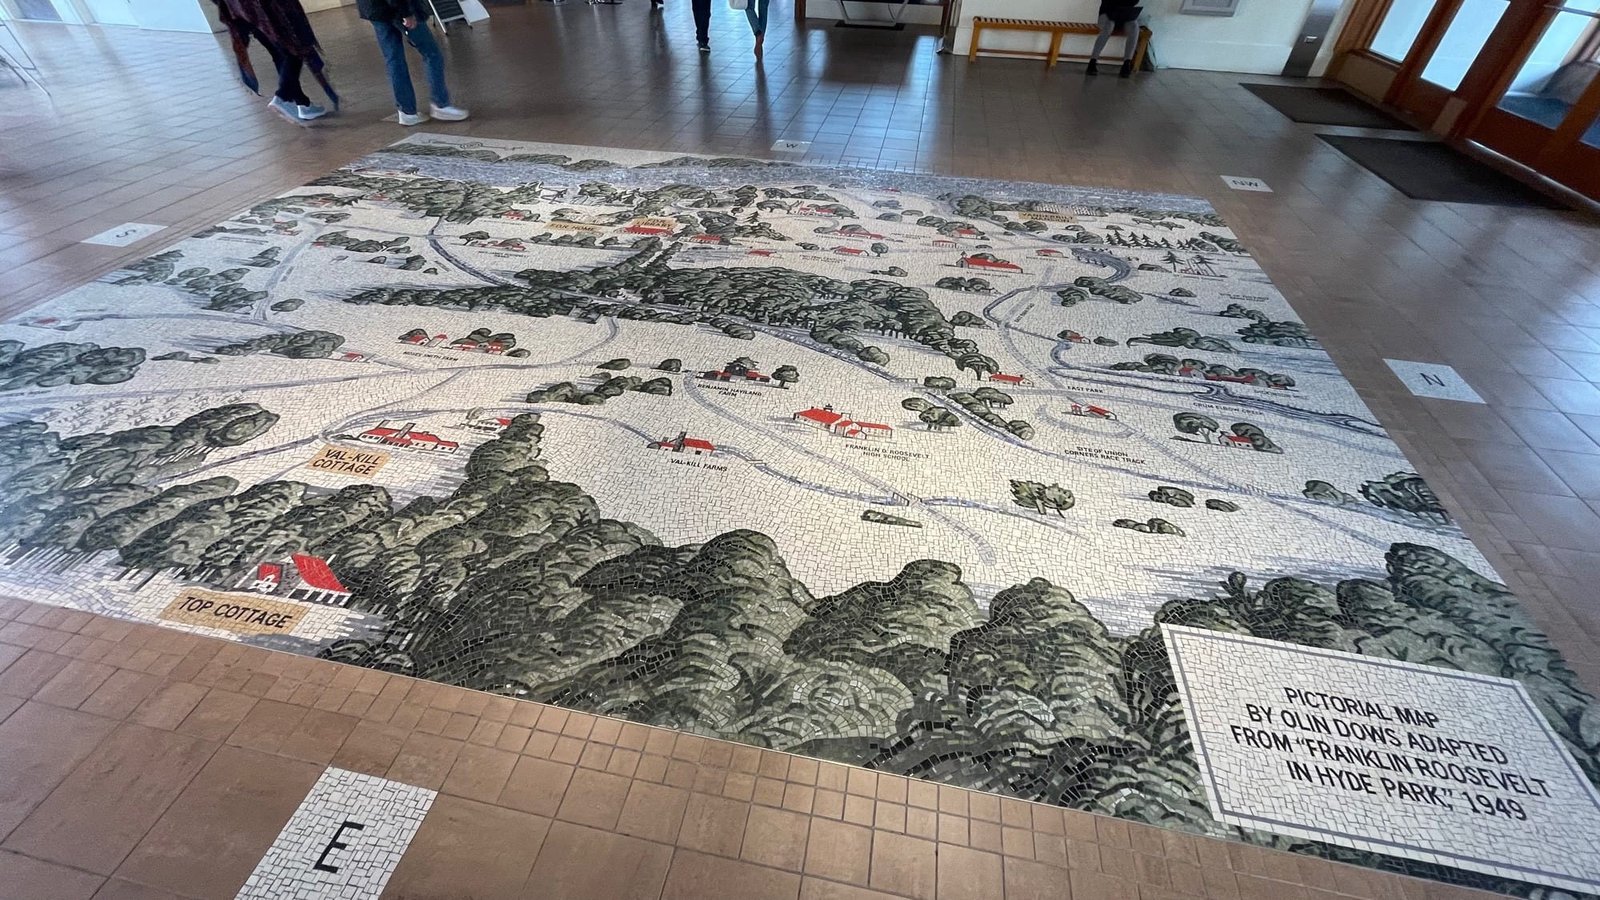
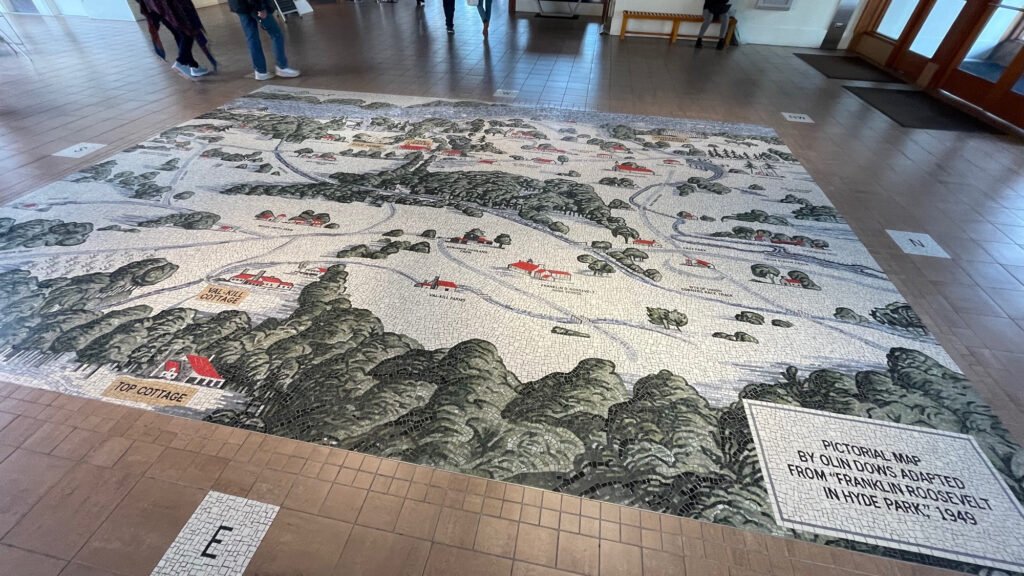
Mappery: The New Deal
sur Planet OSGeo


-
10:24
QGIS Blog: Plugin Update – November, 2024
sur Planet OSGeo -
13:08
gvSIG Batoví: Añadimos una nueva publicación para consulta
sur Planet OSGeo -
13:01
SIG Libre Uruguay: Nuevo libro: «La amenaza mundial de la sequía: tendencias de aridez a nivel regional y mundial, y proyecciones futuras»
sur Planet OSGeo


-
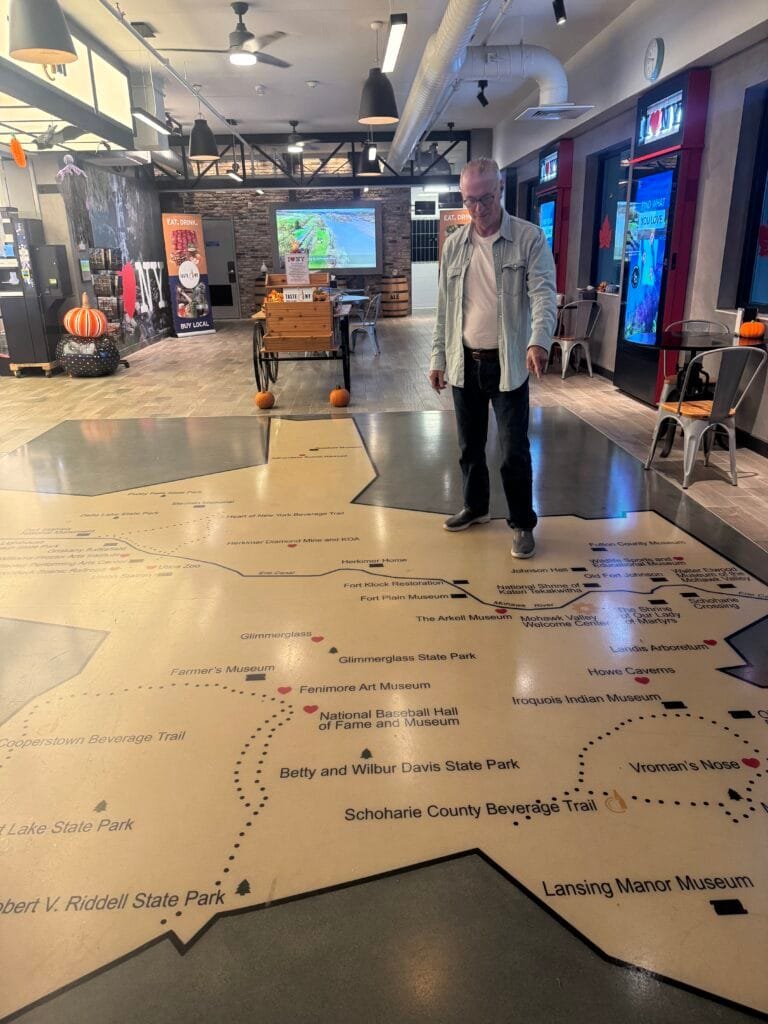
11:00
Mappery: Standing on New York State
sur Planet OSGeo -
15:22
Le blog de Geomatys: Stages 2025 !
sur Planet OSGeo -
13:00
Fernando Quadro: WebGIS sob Medida
sur Planet OSGeo -
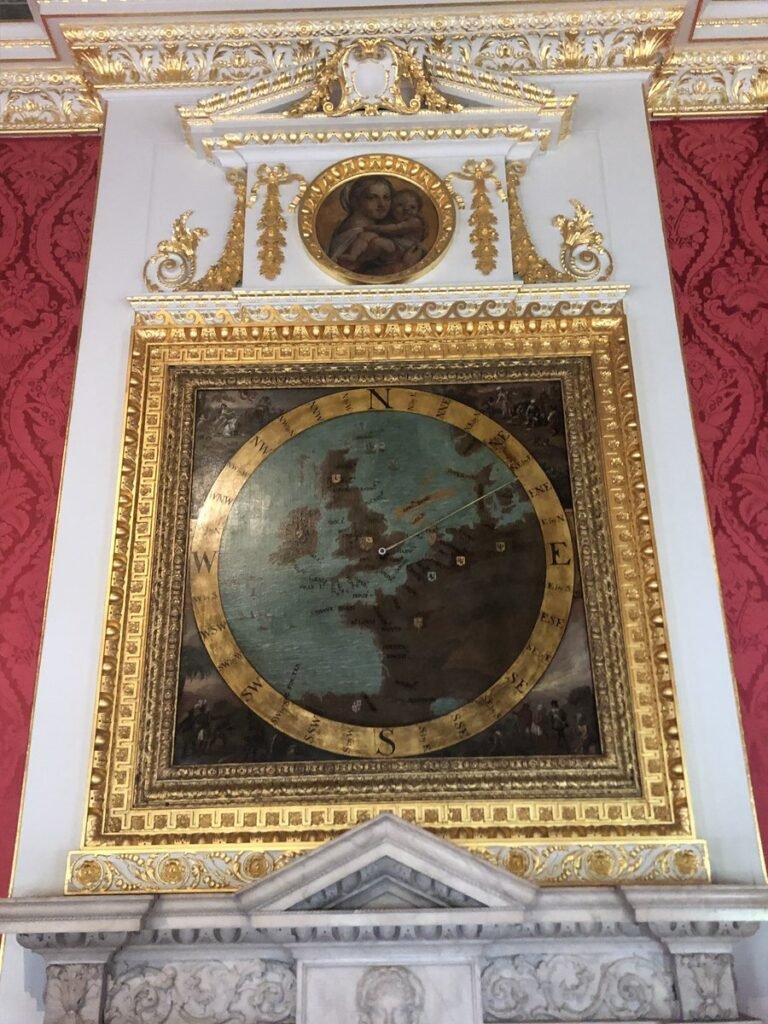
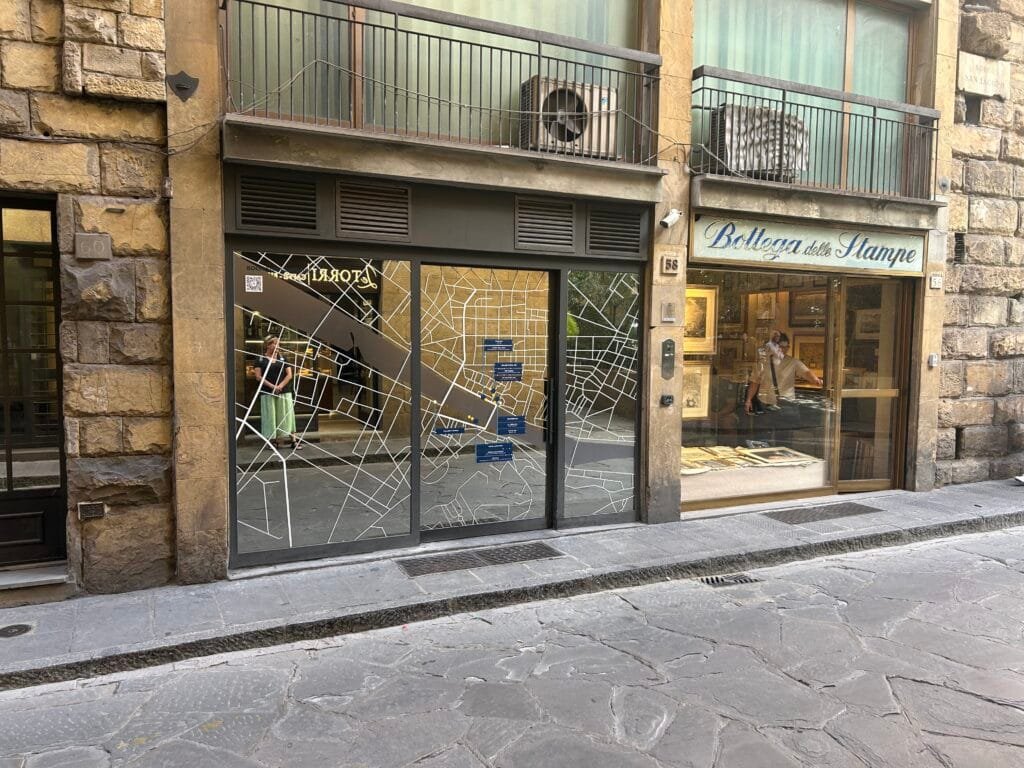
11:00
Mappery: Clock Map
sur Planet OSGeo


 Montpellier – 3 à 6 mois
 Entre mars et septembre 2025

-
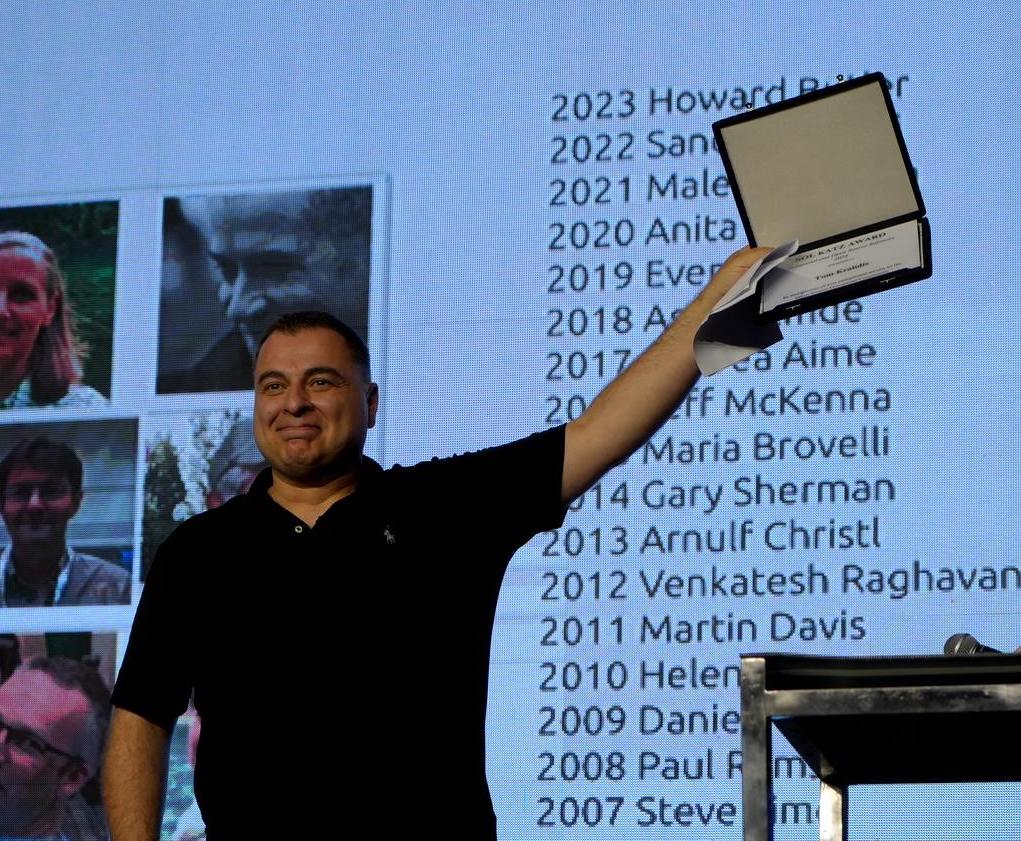
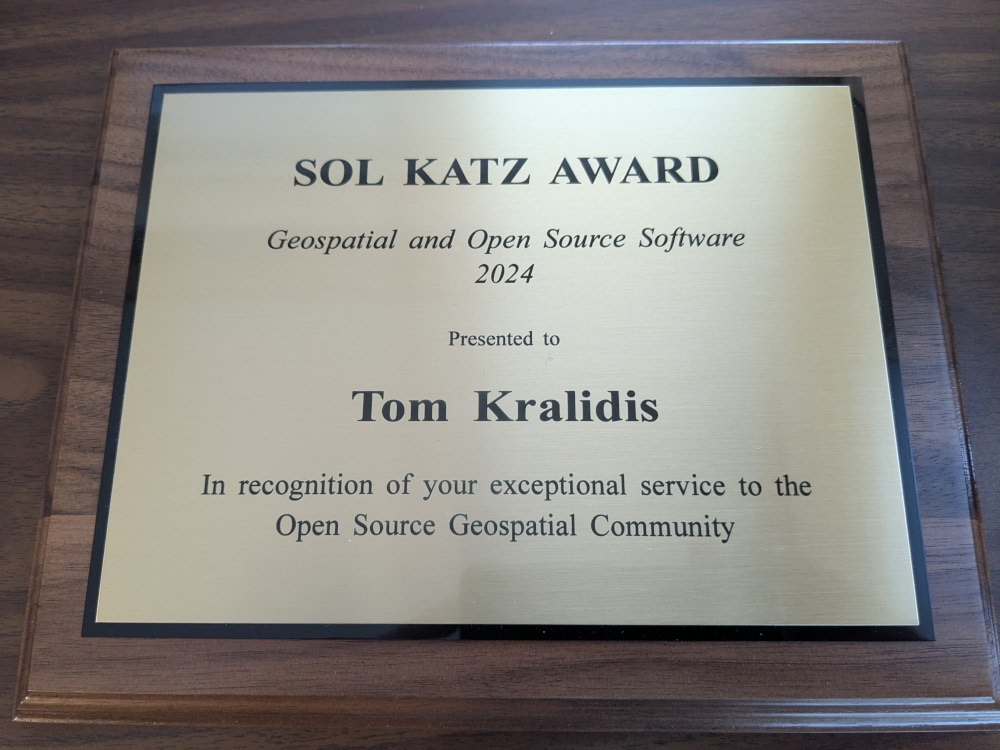
10:00
OSGeo Announcements: [OSGeo-Announce] Tom Kralidis receives the 2024 Sol Katz Award
sur Planet OSGeo -
19:52
gvSIG Batoví: 3 LIBROS ACTUALES E IMPRESCINDIBLES
sur Planet OSGeo -
13:00
Fernando Quadro: 12 características de um Profissional GIS
sur Planet OSGeo

-
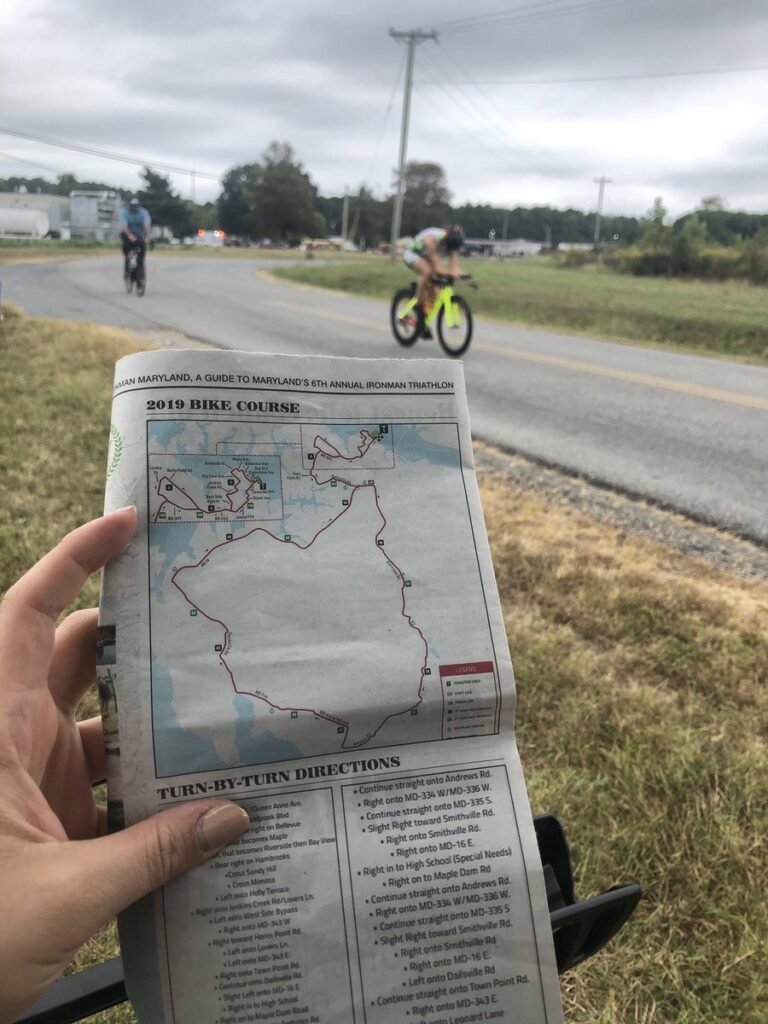
11:00
Mappery: Bike Race
sur Planet OSGeo -
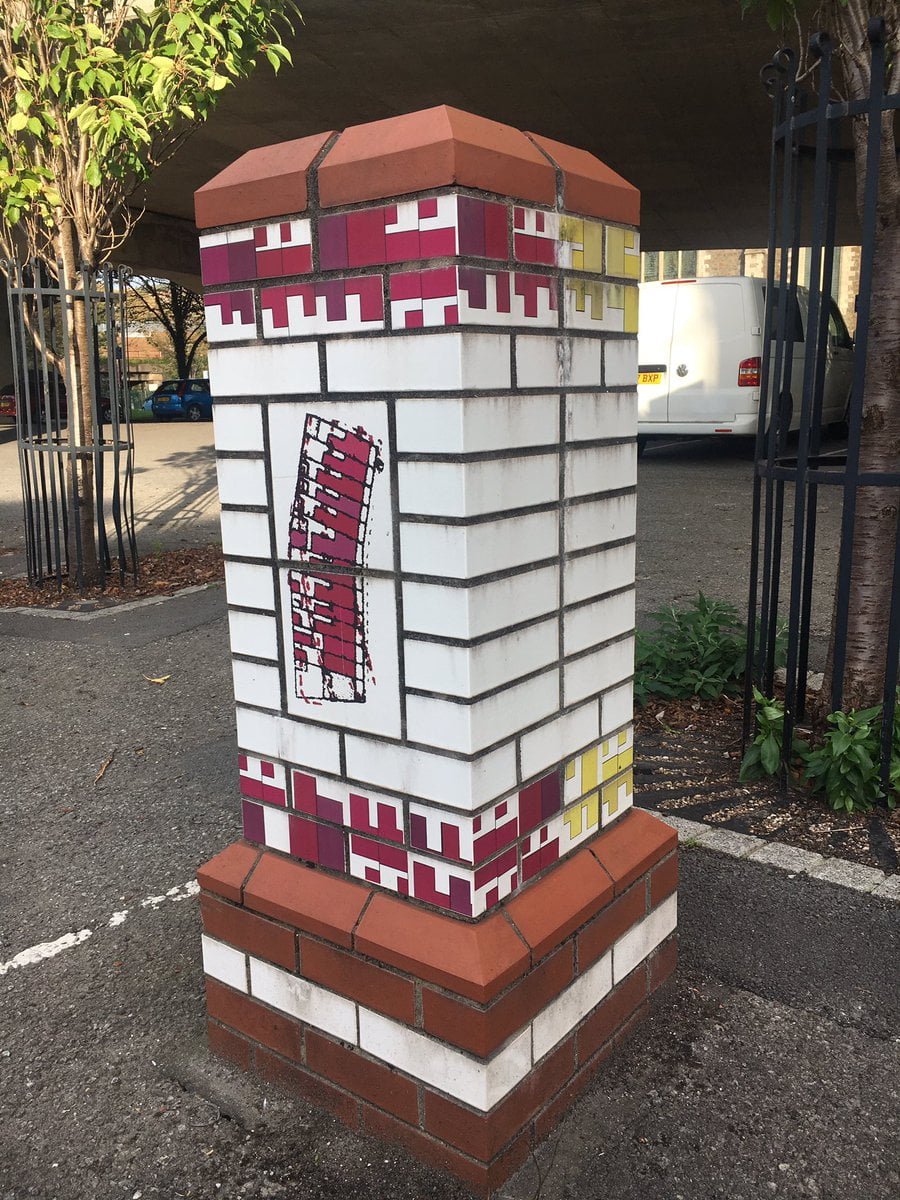
11:00
Mappery: Aberfan
sur Planet OSGeo -
4:55
Sean Gillies: Late fall biking
sur Planet OSGeo -
21:53
Sean Gillies: Productive running
sur Planet OSGeo


-
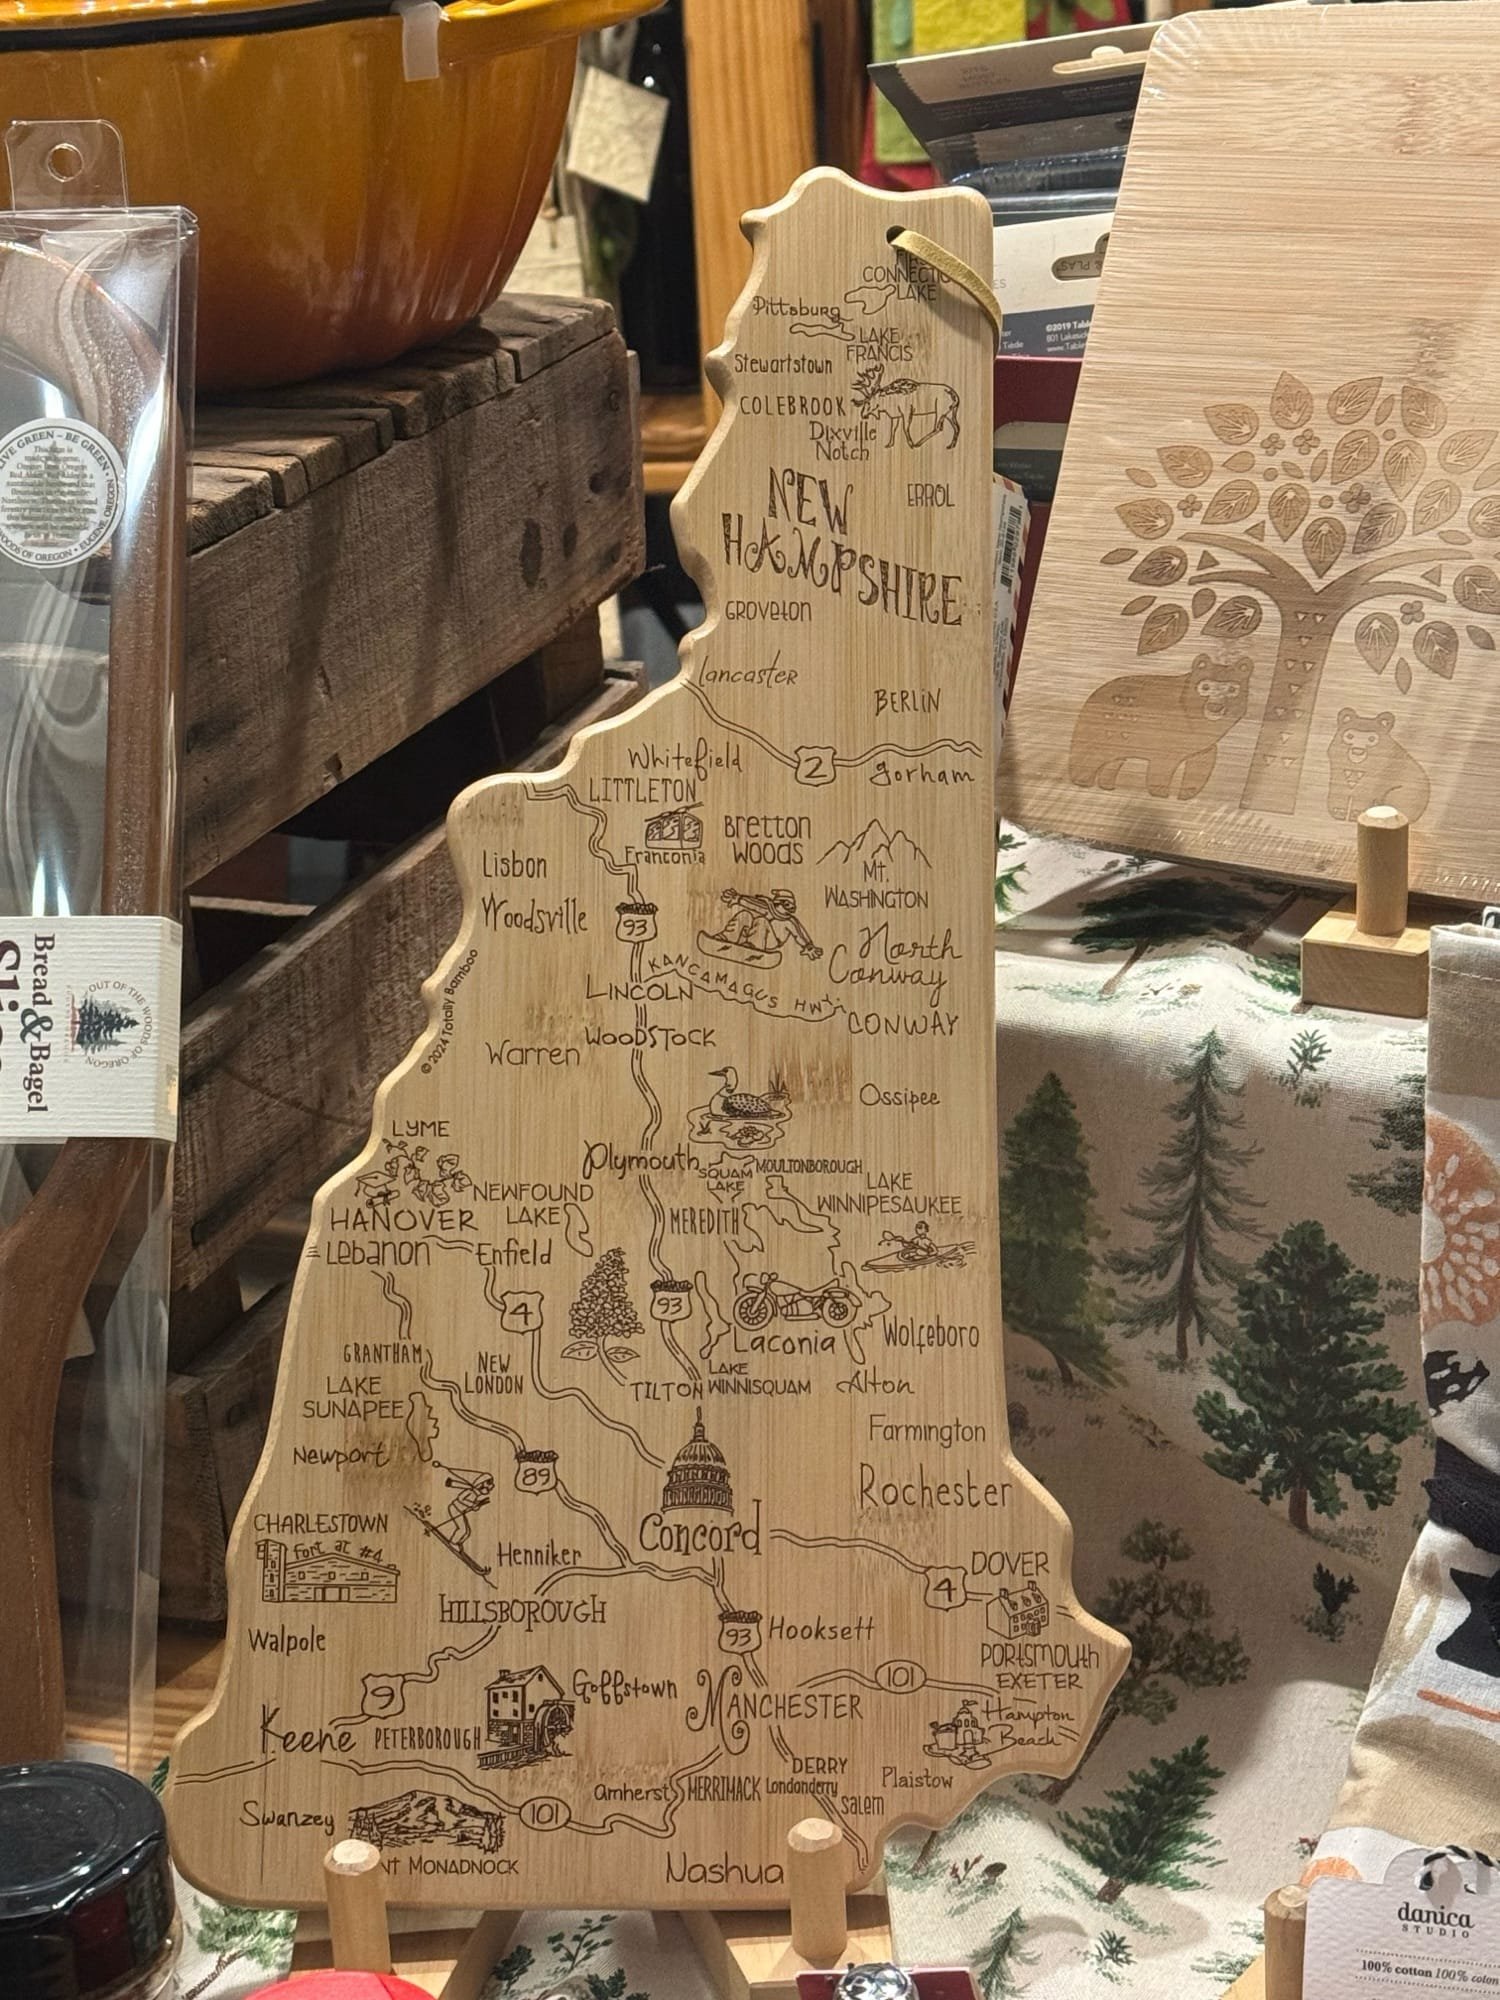
11:00
Mappery: New Hampshire – The Wooden State
sur Planet OSGeo -
17:05
SIG Libre Uruguay: 3 LIBROS ACTUALES E IMPRESCINDIBLES
sur Planet OSGeo


-
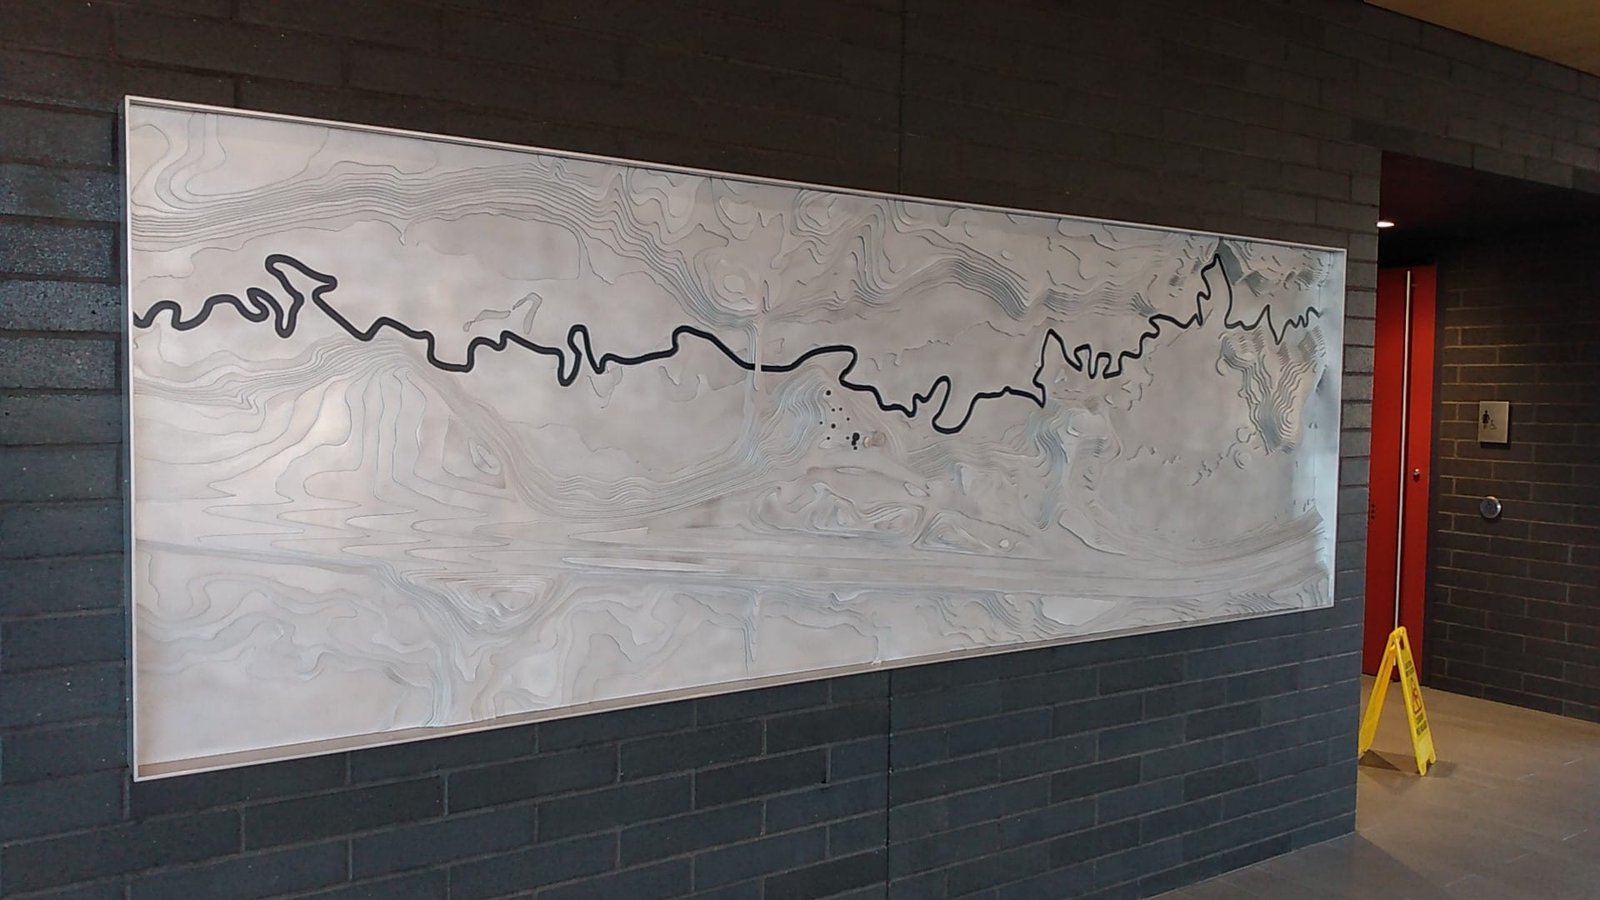
11:00
Mappery: Goose Creek
sur Planet OSGeo -
10:05
WhereGroup: Datenschutzkonforme Bildveröffentlichung: Gesichter und Nummernschilder automatisch verpixeln mit Python
sur Planet OSGeo -
1:00
SourcePole: FOSS4G 2024 Belém
sur Planet OSGeo -
13:00
Fernando Quadro: 10 aplicações GIS em Energias Renováveis
sur Planet OSGeo


-
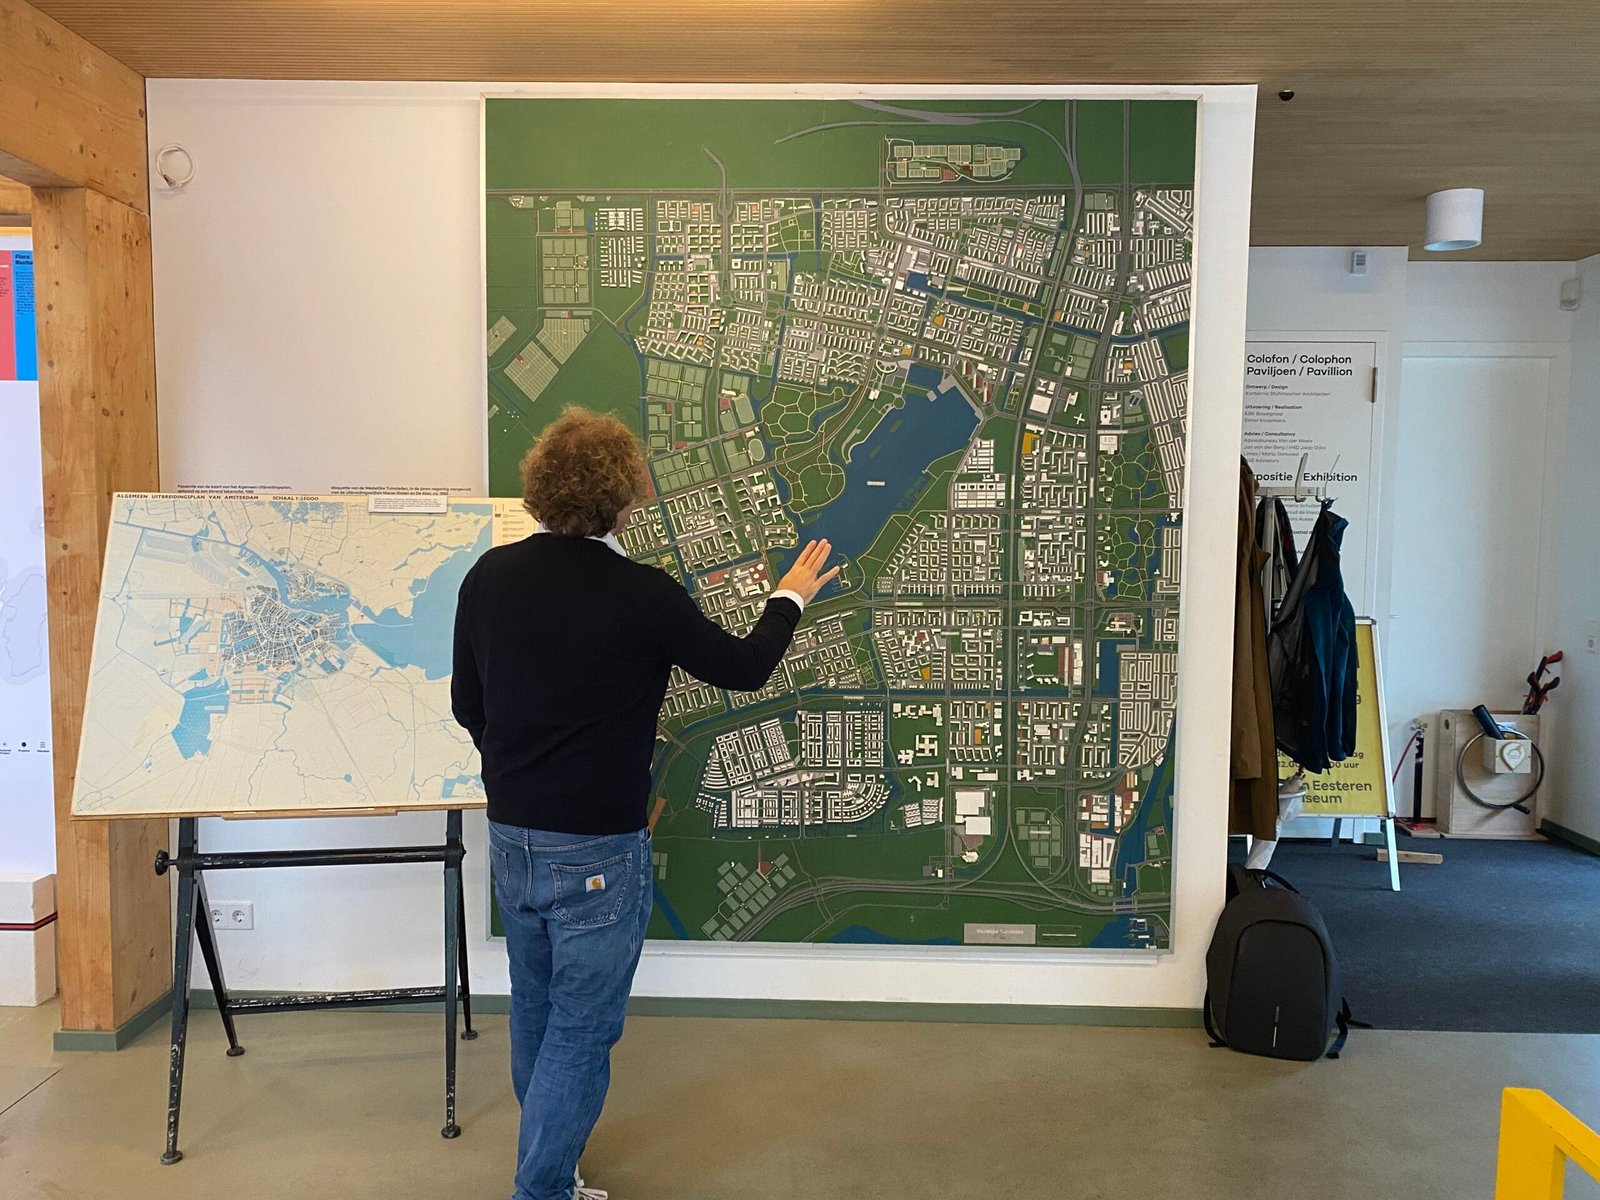
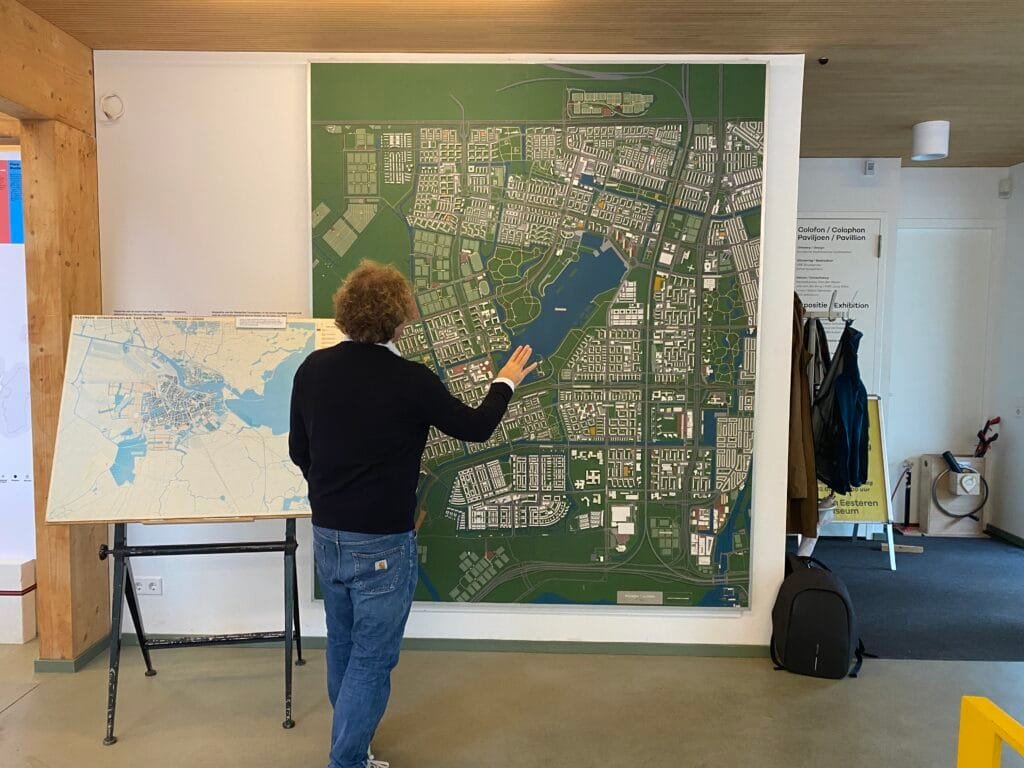
11:00
Mappery: van Eesteren
sur Planet OSGeo -
9:55
OTB Team: Look back on the OTB Users Days 2024
sur Planet OSGeo
-
13:00
Fernando Quadro: WebGIS para monitoramento de Terras Indígenas
sur Planet OSGeo -
11:00
Mappery: Cité de l’espace
sur Planet OSGeo -
1:00
Camptocamp: Camptocamp and IGN Partnership Wins 2024 Acteurs du Libre Award for Best Public-Private Collaboration
sur Planet OSGeo -
19:18
Fernando Quadro: Segredos para desenvolver seu WebGIS
sur Planet OSGeo

 Pular direto para a codificação sem um roteiro
-
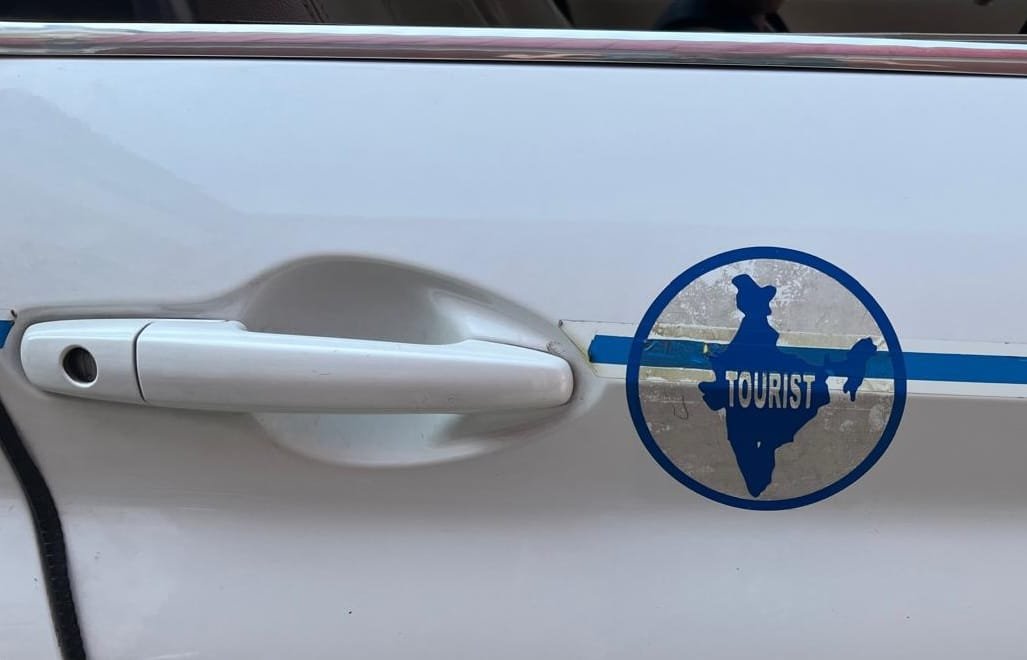
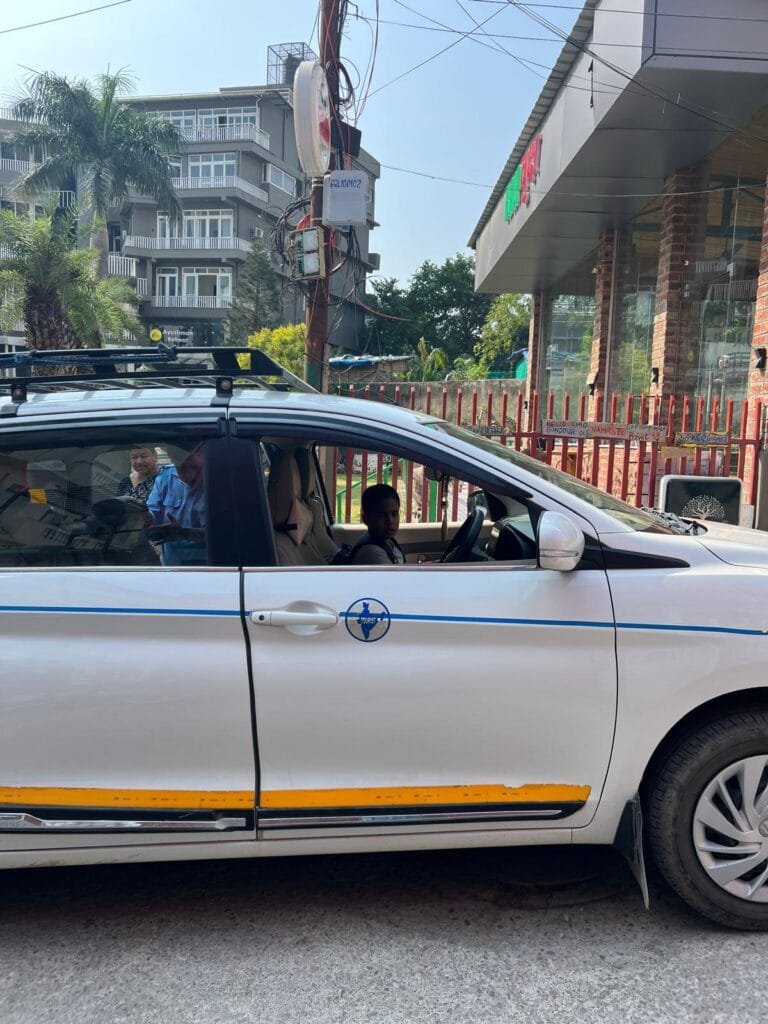
10:00
Mappery: Indian Taxi
sur Planet OSGeo -
1:00
Camptocamp: Exploring Innovation: Camptocamp at Open Source Experience 2024
sur Planet OSGeo -
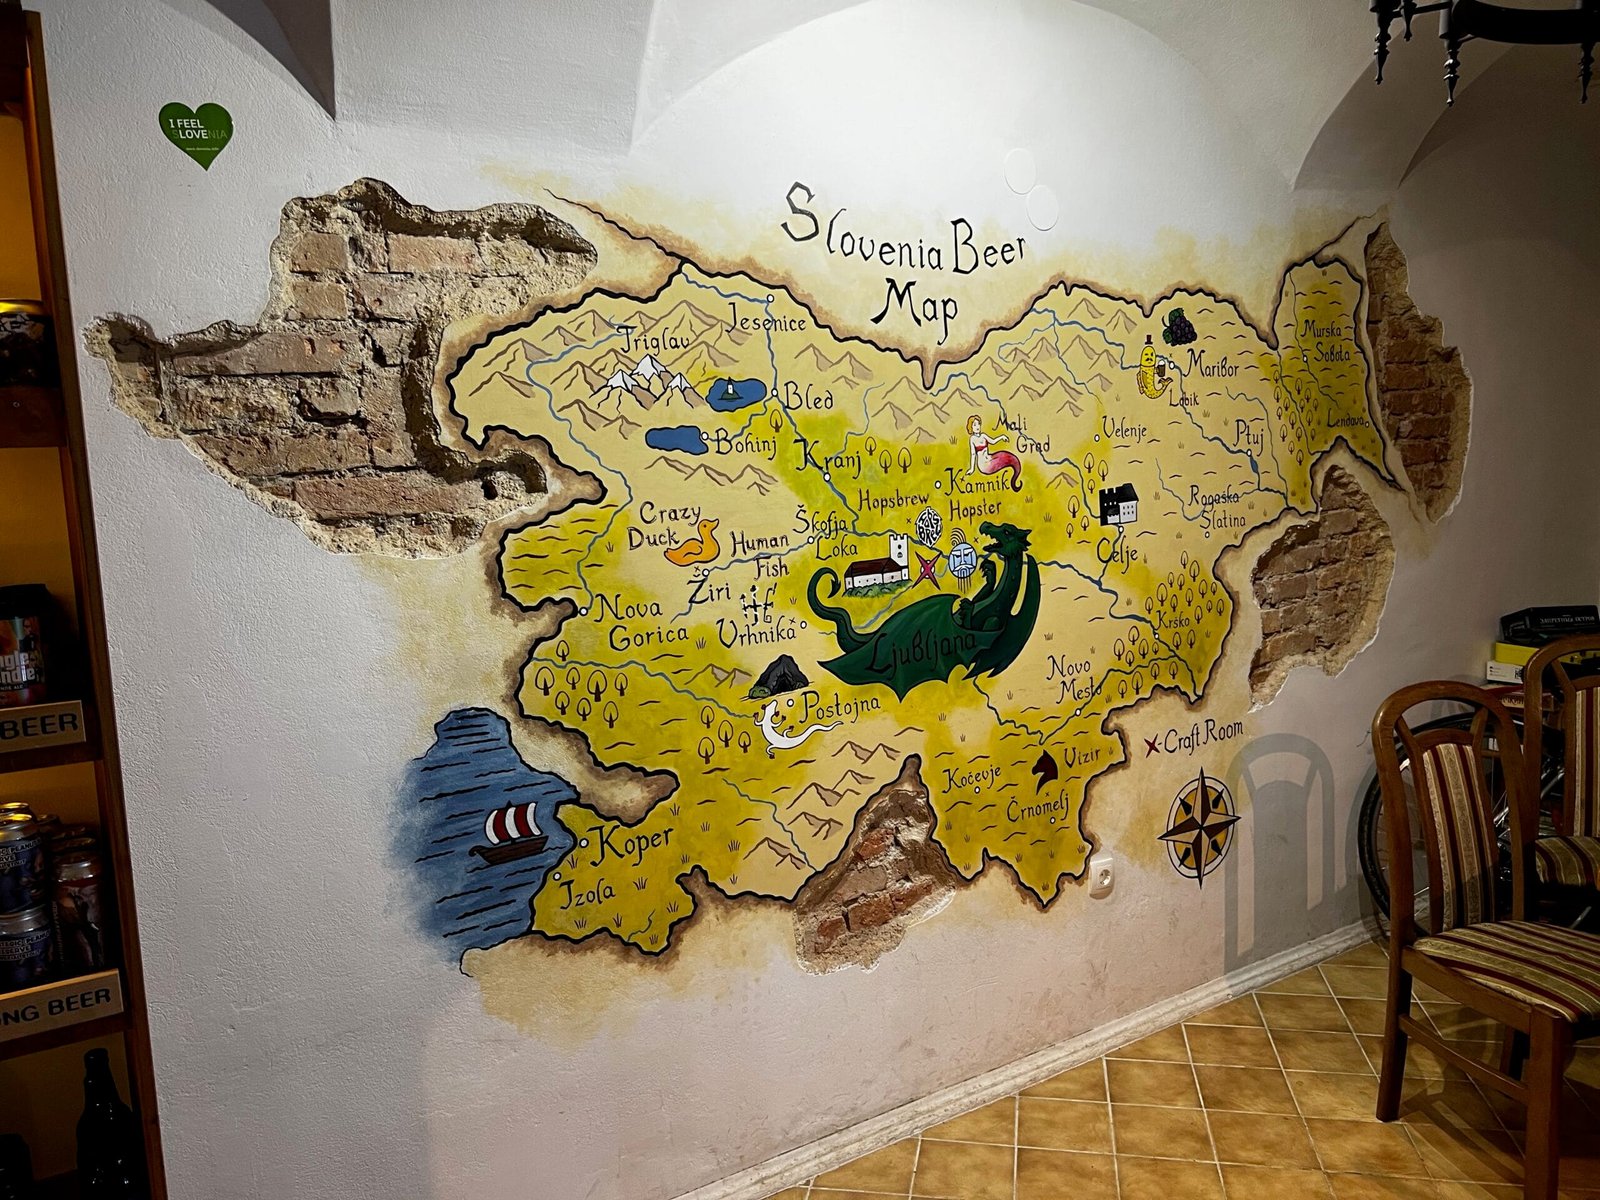
11:00
Mappery: Slovenia beer map
sur Planet OSGeo


-
23:59
BostonGIS: PostGIS Day 2024 Summary
sur Planet OSGeo -
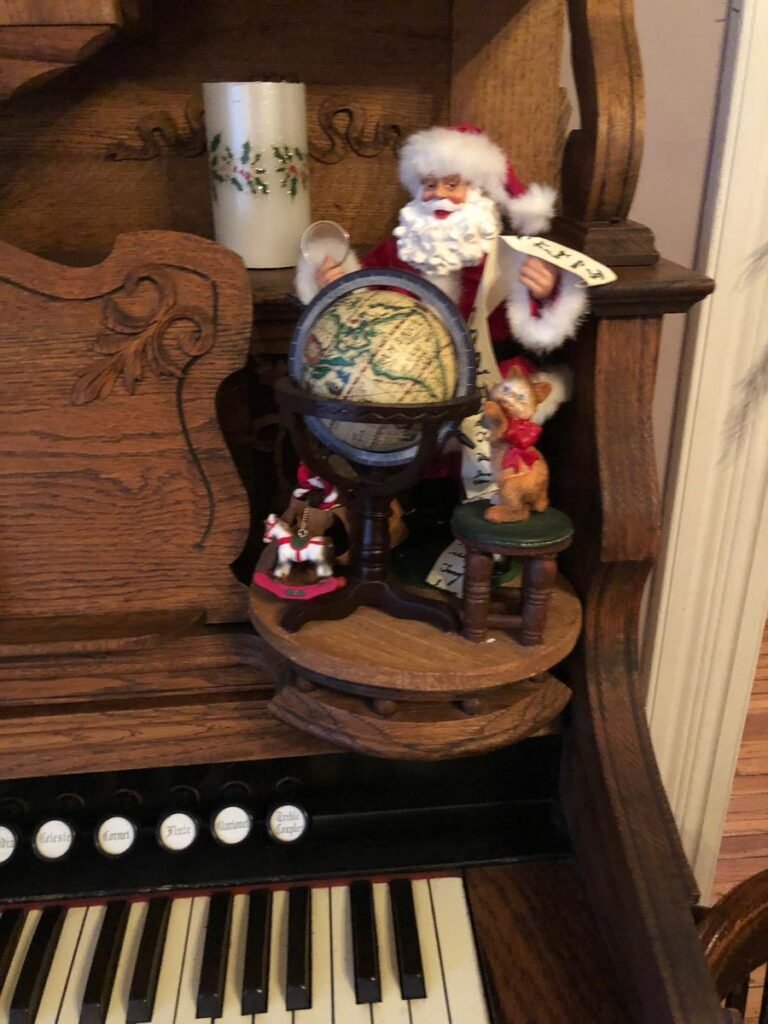
10:00
Mappery: Christmas season begins
sur Planet OSGeo -
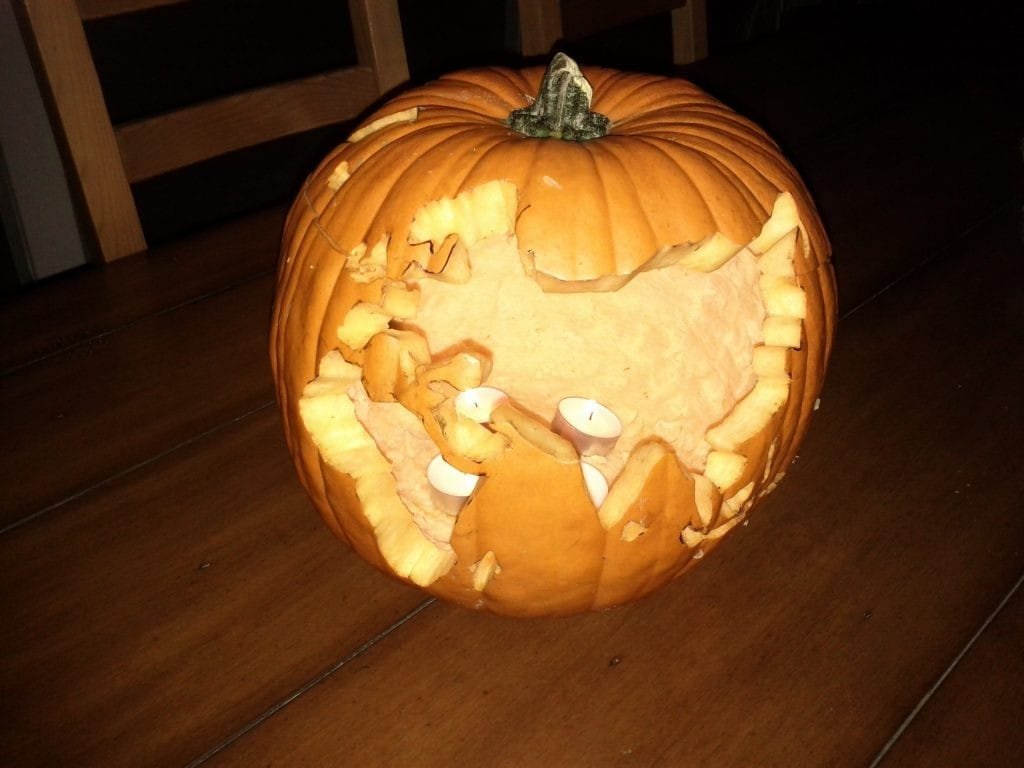
11:00
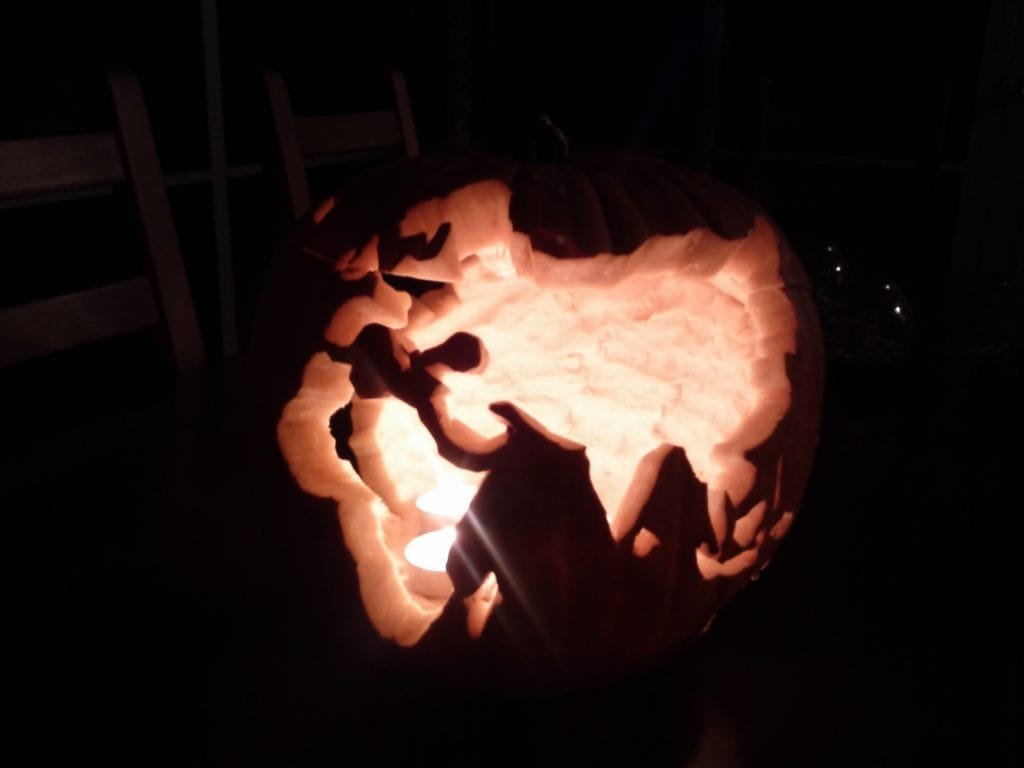
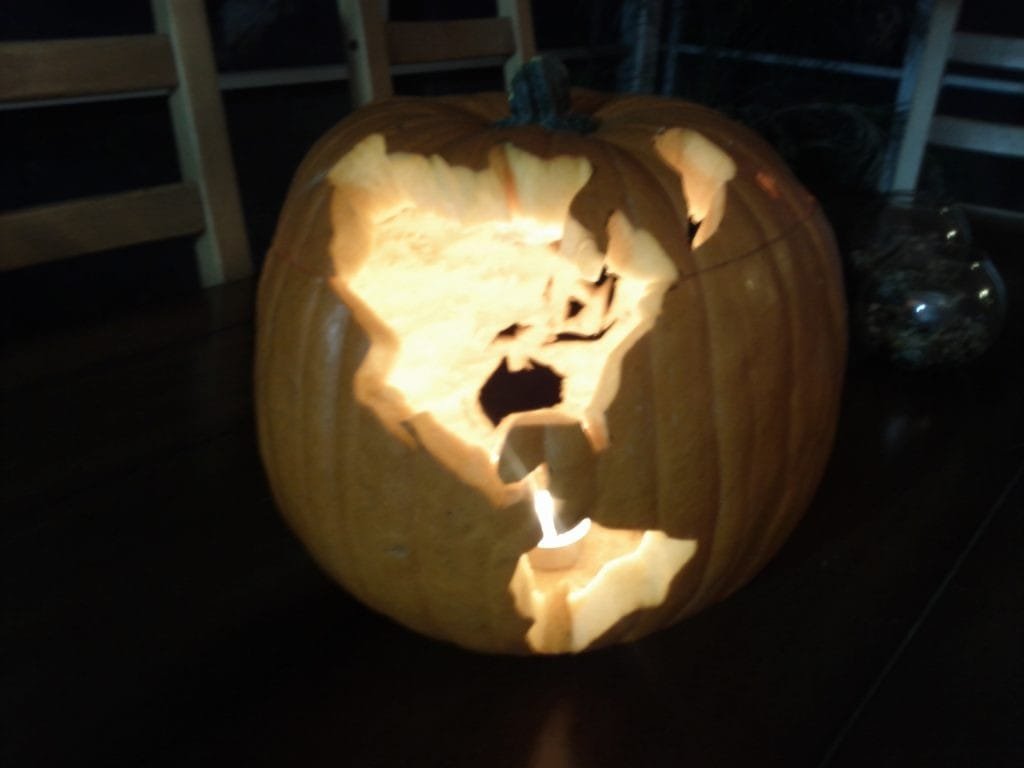
Mappery: Wait, is it Halloween?
sur Planet OSGeo


-
18:30
Travel Times in the Roman & British Empires
sur Google Maps Mania -
Mapping the U.S. Electoral Divide
sur Google Maps Mania
-
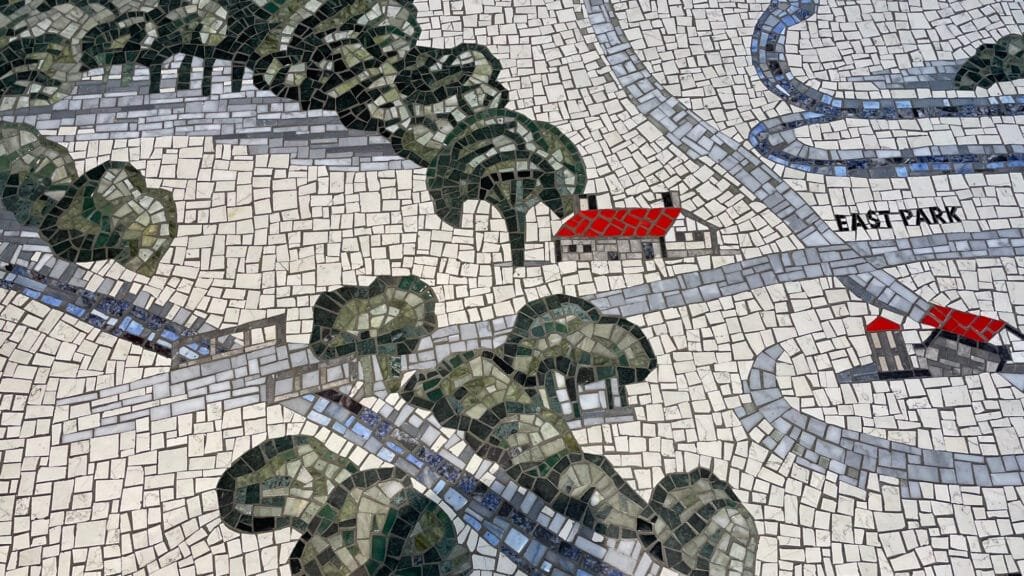
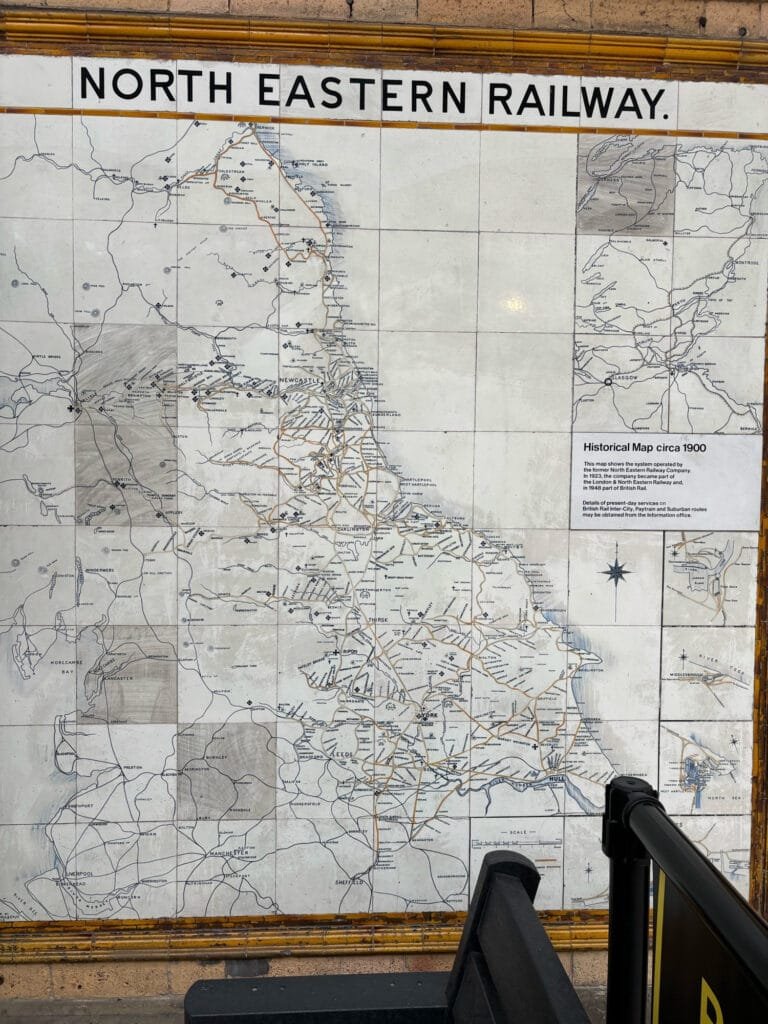
11:00
Mappery: At York Station
sur Planet OSGeo -
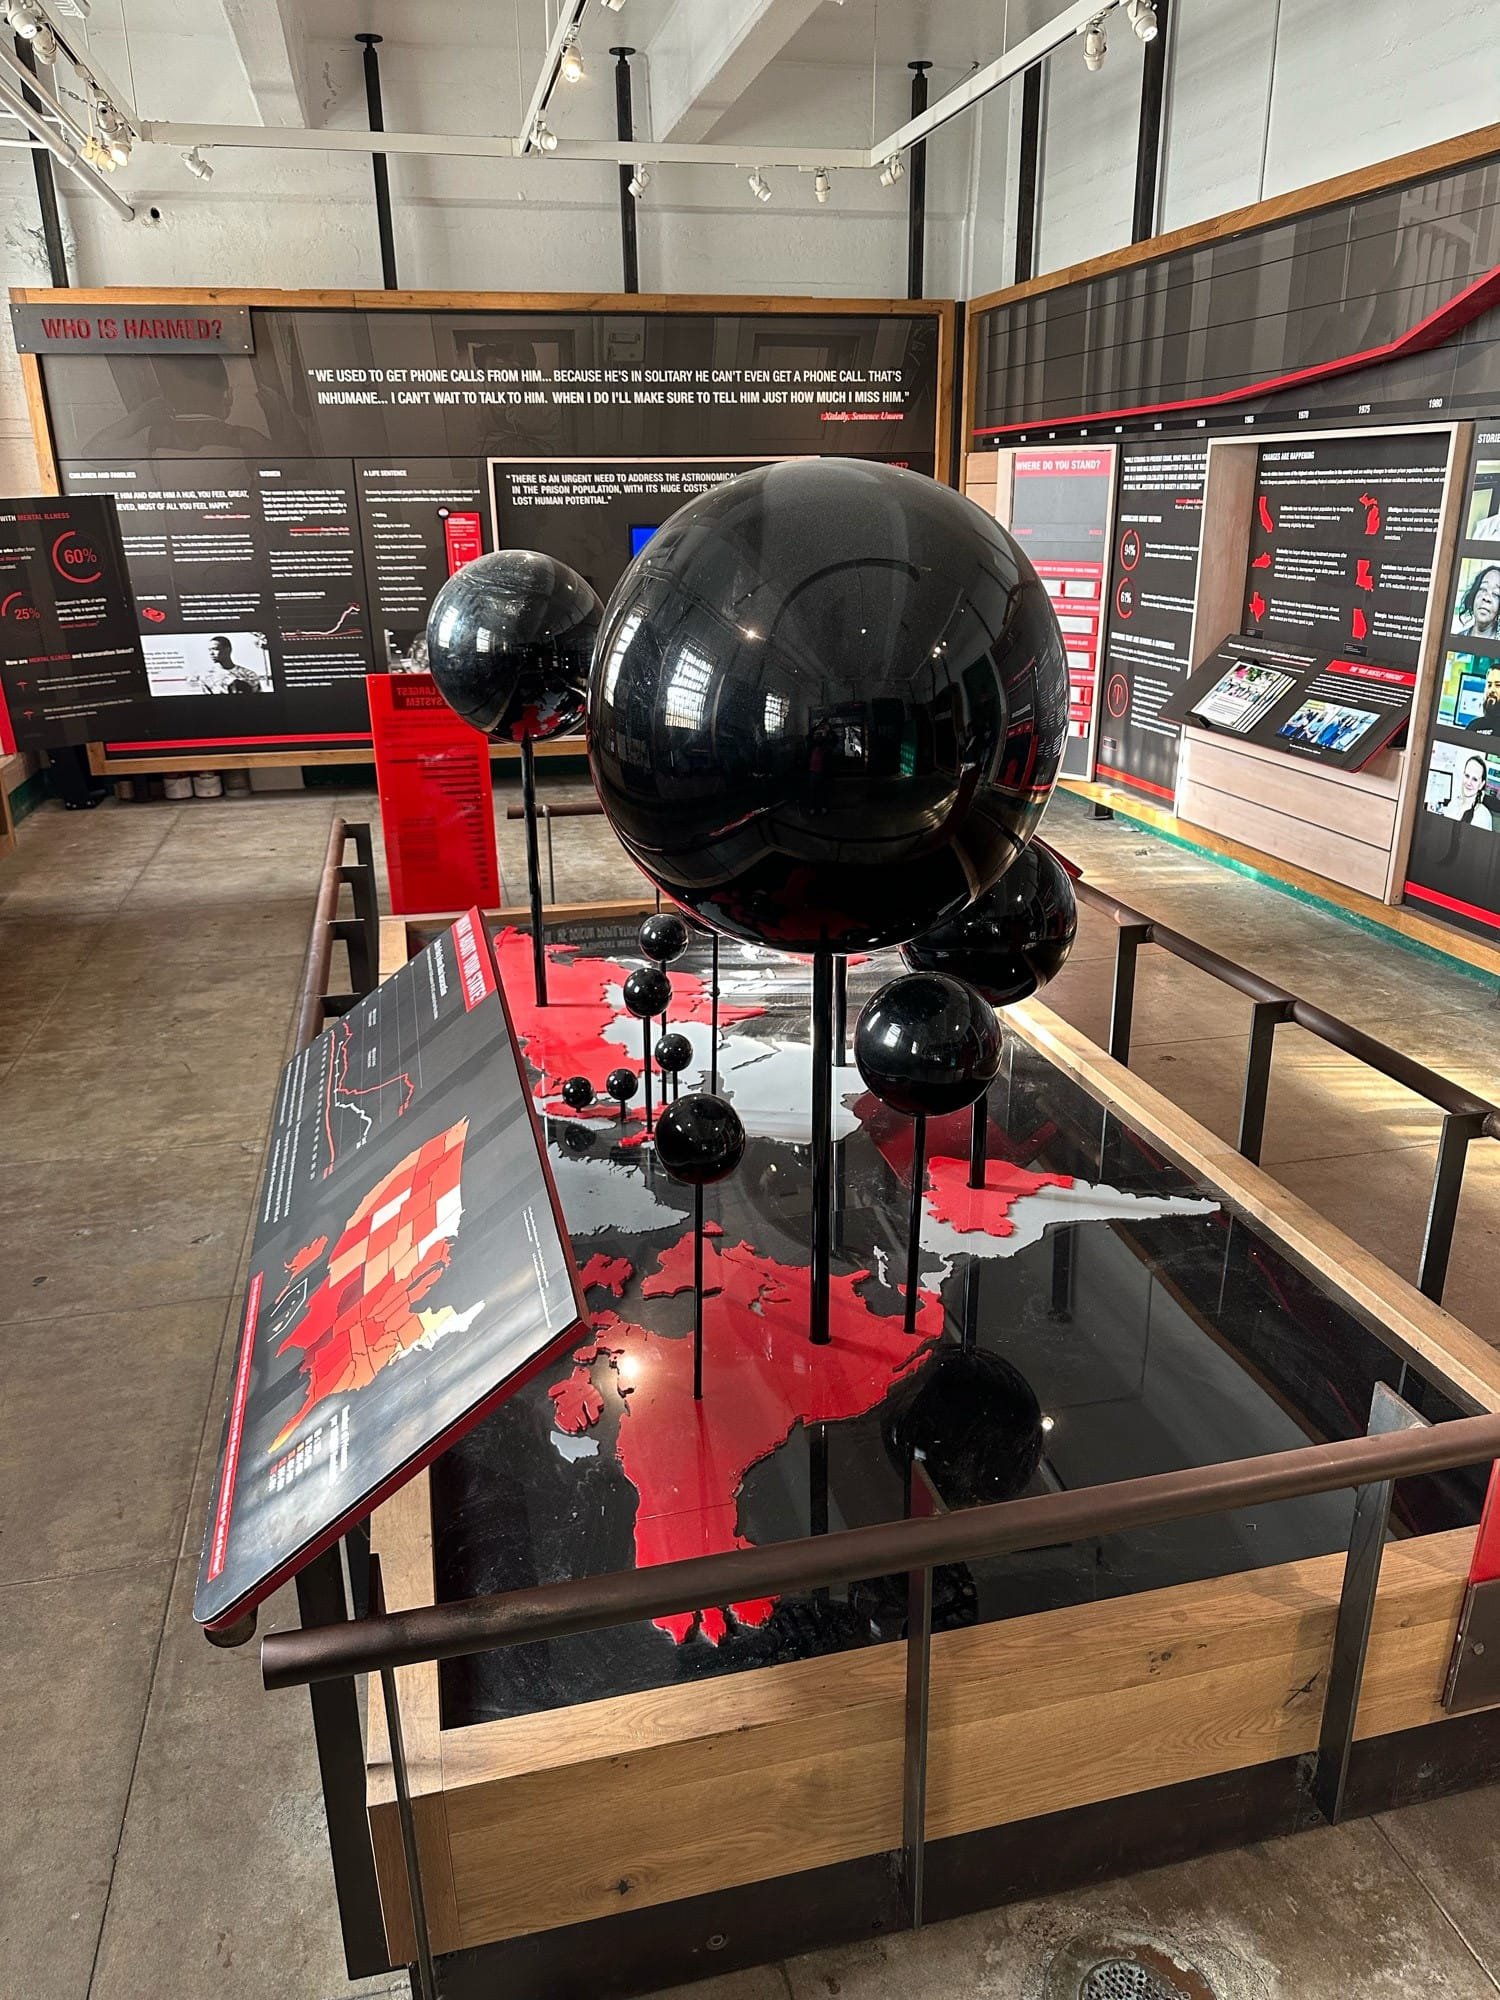
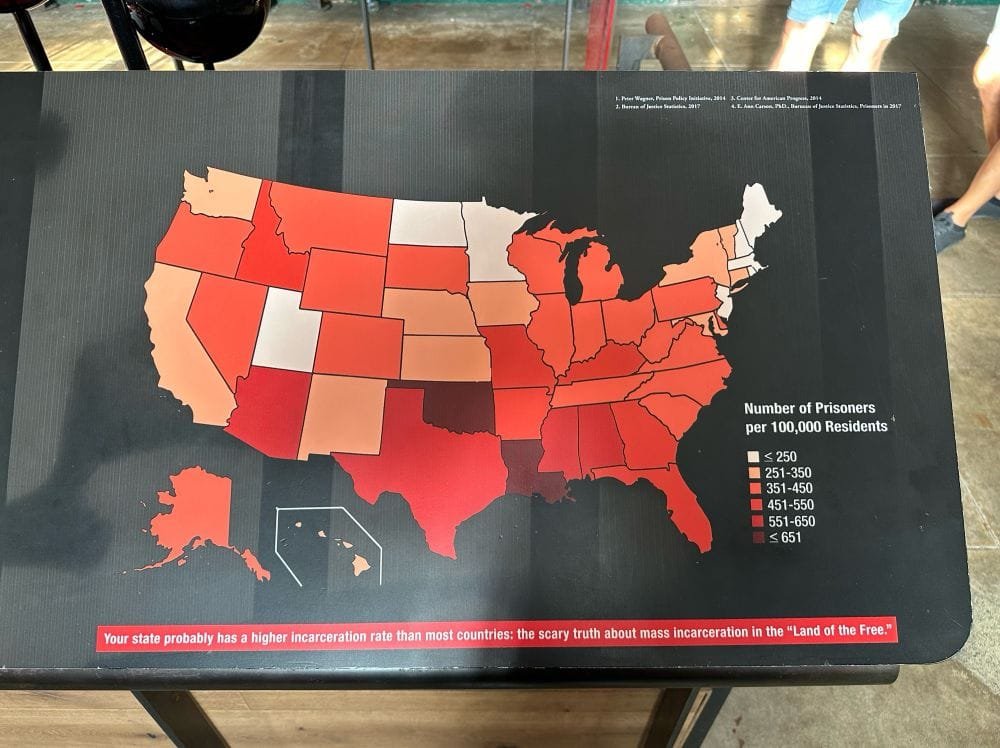
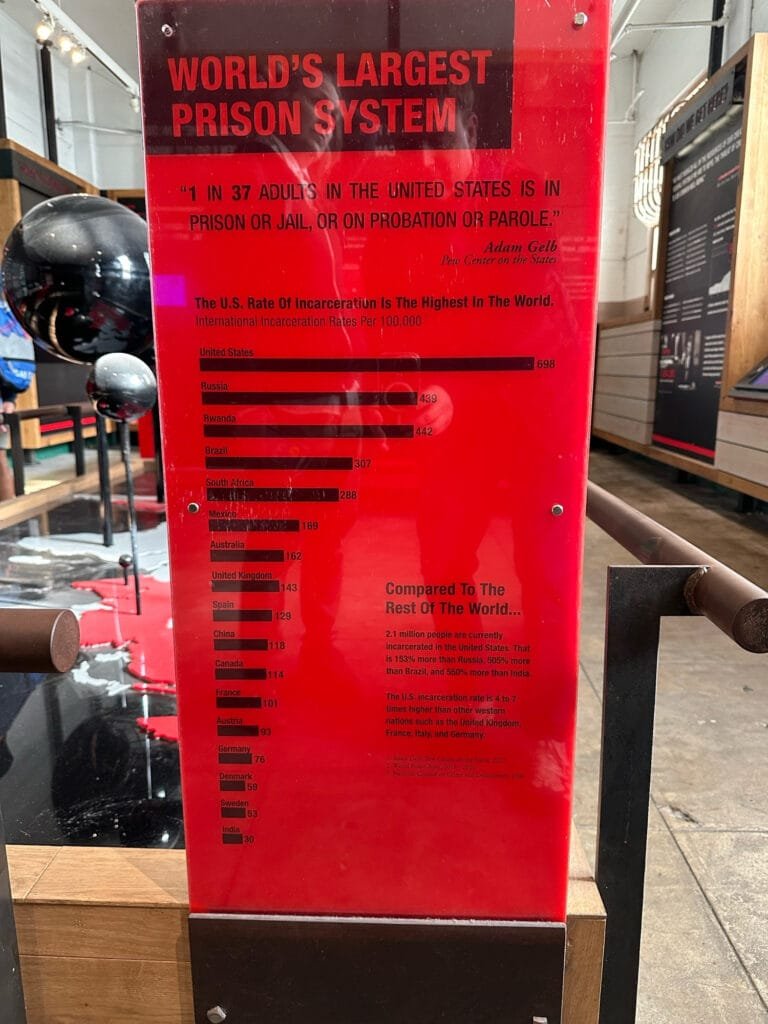
11:00
Mappery: Global incarceration rates
sur Planet OSGeo


-
15:21
From GIS to Remote Sensing: Tutorial: Download Sentinel-2 data and calculate the NDVI in Python using Remotior Sensus
sur Planet OSGeo -
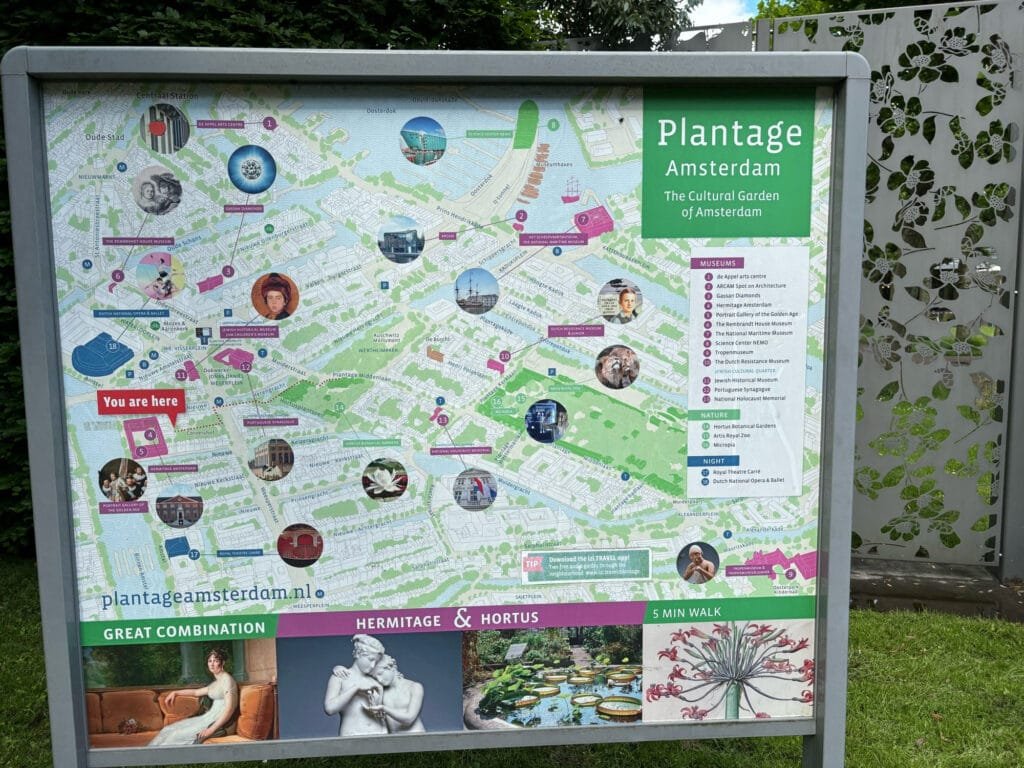
11:00
Mappery: Plantage district Amsterdam
sur Planet OSGeo -
22:23
Free and Open Source GIS Ramblings: GeoParquet in QGIS – smaller & faster files for the win!
sur Planet OSGeo
 This post is about
 Reading performance


-
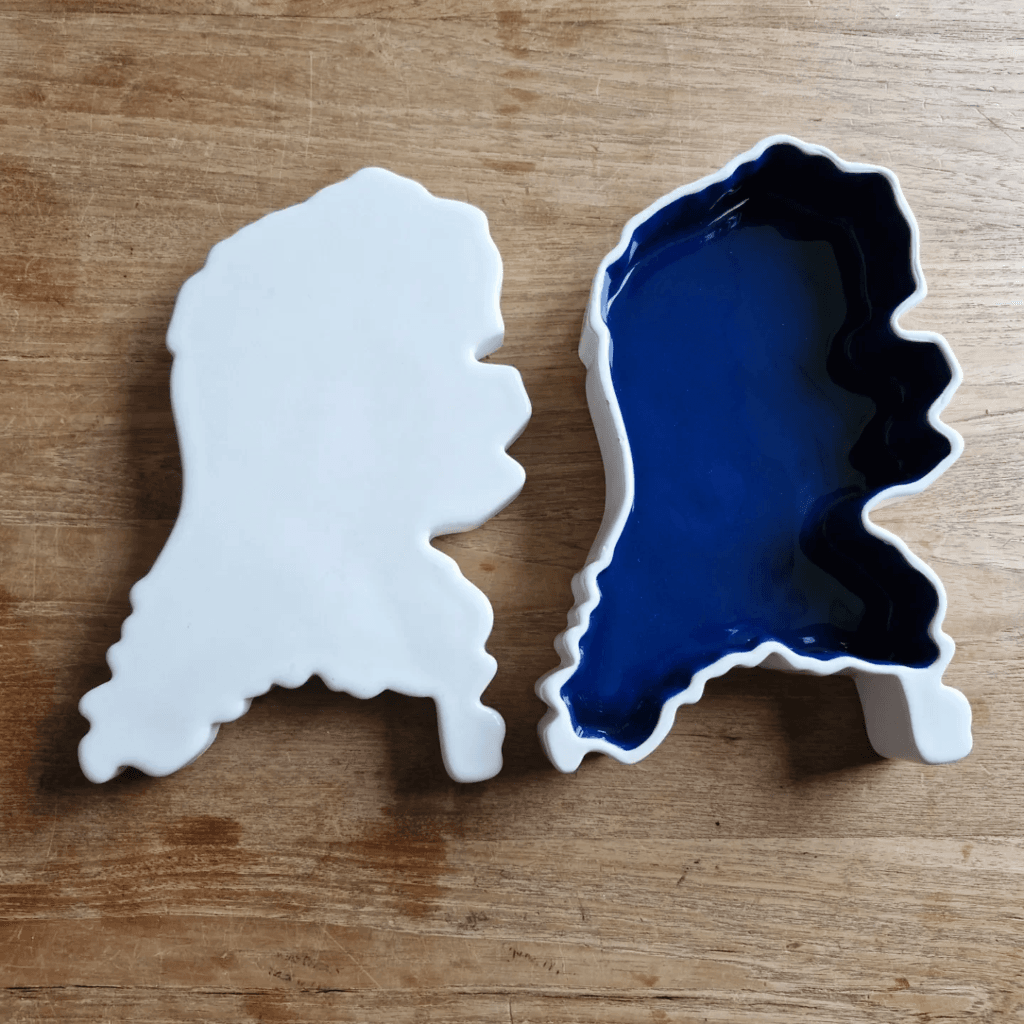
11:00
Mappery: Chopping boards
sur Planet OSGeo -
11:00
Mappery: Underground at St Pancras
sur Planet OSGeo


-
22:05
OSGeo Announcements: [OSGeo-Announce] FOSS4G Europe 2024 Tartu final press release
sur Planet OSGeo -
20:53
GeoTools Team: GeoTools 32.1 released
sur Planet OSGeo -
20:51
OSGeo Announcements: [OSGeo-Announce] Welcoming our new OSGeo Charter Members 2024
sur Planet OSGeo -
11:09
GeoSolutions: FREE Webinar: MapStore at work, NORDIQ webgis product
sur Planet OSGeo -
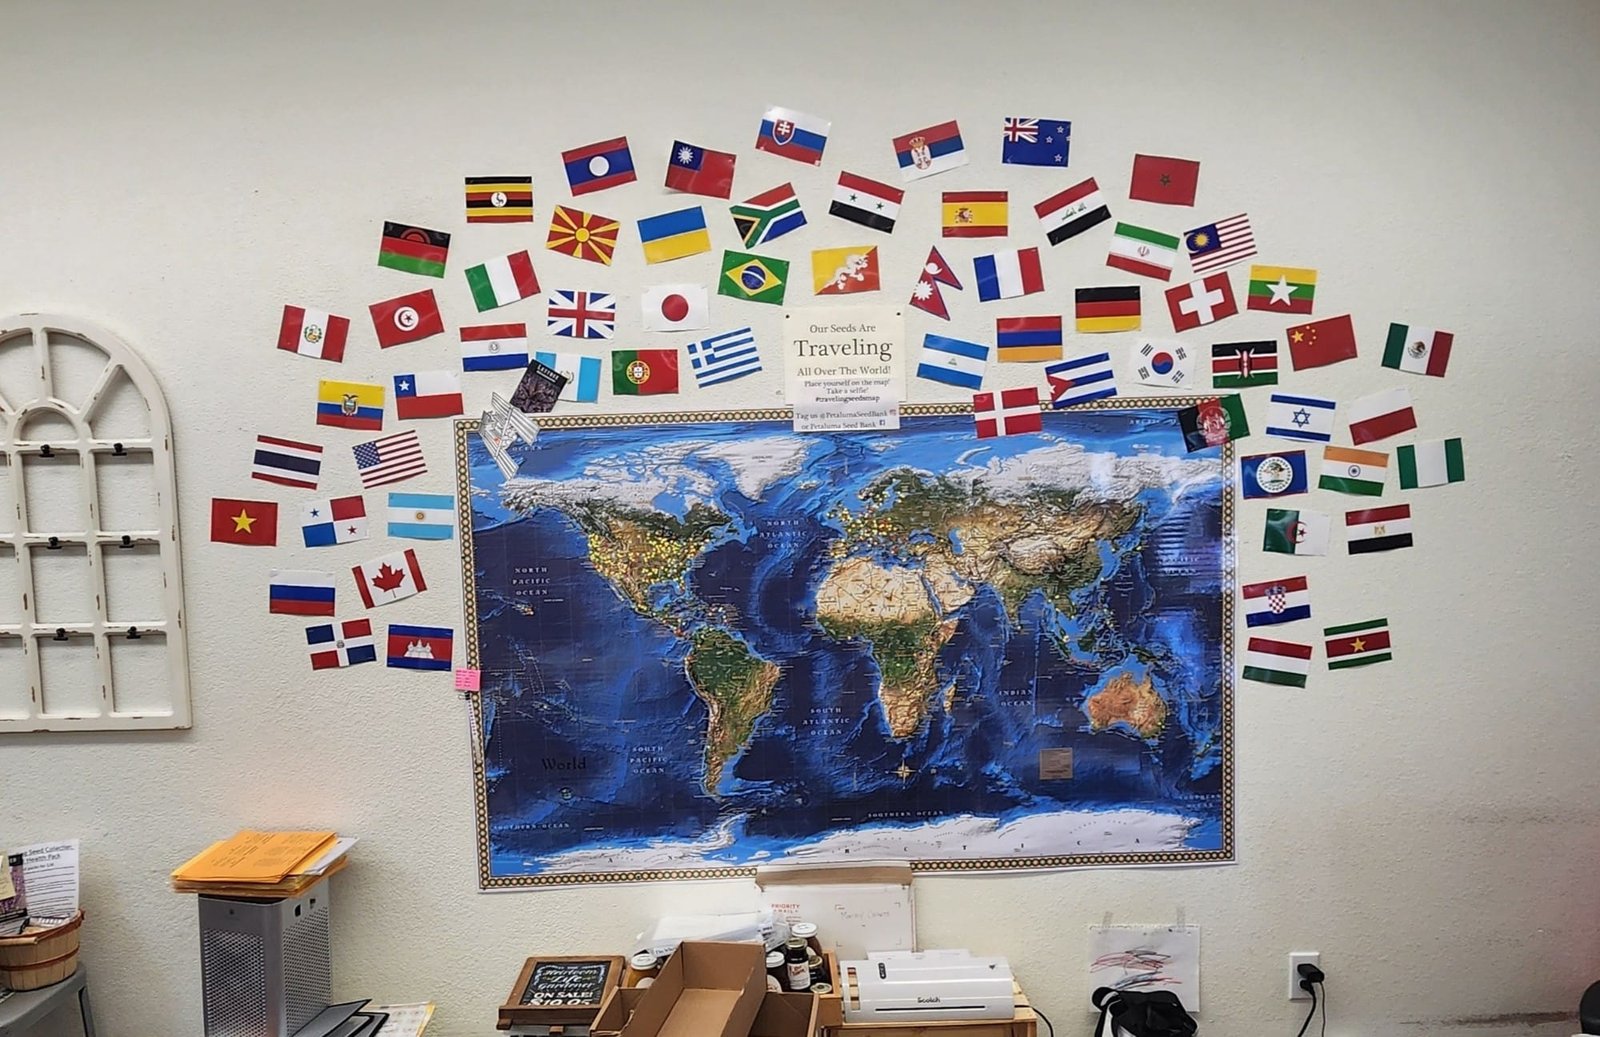
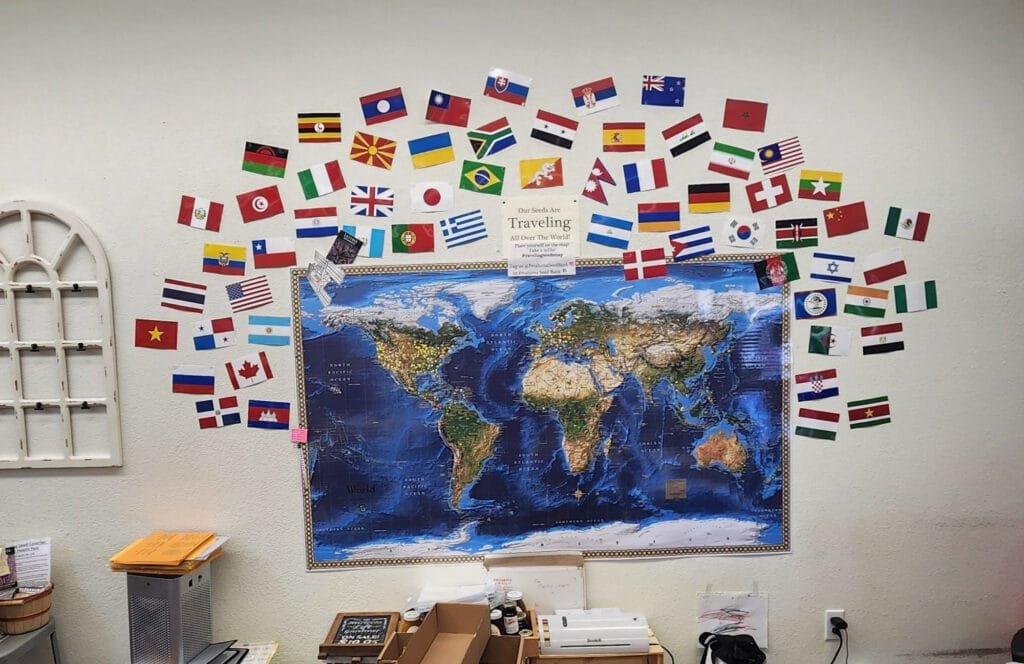
11:00
Mappery: Traveling seeds
sur Planet OSGeo
 - ready and can be accessed under the foundation news at osgeo.org [1]. Further links to photos, presentation videos on TIB-AV portal and YouTube, and to the academic track proceedings are all in there.

