
Vous pouvez lire le billet sur le blog La Minute pour plus d'informations sur les RSS !
Canaux
3528 éléments (0 non lus) dans 55 canaux
-
 Décryptagéo, l'information géographique
-
Cybergeo
-
Revue Internationale de Géomatique (RIG)
-
SIGMAG & SIGTV.FR - Un autre regard sur la géomatique
-
Mappemonde
-
Imagerie Géospatiale
-
Toute l’actualité des Geoservices de l'IGN
-
arcOrama, un blog sur les SIG, ceux d ESRI en particulier
-
arcOpole - Actualités du Programme
-
Géoclip, le générateur d'observatoires cartographiques
-
Blog GEOCONCEPT FR
-
Géoblogs (GeoRezo.net)
-
Conseil national de l'information géolocalisée
-
 Geotribu
-
Les cafés géographiques
-
UrbaLine (le blog d'Aline sur l'urba, la géomatique, et l'habitat)
-
Icem7
-
Séries temporelles (CESBIO)
-
Datafoncier, données pour les territoires (Cerema)
-
Cartes et figures du monde
-
SIGEA: actualités des SIG pour l'enseignement agricole
-
Data and GIS tips
-
Neogeo Technologies
-
ReLucBlog
-
L'Atelier de Cartographie
-
My Geomatic
-
archeomatic (le blog d'un archéologue à l’INRAP)
-
Cartographies numériques
-
Veille cartographie
-
Makina Corpus
-
Oslandia
-
Camptocamp
-
Carnet (neo)cartographique
-
Le blog de Geomatys
-
GEOMATIQUE
-
Geomatick
-
CartONG (actualités)

 Géomatique anglophone
-
sur The Hezbollah Map
Publié: 12 October 2023, 9:44am CEST par Keir Clarke
The Washington Institute's Lebanese Hezbollah is an interactive map dedicated to tracking the activities of the Islamist political party and militant group Hezbollah around the world. The purpose of the map is to serve as a repository of open-source information about Hezbollah’s global activities. The map is also intended to shed light "on the full geographic and temporal range of Hezbollah
-
sur GRASS GIS: Apply Now for New Mentoring Program
Publié: 11 October 2023, 10:12am CEST
The GRASS GIS project is launching a new mentoring program to help students, researchers, and software developers integrate GRASS GIS into their projects. Mentoring will be provided free of charge by experienced GRASS developers in a one-on-one setting allowing for remote and asynchronous communication. Mentors will work with participants to select the most appropriate and efficient tools and techniques to run and integrate GRASS tools into the participants’ workflow and provide advice and feedback during the implementation.
-
sur Mapping the Causes of Haze
Publié: 11 October 2023, 9:55am CEST par Keir Clarke
The Straits Times has published a fantastic visualization of how burning peatlands in Indonesia can lead to hazy conditions and dangerous air pollution in Singapore. In Why the Haze has Reached Singapore's Shores Again the Straits Times has created a stunning computer simulation of the 2019 haze which affected Singapore. The simulation uses an animated smoke layer to illustrate how burning -
sur Guess Thy Neighbor
Publié: 9 October 2023, 10:42pm CEST par Keir Clarke
Can you name the four countries which border Greece? If you can then you should head straight over to Neighborle.Each day on Neighborle you are shown a different country on an interactive map. Your daily challenge is to name all the countries which border that day's highlighted country. Every time you name a correct bordering country it will be shown in green on the map. If you enter an
-
sur A recap of the 127th OGC Member Meeting, Singapore
Publié: 9 October 2023, 2:52pm CEST par Simon Chester
From September 25-29, 2023, more than 100 geospatial experts from around the world converged in Singapore to attend OGC’s 127th Member Meeting, with another 100+ attending online. As always, big thanks go out to our dedicated members that either attended in-person, or juggled lives across multiple timezones to attend virtually.
Sponsored by OGC Principal Member, the Singapore Land Authority (SLA), the meeting was themed “Building future standards for the next generation of geospatial experts.” Once again, the Member Meeting was held in conjunction with the Singapore Geospatial Festival 2023 operated by SLA’s GeoWorks.
Alongside the usual assortment of Standards Working Group (SWG) and Domain Working Group (DWG) meetings, the Member Meeting also saw several special sessions, including: a two-part Data Quality Workshop; a session on Modeling of Humanities’ Spatio-Temporal Data; a Digital Twins special session; a session on the OGC Academy; a Connecting Land and Sea special session; an Intelligent Transportation Systems (ITS) ad hoc; and a meeting of the OGC Asia Forum.
Monday evening’s welcome reception celebrated Simple Features’ 25th birthday with a suitably delicious cake and an enthusiastic rendition of “Happy Birthday.” Simple Features, which is jointly published with ISO, is OGC’s earliest standard and describes how to model the location of “features” (a geometric representation of anything of interest) on a 2-dimensional space representing the surface of a planet. And of course there was the usual Wednesday night “VIP Dinner” (held at the delicious Red House Seafood), where Wuhan University received an OGC Community Impact Award, and a Diversity Luncheon held on Thursday.
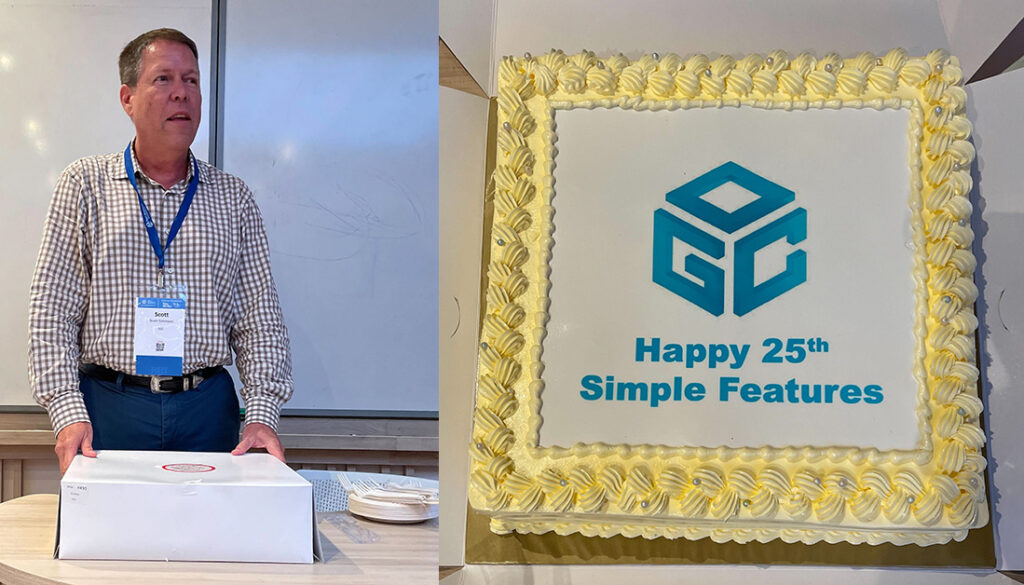 OGC Chief Standards Officer, Scott Simmons, leads the celebrations for Simple Features’ 25th birthday.
Themes from the week
OGC Chief Standards Officer, Scott Simmons, leads the celebrations for Simple Features’ 25th birthday.
Themes from the week
As is befitting of the location in Singapore, with its advanced modeling of the whole nation, across the entirety of the Member Meeting were presentations related to Digital Twins – twins not only of the built environment, but for vegetation, the ocean, and the subsurface. Several Working Groups regularly include discussion on Digital Twins related to their scope, especially the Urban Digital Twins DWG. Related topics regarding the Metaverse and Interoperable Simulation and Gaming also continue regular appearances at OGC meetings.
Marine and coastlines play an important role in economies and climate resilience strategies alike. OGC has a long-running pilot project on marine geospatial infrastructure, and we continue to refine models for describing and managing the coastal land-sea interface. We expect this work to be extended to the topics of ITS and logistics in the coming years, too.
A Kick-off and a Joint OpeningThe OGC Member Meeting started on Monday, but as it was held jointly with the Singapore Geospatial Festival, the joint opening wasn’t until Tuesday. Monday, then, kicked off with a brief welcome session before the ever-popular Today’s Innovations, Tomorrow’s Technologies and Future Directions session.
The topic of this meeting’s Future Directions session was Geospatial Artificial Intelligence. Dr. Gobe Hobona, OGC’s Director of Product Management, opened with an overview of where this topic fits in the context of previous sessions. He was then followed by three presentations:
- Kyoung-Sook Kim from the National Institute of Advanced Industrial Science & Technology (AIST) presented a Design Standardization Roadmap for GeoAI.
- Peter Baumann, Dimitar Misev, and Otoniel Campos of Constructor University (formerly Jacobs University) presented on Scalable Datacube-Enabled AI Infrastructure Based on Open Standards.
- Amey Godse and Sunil Shah of Duality Robotics presented on Building Digital Site Twins Using Geospatial Data and Artificial Intelligence.
The speakers then participated in a panel fielding audience questions, including their views on the fundamental scope of the AI domain in a geospatial context, and what types of machine learning need OGC’s attention and which may be less relevant. OGC Members can access the presentations and a recording on this page in the OGC Portal.
The joint Opening session on Tuesday featured keynote remarks from Colin Low, Chief Executive, SLA, and myself. The Guest of Honor was Dr. Mohamad Maliki Bin Osman, Minister in the Prime Minister’s Office, Second Minister for Education & Foreign Affairs. The session also featured presentations from local students who had performed impressive geospatial projects in their primary schools. It finished with a panel on “Geospatial: Enriching Minds, Empowering Lives,” which was also the key theme for the Singapore Geospatial Festival.
 The theme of the Member Meeting was “Building future standards for the next generation of geospatial experts.”
Meeting Special Sessions
The theme of the Member Meeting was “Building future standards for the next generation of geospatial experts.”
Meeting Special Sessions
The week continued with its usual array of SWG and DWG meetings, interspersed with several special sessions, outlined below.
The OGC Data Quality DWG held two sessions to comprise a workshop covering a breadth of data quality topics. The first session focused on the work of ISO/TC 211 on data quality measures and a registry to be hosted by OGC. The second session included presentations on the data quality requirements and considerations for a variety of types of geospatial data, including 3D and imagery. OGC Members can access the presentations and a recording on this page in the OGC Portal.
The session on Modeling of Humanities’ Spatio-Temporal Data was organized by participants in the HumSpatial Consortium, in which OGC participates, to address the complexities of representing “named places” in geospatial technologies. Presentations were given by scholars and practitioners from the humanities research and government sectors heavily involved with place-names and other types of geospatial data. OGC Members can access the presentations and a recording on this page in the OGC Portal.
Several sessions over the course of the week included presentations related to Digital Twins, often in the context of other domains, such as Artificial Intelligence or Data Quality. A dedicated special session for Digital Twins was organized to demonstrate different information types and practices and facilitate discussion on the relative meaning/relationship between digital twins, the metaverse, and the industrial metaverse. OGC Members can access the presentations and a recording on this page in the OGC Portal.
The OGC Academy is an information portal for distributing OGC knowledge related to the work of the Consortium and general geospatial interoperability. The web-based resources are under development with an estimated completion in 2026. Content is continuously refreshed. This session discussed capacity building and the academy more broadly. OGC Members can access the presentations and a recording on this page in the OGC Portal.
The OGC Marine DWG organized a follow-up session to the one hosted last year in Singapore on “Connecting Land and Sea” to highlight activities in the OGC Federated Marine Spatial Data Infrastructure Pilot as well as work from OGC members around the world. OGC Members can access the presentations and a recording on this page in the OGC Portal.
The Intelligent Transportation Systems (ITS) ad hoc session highlighted work in ISO/TC 204, with whom OGC maintains a liaison, and explored the next steps for related work in OGC. Attendees generally accepted that ITS work intersected several OGC Working Groups and that a new effort to refine the road network model developed in TC 204 would be suitable for OGC activities. OGC Members can access the presentations and a recording on this page in the OGC Portal.
At each OGC Member Meeting, one or more local forums meet to present and discuss topics of regional interest. On Friday of the Member Meeting, the OGC Asia forum offered a short history on the forum and five presentations from across the region. OGC Members can access the presentations and a recording on this page in the OGC Portal.
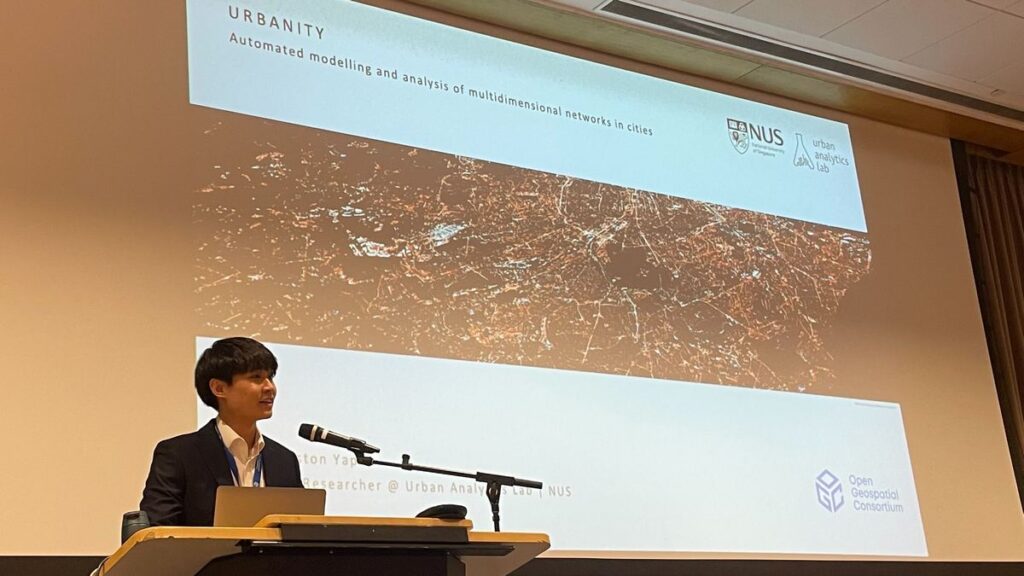 Winston Yap from the National University of Singapore’s Urban Analytics Lab presents during the Digital Twins Special Session.
Closing and Important Things
Winston Yap from the National University of Singapore’s Urban Analytics Lab presents during the Digital Twins Special Session.
Closing and Important Things
The Member Meeting’s Closing session began with the Important Things session and my rapid, 15-minute summary of the entire meeting week that included slides and content from a large number of Working Group sessions. OGC Members can access the presentation and a recording on this page in the OGC Portal.
The Important Things session then proceeded with two discussion topics:
- “Is the ‘fundamental model’ of geospatial 2D, 3D, 4D, or more D?” with consideration to whether the minimum number of dimensions is necessary, or whether all dimensions should just be assumed.
- “The need to establish a policy for the governance of building blocks” where the TC concluded that more discrete definitions are needed for “building blocks” and other registered items that act as useful components in geospatial architecture.
Notes from the session were recorded in the Etherpad “Important-Things-2023-09”, which is available to OGC Members via the Portal.
The formal Closing Plenary then followed, which focuses on Working Group presentations and voting. The session advanced a number of Standards, SWGs, and documents toward vote or publication, so keep your eye on our news page, or subscribe to the “Standards updates” topic on the OGC Mailing List to get notifications sent straight to your inbox.
Thank youOur 127th Member Meeting was yet another memorable meeting. It’s so great to see OGC Members discuss, collaborate, and drive technology and standards development forward in support of some of the biggest issues facing humanity. Once again, a sincere thank you to our members for investing their time and energy, as well as their dedication to making OGC the world’s leading and most comprehensive community of location experts.
Be sure to join us at TU Delft, Netherlands, on March 25-29, 2024, for our 128th Member Meeting. Registration and further info will be available soon on ogcmeet.org. Sponsorship opportunities are also available – contact us for more info. You can subscribe to the “Events” and other topics on the OGC Mailing List to stay up to date on all aspects of OGC, including when registration goes live for our Member Meetings.
In the meantime, don’t miss our 2023 Innovation Days event, December 5-7 in Washington, DC, USA. The multi-day event brings together policy makers, program decision-makers, and other experts in geospatial to showcase climate, emergency, and disaster management & resilience solutions that scale from local to global impacts.
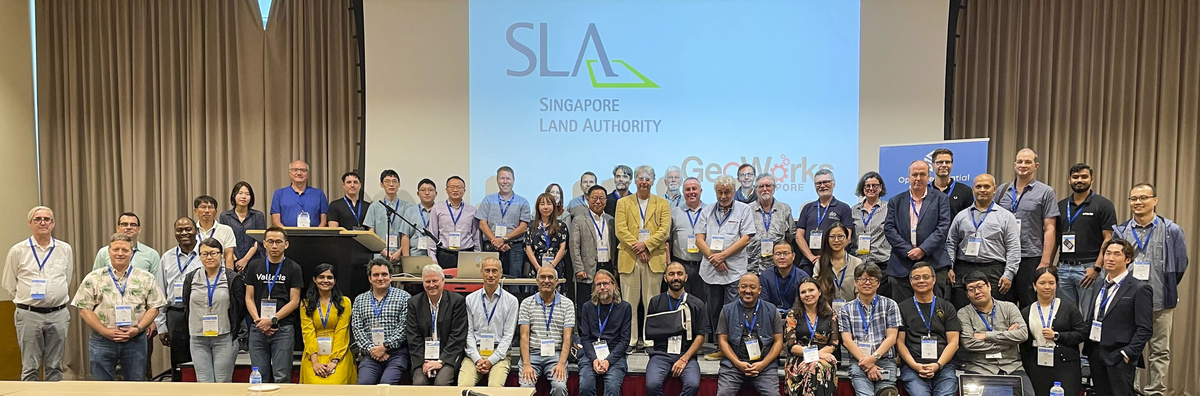
 Attendees of the 127th OGC Member Meeting in Singapore, 2023.
The post A recap of the 127th OGC Member Meeting, Singapore appeared first on Open Geospatial Consortium.
-
sur Light, Shadows & Fog
Publié: 9 October 2023, 10:15am CEST par Keir Clarke
Brody Smith has written a couple of useful tutorials on how you can customize lighting, building and terrain shadows, and fog settings in Mapbox GL powered maps. In Mapbox Lighting, Shadows, and Fog - Part 1 Brody looks at how lighting can be used to change the visual appearance of a map. In Mapbox Lighting, Shadows, and Fog - Part 2 Broady explores how tinkering with a map's fog settings can
-
sur EOX' blog: Data Gravity, the Source Cooperative and hopeful thoughts...
Publié: 9 October 2023, 2:00am CEST
TL;DR understand the cost drivers in your "open data" strategy, long-term don't neglect the ecosystem gravitating around the actual data you can outsource data promotion but not data governance allow a neutral cooperative to track uptake and share analytics The term data gravity describes the observ ... -
sur Camptocamp: Camptocamp at GéoDataDays 2023
Publié: 9 October 2023, 2:00am CEST
Pièce jointe: [télécharger]
Held in Reims, France, GéoDataDays 2023 was a major event in the world of geomatics and digital mapping.
-
sur Mapping the Barassi Line
Publié: 9 October 2023, 1:45am CEST par Keir Clarke
The Barassi Line is an imaginary line across Australia that approximately divides areas where Australian rules football or rugby league is the most popular football code. The line is named after Ron Barassi, a former player and coach in Australian Rules Football. The term the 'Barassi Line' was first used by historian Ian Turner in his 1978 Ron Barassi Memorial Lecture. The Barassi Line
-
sur From GIS to Remote Sensing: Semi-Automatic Classification Plugin version 8 officially released
Publié: 8 October 2023, 12:45am CEST
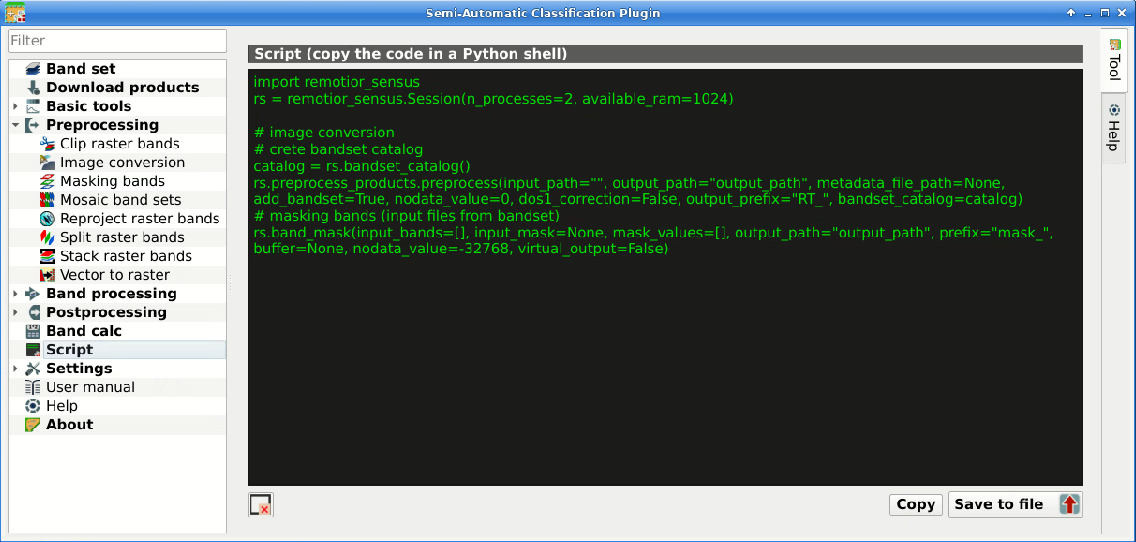
I am glad to announce the release of the new version 8 (codename "Infinity") of the Semi-Automatic Classification Plugin (SCP) for QGIS.
This new version is based on a completely new Python processing framework that is Remotior Sensus, which expands the processing capabilities of SCP, also allowing for the creation of Python scripts.
The following video provides an introduction to the SCP tools.
Read more »
-
sur The Ring of Rain
Publié: 7 October 2023, 10:04am CEST par Keir Clarke
X-Rain is an interactive map which visualizes the average amount of rainfall around the globe. The precipitation data used on the map is derived from historical satellite observations. This remote sensed data is not as accurate as data recorded by rain gauges but it is able to provide a more global view of precipitation levels as it is not limited to only those locations with rain gauges.The
-
sur Sean Gillies: Bear 100 recap
Publié: 7 October 2023, 1:35am CEST
A week ago I started the Bear 100 Endurance Run. I did not finish. This was my first DNF. I'm still trying to figure out what went wrong and evaluate how I responded.
To recap: I rolled into the sixth aid station, Tony Grove, mile 51, at 9:59 p.m. I made a head to toe gear change. Underwear, pants, hat, socks, and shoes. Diaper ointment lube on my feet and privates. Ate potatoes and chicken noodle soup and refilled my bottles. I spent too much time there, but this was going to be my main stop before dawn, and I wanted to get properly set up for 8 hours of plugging through the night. I left at 10:43 p.m.
Somewhere around mile 59, descending into Franklin Basin, my left ankle stopped working, and I limped into the Franklin Basin aid station (mile 62). After 15 minutes of triage, I decided to quit. I had no flexibility or stability in my left foot, and continuing seemed pointless.
What happened? I couldn't remember a single major incident. I'd had a number of little wobbles earlier in the day and the descent from Tony Grove was pretty rough. I certainly picked up a little damage along the way. And I'd sprained this ankle four weeks ago. Maybe it wasn't strong enough to go 100 miles. It's possible that I fell asleep on my feet at 1:30 a.m. and rolled it. I was certainly sleepy enough at some points. Either the accumulation of stress was too much for my ankle, or an acute injury happened while I was checked out. Or both. I don't know for sure.
I'm disappointed. Otherwise, things were going well. My gear choices were solid. I was eating and drinking well enough. Other than one toenail lost to kicking a rock, my feet were fine, no hotspots or blisters. My ankle was swollen for several days, but I didn't go far enough to wreck my quads or hips. Sigh.
I will try this again.
More about the race, photos, stories, etc, soon.
-
sur The London Underground Map Quiz
Publié: 6 October 2023, 10:57am CEST par Keir Clarke
The London Underground consists of 269 stations. I bet you can't name them all.London Underground Names is an easy map game which simply requires you to name all 269 stations on the London Underground network. Naming all 269 stations is a little tricky so I've provided you with a couple of aides to help you remind you of some of the station names. Due to my personal commuting history I can name -
sur Your Perfect Weather Map
Publié: 5 October 2023, 9:20am CEST par Keir Clarke
We all have our own ideas about what the ideal weather conditions actually are. myPefectWeather is an interactive map which can help you find the locations in the United States which most closely match your own preferred temperatures, precipitation levels and /or amount of snowfall.If you select the 'options' button on the myPerfectWeather map menu you can begin to discover the locations
-
sur OGC and the International Data Spaces Association sign Memorandum of Understanding
Publié: 5 October 2023, 9:00am CEST par Simon Chester
The Open Geospatial Consortium (OGC) and the International Data Spaces Association (IDSA) have signed a Memorandum of Understanding (MoU) that outlines how they will together contribute to a flourishing data economy through the creation and development of standards for data spaces that ensure sovereign, interoperable, and trusted data sharing.
“As the number of available data sources continues to grow, the challenge of integrating them into high-value products becomes ever greater,” commented OGC Chief Technology Innovation Officer, Ingo Simonis, Ph.D. “In order to develop effective solutions for cross-border data integration, international collaboration is critical. As such, OGC is eager to work with IDSA to tackle this task together.”
“Committed to driving digital transformation, IDSA champions economic growth, innovation, and a cohesive data-sharing approach,” said Silvia Castellvi, Director of Research & Standardization at IDSA. “Partnering with OGC ensures our standards align and resonate. Enhancing features, like the geolocation of IDS Connectors, not only advances our standard but boosts its appeal for future developers and users.”
OGC is an international non-profit consortium aiming to make geospatial (location) information and data services FAIR – Findable, Accessible, Interoperable, and Reusable. IDSA is an international non-profit association that follows a user-driven approach to create a global standard for international data spaces and interfaces based on sovereign data sharing.
The MoU seeks to align activities between the two organizations so that OGC and IDSA Standards can work in tandem. This will be achieved in part through joint participation in potential future projects and initiatives, particularly in the areas of global supply chains, intelligent transport, and smart city data spaces.
Projects in global supply chains and intelligent transport may include developing solutions that support the monitoring of shipping routes, tracking freight, sharing ocean currents and weather data, and more. Projects in smart city data spaces could focus on improving data sharing from business and technical perspectives, and could include data ranging from traffic to population migration.
The two organizations have already identified several ongoing or completed projects relevant to their work together, including: Divine, Flexigrobots, DEMETER, ATLAS & AgriDataValue, Iliad, AD4GD, OGC Rainbow, and others.
About IDSA
The International Data Spaces Association (IDSA) is on a mission to create the future of the global, digital economy. Its 140+ member companies and institutions have created the International Data Spaces (IDS) standard: a secure system of sovereign and trusted data sharing in which all participants can realize the full value of their data. IDS enables new smart services and innovative business processes to work across companies and industries, while ensuring that the control of data remains in the hands of data providers. We call this data sovereignty.
Visit internationaldataspaces.org for more informationPress contact:
Nora Grass
+49 162 2104263
nora.gras@internationaldataspaces.orgThe post OGC and the International Data Spaces Association sign Memorandum of Understanding appeared first on Open Geospatial Consortium.
-
sur SIG Libre Uruguay: IV Convención Científica Internacional UCLV 2023
Publié: 4 October 2023, 7:29pm CEST

La Universidad Central “Marta Abreu” de Las Villas, Institución de Excelencia de la Educación Superior en Cuba, convoca a la IV Convención Científica Internacional de Ciencia, Tecnología y Sociedad UCLV 2023, bajo el lema “Ciencia e Innovación para el Desarrollo Sostenible.”
Podrán participar investigadores, académicos, docentes, directivos, empresarios, decisores de políticas de gobierno, estudiantes y otros actores sociales, implicados en la actividad de ciencia e innovación y protección del medio ambiente, además, contaremos con la presentación de conferencias magistrales de expertos de reconocido prestigio internacional y nacional, así como se desarrollarán otras actividades científicas desde una perspectiva multidisciplinar e intersectorial.
Se contará tambien con la modalidad de participación virtual, facilitando a través de la plataforma la transmisión en vivo de actividades que se especificarán en el programa del evento.
El encuentro se desarrollará del 13 al 17 de noviembre de 2023, en el destino turístico Cayos de Villa Clara: Santa María, Cuba.

Destacamos especialmente el II Simposio Internacional sobre «Generación y Transferencia de Conocimiento para la Transformación Digital» SITIC2023, donde se desarrollarán un número importante de actividades: conferencias, curso, talleres. A continuación, la agenda
-
sur CoverageJSON v1.0 Adopted as OGC Community Standard
Publié: 4 October 2023, 3:00pm CEST par Simon Chester
The Open Geospatial Consortium (OGC) is excited to announce that version 1.0 of CoverageJSON has been approved by the OGC Membership for adoption as an official OGC Community Standard. CoverageJSON enables the development of interactive visualizations that display and manipulate spatio-temporal data within a web browser.
The key design goals for CoverageJSON are simplicity, machine and human readability, and efficiency in the storage and use of complex data.
Coverages and collections of coverages can be encoded using CoverageJSON. Coverage data may be gridded or non-gridded, and data values may represent continuous values (such as temperature) or discrete categories (such as classes of land cover).
This OGC Community Standard was an outcome of the European Union project “Maximizing the Exploitation of Linked Open Data in Enterprise and Science” (MELODIES), which ran from 2013 to 2016, and was released under a Creative Commons 4.0 License by the University of Reading. There are several widely-used open source implementations and libraries available. Furthermore, CoverageJSON is one of the encodings supported by the OGC API – Environmental Data Retrieval Standard.
CoverageJSON is based on the popular JavaScript Object Notation (JSON), and provides an effective, efficient format that’s friendly to web and application developers and consistent with the OGC API family of Standards.
CoverageJSON supports the efficient transfer of usable quantities of data from big data stores to lightweight clients, such as browsers and mobile applications. This enables straightforward local manipulation of the data by scientists and other users.
The simplest and most common use-case is to embed all the data values of all variables in a Coverage object within the CoverageJSON document to create a self-contained, standalone, document that supports the use of very simple clients.
Another simple use case is to put data values for each variable (parameter) in separate array objects in separate CoverageJSON documents that are linked from a parent CoverageJSON object. This is useful for a multi-variable dataset, such as one with temperature, humidity, wind speed, etc., to be recorded in separate files. This allows the client to load only the variables of interest.
A sophisticated use case is to use tiling objects, where the data values are partitioned spatially and temporally, so that a single variable’s data values would be split among several documents. A simple example of this use case is encoding each time step of a dataset into a separate file, but the tiles could also be divided spatially, like a tiled map server implementation.
As with any OGC Standard, the OGC CoverageJSON Community Standard is free to download and implement. Interested parties can learn more about, view, and download the Standard from OGC’s CoverageJSON Community Standard Page.
The post CoverageJSON v1.0 Adopted as OGC Community Standard appeared first on Open Geospatial Consortium.
-
sur The 10 Day Fall Color Forecast
Publié: 4 October 2023, 9:32am CEST par Keir Clarke
The Fall Foliage Map 2023 is an interactive fall foliage map which is updated daily to provide you with both an accurate progress report of fall colors and a forecast of how fall colors in the United States are likely to change over the next ten days. According to Explore Fall the main factors influencing fall colors are the temperature and daylight. The Explore Fall predictive fall color model
-
sur QGIS Blog: Call for Proposals: QGIS Website Overhaul 2023/2024
Publié: 3 October 2023, 6:45pm CEST
 Background
Our web site ( [https:]] ) dates back to 2013, it is time for a revision!
As well as modernizing the look and feel of the site, we want the content to be updated to represent changes in the maturity of the project.
We want to appeal to new audiences, especially business and NGO decision makers (in particular the experience for the front pages), whilst still maintaining appeal to grass roots users (especially the lower level pages which contain many technical details and community collaboration notes).
We want to enhance our fund raising efforts through a site that encourages people to contribute to, as well as take from, the project.
 Existing effort
First some key links:
- Current web site: [https:]
- Design for new web site landing page: [https:]]
- Design for new web site (figma): [https:]]
- Code for new web site (what we have built so far): [https:]]
- Plugins web site: [https:]]
- QGIS Documentation Site: [https:]]
- QGIS User Manual: [https:]]
- QGIS Server Manual: [https:]]
- Gentle Introduction to GIS: [https:]]
- QGIS Python Cookbook: [https:]]
- QGIS C++ API Documentation: [https:]]
- QGIS Python API Documentation: [https:]]
- QGIS Certification and Changelog: [https:]]
The above websites were created with a mix of technologies:
- Sphinx (rst)
- Doxygen
- Custom Django Apps
It will not be possible to unify the technology used for all of the above sites, but we want all of the web sites to have a cohesive appearance and the navigation flow between them to be seamless. For the main website at [https:]] and its child pages, we want to re-implement the site to provide a new experience – according to the design we have laid out in our figma board. Note that we want to follow this design. Some small tweaks will be fine but we are not looking for a ‘from scratch’ re-implementation of our design.
This will be our website for the next 10 years – you need to hand it over to us in a way that we can continue working on it and maintaining it without your intervention.
We are calling for proposals to help us with this migration as per the phases described below.
Phase 1?: Project planning Timeline
 Proposed site structure
- What content will be kept
- What will be removed
- What is new to be added
- Keep front page as starting point
- Suggest tweaks if needed
- Establish a clear vocabulary of page types
- Second and third level page design
- Special pages such as
- Download
- Release countdown
- Donation / sustaining members
- Gallery
- and any other you identify as non-standard second/third level
- Guidance and standards for producing visuals like screenshots etc. For example, how we present QGIS screenshots in a flattering way.
- Establish a plan for auxiliary sites:
- Plugins.qgis.org
- Api.qgis.org
- Docs.qgis.org
- etc. (see intro for more exhaustive list)
- Iterative review and feedback from the QGIS web team should be incorporated from biweekly check in calls.
Phase 2?: Content migration of the main site Outcome: We have a clear roadmap and design guide for migrating all of our websites to a consistent unified experience.
 During this phase the contractor will focus on migrating the content of the main site to the new platform.
There will be an iterative review and feedback from the QGIS web team should be incorporated from biweekly check-in calls.
Phase 3?: Auxiliary sites migrations Outcome: [https:]] new site goes live! (Target date end of February 2024)This is out of scope of the current call for proposals but should be part of the overall planning process:
This would be a collaborative process involving a QGIS funded web developer and the consultant.
Iterative review and feedback from the QGIS web team should be incorporated from biweekly check in calls.
Outcome: Auxiliary sites goes live with a cohesive look and feel to match the main site. What we will provide
- Maps and screenshots, videos, animations (with inputs from design team)
- Inputs in terms of content review
 Qualification criteria
 Must have an established track record of website design and content creation. Individuals or companies equally welcome to apply. Any potential conflict of interest should be declared in your application. Discussions will happen in English, with live discussions as well as written communication via issues or Pull request. Being reasonably fluent in English and understand the soft skills required to interact in a community project will be more than appreciated
 Payment milestones
10 % Kick off
40 % Phase 1 Completion
50 % Phase 2 Completion
 Indicative budget
We would like to point you to the QGIS Annual Budget so that you have a sense of our broad financial means (i.e. we will not be able to afford proposals in excess of €25,000 for phase 1+2).
 Technology choices and IP:
- Must be wholly based on Open Source tooling (e.g. javascript, css, web frameworks)
- Needs to be ideally implemented in Hugo (or Sphinx)
- Must produce a static web site (except for existing django based sites)
- Publication and development workflow will follow standard pull request / review process via our GitHub repositories
- Mobile friendly
- Site will be english only – any auto-translation tooling that can be added so that users can trivially see an auto-translated version of the site will be considered favourably.
 Proposal submission
Your proposal should consist of no more than 5 pages (include links to relevant annexes if needed) covering the following:
- Overview of yourself / your organization
- Delivery timeline
- Team composition
- Budget for each phase
- Examples of prior work
- Bonus things to mention if relevant: GIS experience & working with Open Source projects
Please send your proposal to finance@qgis.org by October 29nd 2023 midnight, anywhere on earth.

-
sur Shilling for Putin
Publié: 3 October 2023, 10:04am CEST par Keir Clarke
The Insider ('fully committed to investigative journalism and to debunking fake news') has created a new interactive map which exposes the 'fake experts' around the world that are spreading pro-Kremlin fake narratives and Russian propaganda. The Insider claims that what "unites the individuals featured on this map is their attempt to portray Putin's policies positively while disseminating -
sur The October Solar Eclipse Map
Publié: 2 October 2023, 9:37am CEST par Keir Clarke
In 12 days time people in North, Central, and South America will be able to experience a solar eclipse. On Saturday, Oct 14 an annular solar eclipse will occur which will be visible in some areas of the United States, Mexico, and a number of countries in Central and South America. NASA's 2023 Solar Eclipse Explorer is a new interactive map which visualizes the path of the solar eclipse on Oct
-
sur GeoTools Team: GeoTools 30-RC released
Publié: 2 October 2023, 12:49am CEST
The GeoTools team is pleased to share the availability GeoTools 30-RC :geotools-30-RC-bin.zip geotools-30-RC-doc.zip geotools-30-RC-userguide.zip geotools-30-RC-project.zip org.opengis package removalThe main novelty in this release is the renaming of all "org.opengis" packages into "org.geotools.api" ones, to satisfy a request coming from OGC members that manage the "GeoAPI" project, using the -
sur From GIS to Remote Sensing: Semi-Automatic Classification Plugin version 8 release date and dependency installation
Publié: 1 October 2023, 7:53pm CEST
This post is to announce that the new version 8 (codename "Infinity") of the Semi-Automatic Classification Plugin (SCP) for QGIS will be released the 8th of October 2023.This new version is based on a completely new Python processing framework that is Remotior Sensus, which will expand the processing capabilities of SCP, also allowing for the creation of Python scripts.
The SCP requires Remotior Sensus, GDAL, NumPy and SciPy for most functionalities. Optionally, scikit-learn and PyTorch are required for machine learning. GDAL, NumPy and SciPy should already be installed along with QGIS.It might be useful to illustrate the installation steps of these dependencies before SCP is released.Read more »

-
sur Inside the Tombs & Pyramids of Egypt
Publié: 1 October 2023, 9:54am CEST par Keir Clarke
Ramesses I was the founding pharaoh of ancient Egypt's 19th Dynasty. Ramesses burial tomb was rediscovered in the Valley of the Kings by Giovanni Belzoni in October 1817. The tomb is decorated with the Book of Gates. The Book of Gates tells the story of how a newly deceased soul travels into the next world by passing through a series of 'gates'. It is believed that the depiction of this journey -
sur How Not to Stare at the Sun
Publié: 30 September 2023, 9:32am CEST par Keir Clarke
If you have ever traveled by bus then you have probably experienced the frustration of discovering that your seat is in the direct glare of the sun and that you will now have to spend the majority of the journey squinting and attempting to shade your eyes from the sun's blinding rays.If you are a normal person you could avoid this problem simply by checking the sun's position in the sky and -
sur The Global Impact of El Niño
Publié: 29 September 2023, 10:20am CEST par Keir Clarke
This month New South Wales in Australia has been experiencing temperatures up to 16C above the Sepetember average. This is likely the start of El Niño's grip on the country. In an El Niño year Australia typically experiences drought conditions. In July the the World Meteorological Organization said there is a 90% likelihood of El Niño conditions developing this year. They say that it likely to
-
sur Fernando Quadro: Verificações de URL no GeoServer
Publié: 28 September 2023, 3:58pm CEST
A versão 2.24.x do GeoServer traz entre suas novidades as verificações de acesso externo de URL que permite controlar as verificações executadas em URLs fornecidas pelo usuário que o GeoServer usará para acessar recursos remotos.
Atualmente, as verificações são realizadas nas seguintes funcionalidades:
- Solicitações WMS GetMap, GetFeatureInfo e GetLegendGraphic com folhas de estilo SLD remotas (parâmetro SLD)
- Ícones remotos referenciados por estilos (o acesso aos ícones no diretório de dados é sempre permitido)
- Solicitações WMS GetMap e GetFeatureInfo no modo de representação de recursos (parâmetros REMOTE_OWS e REMOTE_OWS_TYPE)
- Entradas remotas WPS, como solicitações GET ou POST
Para criar as regras de verificação, o GeoServer utiliza expressões regulares. Na internet existem sites disponíveis que irão te ajudar a definir um padrão de expressão regular Java (linguagem que o GeoServer é desenvolvido) válido. Essas ferramentas podem ser usadas para interpretar, explicar e testar expressões regulares. Por exemplo:
– [https:]] (habilitar o tipo Java 8)
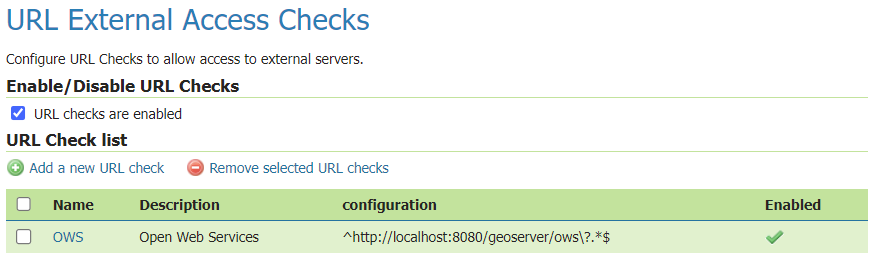
1. Configuração de verificações de URL
Navegue até a página Dados > Verificações de URL para gerenciar e configurar verificações de URL.
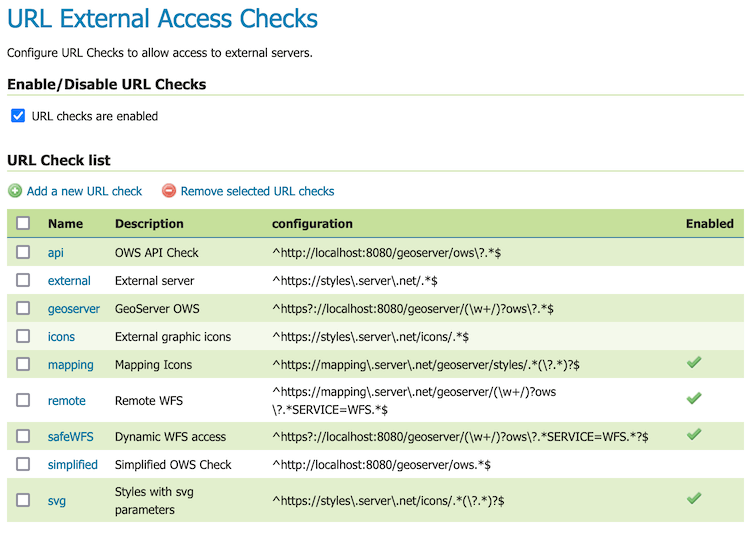
Tabela de verificações de URL
Use as opções Ativar/Desativar para habilitar este recurso de segurança:
- Quando a caixa de seleção de verificações de URL está habilitada, as verificações de URL são realizadas para limitar o acesso do GeoServer a recursos remotos, conforme descrito acima. A ativação de verificações de URL é recomendada para limitar a interação normal dos protocolos Open Web Service usados ??para ataques de Cross Site Scripting.
- Quando a caixa de seleção está desabilitada, as verificações de URL NÃO são habilitadas, o GeoServer recebe acesso irrestrito a recursos remotos. Desativar verificações de URL não é uma configuração segura ou recomendada.
2. Adicionando uma verificação baseada em expressão regular
Os botões para adicionar e remover verificações de URL podem ser encontrados na parte superior da lista de verificação de URL.
Para adicionar uma verificação de URL, pressione o botão Adicionar nova verificação. Você será solicitado a inserir os detalhes da verificação de URL (conforme descrito abaixo em Editando uma verificação).
3. Removendo uma verificação
Para remover uma verificação de URL, marque a caixa de seleção ao lado de uma ou mais linhas na lista de verificação de URL. Pressione o botão Remover verificações de URL selecionadas para remover. Você será solicitado a confirmar ou cancelar a remoção. Pressionar OK para remover as verificações de URL selecionadas.
4. Editando uma verificação
As verificações de URL podem ser configuradas, com os seguintes parâmetros para cada verificação:
- Nome: Nome da verificação, utilizado para identificá-lo na lista.
- Descrição: Descrição da verificação, para referência posterior.
- Expressão regular: Expressão regular usada para corresponder aos URLs permitidos
- Habilitado: Caixa de seleção para ativar ou desativar a verificação
Veja abaixo como é a tela de configuração:
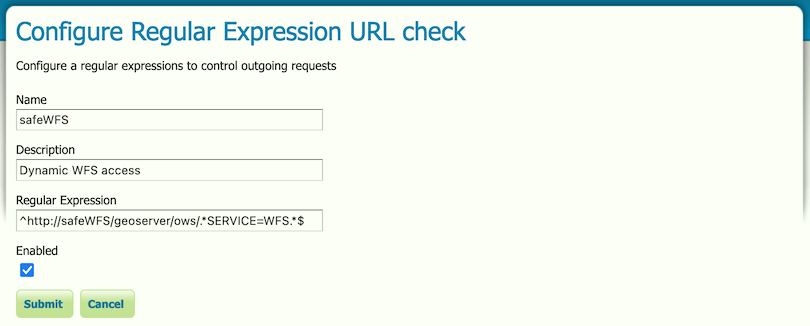
Tela de configuração de verificação de URL
5. Testando verificações
O formulário Testar verificações permite que uma URL seja verificada, informando se o acesso é permitido ou não.
Pressione o botão Testar URL para realizar as suas verificações. Se pelo menos uma verificação corresponder ao URL, ele será permitido e o teste indicará a verificação que permite o acesso. Caso contrário, será rejeitado e o teste indicará que nenhuma verificação de URL foi correspondente.
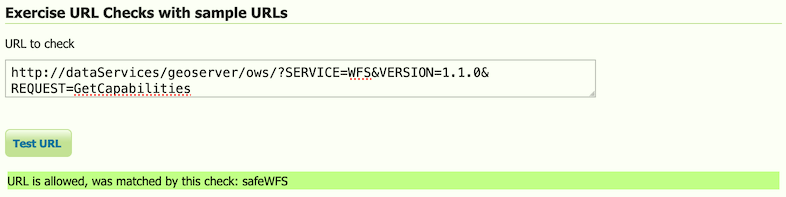
Tela de teste de verificações de URL
Fonte: GeoServer Documentation
-
sur More Medieval Murder Maps!
Publié: 28 September 2023, 9:52am CEST par Keir Clarke
On Saturday 2 Feb 1297 three Oxford University students decided to celebrate the festival of the purification of the Blessed Virgin Mary by going on a frenzied rampage. On the evening of the festival John de Skurf and his two friends Michael and Madoc ran through the streets of Oxford with swords, bows, and arrows "attacking all passers-by". One John Metescharp was shot with an arrow by
-
sur Fernando Quadro: GeoServer ACL
Publié: 27 September 2023, 9:20pm CEST
A versão 2.24.x do GeoServer traz entre suas novidades o GeoServer ACL (Access Control List), um sistema de autorização avançado.
Ele consiste em um serviço independente que gerencia regras de acesso e um plugin do GeoServer que solicita limites de autorização por solicitação.
Como administrador, você usará o GeoServer ACL para definir regras que concedem ou negam acesso a recursos publicados com base nas propriedades da solicitação de serviço, como credenciais do usuário, o tipo de serviço OWS (OGC Web Services) e as camadas solicitadas.
Essas regras podem ser tão abertas quanto conceder ou negar acesso a espaços de trabalho inteiros do GeoServer, ou tão granulares quanto especificar quais áreas geográficas e atributos de camada permitir que um usuário ou grupo de usuários específico veja.
Como usuário, você executará solicitações ao GeoServer, como WMS GetMap ou WFS GetFeatures, e o mecanismo de autorização baseado no ACL limitará a visibilidade dos recursos e conteúdos das respostas àqueles que correspondem às regras que se aplicam às propriedades da solicitação e as credenciais do usuário autenticado.
GeoServer ACL não é um provedor de autenticação. É um gerenciador de autorização que usará as credenciais do usuário autenticado, sejam elas provenientes de HTTP básico, OAuth2/OpenID Connect ou qualquer mecanismo de autenticação que o GeoServer esteja usando, para resolver as regras de acesso que se aplicam a cada solicitação específica.
GeoServer ACL é Open Source, nascido como um fork do GeoFence. Como tal, segue a mesma lógica para definir regras de acesso a dados e acesso administrativo. Portanto, se você estiver familiarizado com o GeoFence, será fácil raciocinar como o GeoServer ACL funciona.
Fonte: GeoServer ACL Project
-
sur Wuhan University receives OGC Community Impact Award
Publié: 27 September 2023, 3:00pm CEST par Simon Chester
The Open Geospatial Consortium (OGC) has announced Wuhan University, represented by Professor Peng Yue, as the latest recipient of the OGC Community Impact Award. The award was presented at the VIP Dinner of the 127th OGC Member Meeting in Singapore.
The Community Impact Award is given by OGC to highlight and recognize those members of the OGC Community who, through their exceptional leadership, volunteerism, collaboration, and investment, have had a positive impact on the wider geospatial community.
“Wuhan University and Professor Peng Yue exemplify the mission of OGC through their combined efforts in technical leadership and international consensus building,” commented OGC Chief Standards Officer, Scott Simmons. “Their recent contributions toward standardization in AI were inclusive of the breadth of OGC membership and will prove truly useful for the geospatial community.”
Wuhan University has, and continues to, make an impact within the OGC Community through their active leadership, international collaboration, and engagement across numerous OGC Collaborative Solutions and Innovation Program (COSI) Initiatives, Working Groups, Member Meetings, and the OGC China Forum. Professor Peng Yue was also the primary lead on the newly published Training Data Markup Language for Artificial Intelligence (Part 1) Standard.
The OGC Community Impact award highlights the importance of collaboration, volunteering time and energy, advancing technologies and standards, raising awareness, and helping solve critical issues across the geospatial community. Wuhan University exemplifies all of these qualities in their work to drive innovation and standards for AI/ML and associated training data, and their efforts in leading the OGC Community in China.
The post Wuhan University receives OGC Community Impact Award appeared first on Open Geospatial Consortium.
-
sur The Same Size As
Publié: 27 September 2023, 8:12am CEST par Keir Clarke
Gibraltar (left) compared to Central Park (right)Same Scales is an interactive map which allows you to compare two different locations side-by-side at the same scale. Comparing locations on the same map can be difficult because of the distortions caused by map projections. Same Scales helps you compare two different locations by showing each at the same scale on two different maps placed
-
sur OGC Adopts Training Data Markup Language for Artificial Intelligence Conceptual Model as Official Standard
Publié: 26 September 2023, 3:00pm CEST par Simon Chester
The Open Geospatial Consortium (OGC) is excited to announce that the OGC Membership has approved the OGC Training Data Markup Language for Artificial Intelligence (TrainingDML-AI) Part 1: Conceptual Model for adoption as an official OGC Standard. The Standard defines the conceptual model for standardized geospatial training data for Machine Learning.
Training data plays a fundamental role in Earth Observation (EO) Artificial Intelligence Machine Learning (AI/ML) applications, especially Deep Learning (DL). It is used to train, validate, and test AI/ML models. Understanding the source and applicability of training data allows for better understanding of the results of AI/ML operations.
To maximize the interoperability and re-usability of geospatial training data, the TrainingDML-AI Standard defines a model and encodings consistent with the OGC Standards baseline to exchange and retrieve the training data via the Web. Part 1 of the Standard contains the Conceptual Model, as well as example JSON encodings. Future Parts of the Standard will cover other encodings.
Additionally, the Standard provides detailed metadata for formalizing the information model of training data. This includes but is not limited to the following aspects:
- How the training data is prepared, such as provenance and quality;
- How to specify different metadata used for different ML tasks;
- How to differentiate the high-level training data information model and extended information models specific to various ML applications;
- How to describe the version, license, and training data size;
- How to introduce external classification schemes and flexible means for representing ground-truth labeling.
OGC Members interested in staying up to date on future progress of this standard, or contributing to its development, are encouraged to join the Training Data Markup Language for AI Standards Working Group via the OGC Portal. Non-OGC members who would like to know more about participating in this SWG are encouraged to contact the OGC Standards Program.
As with any OGC standard, the open OGC Training Data Markup Language for Artificial Intelligence (TrainingDML-AI) Part 1: Conceptual Model Standard is free to download and implement.
The post OGC Adopts Training Data Markup Language for Artificial Intelligence Conceptual Model as Official Standard appeared first on Open Geospatial Consortium.
-
sur The Global Problem of Forever Chemicals
Publié: 26 September 2023, 9:07am CEST par Keir Clarke
Forever chemicals are almost everywhere. If you search for PFAS contamination in any country, continent, or wildlife species around the world, the chances are you will find it. This revelation comes after a massive analysis of data by the Environmental Working Group (EWG) has exposed the global scale of the PFAS problem. PFAS or toxic "forever chemicals" are harmful substances that pollute the
-
sur KAN T&IT Blog: Análisis de calidad de información geoespacial. BID Perú.
Publié: 25 September 2023, 9:21pm CEST
En el marco del convenio con el Banco Interamericano de Desarrollo sede Perú (BID Perú), se llevó a cabo el proyecto de análisis de calidad de información geoespacial generados en el contexto del programa “Apoyo a la Plataforma Nacional de Ciudades Sostenibles y Cambio Climático en Lima” para el Ministerio de Ambiente de la República de Perú (MINAM). Este proyecto consistió en realizar el control de calidad de más de 400 capas de información geoespacial en función de los requerimientos establecidos en la familia de normas ISO 19100 que apuntan a regular y a normalizar la generación de información geoespacial con el objetivo de garantizar su interoperabilidad. El objetivo final de este trabajo fue aportar al proceso de mejora de la calidad e interoperabilidad de los datos al Plan Nacional de Adaptación al Cambio Climático (NAP, por sus siglas en inglés) en Perú.
El NAP consiste en un exhaustivo documento en donde se plasman los principales lineamientos para planificar la implementación de medidas diseñadas específicamente para reducir los riesgos derivados del impacto del cambio climático. A su vez, este documento pretende ser una fuente de información disponible para la toma de decisiones a nivel gubernamental en torno a ésta problemática. En este sentido, entre los objetivos que persigue el NAP, se presentan los siguientes:
1: Integrar y articular diversos instrumentos de gestión: Estrategia Regional de Cambio Climático, NDC y Planes Locales de Adaptación al Cambio Climático.
2: Desarrollar un análisis de riesgos climáticos a nivel nacional y regional para 5 áreas temáticas: Agua, Bosques, Agricultura, Pesca y Acuicultura y Salud; y para 4 amenazas clave: movimientos en masa, inundaciones, cambio en las condiciones de aridez y retroceso glaciar.
3: Actualizar las medidas de adaptación establecidas en cada uno de los instrumentos de gestión, de acuerdo con las necesidades de las poblaciones y los ecosistemas.
Para llevar a cabo el proceso de revisión y control de calidad de la información generada en este contexto, se trabajó en conjunto con las empresas productoras de la información geoespacial y en constante comunicación con representantes del BID Perú. Estas empresas habían sido convocadas por el Ministerio de Ambiente de Perú en convenio con BID y la organización World Wide Fund for Nature (WWF) con el objetivo de analizar y generar información para: el “Plan de Adaptación Costera para el Área Metropolitana de Lima (AML)”, los “Estudios base sobre riesgo de desastres por riesgos naturales y crecimiento urbano en el AML” y los “Estudios de análisis urbanístico, prefactibilidad y diseños constructivos para acciones estratégicas de accesibilidad, multimodalidad y desarrollo orientado al transporte en el Sistema Integrado de Transporte (SIT) de Lima y Callao”. Toda la información geoespacial generada en el marco de estos tres productos fue el objeto de análisis de la consultoría realizada por Kan.
La premisa que guió el desarrollo de este proyecto fue alcanzar un nivel de calidad del dato óptimo que permitiera a los organismos disponibilizar la información producida garantizando el libre acceso, la interoperabilidad, la confiabilidad y la calidad.
En primera instancia se presentaron requisitos para la presentación de la información para asegurar el libre acceso. En este sentido, se solicitó que la información pudiera ser consultada a través de software libres, para que pudieran ser consumidos sin necesidad de pagar una licencia para hacerlo, siendo el formato “geopackage” el indicado para cumplir esta condición.
El análisis de la información se basó en una metodología específica desarrollada por el equipo SIG de Kan, fundamentada en las normas 19115-3, 19139, 19110 y 19157 que hacen referencia a los formatos e implementación de metadatos, a la catalogación de objetos geográficos y a la calidad del dato, respectivamente. Todo el contenido de estas normas se plasmaron en matrices analíticas que luego fueron aplicadas a cada una de las capas de información. Estas matrices permitieron relevar el estado de la información en relación a: la completud de sus metadatos, formatos de interoperabilidad de la información, calidad del dato, referencias sobre su linaje, uso y propósito, su consistencia lógica y topológica, el análisis de sus atributos, entre otros puntos. En total, se establecieron seis categorías de análisis:
A: Compatibilidad del conjunto de datos
B: Interoperabilidad del conjunto de datos
C: Interoperabilidad conjunto de metadatos
D: Interoperabilidad – Metadatos de la capa
E: Compatibilidad de la capa
F: Calidad del dato
Para cada categoría se definieron una serie de elementos de análisis que en total suman 47 ítems. El objetivo final de esta revisión fue cuantificar la usabilidad de la información geográfica producida, estableciendo un rango de usabilidad. Este rango va entre -1 y 1, siendo los valores cercanos a -1 aquellos que incumplen en más de un 50% los elementos establecidos para el análisis y los valores cercanos a 1 aquellos que cumplen en más de un 50% los elementos. De esta forma se obtuvo un resultado parcial de usabilidad por capa y un resultado global de usabilidad para el conjunto de datos. Luego de haber realizado el análisis, se confrontaron los resultados obtenidos con lo establecido por las normas, de esta manera se creó un documento de recomendaciones y sugerencias para la mejora de la calidad e interoperabilidad del dato.
Este proyecto permitió conocer la calidad de la información generada en el proyecto e identificar aquellos aspectos posibles de mejorar para garantizar la interoperabilidad de la información. Luego de este proceso de análisis, las empresas aplicaron las recomendaciones y sugerencias realizadas por el equipo SIG de Kan con el que alcanzaron un nivel óptimo de calidad del dato.


-
sur A Cool, Shady Spot with a Breeze
Publié: 25 September 2023, 9:51am CEST par Keir Clarke
One result of global heating is that nearly every summer most of us spend some time thinking about places we can go to avoid the oppressive heat. In recent years a number of interactive maps have been released which can help you find shady places to relax and escape the direct sun. These include popular shade maps such as JveuxDuSoleil, ShadeMap and Shadowmap. Now a new interactive map goes a
-
sur GeoServer Team: GeoServer 2.24-RC Release
Publié: 25 September 2023, 2:00am CEST
GeoServer 2.24-RC release is now available with downloads (bin, war, windows), along with docs and extensions.
This is a release candidate intended for public review and feedback, made in conjunction with GeoTools 30-RC, GeoWebCache 1.24-RC, mapfish-print-v2 2.3-RC and geofence-3.7-RC.
Thanks to Andrea Aime (GeoSolutions) and Jody Garnett (GeoCat) for working on making this release candidate.
Release candidate public testing and feedbackTesting and providing feedback on releases is part of the open-source social contract. The development team (and their employers and customers) are responsible for sharing this great technology with you.
The collaborative part of open-source happens now - we ask you to test this release candidate in your environment and with your data. Try out the new features, double check if the documentation makes sense, and most importantly let us know!
If you spot something that is incorrect or not working do not assume it is obvious and we will notice. We request and depend on your email and bug reports at this time. If you are working with commercial support your provider is expected to participate on your behalf.
Keeping GeoServer sustainable requires a long term community commitment. If you are unable to contribute time, sponsorship options are available via OSGeo.
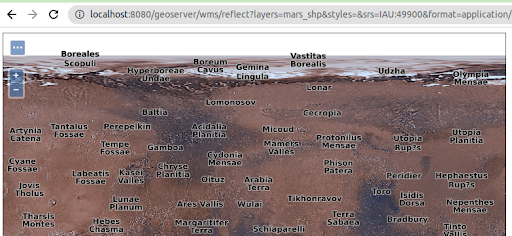
IAU authority support and EPSG assumption removalThe new gs-iau extension module provides support for planetary CRSs, sourced from the International Astronomical Union. This allows to manage GIS data over the Moon, Mars, or even the Sun, with well known, officially supported codes.
In addition to that, many bug fixes occurred in the management of CRSs and their text representations (plain codes, URL, URIs) so that the EPSG authority is no longer assumed to be the only possibility, in a variety of places, such as, for example, GML output. The code base has seen this assumption for twenty years long, and while we made a good effort to eliminate the assumption, it could be still lurking in some places. Please test and let us know.
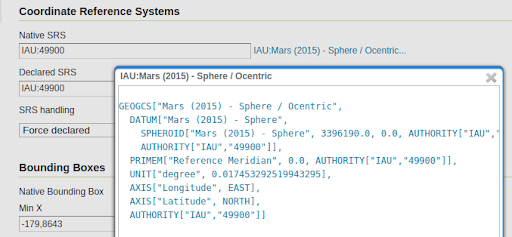
To learn more about this extension please visit the user-guide documentation. Thanks to Andrea Aime (GeoSolutions) for working on this activity.
- GSIP-219 - Multiple CRS authority support, planetary CRS
- GEOS-11075 IAU authority : planetary CRS support
- GEOS-11001 Support other CRS authories in WFS
- GEOS-11002 Support other CRS authorities in WMS
- GEOS-11056 Support other CRS authorities in WCS
- GEOS-11064 Support other CRS authorities in WPS
- GEOS-11066 Support other CRS authorities in importer
- GEOS-11076 SRSList should show authorities other than EPSG, if available
- GEOS-10970 CatalogBuilder cannot handle CRS in authorities other than EPSG
- GEOS-10971 XStreamPersister cannot save CRS references using authorities other than EPSG
- GEOS-10972 Resource page CRS editors would not work with authorities other than EPSG
The printing extension has seen big changes - with a host of new functionality developed by GeoSolutions over the years. With this update the printing module can now be used out-of-the-box by GeoNode and MapStore (no more customization required).
- Max number of columns configuration for multi column legends
- Simple colored box icon in legends
- Explicit support of Geoserver CQL_FILTER parameter (also with layers merge support)
- Legend fitting
- Don’t break legend items
- Reorder legends block in columns
- Images content
- Dynamic images page
- Multipage legends
- Custom intervals in ScalebarBlock
- Clustering Support
- HTML rendering in text blocks
- Extra Pages
- Group Rendering in attribute blocks
- Skip rendering of pages
- Automatic X-Forwarded-For
- Parsing of Base64 encoded images
Thanks to GeoSolutions for adding functionality to mapfish-print for the GeoNode project. Jody Garnett (GeoCat) was responsible for updating the mapfish print-lib for Java 11 and gathering up the functionality from different branches and forks.
- GEOS-11132 mapfish-print-v2 2.3-RC
This release adds a new Check URL facility under the Security menu. This allows administrators to manage OGC Service use of external resources.
For information and examples on how to use the URL Check page, visit user guide documentation.
- GSIP 218 - Control remote HTTP requests sent by GeoTools \ GeoServer
- GEOS-10949 Control remote resources accessed by GeoServer
- GEOS-11048 Improve URL checking
The GeoTools project moved away from using the “org.opengis” package after complaints from OGC GeoAPI working group representatives, using the same package name. Interfaces have been moved to the “org.geotool.api” package, along with some general clean up.
While this does not affect GeoServer users directly, it’s of consequence for those that have installation with custom, home grown plugins that might have to be migrated as a consequence. For those, the GeoTools project offers a migration guide, along with a refactoring script that might perform the migration for you, or else, get you close to a working point. GeoServer itself has been migrated using these scripts, with minimal manual intervention.
For more details, and access to the migration script, please see the GeoTools 30 upgrade guide.
Thanks to Jody Garnett (GeoCat), Andrea Aime (GeoSolutions), and Ian Turton (ASTUN Technologies) for all the hard work on this activity. We would also like to thank the Open Source Geospatial Foundation for setting up a cross-project activity and financial support to address this requested change.
- GEOS-11070 Upgrading to GeoTools 30.x series, refactor to org.geotools.api interfaces
While not strictly part of this release, it’s interesting to know about some community module advances that can be found only in the the 2.24.x series.
Two extensions are no longer actively supported and are now available as community modules:
- GEOS-10960 Downgrade imagemap module to community
- GEOS-10961 Downgrade xslt extension to community
The following community modules have been removed (due to lack of interest):
- GEOS-10962 Remove wms-eo community module
- GEOS-10963 Remove SAML community module
- GEOS-10966 Remove importer-fgdb community module
- GEOS-10967 Remove teradata community module
- GEOS-10977 Remove wmts-styles community module
- GEOS-10978 Remove nsg-wmts community module
- GEOS-10984 Remove ows-simulate community module
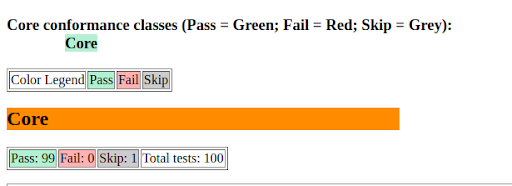
The OGC API community module keeps improving. In particular, thanks to the GeoNovum sponsorship, GeoSolutions made the OGC API Features module pass the OGC CITE compliance tests, for the “core” and “CRS by reference” conformance classes. Along with this work, other significant changes occurred:
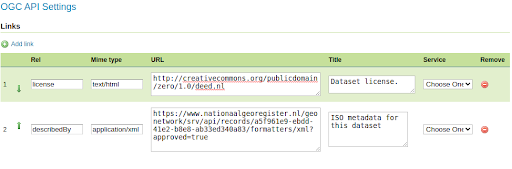
- Made the API version number appear in the service path, easing future upgrades
- Support for configurable links, required to get INSPIRE download service compliance.
In addition to that, the new “search” experimental conformance class allows to POST complex searches against collections, as a JSON document, in a way similar to the STAC API.
Those interested in this work are encouraged to contact Andrea Aime (GeoSolutions).
- GEOS-10924 Support JSON-FG draft encoding in OGC API - Features
- GEOS-11045 Implement proposal “OGC API - Features - Part n: Query by IDs”
- GEOS-10882 Add an option to remove trailing slash match in OGC APIs
- GEOS-10887 Add angle brackets to OGC API CRS Header
- GEOS-10892 Allow configuring custom links for OGC API “collections” and single collection resources
- GEOS-10895 Make OGC API CITE compliant even if the trailing slash is disabled: landing page exception
- GEOS-11058 Support other CRS authorities in OGC APIs
- GEOS-10909 Don’t link from OGC API Features to WFS 2.0 DescribeFeatureType output, if WFS is disabled
- GEOS-10954 Split ogcapi community module package into single functionality packages
For folks working with very large catalogues some improvement from cloud native geoserver are now available to reduce startup time.
Thanks to Gabriel Roldan for folding this improvement into a community module for the rest of the GeoServer community to enjoy.
- GEOS-11049 Community module “datadir catalog loader”
The GeoServer Access Control List project is an independent application service that manages access rules, and a GeoServer plugin that requests authorization limits on a per-request basis.
Gabriel Roldan is the contact point for anyone interested in this work.
The vector mosaic and FlatGeoBuf modules sport significant performance improvementsFlatGeoBuf is a “A performant binary encoding for geographic data”, a single file format that also manages to be cloud native and include a spatial index. GeoServer provides access to this format thought the WFS FlatGeobuf output format, which not only can write the format, but also read it as a standard data store.
The Vector Mosaic datastore supports creation of mosaics made of single file vector data, useful in situations where the access to data is targeted to sub-pages of a larger data set (e.g., data for a single time, or a single customer, or a single data collect, out of a very large uniform set of vectors) and the database storage for it is become either too slow, or too expensive.
These two modules make a great combo for those in need to handle very large vector datasets, by storing the FlatGeoBuf on cheap storage.
In particular, the FlatGeoBuf module saw speed improvements that made it the new “fastest vector format” for cases where one needs to display a large data set, all at once, on screen (PostGIS remains the king of the hill for anything that needs sophisticated filtering instead).
For reference, we have timed rendering 4 million tiny polygons out of a precision farming collect, using a 7 classes quantile based SLDs. Here is a tiny excerpt of the map:
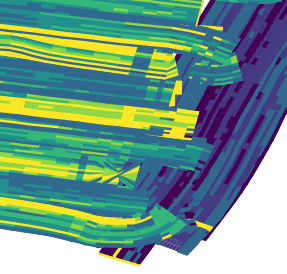
And here are the timings to render the full set of polygons, putting them all on screen, at the same time, with a single GetMap request:
- PostGIS, 113 seconds
- Shapefile, 41 seconds
- Flatgeobuf, 36 seconds
The tuning is not complete, more optimizations are possible. Interested? Andrea Aime is the contact point for this work.
Release notesNew Feature:
- GEOS-10992 Make GWC UI for disk quota expose HSQLDB, remove H2, automatically update existing installations
- GEOS-11000 WPS process to provide elevation profile for a linestring
Improvement:
- GEOS-10926 Community Module Proxy-Base-Ext
- GEOS-10934 CSW does not show title/abstract on welcome page
- GEOS-10973 DWITHIN delegation to mongoDB
- GEOS-10999 Make GeoServer KML module rely on HSQLDB instead of H2
- GEOS-11005 Make sure H2 dependencies are included in the packages of optional modules that still need it
- GEOS-11059 Map preview should not assume EPSG authority
- GEOS-11081 Add option to disable GetFeatureInfo transforming raster layers
- GEOS-11087 Fix IsolatedCatalogFacade unnecessary performance overhead
- GEOS-11090 Use Catalog streaming API in WorkspacePage
- GEOS-11099 ElasticSearch DataStore Documentation Update for RESPONSE_BUFFER_LIMIT
- GEOS-11100 Add opacity parameter to the layer definitions in WPS-Download download maps
- GEOS-11102 Allow configuration of the CSV date format
- GEOS-11116 GetMap/GetFeatureInfo with groups and view params can with mismatched layers/params
Bug:
- GEOS-8162 CSV Data store does not support relative store paths
- GEOS-10452 Use of Active Directory authorisation seems broken since 2.15.2 (LDAP still works)
- GEOS-10874 Log4J: Windows binary zip release file with log4j-1.2.14.jar
- GEOS-10875 Disk Quota JDBC password shown in plaintext
- GEOS-10899 Features template escapes twice HTML produced outputs
- GEOS-10903 WMS filtering with Filter 2.0 fails
- GEOS-10921 Double escaping of HTML with enabled features-templating
- GEOS-10922 Features templating exception on text/plain format
- GEOS-10928 Draft JSON-FG Implementation for OGC API - Features
- GEOS-10936 YSLD and OGC API modules are incompatible
- GEOS-10937 JSON-FG reprojected output should respect authority axis order
- GEOS-10958 Update Spotbugs to 4.7.3
- GEOS-10981 Slow CSW GetRecords requests with JDBC Configuration
- GEOS-10985 Backup Restore of GeoServer catalog is broken with GeoServer 2.23.0 and StAXSource
- GEOS-10993 Disabled resources can cause incorrect CSW GetRecords response
- GEOS-11015 geopackage wfs output builds up tmp files over time
- GEOS-11016 Docker nightly builds use outdated GeoServer war
- GEOS-11033 WCS DescribeCoverage ReferencedEnvelope with null crs
- GEOS-11060 charts and mssql extension zips are missing the extension
Task:
- GEOS-11091 Upgrade spring-security to 5.7.10
- GEOS-11094 Bump org.hsqldb:hsqldb:2.7.1 to 2.7.2
- GEOS-11103 Upgrade Hazelcast version to 5.3.x
- GEOS-10248 WPSInitializer NPE failure during GeoServer reload
- GEOS-10904 Bump jettison from 1.5.3 to 1.5.4
- GEOS-10907 Update spring.version from 5.3.25 to 5.3.26
- GEOS-10941 Update ErrorProne to 2.18
- GEOS-10987 Bump xalan:xalan and xalan:serializer from 2.7.2 to 2.7.3
- GEOS-10988 Update spring.version from 5.3.26 to 5.3.27 and spring-integration.version from 5.5.17 to 5.5.18
- GEOS-11010 Upgrade guava from 30.1 to 32.0.0
- GEOS-11011 Upgrade postgresql from 42.4.3 to 42.6.0
- GEOS-11012 Upgrade commons-collections4 from 4.2 to 4.4
- GEOS-11018 Upgrade commons-lang3 from 3.8.1 to 3.12.0
- GEOS-11019 Upgrade commons-io from 2.8.0 to 2.12.0
- GEOS-11020 Add test scope to mockito-core dependency
- GEOS-11062 Upgrade [httpclient] from 4.5.13 to 4.5.14
- GEOS-11063 Upgrade [httpcore] from 4.4.10 to 4.4.16
- GEOS-11067 Upgrade wiremock to 2.35.0
- GEOS-11080 Remove ASCII grid output format from WCS
- GEOS-11084 Update text field css styling to look visually distinct
- GEOS-11092 acme-ldap.jar is compiled with Java 8
For the complete list see 2.24-RC release notes.
About GeoServer 2.24 SeriesAdditional information on GeoServer 2.24 series:
- Control remote HTTP requests sent by GeoTools/GeoServer
- Multiple CRS authority support, planetary CRS
Release notes: ( 2.24-RC )
-
sur Sean Gillies: Bear 100 race week
Publié: 24 September 2023, 11:06pm CEST
This is it, race week. Wednesday I'm flying to Salt Lake City and driving to Logan. Friday before dawn I'm headed up the trail to Bear Lake.
Week ~5 was a rest week at the end of a big training block. I biked and ran for less than 4 hours. Week ~4 I ran for 12 hours, 53 miles, and 8,500 feet of elevation gain. Much of that was above 10,000 feet in Rocky Mountain National Park, my go-to for accessible high country. I ran up to Granite Pass, 12,100 feet, just below the Longs Peak boulder field, and test drove the gels that will be served at the Bear 100. Spring Energy's Awesome Sauce is good! I could eat them all day. Spring's Speednut product is a bit harder for me to stomach. One of those every few hours might be all I can take.
At the end of week ~4 I did some volunteering at the Black Squirrel Trail Half-Marathon, a race I've run several times. I helped park cars in the pre-race darkness and get first-timers pointed toward registration and the starting line. I saw the Milky Way in the clear, dark early morning sky. I caught up with the race directors, Nick and Brad, and saw other friends in the first mile of the course. Volunteering at events is always needed and fun. I recommend it.
In week ~3, I ran for 9.5 hours, 42 miles, and 5,700 feet. In the interest of fine tuning, I went out in the heat of the day and took my poles. In week ~2, last week, I got the new COVID vaccination and did less running and more yoga and body-weight strength and mobility exercise. Split squats with dumbbells made me sore, but I am over it now.
Where am I at now, in week ~1? I think I have enough experience and adequate training this year to finish. Three events of 40 miles, including one overnight, and one at very high elevation. The heart palpitations that were troubling me last year almost never occur now. I'm well over my most recent sinus infection. I've got all the gear I need and am physically and psychologically prepared for hot weather, cold weather, and rain or snow. The race will have more food than I can eat along the way and will deliver my five drop bags to aid stations and the finish line. I don't have a crew or pacer for the run, but think I'll be fine without. Reality is that it's harder to have these as you get older. Your family is busy and your friends are busy with their own families. I'm shy, but not shy about forming small ad-hoc teams on the trail, so I expect to be fine on that front.
The Bear 100 Endurance Run starts with 5,000 feet of climbing in the first 10 miles. I can do this. At least it's at the beginning and not the end. That leaves only 17,000 feet for the last 90 miles. I'm joking about this to keep my spirits up. This will be super hard, a big bump up from my hardest week of training, and I'll need to go even deeper into the unknown than I've done at the Never Summer 100K. I'm ready to see what happens out there.
The one thing that's concerning me is that I have a persistent ache in my right foot. Yesterday I went out for an hour in my Nike Terra Kiger's to see if I might want to bring them along as a shoe option. The answer is no: they don't have enough padding for my foot in its current condition. I feel worse today than yesterday. There's at least a small chance that I have a bone stress problem. The pain and swelling is right on the "N-spot". I'm not going to let this stop me from starting and will see how it goes on Friday. I've got a pretty high pain threshold and will be stashing some ibuprofen in my later drop bags. Cold rain and cold, numb feet, if the forecast holds, might help, too. How is that for positive thinking?
If you want to follow along on Friday and Saturday, the live tracking should be at [https:]] . My bib number is 314. That website currently shows last year's race. I expect that this year's progress will be shown on Friday morning.
-
sur Sean Gillies: Status update
Publié: 24 September 2023, 6:10pm CEST
I'm pausing my job search and open source work to focus on next weekend's adventure. Forgive me if I don't respond before October 5-6. After I'm back I'll be prioritizing the job search over open source. Not for long, I hope!
-
sur Restricting the Right to Protest
Publié: 23 September 2023, 9:39am CEST par Keir Clarke
The right to protest is being restricted in countries around the world. Amnesty International's new interactive map, called Protect the Protest, highlights the growing numbers of human rights violations which are being committed by countries around the world aimed at removing the rights of citizens to legally protest. The Protect the Protest map sheds light on the types of repression that are -
sur The Royal Parks of London
Publié: 22 September 2023, 10:04am CEST par Keir Clarke
There are eight Royal Parks in London. The parks are owned by the Crown and managed by the Royal Parks charity. The parks originated from land that the royal family once used for recreation and hunting. Over time, these lands were enclosed and became known as the Royal Parks. The public can enter and use the parks for free but public access to the parks remains at the grace and favor of the -
sur The Global Migration Explorer
Publié: 21 September 2023, 9:46am CEST par Keir Clarke
In both American and European politics immigration has become one of the most centrally contested issues. However, according to the authors of World’s human migration patterns in 2000–2019 "a global-scale, high-resolution quantification of migration and its major drivers for the recent decades (has) remained missing" from this political debate. They have therefore created their own global
-
sur QGIS Blog: QGIS Grant Programme 2023 Update
Publié: 20 September 2023, 8:29pm CEST
Thanks to our generous donors and sustaining members, we are in the wonderful position to be able to further extend our 2023 Grant Programme and to fund two additional projects that came in very close 5th and 6th in the voting results:
- QEP#261 Cachable provider metadata API — or how to
 the QGIS loading times
 - QEP#236 Unification of all geometric and topological verification methods
On behalf of the QGIS.ORG project, I would like to thank everyone who helped with the fund raising and everyone who stepped up and joined our donor and sustaining membership programme.

- QEP#261 Cachable provider metadata API — or how to
-
sur GeoSolutions: FREE Webinar: MapStore for Local Governments – Cleveland Metroparks Case Study
Publié: 20 September 2023, 5:39pm CEST
You must be logged into the site to view this content.
-
sur Live 2 Years Longer with Better Air Quality
Publié: 20 September 2023, 10:59am CEST par Keir Clarke
Around the world life expectancy could be raised on average by 2 years and 3 months if air quality was improved to meet the World Health Organization guideline. In countries with really high levels of fine particulate pollution (such as India & Bangladesh) life expectancy could be increased by over 5 years. The Air Quality Life Index looks at air quality levels around the world and calculates -
sur Olympic Stadia Travel Times
Publié: 19 September 2023, 8:07am CEST par Keir Clarke
Brisbane has been awarded the 2032 Olympic and Paralympic Games. One of Brisbane's goals in hosting the games is to be “more equal and accessible”. In order to analyze how accessible the Brisbane games will actually be the data consulting firm Smash Delta has been visualizing current travel times to two of the Brisbane games stadia and exploring how those travel times will be improved thanks to
-
sur GeoSolutions: GeoSolutions USA at National States Geographic Information Council (NSGIC) 25-28 SEP
Publié: 18 September 2023, 3:51pm CEST
You must be logged into the site to view this content.
-
sur A Year of Wildfire in Europe
Publié: 18 September 2023, 10:06am CEST par Keir Clarke
In July Europe witnessed its largest wildfire in 23 years. The Dadia forest fire in Greece burned 97,000 hectares and killed 20 people. The large number of wildfires in Europe this year follows the even larger number of fires last year, a year which saw the second largest total burnt area this century. So far.Czech news website Aktuáln?.cz has analyzed satellite data of European Union wildfires
-
sur Free and Open Source GIS Ramblings: Data engineering for Mobility Data Science (with Python and DVC)
Publié: 16 September 2023, 5:28pm CEST
This summer, I had the honor to — once again — speak at the OpenGeoHub Summer School. This time, I wanted to challenge the students and myself by not just doing MovingPandas but by introducing both MovingPandas and DVC for Mobility Data Science.
I’ve previously written about DVC and how it may be used to track geoprocessing workflows with QGIS & DVC. In my summer school session, we go into details on how to use DVC to keep track of MovingPandas movement data analytics workflow.
Here is the recording of the session live stream and you can find the materials at [https:]]
-
sur How Families Live Around the World.
Publié: 16 September 2023, 10:14am CEST par Keir Clarke
Gapminder's Dollar Street is an amazing project which has photographed and documented 264 family homes in 50 countries around the world. The resulting pictures provide a truly fascinating insight into the everyday lives of people around the world. Around six years years ago Anna Rosling Rönnlund began sending photographers to visit families in all corners of the world. In each visit to a -
sur The Unknown Pleasures of Population Density
Publié: 15 September 2023, 8:06am CEST par Keir Clarke
This ridgeline plot map visualizes the population density of Germany. The map was made using Baryon's Population Density Ridgeline Plots for Every Country in the World. Type your county name into this app and you can see your country's population density visualized as a ridgeline plot. The most famous Ridgeline plot (or joy-plot - as they are sometimes called) appears on Joy Division's famous
-
sur Marco Bernasocchi: OPENGIS.ch and Oslandia: A Strategic Partnership to Advance QField and QFieldCloud
Publié: 15 September 2023, 7:00am CEST

We are extremely happy to announce that we have partnered strategically with Oslandia to push the leading #fieldwork app #QField even further.
In the world of fieldwork, accuracy and efficiency are paramount. As GIS specialists, we understand the importance of reliable tools that streamline data collection and analysis processes. That’s why we are thrilled to join forces with Oslandia, a company that shares our passion for open-source development and innovation.
Embracing Open Source DevelopmentAt OPENGIS.ch, we have always been committed to the principles of true open-source development. We firmly believe collaboration and shared knowledge drive progress in the GIS community. With Oslandia, we have found a partner who shares our values and cares as much as we do about the QGIS ecosystem.
QGIS, the world’s most popular open-source geographic information system software, has already significantly impacted the GIS industry, providing users with versatile mapping tools and capabilities and is the base upon which QField is built. As main contributors to #QGIS, both OPENGIS.ch and Oslandia are dedicated to driving its growth and ensuring its availability to all.
Advancing QField and QFieldCloud Together
QField, with almost 1 million downloads, is the leading app for fieldwork tasks. It empowers professionals in various sectors, such as environmental research, agriculture, urban planning, and disaster management, to efficiently collect data and conduct analyses in the field. With our strategic partnership with Oslandia, we are committed to pushing the boundaries of QField even further.
Our joint efforts will ensure that QField will keep setting trends in the industry, surpassing the evolving needs of GIS specialists and empowering them to excel in their fieldwork tasks.
A Synergy of ExpertiseThe collaboration between OPENGIS.ch and Oslandia represents a true synergy of expertise. Our combined capabilities will enable us to tackle complex challenges quickly and deliver cutting-edge solutions that address the unique requirements for seamless #fielwork.
ConclusionAt OPENGIS.ch, we are excited about the opportunities our partnership with Oslandia brings. Together, we will continue championing open-source development, empowering GIS specialists in each sector to perform their fieldwork tasks more effectively and efficiently.
With QField as our flagship app, we are confident that this strategic collaboration will result in even greater advancements, benefiting our target audience of surveying professionals, fieldwork experts, and GIS specialists, as well as casual users who need a user-friendly solution for their projects.
Join us in celebrating this exciting new chapter as we embark on a shared journey towards innovation and excellence in fieldwork applications.

-
sur Oslandia: Strategic partnership agreement between Oslandia and OpenGIS.ch on QField
Publié: 14 September 2023, 7:30pm CEST
Who are we? For those unfamiliar with Oslandia, OpenGIS.ch, or even QGIS, let’s refresh your memory:
 Oslandia is a French company specializing in open-source Geographic Information Systems (GIS). Since our establishment in 2009, we have been providing consulting, development, and training services in GIS, with reknown expertise. Oslandia is a dedicated open-source player and the largest contributor to the QGIS solution in France.
 As for OPENGIS.ch, they are a Swiss company specializing in the development of open-source GIS software. Founded in 2011, OPENGIS.ch is the largest Swiss contributor to QGIS. OPENGIS.ch is the creator of QField, the most widely used open-source mobile GIS solution for geomatics professionals.
OPENGIS.ch also offers QFieldCloud as a SaaS or on-premise solution for collaborative field project management.
 Some may still be unfamiliar with #QGIS ?
It is a free and open-source Geographic Information System that allows creating, editing, visualizing, analyzing, and publicating geospatial data. QGIS is a cross-platform software that can be used on desktops, servers, as a web application, or as a development library.
QGIS is open-source software developed by multiple contributors worldwide. It is an official project of the OpenSource Geospatial Foundation (OSGeo) and is supported by the QGIS.org association. See [https:]]
A Partnership? Today, we are delighted to announce our strategic partnership aimed at strengthening and promoting QField, the mobile application companion of QGIS Desktop.
 This partnership between Oslandia and OPENGIS.ch is a significant step for QField and open-source mobile GIS solutions. It will consolidate the platform, providing users worldwide with simplified access to effective tools for collecting, managing, and analyzing geospatial data in the field.
 QField, developed by OPENGIS.ch, is an advanced open-source mobile application that enables GIS professionals to work efficiently in the field, using interactive maps, collecting real-time data, and managing complex geospatial projects on Android, iOS, or Windows mobile devices.
 QField is cross-platform, based on the QGIS engine, facilitating seamless project sharing between desktop, mobile, and web applications.
Reactions QFieldCloud ( [https:]] ), the collaborative web platform for QField project management, will also benefit from this partnership and will be enhanced to complement the range of tools within the QGIS platform.
 At Oslandia, we are thrilled to collaborate with OPENGIS.ch on QGIS technologies. Oslandia shares with OPENGIS.ch a common vision of open-source software development: a strong involvement in development communities, work in respect with the ecosystem, an highly skilled expertise, and a commitment to industrial-quality, robust, and sustainable software development.
 With this partnership, we aim to offer our clients the highest expertise across all software components of the QGIS platform, from data capture to dissemination.
 On the OpenGIS.ch side, Marco Bernasocchi adds:
Commitment to open sourceThe partnership with Oslandia represents a crucial step in our mission to provide leading mobile GIS tools with a genuine OpenSource credo. The complementarity of our skills will accelerate the development of QField and QFieldCloud and meet the growing needs of our users.
Ready for field mapping ? Both companies are committed to continue supporting and improving QField and QFieldCloud as open-source projects, ensuring universal access to this high-quality mobile GIS solution without vendor dependencies.
 And now, are you ready for the field?
So, download QField ( [https:]] ), create projects in QGIS, and share them on QFieldCloud!
 If you need training, support, maintenance, deployment, or specific feature development on these platforms, don’t hesitate to contact us. You will have access to the best experts available: infos+mobile@oslandia.com.
-
sur Making The Data Count, Not Just Counting The Data
Publié: 14 September 2023, 4:05pm CEST par Simon Chester
After three years of collaborative development, the release of the first iteration of the IGIF-(M)SDI Maturity Roadmap is a milestone moment in exploiting geospatial data for the inclusive socio-economic development of nations. This Maturity Roadmap – involving the UK Hydrographic Office (UKHO) as lead sponsor, as well as the Open Geospatial Consortium (OGC), the World Bank Group, and the US National Oceanic and Atmospheric Administration (NOAA) – complements existing resources by providing a quantitative toolkit for nations, ministries, departments, agencies, regions, municipalities, and even individual cities or ports, to benchmark their geospatial development against the United Nations’ Integrated Geospatial Information Framework (IGIF) principles. This independent initiative aligns with, and supports, the mission, vision, and goals of the UN-GGIM initiative (Global Geospatial Information Management), who developed the IGIF core principles for all geospatial data considerations.
(Marine) Spatial Data InfrastructureIGIF provides a vision for developing and strengthening geospatial information management, to assist countries in bridging the geospatial digital divide, secure socio-economic prosperity, and leave no community behind. Marine Spatial Data Infrastructure ((M)SDI) is the International Hydrographic Organization (IHO)’s concept for a future ecosystem of marine data services that can enable the IGIF vision to become a reality. Empowered by OGC standards, the interoperable (M)SDI data services can “make it real through technology.” Bringing these elements together in a straightforward and accessible document, the intent of the Maturity Roadmap is to provide a quantitative “quick start” or “stepping stone” for nations beginning an IGIF-aligned (M)SDI implementation.
With its terrestrial heritage, the World Bank SDI Diagnostic Toolkit is augmented with IHO and OGC contributions to maximise its benefits to the marine community, while remaining aligned with the IGIF principles and, therefore, the UN Sustainable Development Goals (SDGs). As a guiding simplification, the involvement of the World Bank is crucial in providing answers for questions around financing (including business cases), alongside the ‘why’ (UN), ‘what’ (IHO), and ‘how’ (OGC). This aspect of measuring socio-economic return is commonly a key hurdle that prevents real-world progress beyond concepts and ideas. The modular IHO and OGC additions ensure interoperability with the World Bank IGIF methodology, which can lead to the financing of approved (M)SDI development projects. Even as an independent tool, undertaking an (M)SDI assessment provides a clear reference point aligned with international best practice. Without such a starting point, progress towards any (M)SDI end-state will be difficult to govern and manage.
Fully interoperable across all geospatial domainsAs part of the OGC’s Federated Marine SDI (FMSDI) initiative, the Maturity Roadmap seeks to promote the inclusive development of an IGIF-Aligned (M)SDI as the marine and maritime community’s contribution to an all-domain National Spatial Data Infrastructure (NSDI) across air, land, sea, space, and cyberspace. Although initially adapted for marine considerations, the Maturity Roadmap is fully interoperable across all geospatial domains and scalable from the national level to regions, municipalities, cities, ports, and government departments or agencies.
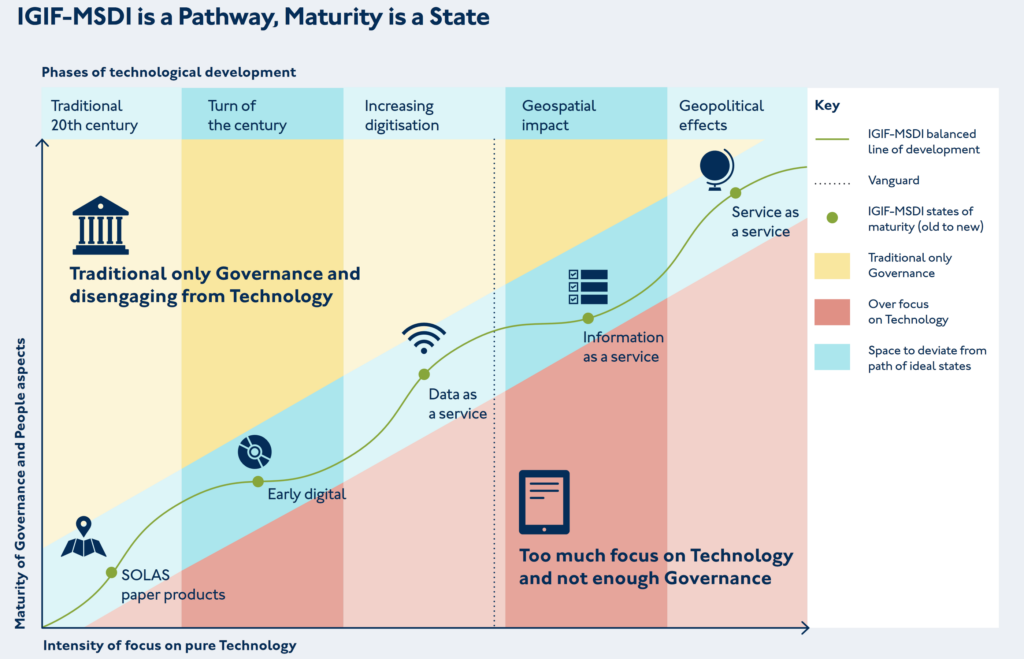
Within the Maturity Roadmap, the concept of an IGIF-(M)SDI Balanced Pathway of Development seeks to promote inclusive geospatial development via two key messages: ‘driving technology, not being driven by technology’ and ‘making the data count, not just counting the data.’
These twin ideas promote the effective governance of technology & standards to meet sovereign national requirements, however expansive or constrained, over the acquisition and possession of the latest technological solutions independent of cost-benefit considerations. OGC contributes to this by providing best practice around the implementation of standards, alongside an active cross-sector global forum to share applied knowledge, cooperate on emerging technologies, and collaborate on standards development. The engagement of the OGC membership at all levels of socio-economic development is vital for realising the cost benefits stemming from the common implementation of technologies across different countries, regions, sectors, and communities, regardless of economic spend.
The benefits of benchmarking IGIF-MSDI maturityWhen objectively and independently applied, the benchmarking provided by the IGIF-(M)SDI Maturity Roadmap offers a useful planning and comparison baseline for countries undertaking a public geospatial development programme. The example here is a radar chart output across nine assessment categories corresponding to the IGIF Nine Pathways, for an initial baseline – and a subsequent baseline two years later. The underlying data is from real-world assessments taken under World Bank and partner oversight, which was openly published by the Agency for Land Relations and Cadastre of the Republic of Moldova. Such benchmarking exercises can be executed across different scales (from whole nations to cities or ports) and across different domains (from space to cyberspace), sometimes yielding deep insights into potential opportunities around discovered disparities.
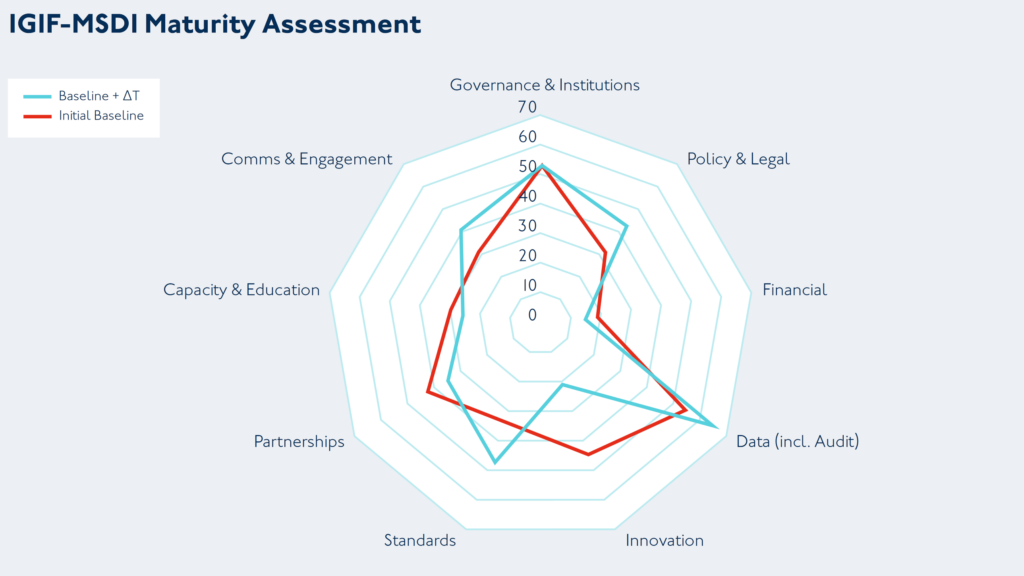
Also included with the Maturity Roadmap is a practically orientated appendix that covers best practice for multi-agency governance, where, during a national geospatial development programme, multiple agencies or departments may have to work closely to operationally deliver joint geospatial outcomes. This may be useful in situations where long-standing traditions and conventions could have created a culture that is not conducive to the tight-knit cooperation needed to develop complex IGIF-(M)SDI solutions. Such solutions require the pooling of expertise, resources, and capabilities that one or even two agencies can not provide alone.
Positive approach to improve ineffective practices is essential to joint IGIF-(M)SDI successOne crucial characteristic for joint IGIF-(M)SDI success is a healthy scepticism and a drive to improve ineffective practices, especially when they have become entrenched as tradition, convention, or “how things have always been done.” I like to counter such perceptions, particularly amongst those that genuinely want to evolve, with the view that “if you always do what you’ve always done, you’ll always get what you’ve always gotten.” Long-term existing practices may have been fine because they met some requirement in a particular environment and once satisfied a need effectively. However, maintaining those same practices now, when society’s expectations and technology have moved forward, can lead to stagnation.
Departments and agencies should foster a keen interest in human behaviour around the use (and misuse) of data or information. Traditional or conventional “hard governance” centres around the assumption that people only make the wrong decisions because they have the wrong information or not enough of it. This traditional view of data governance then coalesces into hard compliance measures and management surveillance, which includes formal audits, regular in-depth reporting, restrictive checklists, and a focus on top-down, non-negotiable command & control. This approach was suited to traditional mass manufacturing of standardised products, but is insufficient by itself for modern data services that are digital-first by design and characterised by near real-time changes.
Soft governance works with the grain of human behaviour to achieve better results by enablement and empowerment, rather than by command and control alone. Principles take precedent over prescription, thus allowing an organisation to leverage the deep insights and frontline experiences of their entire workforce. Shortcut thinking, lack of active engagement and wrong assumptions are some of the key targets for a soft governance approach, which still requires the ultimate backstop of hard governance – but meaningfully targeted and monitored using a risk-based approach. Combining the two approaches can yield outsized and transformative results, which is essential for joint IGIF-(M)SDI success that leaves no community behind.
The IGIF-(M)SDI Maturity Roadmap and related resources are available for free on OGC’s IGIF-(M)SDI Maturity Roadmap webpage.
To best inform future revisions, iterations, and the optimization of the Roadmap, feedback and applied experiences from the geospatial community are sought via OGC Member Meetings, Forums, or directly.
The IGIF-(M)SDI Maturity Roadmap is an independent initiative not endorsed by or officially connected to, but in alignment and support of, the mission, vision, and goals of the United Nations Initiative on Global Geospatial Information Management (UN-GGIM).

Dr. Gerald J Wong is the Data Governance Lead at the United Kingdom Hydrographic Office (UKHO), which is a world-leading centre for hydrography and an executive agency of the Ministry of Defence (MoD). Dr Wong is the Lead Author of the IGIF-(M)SDI Maturity Roadmap, being a specialist in synergising traditional rules-based hard governance with modern and empowering soft governance, which works with the grain of human behaviour to achieve better outcomes.
As an OGC Strategic Member and a sponsor of OGC’s FMSDI initiative, the United Kingdom Hydrographic Office (UKHO) is the UK’s agency for providing hydrographic and marine geospatial data to mariners and maritime organisations across the world. The UKHO is responsible for operational support to the Royal Navy and other defence customers. Supplying defence and the commercial shipping industry, the organisation helps ensure Safety of Life at Sea (SOLAS), protect the marine environment, and support the efficiency of global trade.
Together with other national hydrographic offices and the International Hydrographic Organization (IHO), the UKHO works to develop and raise global standards of hydrography, cartography, and navigation. The UKHO also produces a commercial portfolio of ADMIRALTY Maritime Data Solutions, providing SOLAS-compliant charts, publications, and digital services for ships trading internationally.
The post Making The Data Count, Not Just Counting The Data appeared first on Open Geospatial Consortium.
-
sur geomatico: HOT-OSM para el seísmo de Marruecos
Publié: 14 September 2023, 11:18am CEST
Geomatico dedica un día al mes a colaborar en aquellos proyectos que más nos llaman la atención tecnológica o socialmente. Es lo que llamamos el día del imasdé (I+D), que empieza con todos los trabajadores votando a qué dedicaremos las siguientes horas de trabajo.
 Votaciones poco tecnológicas para decidir el día del I+D
Como no podía ser de otra manera, esta jornada del 13 de septiembre la dedicamos al precioso proyecto HOT-OSM (Humanitarian OpenStreetMap Team) que había hecho un llamamiento urgente para ayudar a mapear las zonas afectadas por el dramático terremoto del sur de Marruecos.
Primero hicimos una pequeña introducción a OpenStreetMap (OSM) para profanos para aquella parte del equipo que no tenía experiencia anterior con el proyecto. Vimos los diferentes editores, iD, JOSM y estudiamos un poco las primitivas geométricas que caracterizan el proyecto y por supuesto las Map Features. Ya en HOT, decidimos en que proyecto íbamos a colaborar y nos pusimos a ello.
 Seleccionando zona de trabajo en HOT-OSM
Había que que cartografiar los edificios dentro de las rejillas que seleccionábamos. En el mismo proyecto de HOT, se explicaba claramente como realizar la tarea a partir de JOSM. Así, mediante el plugin de crear edificios, pudimos aportar nuestro granito de arena a la zona.
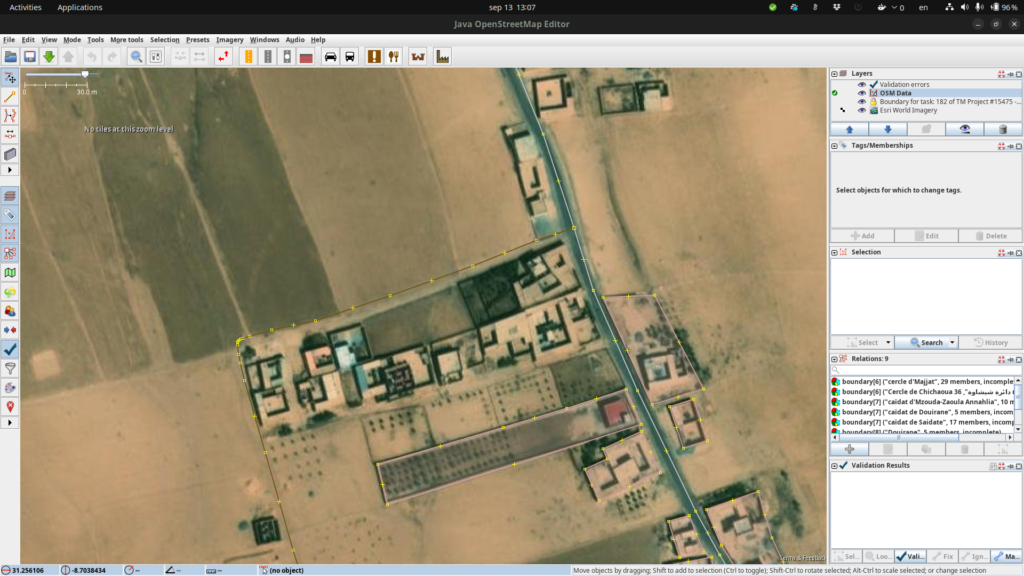 Puede ser complejo definir distinguir exactamente los contornos de los edificios en Marruecos
Fue muy gratificante, tanto por la tarea, como por la dinámica del trabajo, el compartir una jornada completa con las compañeras realizando un trabajo “sencillo“ en el que a la vez podíamos estar comentando otros aspectos de nuestro día a día. ¡Viva el día del imasdé y HOT-OSM!
 Micho, Marta y Alex trabajando en HOT-OSM pero posando disimuladamente para la foto
-
sur The World's Bioregions & Ecosystems Mapped
Publié: 14 September 2023, 8:59am CEST par Keir Clarke
Bioregions 2023 is an interactive map which visualizes the Earth as 185 discrete bioregions. A bioregion is a geographical area defined not by political boundaries but by ecological systems. It is a geographical area that encompasses a unique set of interconnected ecosystems, landforms and watersheds in which a broad community of plants and animals are adapted to specific climatic conditions. -
sur The City Map Game
Publié: 12 September 2023, 7:00pm CEST par Keir Clarke
I really like the game SF-Street-Names, which I reviewed Monday in the post The Streets of San Francisco Game. In fact I liked SF-Street-Names so much that I immediately started trying to see if I could replicate the game for a different city. The result is the Streets of Winchelsea. In this very scaled back version of the SF-Street-Names game you have to name all of the 17 streets of the small
-
sur Registrations Open for OGC’s October 2023 Open Standards Code Sprint
Publié: 12 September 2023, 3:00pm CEST par Simon Chester
The Open Geospatial Consortium (OGC) invites software developers to the October 2023 Open Standards Code Sprint. The hybrid event will be held on Oct. 30 to Nov. 1, with the face-to-face element held at the Geovation Hub in London. A pre-event webinar will be held on October 12th. Participation is free and open to the public. Registration is available on the OGC Open Standards Code Sprint website. Travel support funding is available.
The Code Sprint is sponsored at the Gold Level by OGC Strategic Member Ordnance Survey (OS), and at the Silver Level by OGC Member the European Union Satellite Centre (SatCen). Additional support comes from OGC Strategic Member the US National Geospatial Intelligence Agency (NGA) and OGC Principal Member the UK Defence Science and Technology Laboratory (Dstl). Additional sponsorship opportunities remain available for organizations to support the geospatial development community while promoting their products or services. Visit the Event Sponsorship page for more information.
The code sprint will be a collaborative and inclusive event to support the development of Open Standards and supporting applications. All OGC Standards are in scope for this code sprint.
OGC code sprints experiment with emerging ideas in the context of geospatial standards, help improve interoperability of existing standards by experimenting with new extensions or profiles, and are used for building proofs-of-concept to support standards development activities and enhancement of software products.
Non-coding activities such as testing, working on documentation, or reporting issues are also welcome during the code sprint. The Code Sprint also provides the opportunity, via its mentor stream, to onboard developers new to OGC Standards.
A one-hour pre-event webinar will take place on October 12 at 14:00 BST (UTC+1). The webinar will outline the scope of work for the code sprint and provide other useful information for participants. Any participants interested in Imagery formats will be invited to stay on after the webinar for a technical overview of the formats in focus for the code sprint. As with the virtual portion of the sprint, the pre-event webinar will take place on OGC’s Discord server.
The Code Sprint will prototype and advance implementations of multiple approved and candidate OGC Standards, for example:
…and more.
In the context of OGC Standards, the Code Sprint will also experiment with the ability to access or provide imagery conforming to NGA’s emerging GEOINT Imagery Media for ISR (GIMI) Profile through implementations of OGC API Standards. The GIMI Profile is based on the ISO/IEC 23008-12 High Efficiently Image File Format (HEIF) and the ISO/IEC 14496-12 ISO Base Media File Format (ISOBMFF) standards. This part of the Code Sprint will also prototype creation of GIMI files from still imagery encoded in JPEG 2000 (with GMLJP2), and motion imagery encoded in H.264 and H.265 formats.
Some Travel Support Funding is available for selected participants. Anyone interested in receiving travel support funding should indicate their interest on the registration form. Requests for funding will need to be received before October 2. They will be notified within 2 weeks of their application whether their application for travel support is approved or not.
The code sprint begins at 09:00 UTC on October 30 with an onboarding session, and ends at 17:00 UTC on November 1. To learn more about future and previous OGC code sprints, visit the OGC Developer Events Wiki or join OGC’s Discord server.
Registration for in-person participation closes at 17:00 UTC on October 25. Registration for remote participation will remain open throughout the code sprint. Registration and further information is available on The Code Sprint website.
The post Registrations Open for OGC’s October 2023 Open Standards Code Sprint appeared first on Open Geospatial Consortium.
-
sur The Virtual Tour Maker
Publié: 12 September 2023, 8:40am CEST par Keir Clarke
Over the weekend Map Channels sent me a link to a new virtual tour of Bagnoles de L'Orne in Normandy, France. Bagnoles de L'Orne is a beautiful spa town set beside a pretty lake and the Andaines Forest. The Map Channels virtual tour takes you on a guided Street View walk around some of Bagnoles de L'Orne's most picturesque locations.The Bagnoles de L'Orne virtual tour was made with Map Channels -
sur The Streets of San Francisco Game
Publié: 11 September 2023, 11:19am CEST par Keir Clarke
I know the names of nearly 1/5th of the streets in San Francisco. Which is incredible - especially when you consider I've never been to San Francisco. Luckily my hitherto unbeknownst knowledge of the names of San Franciscan roads makes me a God of SF-Street-Names. SF-Street-Names is a surprisingly fun map game in which your only requirement is to name streets in the Golden City. SF-Street-Names
-
sur BostonGIS: Why People care about PostGIS and Postgres and FOSS4GNA
Publié: 10 September 2023, 5:22am CEST
Paul Ramsey and I recently had a Fireside chat with Path to Cituscon. Checkout the Podcast Why People care about PostGIS and Postgres. There were a surprising number of funny moments and very insightful stuff.
It was a great fireside chat but without the fireplace. We covered the birth and progression of PostGIS for the past 20 years and the trajectory with PostgreSQL. We also learned of Paul's plans to revolutionize PostGIS which was new to me. We covered many other side-line topics, like QGIS whose birth was inspired by PostGIS. We covered pgRouting and mobilitydb which are two other PostgreSQL extension projects that extend PostGIS.
We also managed to fall into the Large Language Model conversation of which Paul and I are on different sides of the fence on.
Continue reading "Why People care about PostGIS and Postgres and FOSS4GNA"
-
sur Map of the Best Restaurants
Publié: 9 September 2023, 11:25am CEST par Keir Clarke
I don't think I've posted a link to a 'find a nearby restaurant' interactive map in over ten years. Today I'm breaking my unconscious embargo on restaurant maps with a link to the superb Map of the Best. Map of the Best is an incredibly well designed interactive map which uses data from a number of different restaurant rating organizations to show you great places to eat near your current -
sur Geolocating General Surovikin
Publié: 8 September 2023, 8:57am CEST par Keir Clarke
The investigative journalists at Bellingcat have been developing some important tools and methodologies for geolocating images. On Wednesday they applied their investigative geolocating powers to identify the location of General Sergey Surovikin. On September 4th a photograph of Surovikin was posted online, accompanied by the message "General Surovikin has emerged. He’s alive and well, home
-
sur Camptocamp: The QGIS Hub Plugin
Publié: 8 September 2023, 2:00am CEST
Pièce jointe: [télécharger]
Your direct access to the shared resources of the QGIS community.
-
sur Finding History Nearby
Publié: 7 September 2023, 3:18pm CEST par Keir Clarke
RIP the Wikipedia layer. Killed ten years ago by Google Maps.Every August I hold a day of remembrance for the sad demise of the Wikipedia layer on Google Maps. Younger readers probably won't remember the glory days of Google Maps when you could simply click on the Wikipedia layer in Google Maps to discover more about all the interesting POI's around any location in the world. For some reason
-
sur GRASS GIS: NSF Grant Awarded to Enhance GRASS GIS Ecosystem
Publié: 6 September 2023, 10:12am CEST
We, a team of researchers from four U.S. universities, are excited to announce a significant new project to support and expand the global GRASS GIS community. We have been awarded a prestigious grant (award 2303651) from the U.S. National Science Foundation (NSF) to bolster and broaden the software ecosystem of GRASS GIS for a world that increasingly relies on location-based information. The two main goals of the project are: 1) to facilitate the adoption of GRASS GIS as a key geoprocessing engine by a growing number of researchers and geospatial practitioners in academia, governments, and industry; and 2) to expand and diversify the developer community, especially through supporting next-generation scientists to gain expertise to maintain and innovate GRASS software.
-
sur How Near do You Live to a Mass Shooting?
Publié: 6 September 2023, 9:10am CEST par Keir Clarke
In 2014 around 3,438,482 Americans lived within 1 mile of a mass shooting event. That number is very high - especially when compared to most other countries around the world. However because of America's complete failure to control gun ownership that figure has now grown to a frightening 41,930,273. This means that in 2023 over 12% of Americans live within one mile of a mass shooting. These
-
sur GeoSolutions: GeoSolutions to Sponsor FOSS4G North America – 23-25 OCT – Baltimore, MD
Publié: 5 September 2023, 6:19pm CEST
You must be logged into the site to view this content.
-
sur Marco Bernasocchi: Analyzing and visualizing large-scale fire events using QGIS processing with ST-DBSCAN
Publié: 5 September 2023, 10:04am CEST
A while back, one of our ninjas added a new algorithm in QGIS’ processing toolbox named ST-DBSCAN Clustering, short for spatio temporal density-based spatial clustering of applications with noise. The algorithm regroups features falling within a user-defined maximum distance and time duration values.
This post will walk you through one practical use for the algorithm: large-scale fire event analysis and visualization through remote-sensed fire detection. More specifically, we will be looking into one of the larger fire events which occurred in Canada’s Quebec province in June 2023.
 Fetching and preparing FIRMS data
NASA’s Fire Information for Resource Management System (FIRMS) offers a fantastic worldwide archive of all fire detected through three spaceborne sources: MODIS C6.1 with a resolution of roughly 1 kilometer as well as VIIRS S-NPP and VIIRS NOAA-20 with a resolution of 375 meters. Each detected fire is represented by a point that sits at the center of the source’s resolution grid.
Each source will cover the whole world several times per day. Since detection is impacted by atmospheric conditions, a given pass by one source might not be able to register an ongoing fire event. It’s therefore advisable to rely on more than one source.
To look into our fire event, we have chosen the two fire detection sources with higher resolution – VIIRS S-NPP and VIIRS NOAA-20 – covering the whole month of June 2023. The datasets were downloaded from FIRMS’ archive download page.
After downloading the two separate datasets, we combined them into one merged geopackage dataset using QGIS processing toolbox’s Merge Vector Layers algorithm. The merged dataset will be used to conduct the clustering analysis.

In addition, we will use QGIS’s field calculator to create a new Date & Time field named ACQ_DATE_TIME using the following expression:
to_datetime("ACQ_DATE" || "ACQ_TIME", 'yyyy-MM-ddhhmm')This will allow us to calculate precise time differences between two dates.
 Modeling and running the analysis
The large-scale fire event analysis requires running two distinct algorithms:
- a spatiotemporal clustering of points to regroup fires into a series of events confined in space and time; and
- an aggregation of the points within the identified clusters to provide additional information such as the beginning and end date of regrouped events.
This can be achieved through QGIS’ modeler to sequentially execute the ST-DBSCAN Clustering algorithm as well as the Aggregate algorithm against the output of the first algorithm.

The above-pictured model outputs two datasets. The first dataset contains single-part points of detected fires with attributes from the original VIIRS products as well as a pair of new attributes: the CLUSTER_ID provides a unique cluster identifier for each point, and the CLUSTER_SIZE represents the sum of points forming each unique cluster. The second dataset contains multi-part points clusters representing fire events with four attributes: CLUSTER_ID and CLUSTER_SIZE which were discussed above as well as DATE_START and DATE_END to identify the beginning and end time of a fire event.
In our specific example, we will run the model using the merged dataset we created above as the “fire points layer” and select ACQ_DATE_TIME as the “date field”. The outputs will be saved as separate layers within a geopackage file.
Note that the maximum distance (0.025 degrees) and duration (72 hours) settings to form clusters have been set in the model itself. This can be tweaked by editing the model.
Visualizing a specific fire event progression on a mapOnce the model has provided its outputs, we are ready to start visualizing a fire event on a map. In this practical example, we will focus on detected fires around latitude 53.0960 and longitude -75.3395.
Using the multi-part points dataset, we can identify two clustered events (CLUSTER_ID 109 and 1285) within the month of June 2023. To help map canvas refresh responsiveness, we can filter both of our output layers to only show features with those two cluster identifiers using the following SQL syntax: CLUSTER_ID IN (109, 1285).
To show the progression of the fire event over time, we can use a data-defined property to graduate the marker fill of the single-part points dataset along a color ramp. To do so, open the layer’s styling panel, select the simple marker symbol layer, click on the data-defined property button next to the fill color and pick the Assistant menu item.
In the assistant panel, set the source expression to the following:
day(age(to_date('2023-07-01'),”ACQ_DATE_TIME”)). This will give us the number of days between a given point and an arbitrary reference date (2023-07-01 here). Set the values range from 0 to 30 and pick a color ramp of your choice.
When applying this style, the resulting map will provide a visual representation of the spread of the fire event over time.
 Having identified a fire event via clustering easily allows for identification of the “starting point” of a fire by searching for the earliest fire detected amongst the thousands of points. This crucial bit of analysis can help better understand the cause of the fire, and alongside the color grading of neighboring points, its directionality as it expanded over time.
Analyzing a fire event through histogram
Having identified a fire event via clustering easily allows for identification of the “starting point” of a fire by searching for the earliest fire detected amongst the thousands of points. This crucial bit of analysis can help better understand the cause of the fire, and alongside the color grading of neighboring points, its directionality as it expanded over time.
Analyzing a fire event through histogram
Through QGIS’ DataPlotly plugin, it is possible to create an histogram of fire events. After installing the plugin, we can open the DataPlotly panel and configure our histogram.
Set the plot type to histogram and pick the model’s single-part points dataset as the layer to gather data from. Make sure that the layer has been filtered to only show a single fire event. Then, set the X field to the following layer attribute: “ACQ_DATE”.
You can then hit the Create Plot button, go grab a coffee, and enjoy the resulting histogram which will appear after a minute or so.
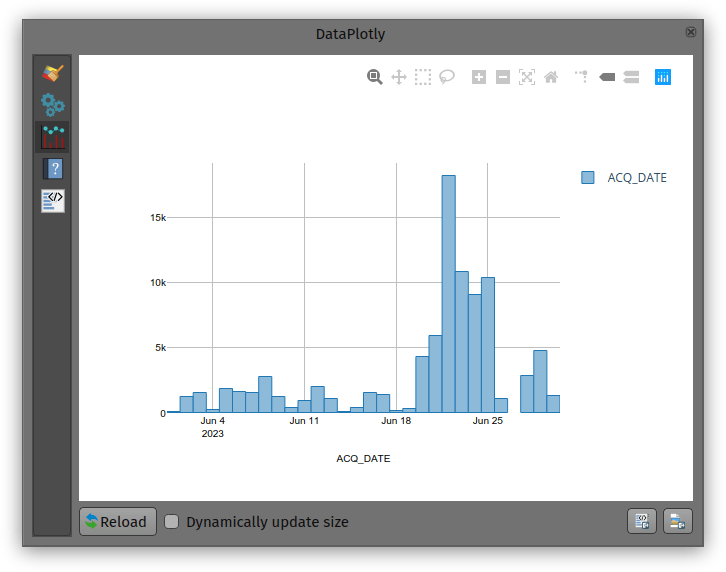
While not perfect, an histogram can quickly provide a good sense of a fire event’s “peak” over a period of time.
-
sur The River Basins & Watersheds of the World
Publié: 5 September 2023, 8:45am CEST par Keir Clarke
OSM River Basins is an interactive map which uses OpenStreetMap data to visualize all the river basins of the world. A river basin is an area of land drained by one river system and its tributaries. It includes all the land where rainwater or melted snow drains into the river, either directly or through smaller tributary streams and rivers. River basins can be incredibly large - covering
-
sur QGIS Blog: Plugin Update August 2023
Publié: 3 September 2023, 1:08pm CEST
In August 13 new plugins that have been published in the QGIS plugin repository.
Here’s the quick overview in reverse chronological order. If any of the names or short descriptions piques your interest, you can find the direct link to the plugin page in the table below the screenshot.

Cesium ion Browse and add datasets from Cesium ion Land Use Analyzer A plugin for Land Use spatial analysis tools GNAVS GNSS Navigate and Save Soar – the new atlas Import or export maps via the Soar platform FotovolCAT Spatial analysis automation for solar power station sitting in Catalonia QGISSPARQL-Layer2Triple Layer2Triple osm2topomap A plugin intended to intermediate the process of using OSM data for official (authoritative) Topographc Maps, or rather, databases Plugin Exporter A QGIS plugin for exporting plugins GetBaseLine GetBaseLine Fast Field Filler The plugin was created to quickly fill in the fields in the attribute table. Radiation ToolBox Plugin Plugin for loading data from Safecast and other radiation monitoring devices LocationIQ Geocoding and Maps LocationIQ integration to add geocoding and map tiles to QGIS Proxy Handler Adds prefix proxy addresses to connections -
sur From GIS to Remote Sensing: Road to the Semi-Automatic Classification Plugin v.8: Landsat and Sentinel-2 images download and preprocessing, classification
Publié: 2 September 2023, 11:10am CEST
This is the second post describing the main new features of the new version 8 (codename "Infinity") of the Semi-Automatic Classification Plugin (SCP) for QGIS, which will be released in October 2023.The new version is based on Remotior Sensus, a new Python processing framework.
The tool "Download products" has been updated to download Landsat and Sentinel-2 images from different services. In particular, through the service NASA Earthdata (registration required at [https:]] ) it will be possible to download the Harmonized Landsat and Sentinel-2 which are surface reflectance data product (generated with Landsat 8, Landsat 9, and Sentinel-2 data) with observations every two to three days at 30m spatial resolution (for more information read here). This is therefore a great source for frequent and homogeneous monitoring.Moreover, Copernicus Sentinel-2 images will be searched through the Copernicus Data Space Ecosystem API, while the images are downloaded through the Google Cloud service that provides the free dataset as part of the Google Public Cloud Data program.Other download services that were available in SCP 7 (e.g. Sentinel-1, ASTER images) will be available with future updates.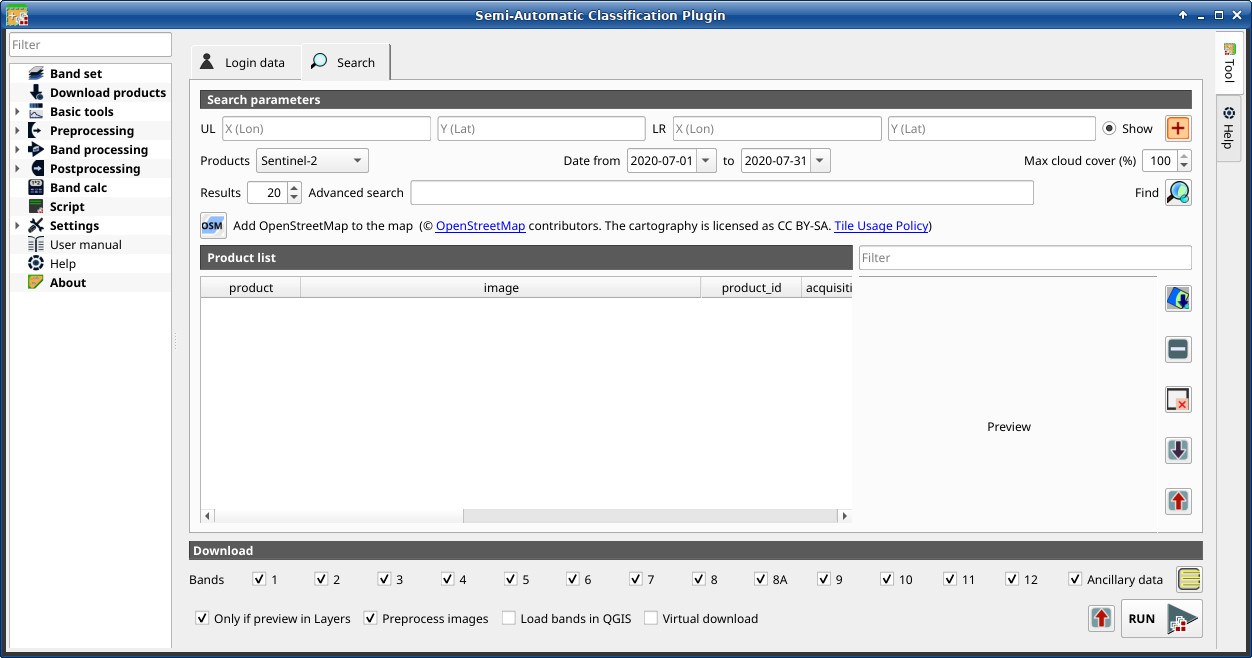
Read more »


-
sur Mapping the Great Kant? Earthquake
Publié: 2 September 2023, 10:21am CEST par Keir Clarke
100 years ago yesterday, on September 1st 1923, the Great Kant? earthquake struck Japan. The earthquake struck near midday, at a time when many people were cooking lunch. In Tokyo, during and after the earthquake, fires spread across the city. In the 46 hours after the quake around 40% of Tokyo burned to the ground. Japanese newspaper Nikkei has marked the 100th anniversary of the Great
-
sur GeoSolutions: Partnership with Ecoplan (Bosnia & Herzegovina)
Publié: 1 September 2023, 5:45pm CEST
You must be logged into the site to view this content.
-
sur Free and Open Source GIS Ramblings: Comparing geographic data analysis in R and Python
Publié: 1 September 2023, 10:14am CEST
Today, I want to point out a blog post over at
written together with my fellow “Geocomputation with Python” co-authors Robin Lovelace, Michael Dorman, and Jakub Nowosad.
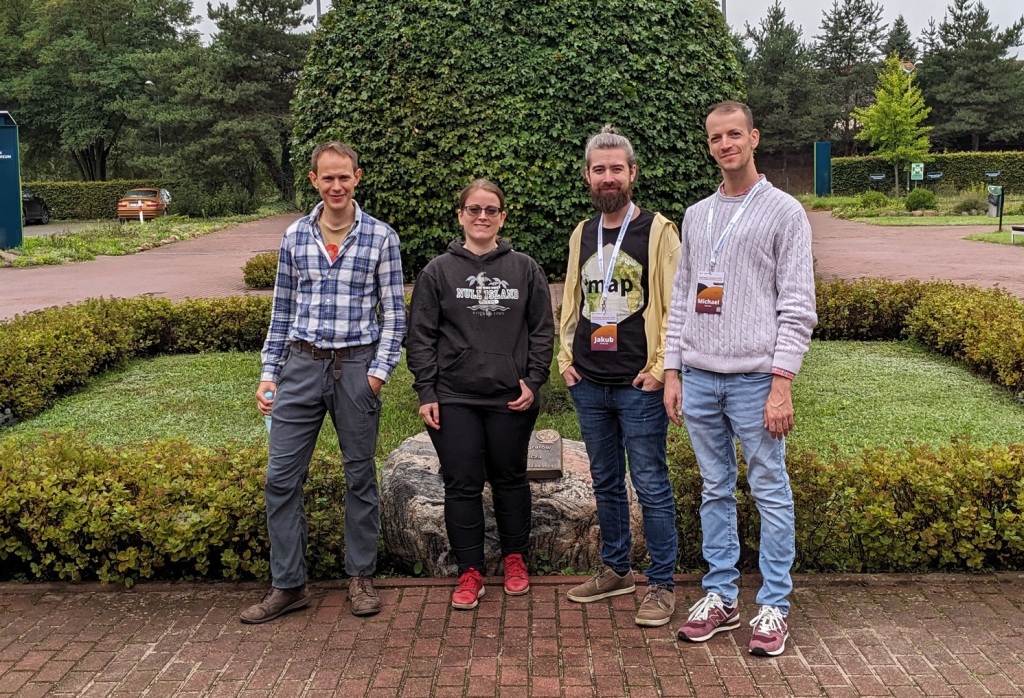
In this blog post, we talk about our experience teaching R and Python for geocomputation. The context of this blog post is the OpenGeoHub Summer School 2023 which has courses on R, Python and Julia. The focus of the blog post is on geographic vector data, meaning points, lines, polygons (and their ‘multi’ variants) and the attributes associated with them. We plan to cover raster data in a future post.
-
sur The AI Satlas
Publié: 1 September 2023, 8:32am CEST par Keir Clarke
The Allen Institute's Satlas interactive map uses AI to create high resolution images of the world, even when only low resolution satellite images are available. The Allen Institute has also trained the AI to identify the location of wind turbines, solar farms and tree canopy coverage around the globe.Satlas uses satellite imagery from the European Space Agency’s Sentinel-2 satellites. The
-
sur GeoTools Team: GeoTools 28.5 Released
Publié: 31 August 2023, 12:07pm CEST
The GeoTools team are pleased to announce the release of the latest stable version of GeoTools 28.5 geotools-28.5-bin.zip geotools-28.5-doc.zip geotools-28.5-userguide.zip geotools-28.5-project.zip This release is also available from the OSGeo Maven Repository and is made in conjunction with -
sur GeoTools Team: GeoTools 28.5 Released
Publié: 31 August 2023, 12:01pm CEST
The GeoTools team are pleased to announce the release of the latest stable version of GeoTools 28.5 geotools-28.5-bin.zip geotools-28.5-doc.zip geotools-28.5-userguide.zip geotools-28.5-project.zipThis release is also available from the OSGeo Maven Repository and is made in conjunction with GeoServer 2.22.5. We are grateful to Peter Smythe (AfriGIS) for carrying out the
-
sur Text Recognition Map Search
Publié: 31 August 2023, 9:00am CEST par Keir Clarke
The David Rumsey Map Collection has unveiled its new amazing Text on Maps feature which allows users to search one of the world's largest collections of digitized maps by text. The David Rumsey Map Collection contains over 57,000 geo-referenced vintage maps. Using the new Text on Maps feature you can now search for where any word appears on any of those 57,000 maps. Old maps are an invaluable
-
sur gvSIG Batoví: edición 2023 del concurso: Proyectos de Geografía con estudiantes y gvSIG Batoví
Publié: 30 August 2023, 8:32pm CEST

Habiendo finalizado con éxito la etapa de capacitación de la iniciativa Geoalfabetización mediante la utilización de Tecnologías de la Información Geográfica, lanzamos la convocatoria a participar de la edición 2023 del concurso: Proyectos de Geografía con estudiantes y gvSIG Batoví. Pueden acceder aquí a la convocatoria y bases.
Todos los años tenemos alguna novedad y este año no es la excepción:
- tenemos el apoyo del Instituto Panamericano de Geografía e Historia (la iniciativa fue seleccionada por el Programa de Asistencia Técnica 2023, Proyecto PAT No. GEOG-04/2023 Geoalfabetización mediante la utilización de Tecnologías de la Información Geográfica)
- este año participa también la Dirección General de Educación Técnico Profesional (UTU)
- la certificación se obtiene participando del curso y del concurso
- contamos con la colaboración de la Universidad Politécnica de Madrid en la organización de la iniciativa
Agradecemos el apoyo de todas las instituciones que hacen posible la realización de esta propuesta.

-
sur Mapping Hurricane Idalia
Publié: 30 August 2023, 9:39am CEST par Keir Clarke
Hurricane Idalia is expected to make landfall in Florida early Tuesday morning. Overnight the hurricane developed into a powerful Category 3 storm and it is now forecast to become a dangerous Category 4 hurricane. NOAA's National Hurricane Center has produced a number of maps showing the forecast track of Hurricane Idalia, the wind speed probabilities, storm surge warnings and rainfall
-
sur GeoServer Team: GeoServer 2.22.5 Release
Publié: 30 August 2023, 2:00am CEST
GeoServer 2.22.5 release is now available with downloads ( bin, war, windows) , along with docs and extensions.
This is a maintenance release of GeoServer providing existing installations with minor updates and bug fixes. GeoServer 2.22.5 is made in conjunction with GeoTools 28.5, and GeoWebCache 1.22.5.
Thanks to Peter Smythe (AfriGIS) for making this release.
2023-09-05 update: GeoServer 2.22.5 has been recompiled and uploaded to SourceForge. The initial upload was accidentally compiled with Java 11 and would not function in a Java 8 environment.
Thanks to Jody Garnett (GeoCat) for this update, and Steve Ikeoka for testing in a Java 8 environment.
Java 8 End-of-lifeThis GeoServer 2.22.5 maintenance release is final scheduled release of GeoServer 2.22.x series, and thus the last providing Java 8 support.
All future releases will require a minimum of Java 11.
Security ConsiderationsThis release addresses security vulnerabilities and is considered an essential upgrade for production systems.
This blog post will be updated in due course with CVE numbers following our coordinated vulnerability disclosure policy.
See project security policy for more information on how security vulnerabilities are managed.
Release notesImprovement:
- GEOS-10856 geoserver monitor plugin - scaling troubles
- GEOS-11048 Improve URL checking
- GEOS-11081 Add option to disable GetFeatureInfo transforming raster layers
- GEOS-11099 ElasticSearch DataStore Documentation Update for RESPONSE_BUFFER_LIMIT
- GEOS-11100 Add opacity parameter to the layer definitions in WPS-Download download maps
Bug:
- GEOS-10874 Log4J: Windows binary zip release file with log4j-1.2.14.jar
- GEOS-10875 Disk Quota JDBC password shown in plaintext
- GEOS-10901 GetCapabilities lists the same style multiple times when used as both a default and alternate style
- GEOS-10903 WMS filtering with Filter 2.0 fails
- GEOS-10932 csw-iso: should only add ‘xsi:nil = false’ attribute
- GEOS-11025 projection parameter takes no effect on MongoDB Schemaless features WFS requests
- GEOS-11035 Enabling OSEO from Workspace Edit Page Results in an NPE
- GEOS-11054 NullPointerException creating layer with REST, along with attribute list
- GEOS-11055 Multiple layers against the same ES document type conflict with each other
- GEOS-11069 Layer configuration page doesn’t work for broken SQL views
Task:
- GEOS-11062 Upgrade [httpclient] from 4.5.13 to 4.5.14
- GEOS-11063 Upgrade [httpcore] from 4.4.10 to 4.4.16
- GEOS-11067 Upgrade wiremock to 2.35.0
- GEOS-11092 acme-ldap.jar is compiled with Java 8
For the complete list see 2.22.5 release notes.
About GeoServer 2.22 SeriesAdditional information on GeoServer 2.22 series:
- GeoServer 2.22 User Manual
- Update Instructions
- Metadata extension
- CSW ISO Metadata extension
- State of GeoServer (FOSS4G Presentation)
- GeoServer Beginner Workshop (FOSS4G Workshop)
- Welcome page (User Guide)
Release notes: ( 2.22.5 | 2.22.4 | 2.22.3 | 2.22.2 | 2.22.1 | 2.22.0 | 2.22-RC | 2.22-M0 )
-
sur NIMBY Mapping
Publié: 29 August 2023, 9:38am CEST par Keir Clarke
In July the German government introduced a draft bill to legalize cannabis for personal use. However, under the draft bill, the consumption of cannabis will remain prohibited within a 200-meter radius of schools, children's and youth facilities, playgrounds, publicly accessible sports facilities, and in pedestrian zones between 7 am and 8 pm. According to the Berliner Morgenpost these
-
sur gvSIG Team: Curso-Concurso TIGs y gvSIG Batoví. 6ª edición
Publié: 29 August 2023, 8:56am CEST

Nos hacemos eco del lanzamiento de la 6ª edición del Curso-Concurso TIGs y gvSIG Batoví. Este año viene con una importante novedad, Colombia se suma a esta iniciativa uruguaya.
Y se ha comunicado que más de cien docentes de Uruguay y Colombia ya se inscribieron al curso TIGs y gvSIG Batoví… ¡enhorabuena!
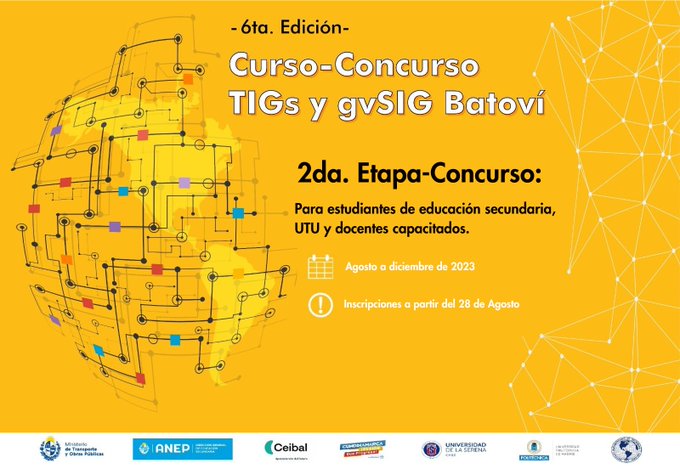
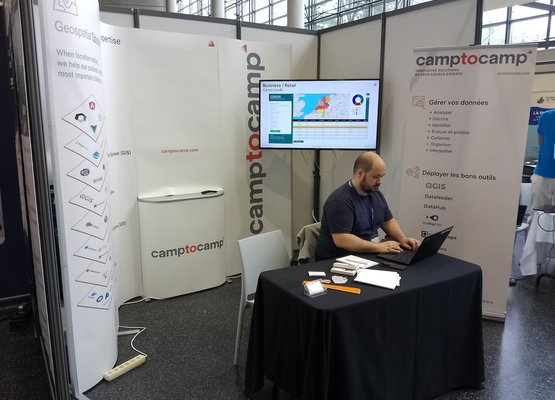
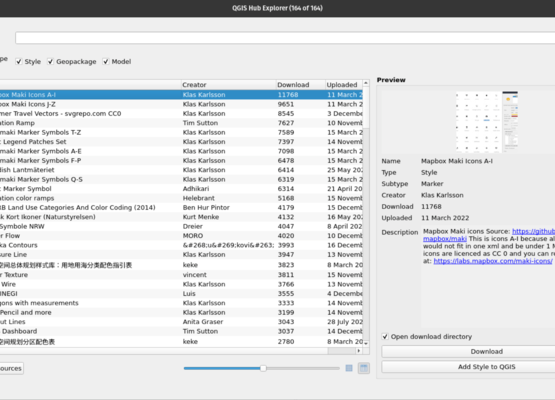
-
sur Terraforming the Metaverse
Publié: 28 August 2023, 9:19am CEST par Keir Clarke
This morning I've been helping create a satellite map of a world that doesn't exist. Thanks to the combined forces of the human imagination and the cutting-edge power of AI technology, I've been able to contribute to a new digital landscape that is being created in real-time. That's right people - today I helped terraform the metaverse! This Map Does Not Exist is an AI generated satellite map
-
sur Sean Gillies: Bear training week ~5 recap
Publié: 28 August 2023, 3:54am CEST
The third week of my season's big training block was my biggest yet from the climbing perspective. My runs averaged 220 feet of elevation gain (D+) per mile, which is what the Bear 100 course will demand of me in 5 weeks. Here are last week's numbers.
20 hours, 37 minutes
76.2 miles
16,775 feet D+
Extrapolating that to 100 miles, naively, predicts a 28 hour finish. That would be amazing! There's no way I'm going to finish in 28 hours. I think I'll be able to keep up this week's average pace for 60 miles and then will slow down dramatically after that. We'll see!
Next week I'm giving myself a break from long hilly runs. I'll do daily runs of not much more than an hour, yoga, some strength and conditioning. And I'll be working on my race day planning: gear, drop bags, fueling, etc.
-
sur GRASS GIS: New Docker images for GRASS GIS
Publié: 27 August 2023, 10:42am CEST
Moving GRASS GIS Docker Images to the OSGeo Repository In the field of open source software development and deployment, the accessibility and maintenance of resources is of paramount importance. To this end, there has been a major change in the repository structure for the GRASS GIS Docker images. In the past years, these Docker images have been maintained and hosted under the mundialis organisation’s repository. The company mundialis has played a crucial role in providing and maintaining these images, ensuring their availability and stability for the wider GIS community.
-
sur How the Blitz Changed London
Publié: 26 August 2023, 10:31am CEST par Keir Clarke
In East London you can usually tell where German bombs fell in World War II by the age of the buildings. For example in my street the majority of houses were built in the Victorian age. All the homes built in the later half of the 20th Century were all built on homes destroyed by falling bombs during the war.The Economist has added a new factor to my bomb site detection observations - building
-
sur From GIS to Remote Sensing: Road to the Semi-Automatic Classification Plugin v.8: Band sets, Band calc and Scripts
Publié: 26 August 2023, 12:10am CEST
As already announced, the new version 8 (codename "Infinity") of the Semi-Automatic Classification Plugin (SCP) for QGIS will be released in October 2023.This post describes a few main new features of the SCP, which is still under development, based on a completely new Python processing framework that is Remotior Sensus.
The Main interface will include all the tools, as in SCP version 7. The Band set tab will allow to manage more than one Band set; the interface has been restyled with a table on the left to manage the list of Band sets, and the larger table on the right to display the bands of the active band set.
Read more » -
sur KAN T&IT Blog: XVII Jornadas IDERA: Nuestra Experiencia
Publié: 25 August 2023, 7:56pm CEST
Cada año, desde 2007, la Infraestructura de Datos Espaciales de la República Argentina (IDERA) extiende su invitación a los apasionados de la información geoespacial a unirse a las Jornadas IDERA. Este evento anual se ha convertido en una tradición, y en 2023, se llevó a cabo en la hermosa ciudad de Santa Rosa, provincia de La Pampa, Argentina. Es un hecho que IDERA se enorgullece de propiciar un espacio donde los expertos pueden compartir y celebrar los avances en el campo de la información geoespacial.
El equipo de Kan participó de este evento, que tuvo como objetivo central impulsar la publicación de datos, productos y servicios geoespaciales de manera eficiente y oportuna, con la finalidad de respaldar la toma de decisiones basadas en evidencias. Las XVII Jornadas IDERA fueron el punto culminante de este esfuerzo, transformándose en el evento geoespacial del año en Argentina. Fue un momento invaluable para intercambiar ideas y debatir sobre los avances y desafíos relacionados con la publicación y utilización de información geoespacial abierta, interoperable y accesible para el desarrollo del país.
Bajo el lema “La comunidad de IDERA hacia un marco integrado de información geoespacial”, las XVII Jornadas IDERA proporcionaron un espacio de reflexión sobre las propuestas globales emergentes destinadas a desarrollar, integrar y fortalecer la gestión de información geoespacial. Este enfoque permitirá mejorar las Infraestructuras de Datos Espaciales en los diferentes niveles jurisdiccionales de Argentina.

La agenda de las XVII Jornadas IDERA estuvo repleta de eventos emocionantes y presentaciones interesantes. Los talleres y ponencias que realizamos desde Kan fueron los siguientes:
Presentación institucional de KAN en el espacio de networking
Taller “Potenciá el uso de tus datos geo con Geonode 4”
Presentación de casos de éxito en el grupo de provincias
Taller “Recolección de datos en campo con Kobo” Ponencia “
Desarrollo de un Sistema de Monitoreo y Manejo Integral de Humedales a partir de Información Satelital”
Además aprovechamos para compartir y asistir a otras charlas y muestras de nuestros colegas. Muchísimas gracias IDERA por esta oportunidad única para conectarnos con otros expertos, dejarnos aprender de sus experiencias y contribuir al avance de la comunidad de información geoespacial en Argentina. ¡Nos vemos el próximo año!
-
sur Finding Shade from the City Heat
Publié: 25 August 2023, 9:52am CEST par Keir Clarke
If you need to find a shaded oasis in the concrete jungle of New York City then you can use Cornell University's new Tree Folio NYC interactive map. Tree Folio NYC uses data from a 2021 New York LiDAR survey and the 2015 New York Street Tree Survey to map the shadows cast by buildings and individual tree canopies in New York at any time of day and on any day of the year. If you zoom-in to any
-
sur OGC forms new GeoParquet Standards Working Group
Publié: 24 August 2023, 3:00pm CEST par Simon Chester
The Open Geospatial Consortium (OGC) is excited to announce the formation of the OGC GeoParquet Standards Working Group (SWG). The new SWG will work to advance the GeoParquet encoding format for adoption as an OGC Encoding Standard for cloud-native vector data.
GeoParquet adds geospatial types to Apache Parquet, described by Apache as “an open source, column-oriented data file format designed for efficient data storage and retrieval. It provides efficient data compression and encoding schemes with enhanced performance to handle complex data in bulk.” For an introduction to the GeoParquet format, see this blog post.
GeoParquet started over 3 years ago as a community effort by different Open Source Projects and organizations that have committed to its implementation and support.
OGC is advancing a number of Standards to enable cloud-native geospatial ecosystems. GeoParquet fits in the group of data encoding Standards that are highly performant for large, cloud-based data stores, such as Cloud Optimized GeoTIFF for tiled rasters and Zarr for datacubes. GeoParquet will, in time, enable vector datasets to be as readily accessible from the cloud as the other formats already well-used in the community.
The GeoParquet SWG will take the initial efforts incubated in OGC’s GeoParquet GitHub repository as a draft specification from which a candidate Standard will be developed. As with many other recent OGC Standards, the repository will remain open to contributions from outside OGC and documentation will evolve in concert with prototype implementations.
GeoParquet will be another encoding of the OGC Simple Features Standard, and as such will handle all Simple Feature geometries. While other OGC Standards also encode Simple Features, GeoParquet is intended to be optimized for native use in cloud environments. It is expected that GeoParquet will be tested as an encoding to be accessed by the OGC API family of Standards. The new SWG expects to have a candidate Standard ready for review and approval within one year.
The OGC GeoParquet Standards Working Group Charter is publicly available via the OGC Portal.
OGC Members can join the GeoParquet Standards Working Group via the OGC Portal. Non-OGC members are welcomed to contribute via OGC’s GeoParquet GitHub repository or by joining the OGC GeoParquet SWG Mailing List. Non-OGC members who would like to know more about full participation in the SWG are encouraged to contact the OGC Standards Program.
The post OGC forms new GeoParquet Standards Working Group appeared first on Open Geospatial Consortium.
-
sur A New Google Map of the Brain
Publié: 24 August 2023, 9:12am CEST par Keir Clarke
If you've ever wanted to look inside someone's brain then you might like the European Commission's new 'Google Map' of the human brain. This new 3D map allows you to take a look inside a human skull and explore atlases of the brain's regions and neural connections.The European Brain Research Infrastructure (EBRAINS) is funded by the European Commission to accelerate brain research and
-
sur Stefano Costa: Gli atti del workshop Archeofoss 2022 sono stati pubblicati
Publié: 23 August 2023, 12:38pm CEST
Gli atti del workshop Archeofoss 2022 sono stati pubblicati in open access su Archeologia e Calcolatori. Li trovate qui [www.archcalc.cnr.it] come numero 34.1 della rivista.
Ho curato insieme a Julian Bogdani l’edizione di questo volume ed è quindi motivo di soddisfazione, anche per i tempi rapidi con cui siamo arrivati alla pubblicazione grazie al lavoro collettivo degli autori e autrici, di chi ha fatto il referaggio, della redazione e della casa editrice.
Rimane una mancanza in questo volume rispetto alla ricchezza dei due giorni di incontro, delle sette sessioni tematiche, delle discussioni guidate da chi ha moderato le sessioni, ibride eppure vivacissime. La mancanza in parte è fisiologica ma in parte deriva da un certo numero di autrici e autori che non hanno presentato il proprio contributo per la pubblicazione. Ad esempio, nella sessione sui dati stratigrafici che ho moderato con Emanuel Demetrescu erano stati presentati 7 interventi ma solo 2 sono confluiti come paper nel volume.
Nei prossimi anni dovremo fare di più per fare in modo che gli atti raccolgano ancora più fedelmente il convegno.
Ci ritroveremo con la comunità Archeofoss a Torino nel mese di dicembre 2023.
-
sur Using AI to Geolocate Photos
Publié: 23 August 2023, 11:25am CEST par Keir Clarke
Recently Google added Google Lens to Bard, its AI chatbot. Today I decided to test how good Bard is at identifying locations in photographs by giving it a few screenshots of random locations from Street View and seeing how accurate Bard is at geolocating the actual locations shown. Let's start with an easy one. I showed Bard the above picture of Tower Bridge in London and asked it 'Where was
-
sur QGIS Blog: QGIS server 3.28 is officially OGC compliant
Publié: 22 August 2023, 12:05pm CEST
QGIS Server provides numerous services like WMS, WFS, WCS, WMTS and OGC API for Features. These last years, a lot of efforts were made to offer a robust implementation of the WMS 1.3.0 specification.
We are pleased to announce that QGIS Server LTR 3.28 is now certified against WMS 1.3.0.

This formal OGC certification process is performed once a year, specifically for the Long Term Release versions. But, as every change in QGIS source code is now tested against the formal OGC test suites (using OGC TeamEngine) to avoid any kind of regressions, you can always check any revision of the code against OGC failures in our Github continuous integration results.
All this has been possible thanks to the QGIS’s sustaining members and contributors.
-
sur Unlocking America’s Visual Time Machine
Publié: 22 August 2023, 9:32am CEST par Keir Clarke
As well as having an insatiable passion for maps I also really enjoy browsing old photographic collections. Like maps vintage photographs have the power to transport our imaginations to completely different times and places. For example Yale University's Photogrammar collection can instantly take you back to the bygone era of mid-20th Century America. Photogrammar provides access to a huge
-
sur OGC, UKHO, and partners release the IGIF-(M)SDI Maturity Roadmap
Publié: 21 August 2023, 3:00pm CEST par Simon Chester
The Open Geospatial Consortium (OGC) is pleased to host and release the first iteration of the IGIF-(M)SDI Maturity Roadmap and supporting materials for community consideration and engagement across not only the marine domain, but any geospatial domain connected to the oceans.
Developed as part of OGC’s ongoing Federated Marine Spatial Data Infrastructure (FMSDI) Initiative, the Integrated Geospatial Information Framework – (Marine) Spatial Data Infrastructure (IGIF-(M)SDI) Maturity Roadmap is a quick-start guide for nations and marine organizations that seeks to advance and simplify efforts in Marine SDI and ensure their alignment with the UN-IGIF principles.
“The IGIF-MSDI maturity roadmap is an important step that supports a holistic understanding of data-exchange and -processing environments,” commented OGC Chief Technology Innovation Officer, Ingo Simonis, Ph.D. “The Roadmap enhances and complements the usual technological focus of SDIs with the equally important criteria outlined in the IGIF Principles. With the Roadmap, OGC continues its engagement and research in support of powerful, sustainable, interoperable geospatial ecosystems at all levels, including technology & standards, policies, communities, education, and capacity building efforts.”
One of the key messages of the document is that an (M)SDI is a continual journey and not an “end state” of expensive technological solutions. The document asserts that nations are sovereign in what manner of (M)SDI they genuinely need for their national requirements, and not governed by an externally imposed or presumed level of technological sophistication.
“Working collaboratively with partners at the World Bank, NOAA, OGC, IHO, and private industry, The UK Hydrographic Office (UKHO) believes that the IGIF-(M)SDI Maturity Roadmap will help many Governments begin their IGIF-aligned digital transformation journeys – whether that be within the Marine or Terrestrial domains,” commented Dr. Gerald J Wong, Data Governance Lead, UKHO.
“As an accessible “Quick Start” or “Stepping Stone” toolkit, the core of the IGIF-(M)SDI Maturity Roadmap is formed by the World Bank SDI Diagnostic Toolkit where, with contributions from IHO and OGC, its Terrestrial heritage was augmented to maximize its benefits to the Marine community. The IGIF-(M)SDI Maturity Roadmap is aligned with the UN-IGIF principles and is fully interoperable with Terrestrial interests.”
When properly executed, the resulting MSDI Diagnostic Toolkit provides a quantitative assessment for nations or marine agencies to baseline their MSDI maturity, as aligned to the UN-IGIF principles. The modular IHO and OGC additions ensure interoperability with the World Bank IGIF methodology, which can lead to the financing of approved MSDI development projects. Even as an independent tool, undertaking an MSDI assessment provides a clear reference point that’s aligned with international Best Practice. Without such a starting point, progress towards any MSDI end state will be difficult to govern and manage.
“As the provider of ADMIRALTY navigation products and services worldwide, the UKHO supports nations in unlocking the many and varied benefits of their marine space,” commented James Carey, Deputy Chief Data Officer at the UKHO “We are a strategic member of the Open Geospatial Consortium and proudly lend our expertise to the development of Marine Spatial Data Infrastructure (MSDI), as an enabler of security, prosperity, and environmental stewardship. By fusing marine data with spatial insights it is possible to forge a path to a more interconnected world where oceans inspire growth and communities prosper.”
The IGIF-(M)SDI Maturity Roadmap and related resources are available for free on OGC’s IGIF-(M)SDI Maturity Roadmap webpage.
To best inform future revisions, iterations, and the optimization of the Roadmap, feedback and applied experiences from the geospatial community are sought via OGC Member Meetings, Forums, or directly.
The IGIF-(M)SDI Maturity Roadmap is an independent initiative not endorsed by or officially connected to, but in alignment and support of, the mission, vision, and goals of the United Nations Initiative on Global Geospatial Information Management (UN-GGIM).
The post OGC, UKHO, and partners release the IGIF-(M)SDI Maturity Roadmap appeared first on Open Geospatial Consortium.
-
sur Mapping Water Scarcity
Publié: 21 August 2023, 8:56am CEST par Keir Clarke
Last week the Washington Post reported on a new analysis from the World Resources Institute which found that half of the world's population already experiences water stress at least once every year. According to the WRI's analysis 25 countries around the world are now exposed to extreme water stress and the global demand for water is now exceeding what there is available.The Post's article
-
sur Sean Gillies: Bear training week ~6 recap
Publié: 20 August 2023, 8:14pm CEST
For fun I'm using the bitwise complement operator
~in the title of this post. Race week is week ~0. On Monday, it was 6 weeks to race week. I'm starting to feel fit, close to my 2020-2021 form.The numbers for the week:
16 hours, 54 minutes
71 miles
12,165 feet D+
I've run six days in a row and my shortest run was today's: an hour and 20 minutes. I went out for five hours in Rocky Mountain National Park on Wednesday, two hours in Lory State Park on Friday, and five and a half hours at Horsetooth Open Space on Saturday.

Soaking hot and tired feet in the Big Thompson River below Fern Lake in RMNP.

Below the Westridge Wall in Lory S.P.

Alone on Arthur's Rock, looking NE across the reservoir and plains.

Towers trail tailgating
A bear was active around Towers Trail yesterday, but successfully avoided me. According to some bikers, it crossed the trail behind my back near the top during my first lap. If I'd turned when I heard them shouting, I might have seen it. I know there are bears up there, but have never seen one while I've been on the trail. It's a good time to be filling up on chokecherries, that's for sure.
Next week I'm going to increase my training volume a little more. Instead of two 5.5 hour runs, I'll aim for 3 x 4 hours.
-
sur Free and Open Source GIS Ramblings: I’ve archived my Tweets: Goodbye Twitter, Hello Mastodon
Publié: 20 August 2023, 4:38pm CEST
Today, Jeff Sikes @box464@firefish.social, alerted me to the fact that “Twitter has removed all media attachments from 2014 and prior” (source: [https:]] ). So far, it seems unclear whether this was intentional or a system failure (source: [https:]] ).
Since I’ve been on Twitter since 2011, this means that some media files are now lost. While the loss of a few low-res images is probably not a major loss for humanity, I would prefer to have some control over when and how content I created vanishes. So, to avoid losing more content, I have followed Jeff’s recommendation to create a proper archival page:
It is based on an export I pulled in October 2022 when I started to use Mastodon as my primary social media account. Unfortunately, this export did not include media files.
To follow me in the future, find me on:
Btw, a recent study published on Nature News shows that Mastodon is the top-ranking Twitter replacement for scientists.
To find other interesting people on Mastodon, there are many useful tools and lists, including, for example: