Contoured Fuji
Today's 30DayMapChallenge is - Prompting Only
Yesterday Andy Woodruff posted this animated contour map:
...Agrégateur de flux RSS - Actualités et contenus géomatiques
Today's 30DayMapChallenge is - Prompting Only
Yesterday Andy Woodruff posted this animated contour map:
...Retrouvez le calendrier des formations sur les donnĂ©es fonciĂšres. FICHIERS FONCIERSL'organisme de formation est certifiĂ© Qualiopi. DV3FL'organisme de formation est certifiĂ© Qualiopi. DONNĂES FONCIĂRESL'organisme de formation est certifiĂ© (âŠ)
Dear all,
The CRO is pleased to announce the list of new OSGeo Charter Members.
...GeoDataDays 2027 : la 10Ăšme Ă©dition se dĂ©voile⊠DĂ©couvrez les replays du Grand DĂ©bat dâouverture La 9Ăšme Ă©dition des GeoDataDays a rassemblĂ© plus de 1 500 participants lors des plĂ©niĂšres au Palais des CongrĂšs de Tours, en Centre Val de Loire. Le Grand DĂ©bat « Data et territoires : lâunion fait-elle la force ? » [âŠ]
The post Annonce de lâĂ©dition 2027 des GeoDataDays et ressources 2026 đ first appeared on AfigĂ©o.RustGIS est un nouveau logiciel SIG dĂ©veloppĂ© en Rust qui propose une alternative lĂ©gĂšre et performante Ă QGIS. Fonctionnement dans le navigateur, formats gĂ©ospatiaux modernes, automatisation et intĂ©gration des agents IA avec MCP : dĂ©couvrez sesâŠ
The post RustGIS : une alternative Ă QGIS ? DĂ©couvrez le nouveau SIG pensĂ© pour lâIA first appeared on Blog SIG & Territoires.
Have you ever wondered how many satellites have passed overhead while you've been going about your daily business? Probably quite a few. But how many of them were actually looking at you? Watched is an intriguing new interactive map which attempts to answer that question by revealing which satellites have passed over any location on Earth during the last seven days, and, more interestingly, which of them actually took a photograph.
Visit Watched and enter any location in the world. The map will then reconstruct the satellite activity above that spot over the previous week, identifying the satellite that passed within viewing range and searching public satellite imagery archives for photographs captured during those passes.
...
Cet article est le dernier de la sĂ©rie consacrĂ©e Ă la collaboration avec Soilcloud et Apeiron, dont nous vous aviez fait part dans un prĂ©cĂ©dent article, et Ă travers laquelle nous avions soulignĂ© lâimportance de SFCGAL et de Giro3D.
Nous allons reparler ici du projet Albion, bien connu des utilisateurs de QGIS dans le minier !
Passer dâun projet client Ă un produit nâest jamais facile, passer dâune application desktop au web non plus, combiner les deux est un vĂ©ritable challenge !
...
Mardi 24 novembre 2026, de 19h à 21h, Café de Flore, salle du premier étage, 172 boulevard Saint-Germain, 75006 Paris
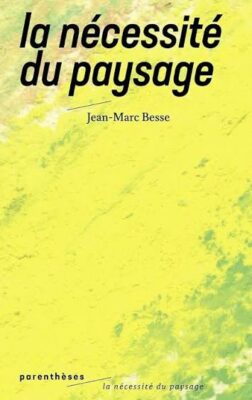
Mardi 24 novembre 2026, notre troisiĂšme cafĂ© gĂ©o de la saison 2026-2027 sera consacrĂ© au thĂšme du paysage en sâintĂ©ressant particuliĂšrement aux questions du cadre de vie, de lâenvironnement et du patrimoine. Pas moins de trois intervenants ont Ă©tĂ© invitĂ©s pour traiter de ce sujet : le philosophe Jean-Marc Besse, les gĂ©ographes Jean-Louis Tissier et Emilie Richard, cette derniĂšre Ă©tant par ailleurs Inspectrice des sites en Gironde.
...
Vous remarquez une erreur sur la carte ? Vous pouvez la faire remonter en faisant un signalement.
Limites du signalement #Avant de faire votre signalement, nous attirons votre attention sur le fait que certains thĂšmes ne feront pas lâobjet dâune valorisation.
Décalage entre le PCIexpress et la photographie aérienne :
...Du 27 au 29 octobre, des reprĂ©sentantes de lâAfigĂ©o ont participĂ© au CongrĂšs « Rendez-vous gĂ©omatique 2026 » au Centre dâĂvĂšnements et de CongrĂšs Interactifs (CECi) de Trois-RiviĂšres au QuĂ©bec. Une dynamique de collaboration qui se poursuit entre AfigĂ©o et GĂ©ospatial QuĂ©bec depuis 2024, soutenue par la coopĂ©ration France-QuĂ©bec. Cet Ă©vĂšnement est organisĂ© conjointement par lâAssociation de [âŠ]
The post Retour sur le rendez-vous géomatique 2026 au Québec first appeared on Afigéo.
There is something undeniably romantic about casting a message in a bottle into the ocean. After all, what could be more enchanting than surrendering a personal secret to the tides, with nothing but the hope that it might one day wash ashore and find its way into a stranger's hands?
Tell the Sky takes this idea to the skies. However with this interactive map, instead of throwing a bottle into the ocean, you write a message on a glowing virtual lantern and release it into the wind. Carried by real-world wind currents, your lantern drifts across the world until someone catches it, reads your message and adds one of their own before sending it on its way again.
...
Koch, P., Stojkoski, V. et CA Hidalgo (2024). « Augmenting the availability of historical GDP per capita estimates through machine learning  » [Augmenter la disponibilité des estimations historiques du PIB par habitant grùce à l'apprentissage automatique]. Proceedings of the National Academy of Sciences (PNAS). URL : https://www.pnas.org/doi/10.1073/pnas.2402060121
...
Today's #30DayMapChallenge is Utopia.
There have been lots of pixel-art maps appearing online recently. I covered several of these projects in my recent Pixelate the World post. For today's challenge I thought it might be interesting to create a pixelated map of London â not as it is, but as it might look in an ideal world.
Greater London covers approximately 1,591 square kilometres. If each zoomed-in map tile covers roughly 0.15 square kilometres, I would need in the region of 10,600 images to create enough tiles to cover the entire capital. That's a few too many for a simple map challenge, so I decided to create a much smaller map - using just one tile - of Trafalgar Square.
...
29/10/2026-04/11/2026
...
Today's #30DayMapChallenge is 10 minute map.
My Mount Fuji map took 30 seconds.
Vibe-coding might be cheating (and perhaps even the end of civilisation as we know it), but it really can help developers create online maps very, very quickly. To create my map, I simply entered the following prompt into ChatGPT:
'I have downloaded a geojson of Mount Fuji. Can you give me the code for a three.js illuminated neon contour map. Add an animation to rotate around the center of the mountain. My geojson URL is https://mapsmania.github.io/mapchallenge/contours.geojson'
It then took me 30 seconds to download and run the resulting HTML file. Job done!
...
For thousands of years, cartographers have been mapping more than just the known world. Medieval and early modern maps often mixed observed geography with religious beliefs, folklore and mythical stories, placing legendary cities, lost kingdoms and biblical locations alongside real-world places.
Mythical Tours is a fascinating narrated journey through this imaginary geography, using centuries of historical maps to track down the locations of places that many people today believe exist only in legend.
...Le GT PCRS est riche dâactualitĂ©, entre son traditionnel atelier organisĂ© lors des GeoDataDays de Tours qui a fait salle comble, le webinaire dĂ©diĂ© Ă la dĂ©tection du changementâŻet les travaux des diffĂ©rents GT. Retrouvez toutes les ressources utilesâŻdans un article complet ! Session aux GeoDataDays DĂ©tecter les changements du corps de rue grĂące aux [âŠ]
The post Webinaire PCRS : actualitĂ©, ressources des GeoDataDays et du webinaire first appeared on AfigĂ©o.Â
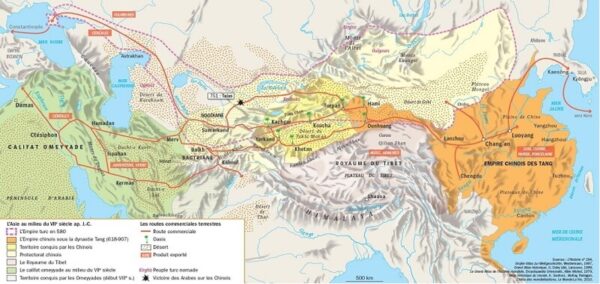
Source : Boehm, J. , Chaney, T. (2026). « Trade and the End of Antiquity », National Bureau od Economic Research. Working Paper 35156, april 2026. URL : https://www.nber.org/papers/w35156
...
If your children are too young to enjoy Untappd, you could introduce them to Birds Around the World instead. With this map, rather than tracking all the beers they've drunk, they can collect all the different birds they've discovered! Get them started with binoculars and field guides rather than pints and beer goggles.
Birds Around the World is an interactive 3D globe that allows children to explore the world's birdlife. Hundreds of bird species are represented on the globe, with each dot marking where a particular species can be found. Click on a bird to discover a photograph, its conservation status, what it eats and, best of all, a recording of its actual bird call.
...
Dans le cadre de notre initiative Security project for QGIS, nous avions identifiĂ© un lot intitulĂ© Improve Memory Safety, que lâon pourrait traduire approximativement par AmĂ©lioration de la sĂ©curitĂ© mĂ©moire.
Aprés avoir travaillé sur ce sujet ces derniers mois, voici un condensé de la problématique et de ce qui a été réalisé jusque là .
PrĂ©senter ce sujet nâest pas forcĂ©ment chose aisĂ©e. Je mâefforcerai tant que possible de ne pas entrer dans des dĂ©tails trop techniques pour me concentrer sur les enjeux de la dĂ©marche.
...Before mobile phones, radio and even the telegraph, fire beacons were used as an early warning system designed to alert communities to the approach of hostile forces. The beacons were deliberately positioned on prominent high ground, allowing one fire to be seen from another. When an enemy was spotted, a chain of burning beacons could then relay the warning across the landscape.
The system was particularly important during the threat of invasion by the Spanish Armada in 1588. Beacons could take various forms, from simple bonfires to barrels of pitch or iron fire baskets mounted on tall wooden poles. Some were substantial enough to have permanent structures.
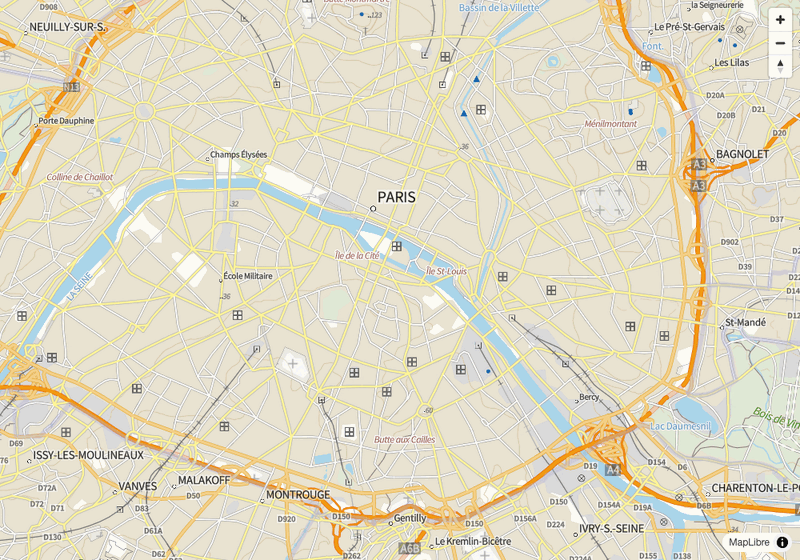
...A la faveur des mobilisations du mouvement lycéen et du mouvement social de l'automne 2026, on voit circuler de nombreuses cartes de parcours de manifestion sur Internet et dans les médias. A Paris, dans le cadre des défilés traditionnels Bastille-Nation, mais aussi dans d'autres centres-villes en France, les cortÚges ont l'habitude d'emprunter des itinéraires symboliques à proximité des lieux de pouvoir. Suite aux violences urbaines qui ont émaillé l'Acte I de mobilisation le samedi 17 octobre 2026, des tensions assez fortes sont apparues concernant la question du tracé autorisé. Afin de protéger les commerces, le MinistÚre de l'Intérieur et la Préfecture de police de Paris ont demandé à ce que les cortÚges soient déplacés sur de nouveaux itinéraires plus extérieurs, de la porte d'Italie à la porte de Vincennes ou encore de la porte de Bagnolet à celle de Charenton. Sous prétexte d'éviter les débordements, les manifestants ont commencé à soupçonne...
On October 19, 2026 the GeoServer project announced three releases: 3.0.2, 2.28.6 and 2.27.7. For most deployments these are maintenance and security updates. For organizations that must run their geospatial infrastructure under formal cryptographic requirements, 3.0.2 carries something more: a new FIPS community module, developed by GeoSolutions, that lets GeoServer run on top of a FIPS 140-3 validated cryptographic module. In this post we look at what the module enables, the engineering behind it, and what teams should plan before adopting it.
...
In October, YouGov published a small-multiple visualisation showing the popularity of regional names for alleyways in the UK. The maps in What else do Britons call an alleyway? are based on survey data. YouGov asked 39,224 Britons which words they personally use to describe an alleyway. The resulting maps show the percentage of people in each county or region who use particular terms.
I thought it might be interesting to also map the different words for alleyways that actually appear in street names around the UK.
...
If you want to know what happened in yesterday's midterm elections, you should probably start with The Economist's Swing from 2024 map. The map is paywalled, but the screenshot above tells the story rather well: almost the entire USA (perhaps with the exception of South Dakota) swung towards the Democrats.
...
Non-Governmental Organizations (NGOs) are key actors in the conservation and restoration of ecosystems worldwide. However, practice-oriented conservation groups face a major hurdle: evaluating the real-world impact of their management activities over large geographic areas. Traditional monitoring methods rely on labor-intensive on-the-ground surveys, which are difficult to sustain at scale. While satellite Earth Observation (EO) data, such as Copernicus Sentinel-2, offer wide-scale coverage and long-term time series, using them effectively requires complex domain knowledge, spatial data handling, and specialized data processing skills.
This weekâs challenge is:
...Contrairement à la pauvreté monétaire, l'Indice de Pauvreté Multidimensionnelle (IPM) mesure les privations que subissent directement les individus au quotidien dans des domaines aussi essentiels que la santé (sous-alimentation, mortalité infantile), l'éducation (fréquentation scolaire, nombre d'années de scolarité) ou encore le niveau de vie (accÚs à l'eau potable, à l'électricité, à l'assainissement, à un logement convenable). Pour rappel, la lutte contre la pauvreté sous toutes ses formes et partout dans le monde constitue le premier Objectif de développement durable (ODD). L'Indice de pauvreté multidimensionnelle (IPM) est l'une des mesures reconnues par l'ONU pour rendre compte des progrÚs accomplis dans ce sens. à mi-parcours du Programme 2030, en septembre 2023, l'Assemblée générale des Nations Unies a réaffirmé l'importance de l'ODD 1 en déclarant que « l'éradication de la pauvreté sous toute...
Oslandia sera présent au PostGIS Day 2026 | Jeudi 19 novembre
Une journĂ©e entiĂšre consacrĂ©e Ă lâinformatique gĂ©ospatiale open source, Ă des Ă©tudes de cas concrets et Ă une session de questions-rĂ©ponses en direct avec les acteurs qui façonnent lâavenir.
Loïc Bartoletti et Jean Felder animeront la conférence « 3D Urban Planning with PostGIS SFCGAL »
La version 2.3.0 de SFCGAL a introduit une prise en charge initiale des NURBS et de nouvelles formes de toitures, qui seront disponibles dans PostGIS 3.7.0. GrĂące Ă cela, nous pouvons crĂ©er des modĂšles dâurbanisme 3D rĂ©alistes. Nous montrerons comment utiliser les NURBS et comment gĂ©nĂ©rer des bĂątiments en 3D dotĂ©s de toitures rĂ©alistes (Ă une seule pente, Ă pignon, en croupe, etc.).
Plus dâinformations et inscription : https://www.snowflake.com/en/postgis-day/
Limitation du nombre de couches appelées simultanément pour le WMS Unique
Le nombre de couches simultanĂ©es pouvant ĂȘtre appelĂ© avec une requĂȘte GetMap va ĂȘtre limitĂ© Ă 2.
...
Today's #30DayMapChallenge is Polygons.
At the risk of starting World War III, I've created a map of Poland's Historical Borders. The map uses polygons to show how Poland's borders have changed at different points in its history. The historical boundaries were downloaded from OpenHistoricalMap.
...Chaque annĂ©e, le GT DĂ©fense & SĂ©curitĂ© de lâAfigĂ©o est Ă lâhonneur dans la programmation des GeoDataDays ! AnimĂ©e cette annĂ©e par Nicolas GUĂRIN (Isogeo/AfigĂ©o) la session a permis de questionner la notion de dualitĂ© et mettre en avant des cas dâusage concrets, retour sur cette session en trois temps : Cette confĂ©rence a Ă©tĂ© [âŠ]
The post La dualité : la thématique du GT Défense & sécurité first appeared on Afigéo.
MapLibre GL JS est une bibliothĂšque JavaScript open-source qui affiche des cartes interactives dans un navigateur, Ă partir de tuiles vectorielles ou dâimages tuilĂ©es. Elle lit directement les fichiers de styles de la GĂ©oplateforme et, depuis sa version 6.15, elle affiche aussi des tuiles dans une autre projection que Web Mercator, comme Lambert 93.
Dans cet article nous allons apprendre Ă Â :
...
It seems astonishing to me now that only a fortnight has passed since I climbed to the roof of Maps Mania Tower and proclaimed to the world that the Age of the Pixel Map had begun. And yet here I stand before you today, bearing the sad news of its demise and announcing, with no little ceremony, that The Era of the Voxel Map Has Arrived.
Two weeks ago, I observed that "One notable limitation shared by most of these pixelated maps is their single, fixed perspective." My proposed solution was to create a pixel map offering four distinct viewpoints: North, South, East and West.
...Comment utiliser TerraLab AI Agent dans QGIS et peut-on lui confier de vĂ©ritables analyses gĂ©ographiques ? Ă travers 32 tests pratiques rĂ©alisĂ©s avec QGIS 4.2, cet article Ă©value les capacitĂ©s de cet agent dâintelligence artificielle :âŠ
The post [FR]Et si vous pouviez confier vos traitements SIG Ă un agent IA dans QGIS ? Test dâAI Agent de TerraLab. first appeared on Blog SIG & Territoires.Un agent IA directement dans QGIS ? Nous avons testĂ© AI Agent by TerraLab de lâinstallation Ă lâexport PDF, sur un vrai cas dâusage Ă Erdeven. Avantages et limites. Continuer Ă lire â
Lâarticle AI Agent dans QGIS : installation, paramĂštres et cas dâusage est apparu en premier sur GEOMATICK.
Cybergeoâs thirty years were celebrated together with around sixty attendees during a one-day symposium held in March 2026. âThe integration of artificial intelligence tools into scientific publishingâ was discussed collectively during a round-table session combined with a Q&A session with the audience. The consensus is clear: generative AI is gaining ground in writing and is profoundly changing the way submissions are evaluated and, more broadly, changing scientific publishing. The discussions held during the second session on âOpen Science in Action â Models, Data, Citationsâ offered a look back at how Cybergeo had been ahead of its time from the very first day (web-based, open-access publication, free of charge for both authors and readers). It also provided another opportunity to trace the journalâs evolution over time, with the creation of both the âGeOpenMod â Models and Softwareâ and âData Papersâ sectio...
Les 30 ans de Cybergeo ont Ă©tĂ© fĂȘtĂ©s avec une soixantaine de participant·es lors dâune journĂ©e dâĂ©tude organisĂ©e en mars 2026. âLâintĂ©gration des outils dâintelligence artificielle dans la publication scientifiqueâ a Ă©tĂ© discutĂ©e collectivement lors dâune table ronde couplĂ©e avec des Ă©changes avec la salle. Le constat est partagé : lâIA gĂ©nĂ©rative prend une place croissante dans lâĂ©criture et bouleverse les processus dâĂ©valuation des soumissions et, plus largement, lâĂ©dition scientifique. Les discussions menĂ©es durant la deuxiĂšme session sur la âscience ouverte en pratique â modĂšles, donnĂ©es, citationsâ ont notamment permis de revenir sur la façon dont Cybergeo a pu ĂȘtre en avance sur son temps dĂšs sa crĂ©ation (publication sur le web, en accĂšs libre, sans coĂ»t ni pour les auteurices, ni pour les lecteurices) et sur les Ă©volutions de la revue au fil du temps, avec la crĂ©atio...
Los 30 años de Cybergeo se celebraron con una sesentena de participantes durante una jornada organizada en marzo de 2026. En esta instancia, se debatiĂł colectivamente mediante un trabajo organizado en diferentes mesas redondas âLa integraciĂłn de las herramientas de inteligencia artificial en la publicaciĂłn cientĂficaâ. El diagnĂłstico es compartido: la IA generativa ocupa un lugar creciente en la escritura y trastorna los procesos de evaluaciĂłn de las propuestas y, mĂĄs ampliamente, la ediciĂłn cientĂfica. Los debates desarrollados durante la segunda sesiĂłn sobre la âciencia abierta en la prĂĄctica â modelos, datos, citasâ permitieron, en particular, reflexionar nuevamente sobre la manera en que Cybergeo se adelantĂł a su tiempo desde su creaciĂłn (publicaciĂłn en la web, acceso abierto, sin costo alguno para los(as) autores(as) y para los(as) lectores(as) y sobre las evoluciones de la revista a lo largo del tiempo, ...
Cybergeoâs thirty years were celebrated together with around sixty attendees during a one-day symposium held in March 2026. âThe integration of artificial intelligence tools into scientific publishingâ was discussed collectively during a round-table session combined with a Q&A session with the audience. The consensus is clear: generative AI is gaining ground in writing and is profoundly changing the way submissions are evaluated and, more broadly, changing scientific publishing. The discussions held during the second session on âOpen Science in Action â Models, Data, Citationsâ offered a look back at how Cybergeo had been ahead of its time from the very first day (web-based, open-access publication, free of charge for both authors and readers). It also provided another opportunity to trace the journalâs evolution over time, with the creation of both the âGeOpenMod â Models and Softwareâ and âData Papersâ sectio...
Les 30 ans de Cybergeo ont Ă©tĂ© fĂȘtĂ©s avec une soixantaine de participant·es lors dâune journĂ©e dâĂ©tude organisĂ©e en mars 2026. âLâintĂ©gration des outils dâintelligence artificielle dans la publication scientifiqueâ a Ă©tĂ© discutĂ©e collectivement lors dâune table ronde couplĂ©e avec des Ă©changes avec la salle. Le constat est partagé : lâIA gĂ©nĂ©rative prend une place croissante dans lâĂ©criture et bouleverse les processus dâĂ©valuation des soumissions et, plus largement, lâĂ©dition scientifique. Les discussions menĂ©es durant la deuxiĂšme session sur la âscience ouverte en pratique â modĂšles, donnĂ©es, citationsâ ont notamment permis de revenir sur la façon dont Cybergeo a pu ĂȘtre en avance sur son temps dĂšs sa crĂ©ation (publication sur le web, en accĂšs libre, sans coĂ»t ni pour les auteurices, ni pour les lecteurices) et sur les Ă©volutions de la revue au fil du temps, avec la crĂ©atio...
Los 30 años de Cybergeo se celebraron con una sesentena de participantes durante una jornada organizada en marzo de 2026. En esta instancia, se debatiĂł colectivamente mediante un trabajo organizado en diferentes mesas redondas âLa integraciĂłn de las herramientas de inteligencia artificial en la publicaciĂłn cientĂficaâ. El diagnĂłstico es compartido: la IA generativa ocupa un lugar creciente en la escritura y trastorna los procesos de evaluaciĂłn de las propuestas y, mĂĄs ampliamente, la ediciĂłn cientĂfica. Los debates desarrollados durante la segunda sesiĂłn sobre la âciencia abierta en la prĂĄctica â modelos, datos, citasâ permitieron, en particular, reflexionar nuevamente sobre la manera en que Cybergeo se adelantĂł a su tiempo desde su creaciĂłn (publicaciĂłn en la web, acceso abierto, sin costo alguno para los(as) autores(as) y para los(as) lectores(as) y sobre las evoluciones de la revista a lo largo del tiempo, ...
Le mercredi 4 novembre aura lieu la rencontre mensuelle du groupe local bordelais đ.
Vous pouvez nous rejoindre Ă 18h30 aux locaux d'Aquilenet pour discuter de vos cartographie, de vos contributions et de vos projets autour d'OpenStreetMap ! đșïž
ThĂšme : OpenStreetMap et l'ESS
Les structures de l'économie sociale et solidaire sont partout sur le territoire. Aidons les associations, fondations, coopératives et autres acteurs de l'ESS à utiliser plus largement OSM.
Petit apĂ©ro pour discuter OpenStreetMap Ă l'Ătape 84 : tour de table des sujets et contributions de chacunâ e et initiation Ă l'Ă©cosystĂšme OpenStreetMap pour les nouvelles personnes ! Nous devrions occuper une des salles de rĂ©union.
Tout le monde est bienvenuâ e, mĂȘme si vous dĂ©butez ou n'ĂȘtes pas (encore) venu·e Ă une rencontre locale !Â
(Il est nécessaire de prendre au moins une consommation par personne.)
For Day 2 of the #30DayMapChallenge, the theme is Lines. For my contribution, I've created MapterGLOW, an interactive 3D terrain map that turns elevation data into glowing neon contour lines.
The map uses elevation tiles from Mapterhorn to build a three-dimensional model of the landscape, overlaid with luminous cyan contour lines at 50-metre intervals. You can rotate the terrain, tilt the camera and zoom in and out to explore the topography from different angles.
...
As part of our Security project for QGIS initiative, we identified a work package titled âImprove Memory Safety.â
Having worked on this topic over the last few months, here is a summary of the issues involved and what has been accomplished so far.
Itâs not an easy thing to present this topic. Iâll try not to dive into too much technical details to focus instead on the broader objectives and implications.
...
Dix postes sont ouverts à candidature dans des structures bretonnes partenaires :
...Vous pouvez retrouver toutes les versions Ă jour de QGis portable disponibles sur ce site sur la page QGis portable pour Windows QGIS est lâun des logiciels SIG (SystĂšme dâInformation GĂ©ographique) open source les plus utilisĂ©sâŠ
The post [FR]Télécharger QGIS 4.2 Portable pour Windows first appeared on Blog SIG & Territoires.
What if every European capital sent out a car at exactly the same moment, with the aim of reaching every town and village in Europe before its rivals? Which capital would claim the most territory, and how far would its influence extend beyond its own national borders?
If Every European Capital Sent Out a Car at the Same Moment is an intriguing interactive map from Copilot Travel that attempts to answer these questions. It imagines 38 cars setting off simultaneously from 38 European capitals, with each car travelling outwards along the road network at typical driving speeds. Every location in Europe is then assigned to whichever capital's car can reach it first.
...Durant les trois derniers mois (août, septembre et octobre), de nouvelles données ont été ajoutées sur les applications thématiques de Guyane-SIG :
Nouvelles donnĂ©es :Â
La couche recense 74 équipements publics géolocalisés dans 19 communes de Guyane, bùtiments comme infrastructures, et porte pour chacun 21 attributs : de son identification à son état technique et réglementaire, en passant par sa parcelle d'assise et son statut d'occupation.
...
Recently, I was very impressed by 10 Years, 10 Adventures, a collection of ten WebGL-powered animated travel maps featuring 3D terrain, animated elements and trip narration. So, for today's #30DayMapChallenge, I decided to try creating something similar: a 3D map of Cap d'Antibes, which I recently visited in the South of France.
My interactive 3D Map of Cap dâAntibes lets you fly around the peninsula, discover some of its best-known landmarks and view the route of an incredible coastal walk. The map includes clickable points of interest, with three photographs I took on my vacation. You can also follow an animated walking route along the coastal Sentier de Tirepoil, watching the route gradually draw itself across the 3D terrain.
...
22/10/2026-28/10/2026
...
Soon after I posted my One Hundred Famous Views of Edo Map, Keir Clarke posted about another map of Japanese woodblock prints on his Maps Mania blog, well worth a read if you want to learn a bit about Japanese landscape art in the 19th C. It turns out that there are a lot more than Hiroshigeâs One Hundred (which are actually 119) and someone had made a map of 297 of these prints across 5 series which had lost its base map and had a couple of other glitches. Keir threw down a challenge âPerhaps Steven could take a sneak peek at the mapâs JavaScript, which contains the coordinates of all the woodblock prints featured, and use them to expand the scope of his own map.â...
The Tabula Peutingeriana is one of the most remarkable surviving maps from the ancient world. Held at the Austrian National Library in Vienna, it is a medieval copy of a Roman road map, originally drawn on a parchment scroll almost seven metres long and just 34 centimetres high.
The map depicts the road network of the Roman Empire, stretching from the British Isles and the Atlantic coast to the Middle East and India. Thousands of place names, roads and distances are recorded along its routes.
...
Visualisation is a key part of any analysis. It is useful not only at the end, when presenting the results, but also throughout the analysis itself. A quick plot can help you interpret intermediate results and decide what to do next.
R and Python offer excellent tools for creating visualisations. When working in GRASS, however, I do not always want to export or reshape the data, or have to remember, or look up, the code needed to create a simple figure. Sometimes, I just want to create a plot directly from within GRASS. At the same time, it should offer enough options to fine-tune the result for online or print publication.
...
In the 1830s, Katsushika Hokusai ignited a golden age of Japanese landscape art with his Thirty-Six Views of Mount Fuji. Capturing the topography, seasons, and human activity around Japan's sacred peak, Hokusaiâs masterpiece inspired his contemporary, Utagawa Hiroshige, to create One Hundred Famous Views of Edo - a breathtaking visual survey of Japanâs bustling capital.
Both series belong to Ukiyo-e (æ”źäžç””), "pictures of the floating world," a genre of Edo-period woodblock prints. More specifically, they elevated the sub-genre of Meisho-e (ćæç””), or "famous place pictures." Fueled by a 19th-century domestic travel boom, these prints served as both fine art and geographical guides, cataloging iconic landmarks and scenic views for a public eager to explore.
...
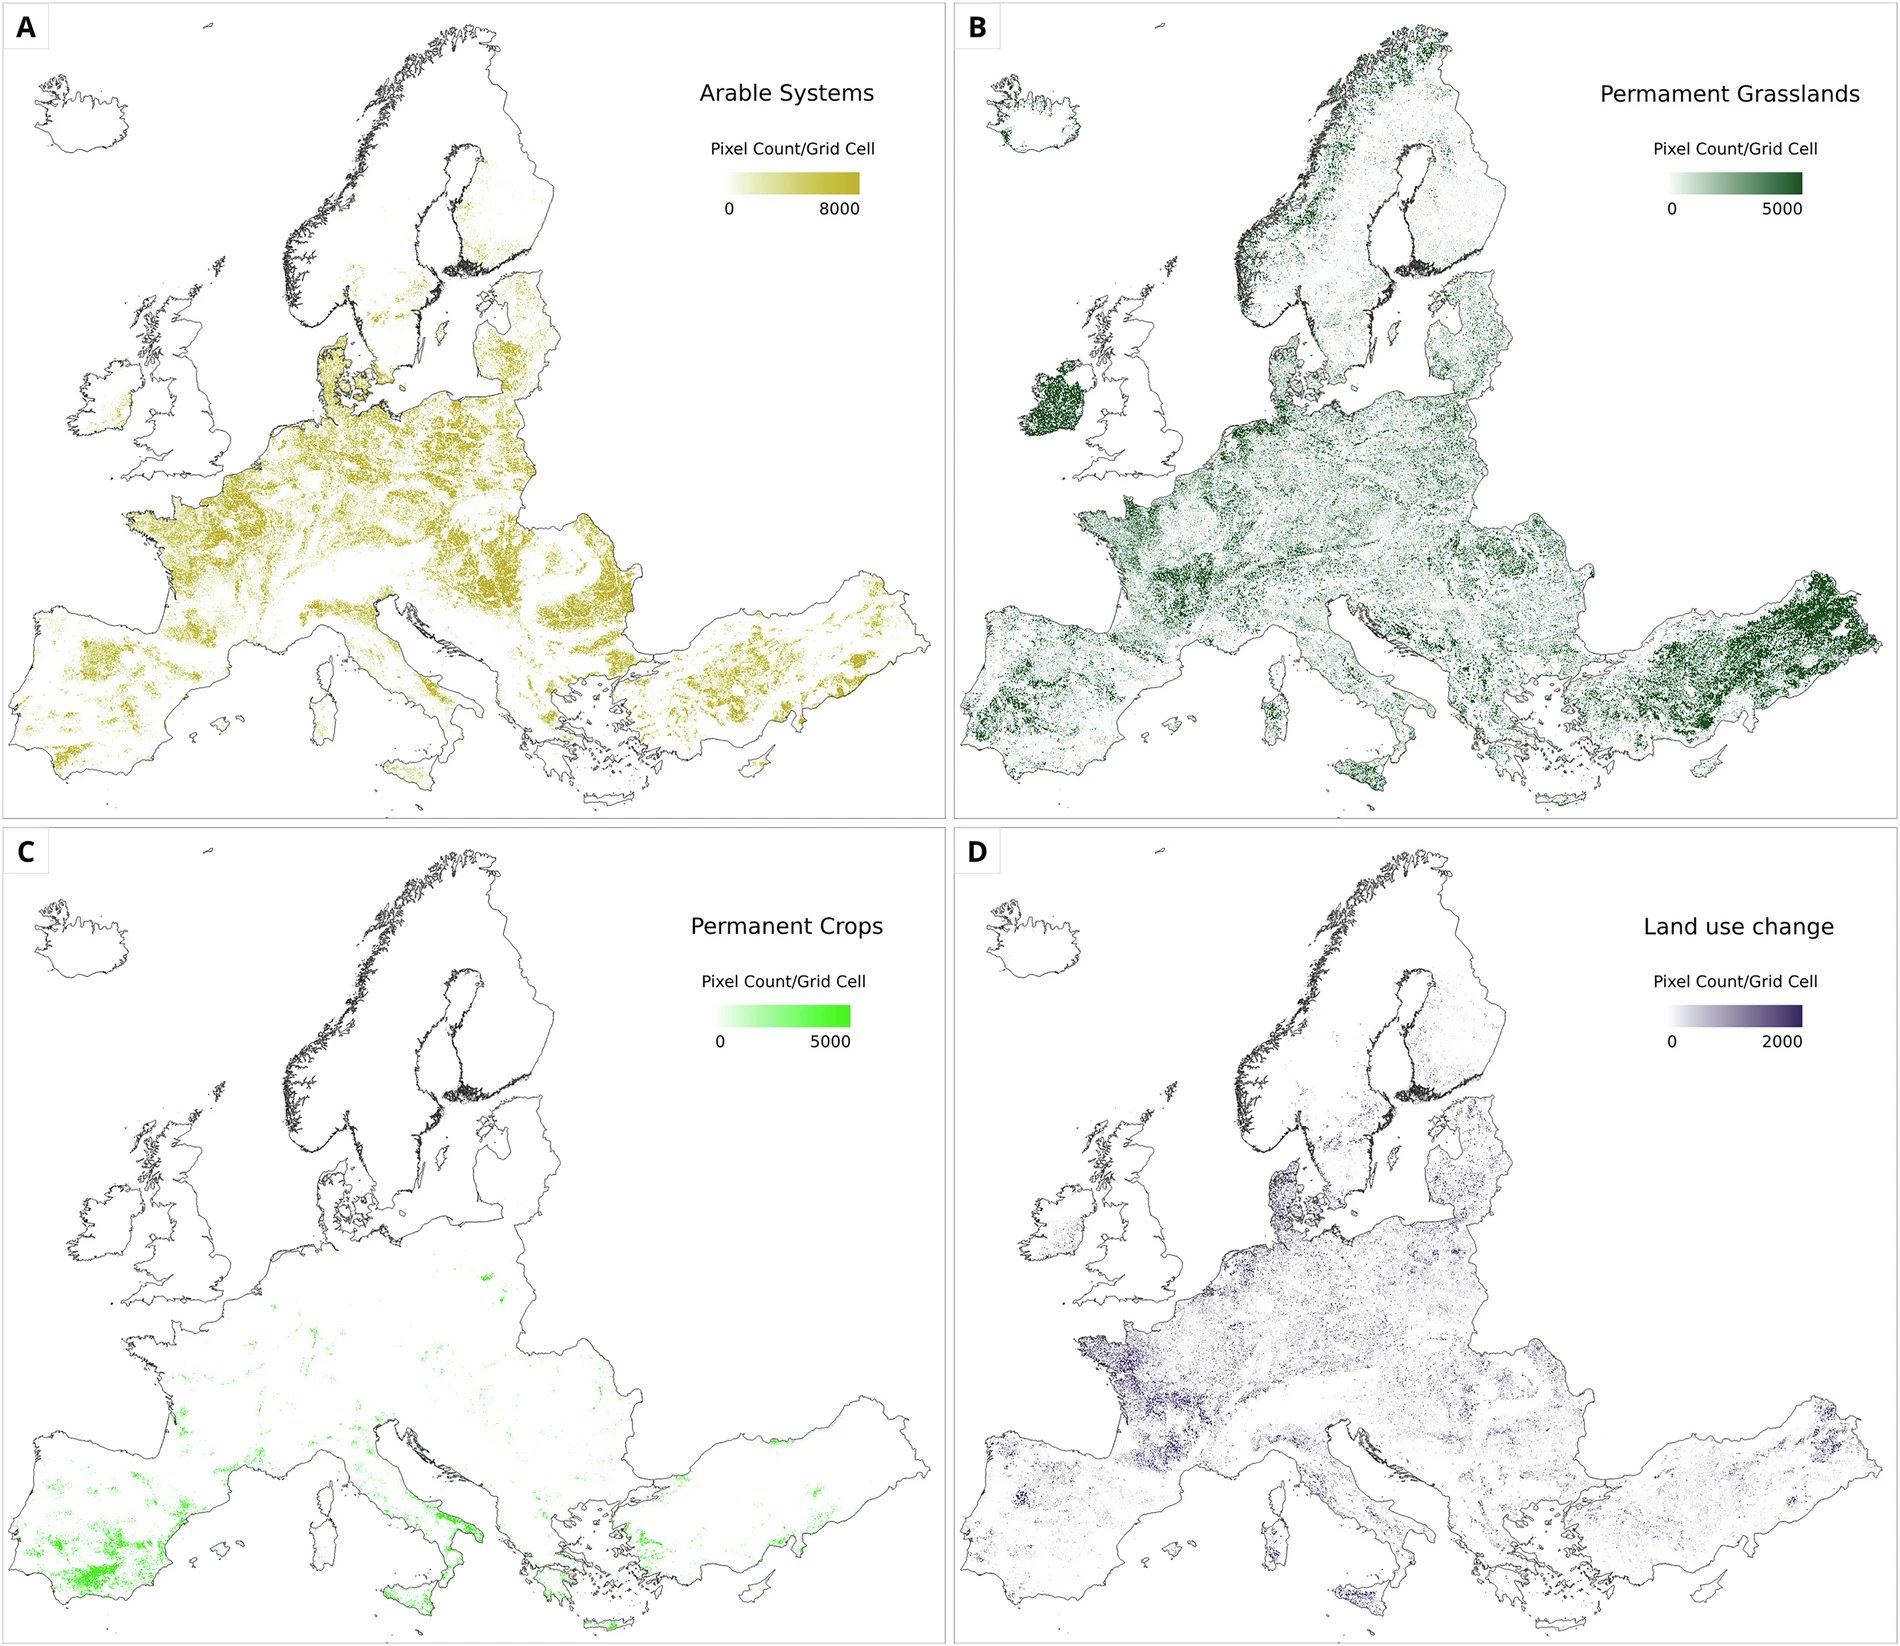
Source : Fahl, F., van der Velde, M., Claverie, M. et al. « Europe wide agricultural land use systems by harmonizing the Copernicus High Resolution Layers on grassland and croplands » [SystÚmes d'utilisation des terres agricoles à l'échelle européenne : harmonisation des couches haute résolution Copernicus sur les prairies et les terres cultivées]. Scientific Data 13, 1055 (2026). Article en accÚs libre. URL : https://doi.org/10.1038/s41597-026-07374-1
Résumé
...The PostGIS Team is pleased to release PostGIS 3.7.0! Best Served with PostgreSQL 19 RC 1 , GEOS 3.15.0 , postgis_tiger_geocoder 2025.2 , and address_standardizer.
...
Doug Greenfield posted his Map of the Week â Map of the 100 Famous Views of Edo saying âThe Wikipedia listing has a table listing each print with an image, title and geographic coordinates. Somebody with more time and better programming skills could make a nice interactive map from this table with popups at each location.â
Well I have the time and an AI with some programming skills so I thought âWhy not?â
So I asked Claude:
...
Yesterday I visited the Night Maps exhibition at the Warburg Institute, which explores the history of celestial maps and globes, and how mapping the heavens has shaped our understanding of the world. Which might account for why I was so blown away by TripGeo Space - a brand new collection of space and sci-fi development projects.
Currently, TripGeo Space consists of two interstellar space tours:
...LâArctique est au carrefour de huit pays souverains dont les frontiĂšres sont contestĂ©es. Aujourdâhui, les Etats-Unis convoitent le Groenland ; le passage du Nord-ouest au nord du Canada pourrait devenir une zone de circulation. Ces changements impactent les autochtones aux avant-postes de nombreux dĂ©fis : gĂ©opolitique, économique, Ă©cologique et culturel. Comment les populations se mobilisent pour y rĂ©pondre ?
Adresse : 30 avenue Corentin- Cariou, 75019 Paris.
Horaires : de 10h à 18h
AccÚs gratuit sur réservation
I recently shared this map (above) showing the countries of the world as drawn by over 3,000 people playing the Borderline country border game. This combined map brings together all the borders and coastlines drawn by players in Borderline and its companion game, Coastlines.
In Borderline, players attempt to draw the outlines of individual countries on a blank map from memory. The results can be surprisingly interesting, which is why, alongside the global map above, you can also explore How the crowd draws every country.Â
This multiple-map visualization animates between each country's actual borders and a composite outline created from all the players' attempts to draw it.
...
In geospatial research and software engineering, we frequently encounter a persistent paradox: sophisticated platforms, cutting-edge hazard models, and rich spatial data infrastructures are built with tremendous technical skill and effort â but lack uptake. Why? Because the development process often occurs in isolation from the operational realities, decision-making pressures, and daily workflows of end-users.
When addressing complex crises like climate change adaptation (CCA) and disaster risk management (DRM), a purely top-down or tech-driven development approach routinely fails. Emergency responders do not need generic GIS viewers with a multitude of layers and tools; civil protection officers require clear, actionable, and rapid information products that answer specific questions during an evolving crisis.
This leads to this weekâs challenge:
...Â
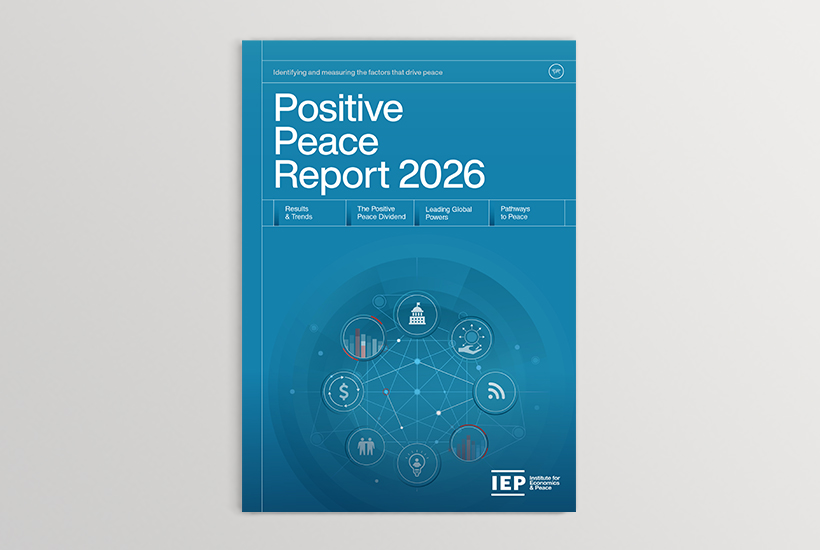
L'Institut pour lâĂ©conomie et la paix (IEP) a publiĂ© son Rapport sur la paix positive et la rĂ©silience dans le monde pour l'annĂ©e 2026. LâIndice mondial de la paix (GPI) 2026 rĂ©vĂšle un monde aux prises avec les consĂ©quences Ă©conomiques dâun nombre record de conflits, de plus en plus interconnectĂ©s et difficiles Ă rĂ©soudre. Cette dĂ©tĂ©rioration est alimentĂ©e par un profond bouleversement gĂ©opolitique, caractĂ©risĂ© par l'essor des puissances moyennes et lâaffaiblissement des puissances europĂ©ennes traditionnelles, phĂ©nomĂšne connu sous le nom de « Grande Fragmentation ». Ă cela sâajoute une rĂ©volution technologique rapide dans le domaine de la guerre, qui relĂšgue le droit international et la diplomatie au second plan.
...Remplacement du Captchétat par le GéoCaptcha
Le CAPTCHA affichĂ© suite Ă une erreur dâauthentification sera maintenant le GĂ©oCaptcha dĂ©veloppĂ© par lâIGN. Ce CAPTCHA gĂ©ographique fera se surperposer deux cartes diffĂ©rentes dâune mĂȘme zone gĂ©ographique quâil faudra aligner correctement. Si besoin, il sera possible de passer par un CAPTCHA accessible en rĂ©pondant Ă une question Ă la place
...Sur les cĂŽtes guyanaises, dâimmenses masses de vase avancent au fil du temps, redessinent le trait de cĂŽte, et restent pourtant sans appellation officielle. LâObservatoire de la Dynamique CĂŽtiĂšre (ODyC) souhaite changer cela avec votre aide.
Une consultation publique est ouverte : suggĂ©rez le nom qui vous semble juste pour chaque banc, puis dĂ©partagez les propositions en votant. Cette dĂ©marche vise Ă faire connaĂźtre ces phĂ©nomĂšnes littoraux et Ă rassembler les connaissances autour dâeux.
Les contributions sont encore possibles : les rĂ©sultats seront prĂ©sentĂ©s lors du prochain COPIL de lâODyC, en juin 2027.
Rendez-vous ici pour participer : http://observatoire-littoral-guyane.fr/appellation-des-bancs-de-vase-votre-contribution/
...Aujourdâhui, le dĂ©troit dâOrmuz et le dĂ©troit de Bab-el-Mandeb sont au centre de lâactualitĂ© gĂ©opolitique maritime avec les accusations de « piraterie » formulĂ©es par les uns et les autres (Iran, Etats-Unis, Houthis, etc.). Demain, peut-ĂȘtre, ce sera au tour du dĂ©troit de Malacca, passage obligĂ© entre le Pacifique et lâocĂ©an Indien, de se retrouver au cĆur des tensions maritimes. Dans un monde oĂč plus de 80% du commerce mondial transite par la voie maritime, la question du contrĂŽle de lâocĂ©an se pose plus que jamais.
Voir la transcription ci-dessous
DĂ©tail dâune mĂ©tadonnĂ©e catalogue : activez le son pour suivre ce tutoriel.Pour illustrer une mĂ©tadonnĂ©e catalogue, nous allons nous appuyer sur la donnĂ©e BD TOPOÂź.
Une métadonnée catalogue comprend généralement une partie « à propos », une partie « Aperçu » et une partie « Ressources et liens » regroupant les sous-parties « Liens » et « Téléchargements et flux ».
à propos #Dans cette premiÚre partie, vous retrouverez en haut de page le titre, la vignette et quelques informations supplémentaires sur le type de la métadonnée, sa date de mise à jour et le type de mise à jour de la donnée.
...Sorry, this entry is only available in French.
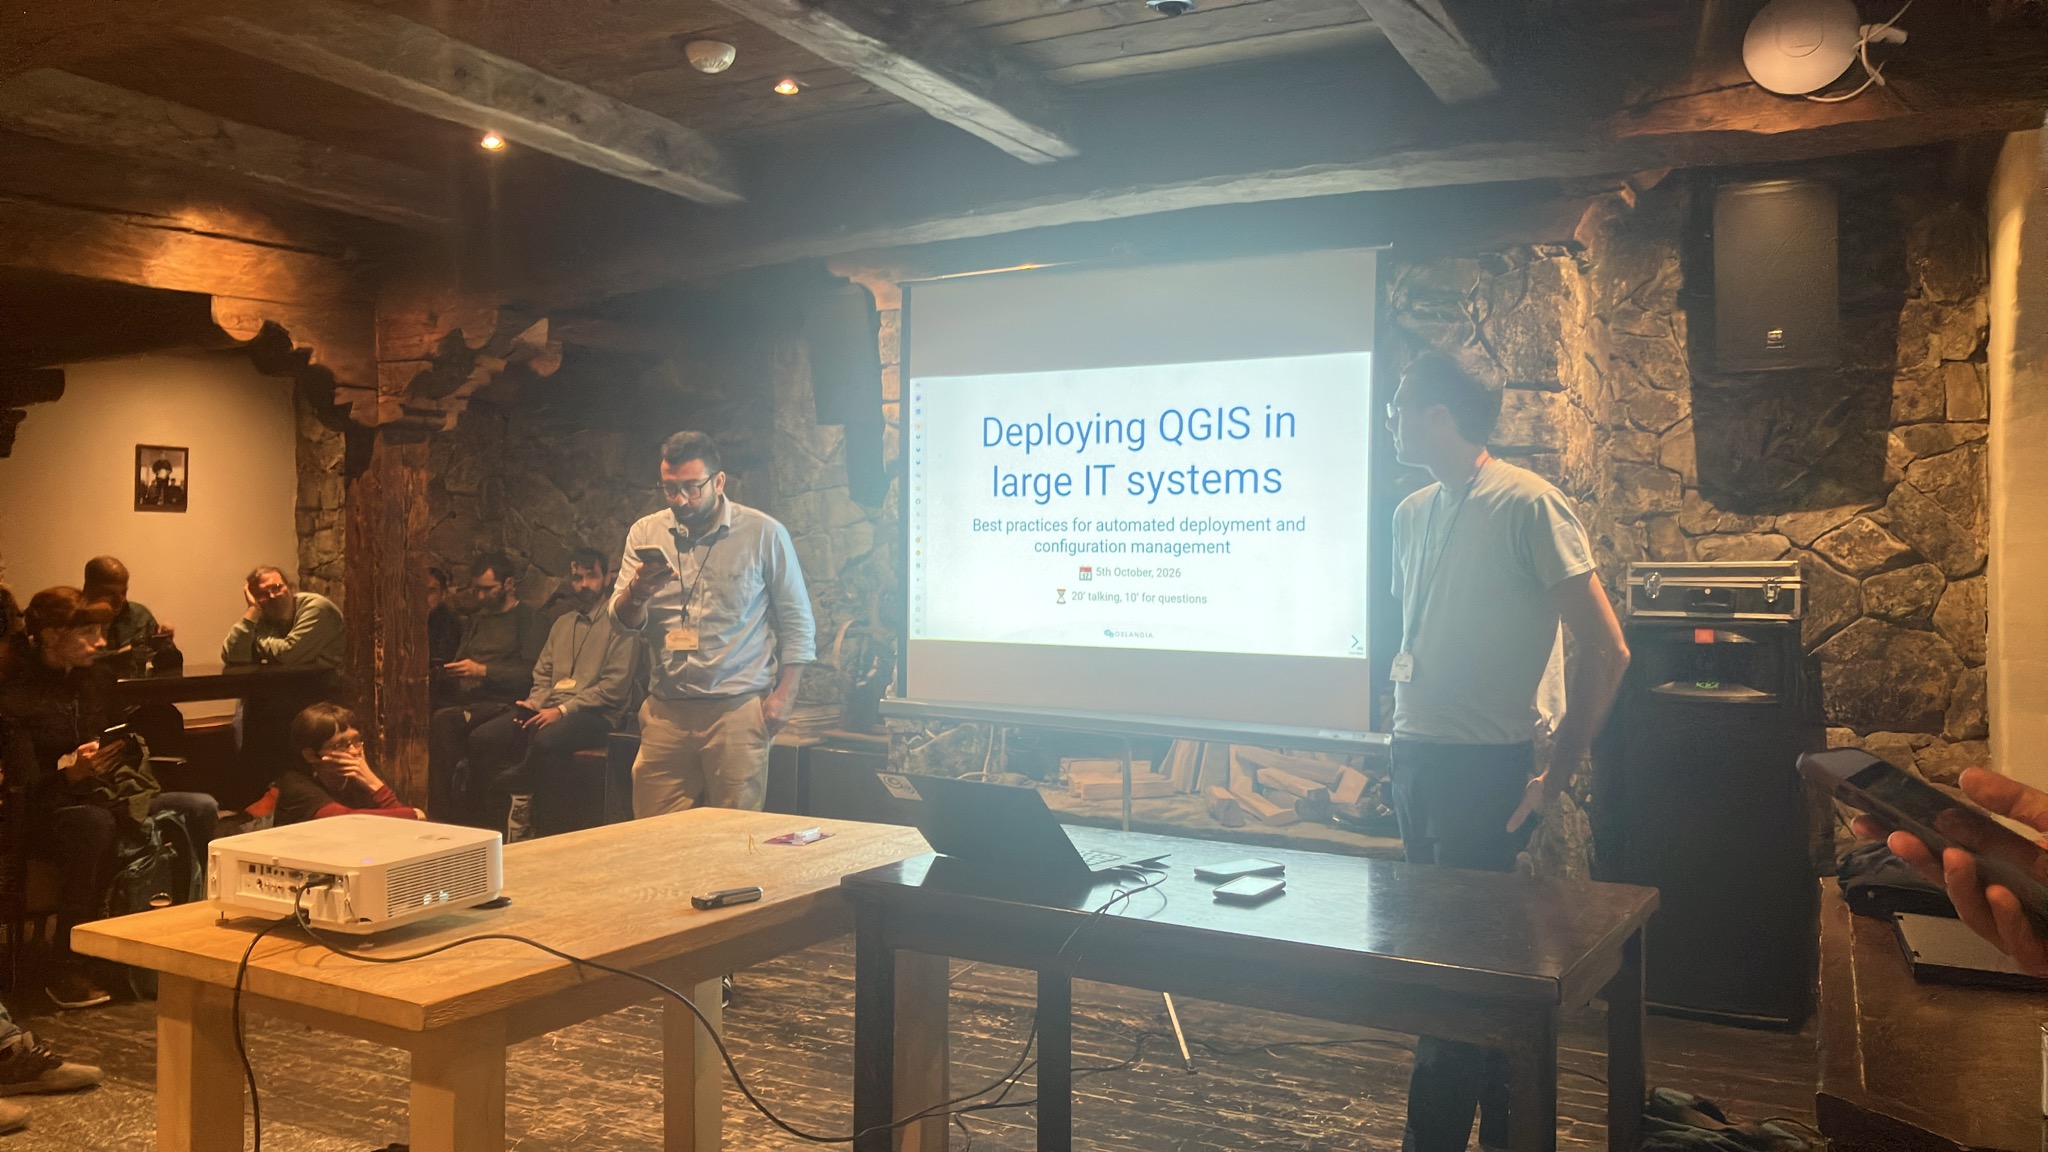
Oslandia took part (actively!) in the QGIS User Conference 2026, which was held in early October in Laax, Switzerland.
The teams led four workshops and talks on the first day:
The second day provided an opportunity to attend talks and forge links with the international community!
Rendez-vous sur Open Source Experience 2026 ! les 9 et 10 dĂ©cembre 2026 | Paris â Porte de Versailles â Hall 5.2
Vincent Picavet et Bertrand Parpoil animeront 2 conférences :
et nous aurons plaisir Ă ĂȘtre prĂ©sent cette annĂ©e encore sur le stand dâOrange pour Ă©changer sur vos projets !
Le Groupe Orange a dâabord Ă©tĂ© utilisateur de produits open source, puis contributeur et Ă©diteur. Lâopensource est dĂ©sormais une direction stratĂ©gique du groupe, avec un rĂ©el engagement pour ĂȘtre un acteur moteur de lâĂ©cosystĂšme
En tant que premier partenaire OpenSource dâOrange, Oslandia est fier dâaccompagner ce mouvement !
...Propulsé par FreshRSS | 1729 articles au total