
Vous pouvez lire le billet sur le blog La Minute pour plus d'informations sur les RSS !
Canaux
7207 éléments (2941 non lus) dans 50 canaux
 Dans la presse
(2756 non lus)
Dans la presse
(2756 non lus)
-
 Cybergeo
(2691 non lus)
Cybergeo
(2691 non lus) -
Mappemonde
(60 non lus)
-
Dans les algorithmes
(5 non lus)
Du côté des éditeurs
(28 non lus)
-
Toute l’actualité des Geoservices de l'IGN
(17 non lus)
-
arcOpole - Actualités du Programme
-
arcOrama
(11 non lus)
-
Neogeo
Toile géomatique francophone
(110 non lus)
-
Géoblogs (GeoRezo.net) (5 non lus)
-
UrbaLine (le blog d'Aline sur l'urba, la géomatique, et l'habitat)
-
Séries temporelles (CESBIO)
(2 non lus)
-
Datafoncier, données pour les territoires (Cerema)
-
Cartes et figures du monde
-
SIGEA: actualités des SIG pour l'enseignement agricole
-
Data and GIS tips
-
ReLucBlog
-
L'Atelier de Cartographie
-
My Geomatic
-
archeomatic (le blog d'un archéologue à l’INRAP)
-
Cartographies numériques
-
Carnet (neo)cartographique
-
GEOMATIQUE
-
Évènements – Afigéo
(12 non lus)
-
Afigéo
(12 non lus)
-
Geotribu
(50 non lus)
-
Conseil national de l'information géolocalisée
(9 non lus)
-
Icem7
-
Makina Corpus (1 non lus)
-
Oslandia
(1 non lus)
-
CartONG
(2 non lus)
-
GEOMATICK
(6 non lus)
-
Geomatys
(3 non lus)
-
Les Cafés Géo
(1 non lus)
-
L'Agenda du Libre
(3 non lus)
-
Conseil national de l'information géolocalisée - Actualités
(3 non lus)
Géomatique anglophone
(35 non lus)
-
All Points Blog
-
Directions Media - Podcasts
-
Navx
-
James Fee GIS Blog
-
Maps Mania
(19 non lus)
-
Open Geospatial Consortium (OGC)
-
Planet OSGeo
(16 non lus)
Géomatique anglophone
-
 16:00
16:00 Fernando Quadro: WFS-T com OpenLayers, PostGIS e GeoServer
sur Planet OSGeoOutro dia eu estava navegando pela internet quando “esbarrei” com um post muito interessante sobre como utilizar o WFS Transactions (WFS-T), para salvar feições no PostGIS a partir de uma aplicação web com OpenLayers.
Eu já tinha postado algo bem similar a isso a um bom tempo atrás, mas já estava bastante desatualizado, então eu decidir traduzir e (re)postar esse material aqui no blog.
1. O Projeto
Essa aplicação está postada no GitHub e usa no frontend React/OpenLayers para atualizar dados de recursos GIS armazenados em um banco de dados PostGIS usando transações WFS (facilitadas pelo GeoServer).
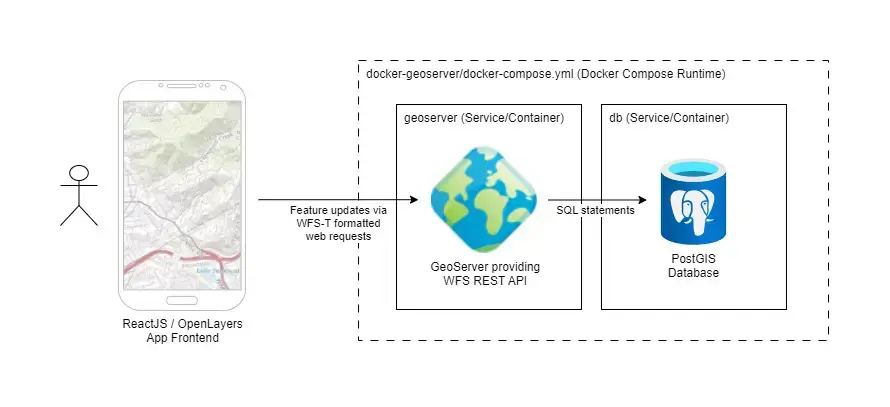
2. Objetivo
O objetivo era exibir um recurso WFS em um mapa com OpenLayers e gravar alguns dados no PostGIS cada vez que o recurso fosse clicado. Isso foi feito incluindo a propriedade interation nos dados do recurso que rastreou o número de cliques.

Foi utilizado o docker kartoza/docker-geoserver para montar o backend com GeoServer e PostGIS. Graças ao trabalho duro do Kartoza, isso foi tão fácil quanto executar docker-compose up no diretório apropriado (mais instruções aqui).
Alguma configuração foi necessária para criar uma tabela e um registro de exemplo no PostGIS. Uma vez que isso foi concluído, mais algumas etapas foram necessárias para criar um workspace, store e uma camada no GeoServer para publicar a tabela do PostGIS.
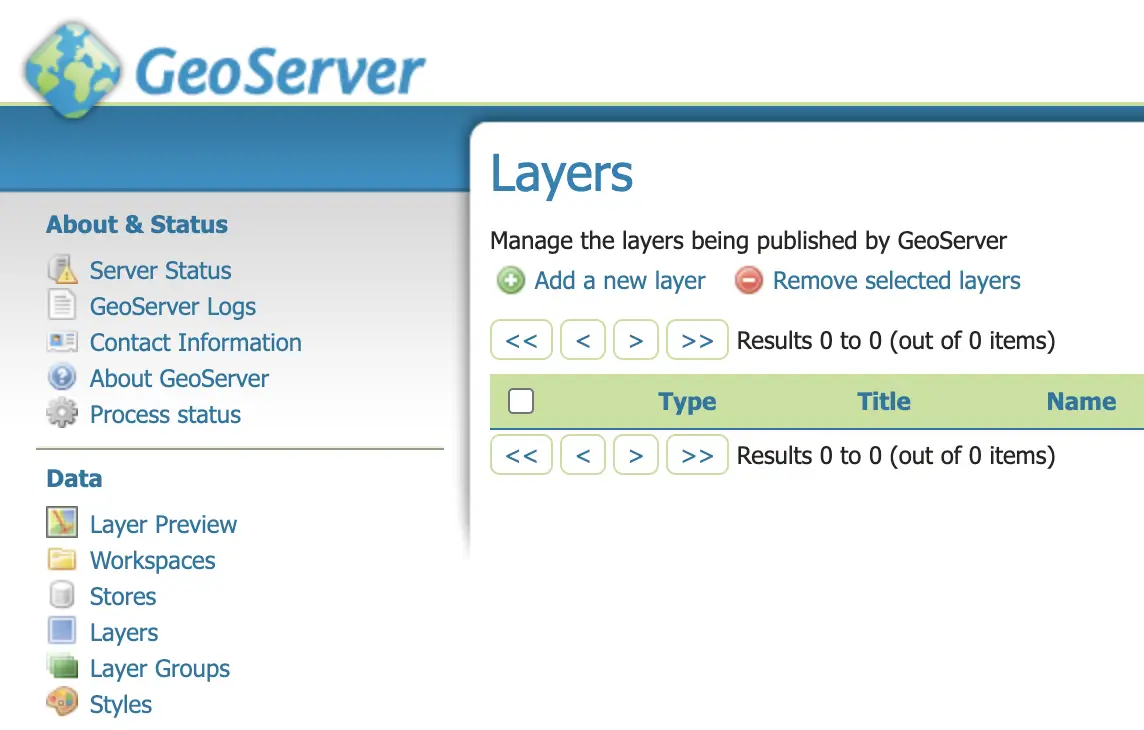
A etapa final é publicar a camada no GeoServer e aí começa a diversão!
3. O Frontend
O aplicativo frontend foi baseado em React com OpenLayers. Alguns call-outs específicos e lições aprendidas são compartilhados abaixo, mas confira o projeto no GitHub para o código-fonte completo.
3.1 Criando a camada WFS do GeoServer no OpenLayers
Definir a camada e os estilos do WFS foi simples usando a estratégia bbox padrão, usada para instruir o OpenLayers sobre como/quando carregar os recursos do WFS. Veja:
import VectorSource from 'ol/source/Vector';
import GeoJSON from 'ol/format/GeoJSON.js';
import {bbox as bboxStrategy} from 'ol/loadingstrategy.js';
import VectorLayer from 'ol/layer/Vector';

const GEOSERVER_BASE_URL = 'http://localhost:8600/geoserver/dev';

// create geoserver generic vector features layer
const featureSource = new VectorSource({
  format: new GeoJSON(),
  url: function (extent) {
    return (
      GEOSERVER_BASE_URL + '/ows?service=WFS&' +
      'version=1.0.0&request=GetFeature&typeName=dev%3Ageneric&maxFeatures=50&' +
      'outputFormat=application%2Fjson&srsname=EPSG:3857&' +
      'bbox=' +
      extent.join(',') +
      ',EPSG:3857'
    );
  },
  strategy: bboxStrategy,
});

const featureLayer = new VectorLayer({
  source: featureSource,
  style: {
    'stroke-width': 0.75,
    'stroke-color': 'white',
    'fill-color': 'rgba(100,100,100,0.25)',
  },
});
3.2 Usando React Refs para acessar objetos OpenLayers
Ao integrar o OpenLayers com o React, é importante inicializar os objetos do OpenLayers uma vez (por exemplo, em um hook onload) e usar Refs para manter referências a esses objetos entre as renderizações.
Isso também permite que a versão atual desses objetos seja acessível em funções de retorno de chamada. Caso contrário, uma versão obsoleta do objeto pode ser fornecida ao retorno de chamada (capturada no momento do fechamento do retorno da chamada).
// react
import React, {  useEffect, useRef } from 'react';
import Map from 'ol/Map'

function MapWrapper(props) {

  // refs are used instead of state to allow integration with 3rd party map onclick callback;
  //  these are assigned at the end of the onload hook
  //  [https:]   const mapRef = useRef();
  const mapElement = useRef();
  const featuresLayerRef = useRef();

  // other logic removed for brevity

  // react onload hook
  useEffect( () => {

    // create map
    const map = new Map({
      // config removed for brevity
    })

    // save map and featureLary references into React refs
    featuresLayerRef.current = featureLayer;
    mapRef.current = map

  },[])

  return (
    <div>
      <div ref={mapElement} className="map-container"></div>
    </div>
  )

}

export default MapWrapper
No exemplo acima, os objetos OpenLayers map, featuresLayer e até mesmo o div mapElement são armazenados como Refs para uso em funções de retorno de chamada fora do React.
3.3 Executando transações WFS a partir de funções de retorno de chamada do OpenLayers
O ponto crucial de todo esse aplicativo é enviar as solicitações de transação WFS para o GeoServer com os dados de recurso do OpenLayers para gravar no PostGIS. Isso é tratado na função de retorno de chamada no onclick do mapa.
import WFS from 'ol/format/WFS';
import GML from 'ol/format/GML32';

const GEOSERVER_BASE_URL = 'http://localhost:8600/geoserver/dev';

// map click handler - uses state and refs available in closure
const handleMapClick = async (event) => {

  // get clicked feature from wfs layer
  // TODO: currently only handles a single feature
  const clickedCoord = mapRef.current.getCoordinateFromPixel(event.pixel);
  const clickedFeatures = featuresLayerRef.current.getSource().getFeaturesAtCoordinate(clickedCoord);
  if (!clickedFeatures.length) return; // exit callback if no features clicked
  const feature = clickedFeatures[0];

  // parse feature properties
  const featureData = JSON.parse(feature.getProperties()['data']);

  // iterate prop to test write-back
  if (featureData.iteration) {
    ++featureData.iteration;
  } else featureData.iteration = 1;

  // set property data back to feature
  feature.setProperties({ data: JSON.stringify(featureData) });
  console.log('clicked updated feature data', feature.getProperties())

  // prepare feature for WFS update transaction
  //  [https:]   const wfsFormatter = new WFS();
  const gmlFormatter = new GML({
    featureNS: GEOSERVER_BASE_URL,
    featureType: 'generic',
    srsName: 'EPSG:3857' // srs projection of map view
  });
  var xs = new XMLSerializer();
  const node = wfsFormatter.writeTransaction(null, [feature], null, gmlFormatter);
  var payload = xs.serializeToString(node);

  // execute POST
  await fetch(GEOSERVER_BASE_URL + '/wfs', {
    headers: new Headers({
      'Authorization': 'Basic ' + Buffer.from('admin:myawesomegeoserver').toString('base64'),
      'Content-Type': 'text/xml'
    }),
    method: 'POST',
    body: payload
  });

  // clear wfs layer features to force reload from backend to ensure latest properties
  //  are available
  featuresLayerRef.current.getSource().refresh();

  // display updated feature data on map
  setFeatureData(JSON.stringify(featureData));
}
O código acima é executado quando o recurso WFS é clicado. Isso aciona a seguinte lógica:
Linhas 11-14: o objeto de feição OpenLayers clicado é identificado
Linhas 17-25: a propriedade iteration do recurso é aumentada em 1 e salva de volta no recurso
Linhas 30-38: o recurso é convertido no formato apropriado para a transação WFS
Linhas 41-48: a solicitação de transação WFS é definida para a instância do Docker GeoServer criada anteriormente no projeto
Linhas 52-55: solicita que o OpenLayers recarregue os dados WFS do GeoServer para garantir que as propriedades de atualização estejam presentes4. Para onde ir a partir daqui
Agora que temos um exemplo de como gravar dados GIS do OpenLayers no PostGIS, podemos expandir este aplicativo para suportar criação e edição de recursos mais complexos. Por exemplo, desenhar recursos com o OpenLayers.
Fonte: Taylor Callsen
-
13:00
Mappery: Lisbon Metro Map
sur Planet OSGeoPièce jointe: [télécharger]
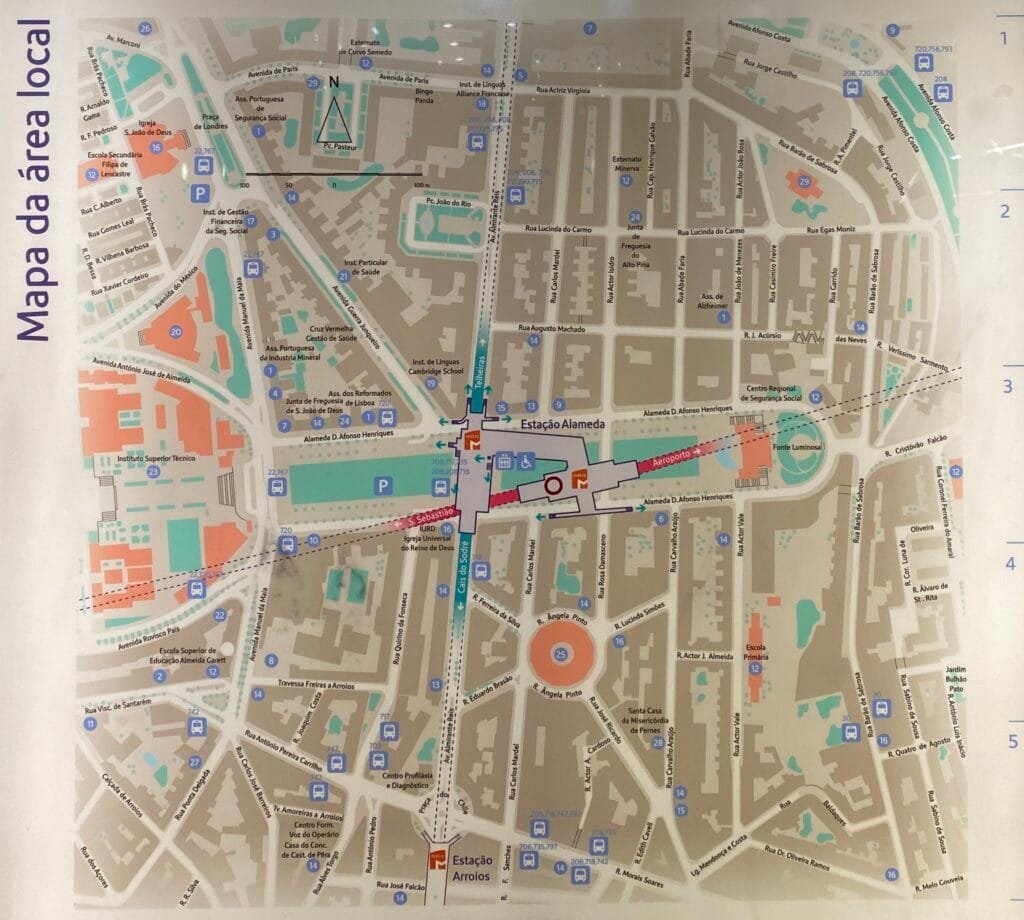
Reinder sent this and said “In metro stations in Lisbon, one can find maps that present a plan of the streets above your head. What I saw there for the first time is that the metro station and metro lines themselves are also depicted on the map: quite convenient for better orientation!”
Impressive.
-
13:00
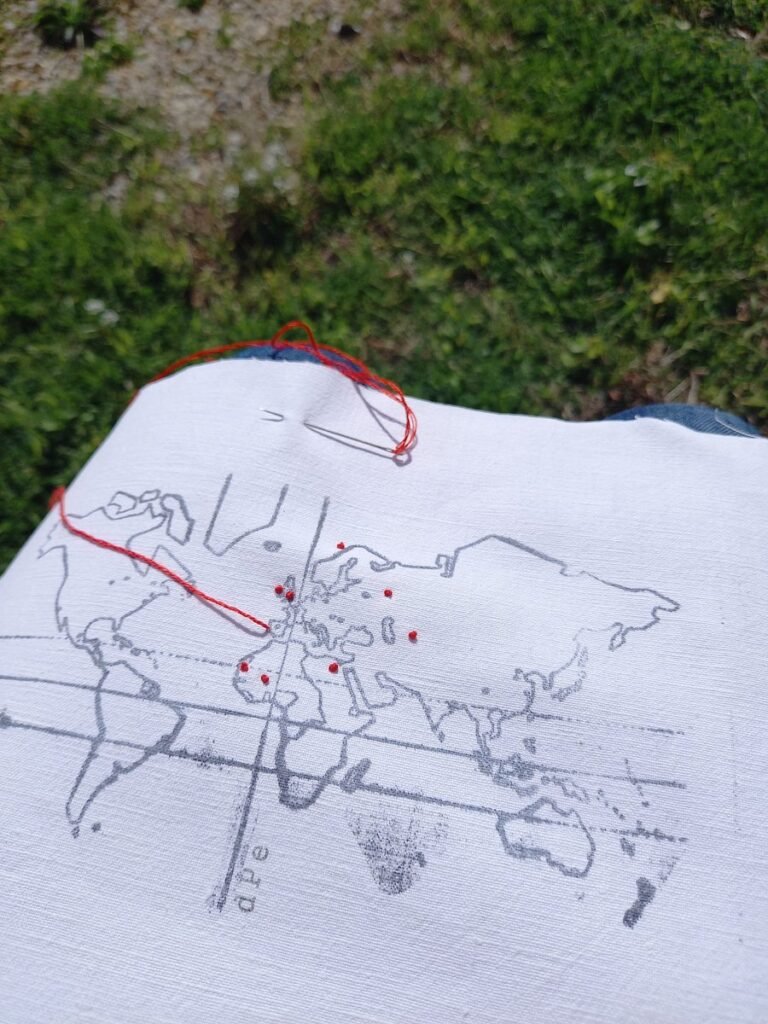
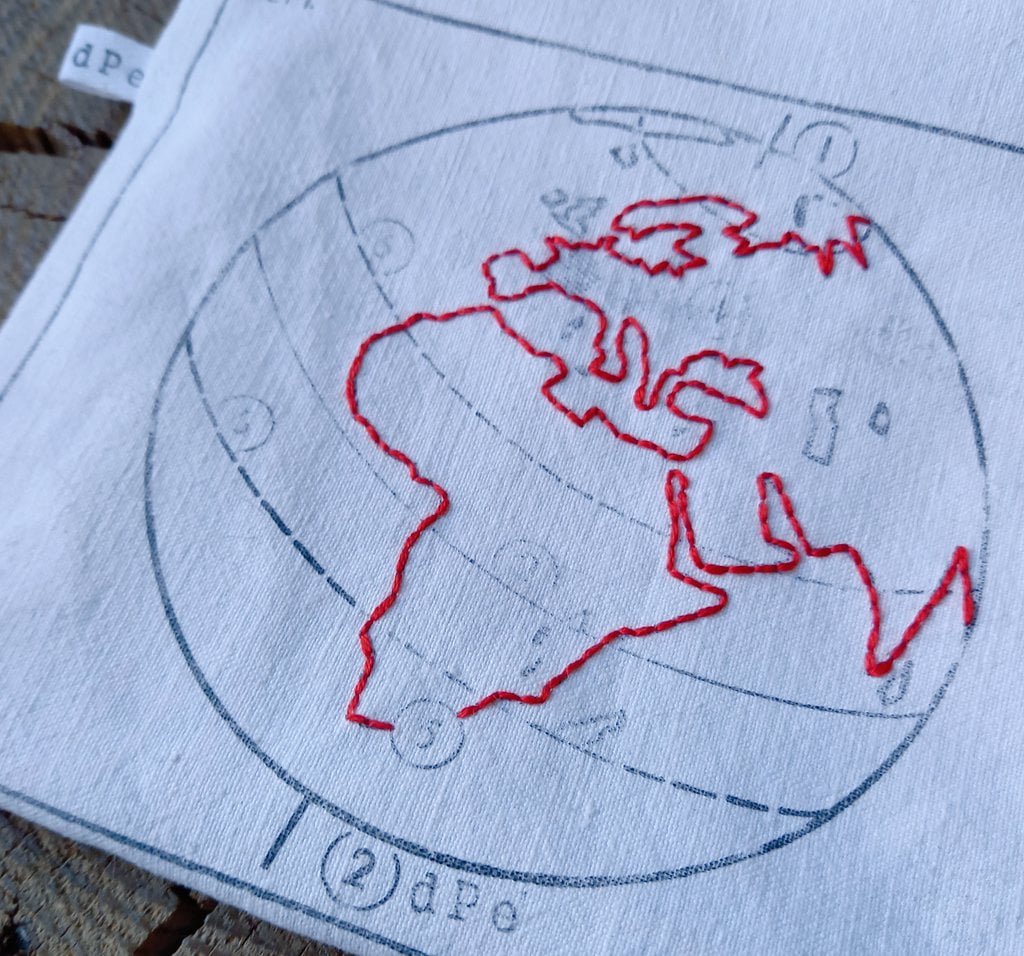
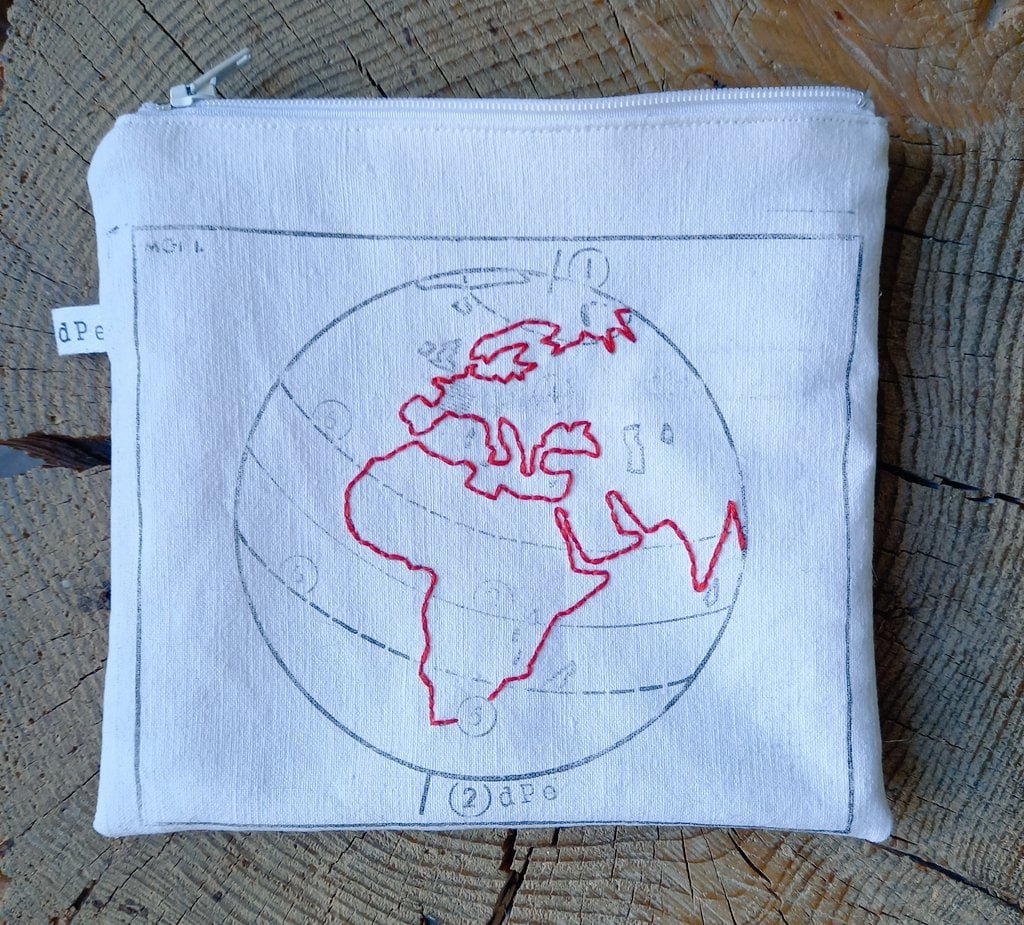
Mappery: Chloropleth Embroidery
sur Planet OSGeoPièce jointe: [télécharger]
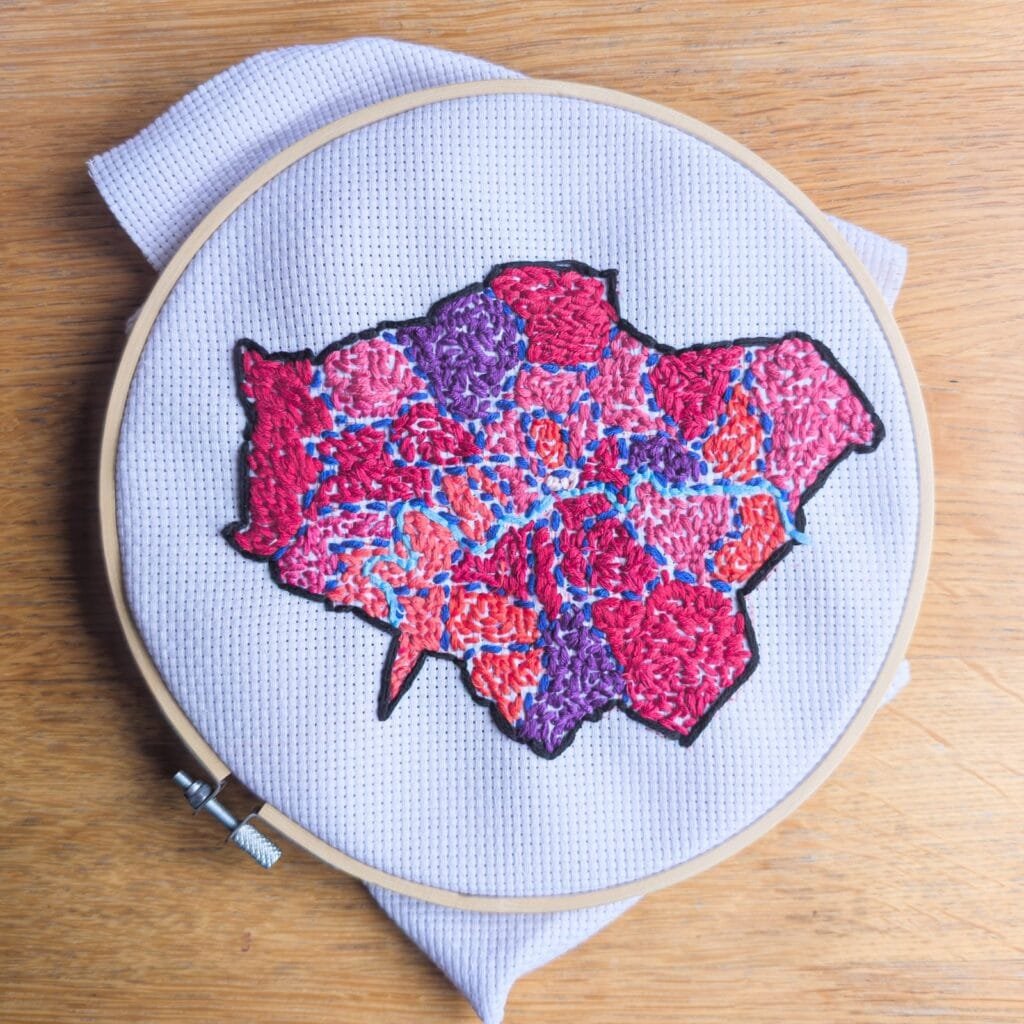
My pal Giuseppe Sollazzo has an incredibly wide range of interests which include geography and embroidery. He recently completed his latest project – “Mission accomplished ? Choropleth of London councils by population, with a terrible palette choice! Data from wikipedia, shapefile from Ordnance Survey”
I asked him what prompted the idea for this embroidered map – “The idea fundamentally came from my recent interest in trying more analogue experiences while not completely giving up my data & digital passions. Which means I’m doing less internet, more ham radio, and less javascript maps and more physical ones. Having recently learned crochet, I thought that embroidery would be great for data visualization. It takes a while so it’s an act of love to data ? But the result is oddly pleasant.”
I think we can all agree that it is more than oddly pleasant! If there was a Nobel Prize for geogeekery, I think Giuseppe would be a winner.
-
13:00
Mappery: Lighting up Lisbon Airport
sur Planet OSGeoPièce jointe: [télécharger]
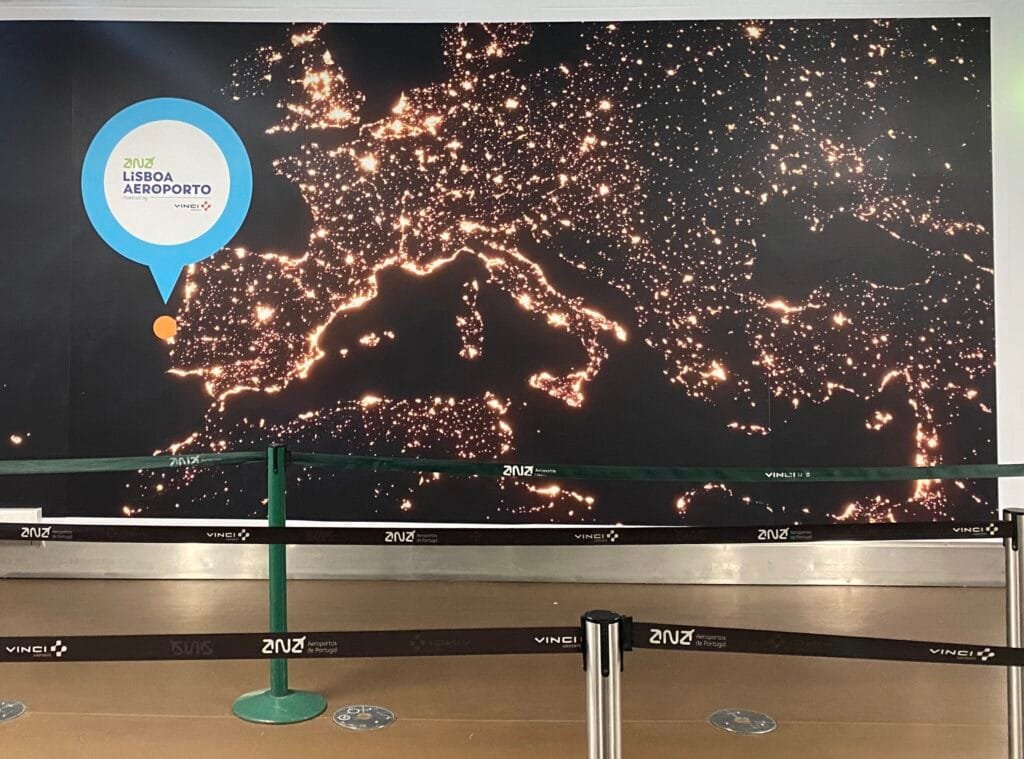
Reinder sent this from Lisbon. Sparkly!
-
20:06
Markus Neteler: How to contribute to GRASS GIS development
sur Planet OSGeoHow to contribute to GRASS GIS development: Guidance for new developers in the GRASS GIS Project.
The post How to contribute to GRASS GIS development appeared first on Markus Neteler Consulting.
-
13:00
Mappery: Map van
sur Planet OSGeoPièce jointe: [télécharger]
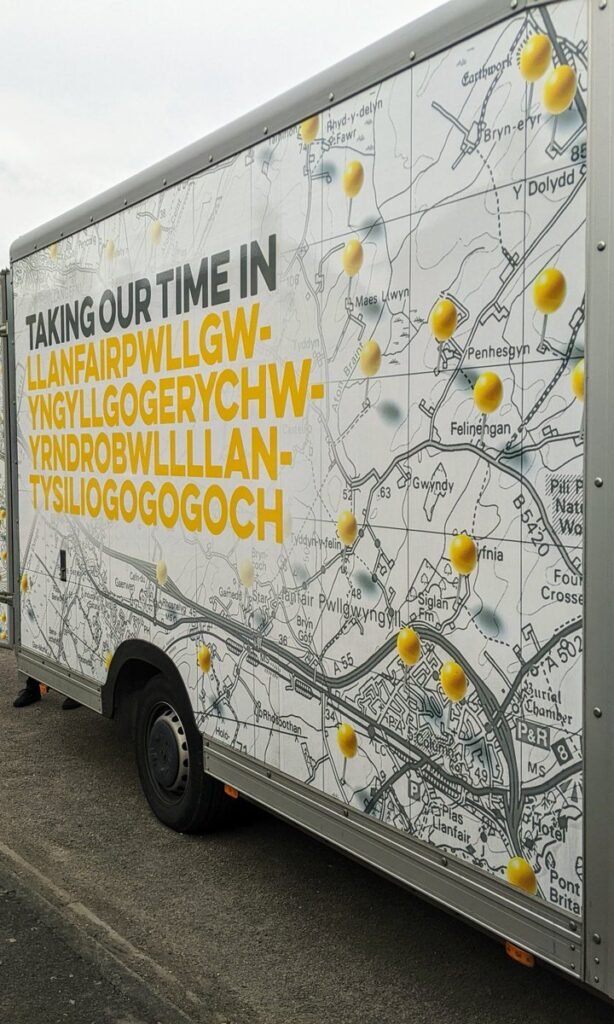
We love Maps on Vans. This one comes from Bob Chell. Thanks for sharing.
-
14:00
3liz: Sortie de Lizmap Web Client 3.8
sur Planet OSGeoLizmap Web Client 3.8Nous sommes heureux d'annoncer la sortie de Lizmap Web Client 3.8, la nouvelle version majeure de l'application.
Financeurs


 Pré-requis et installation
Il est désormais requis d'avoir un QGIS serveur minimum 3.28. Cependant, nous recommandons fortement d'utiliser une version LTR plus récente, comme la version 3.34. Consultez la feuille de route QGIS.
Pour utiliser pleinement cette version 3.8, n'oubliez pas de mettre à jour votre extension Lizmap dans QGIS bureautique. Nous avons écrit un article dédié sur cette version.
Fonctionnalités Demande de tuile unique pour toutes les couchesJusqu'à la version 3.7, Lizmap Web Client effectuait une requête HTTP au serveur QGIS par couche visible.
Désormais, grâce à Faunalia qui a contribué au code source, Lizmap Web Client peut effectuer une seule requête HTTP
GetMapà QGIS Serveur pour toutes les couches visibles (sauf pour les couches ayant un cache actif).Les deux méthodes ont des avantages et des inconvénients. Cette nouvelle option de l'extension peut être très utile pour les projets lourds.
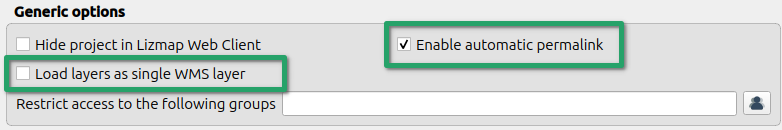
Petite astuce également disponible sur la dernière version 3.7, il est désormais possible de désactiver le permalien automatique avec la case à cocher.
AccrochageLorsque l'accrochage est activé sur une couche, l'utilisateur peut désormais sélectionner dans l'interface Web sur quelle couche s'accrocher.
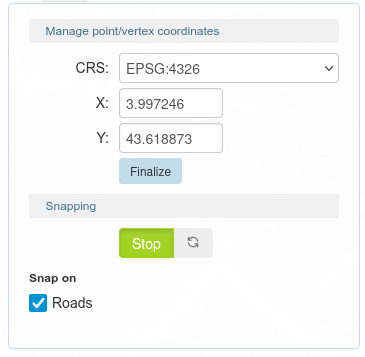
Cette nouvelle fonctionnalité a été développée par Faunalia.
InfobulleLa fonctionnalité d'Infobulle de Lizmap Web Client a été grandement améliorée dans cette dernière version. Avant, côté gauche de la capture d'écran, vous ne pouviez sélectionner qu'un champ à afficher lorsque vous survoliez une entité dans le navigateur Web. Maintenant, comme nous pouvons voir sur le côté droit, nous pouvons écrire un modèle HTML. Comme cela peut prendre en charge des expressions QGIS, nous vous encourageons à migrer votre "ancienne" configuration pour ajouter du HTML.
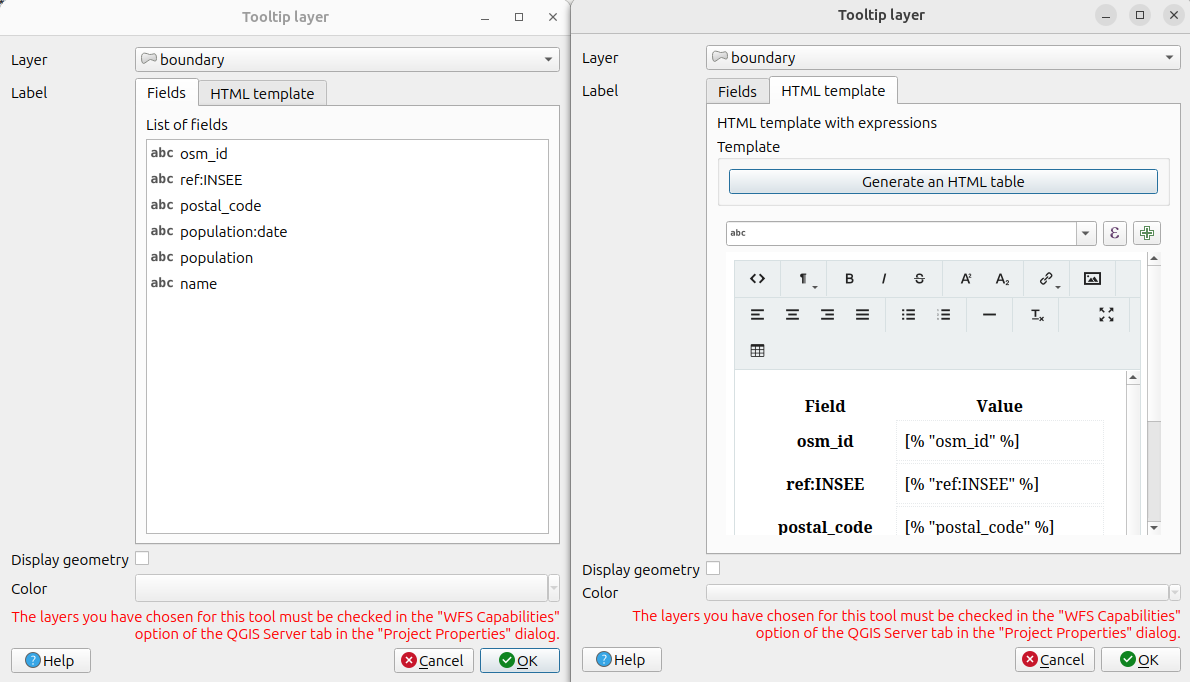
Cette nouveauté a été financée par le PNR Ballons des Vosges.
Navigation sur la carteEn raison de la transition, sous le capot, d'OpenLayers 2 vers OpenLayers 10, la transition entre les différents le niveau de zoom est désormais plus fluide que dans la version 3.7.
Dans 3.7, le choix dans Lizmap concernant la légende était de suivre exactement ce que faisait QGIS Bureautique lors d'un clic dans la légende sur les groupes, sous-groupes et couches.
Après quelques retours d'utilisateurs, nous avons introduit le double clic dans la légende pour basculer tous les éléments enfants.
Filtrage par attribut
Lorsqu'une couche dispose d'un filtrage attributaire sur les utilisateurs ou les groupes, il est désormais possible d'avoir une liste de valeurs séparées par des virgules dans le champ :
id name filter_field 1 one group_a,group_b 2 two group_b 3 three group_b,all 4 four all Cette nouvelle fonctionnalité a été financée par le département du Calvados.
Numérisation et relations au sein du projetPour les relations 1:n et n:m, lorsqu'elles sont dans une popup, les éléments enfants sont correctement placés à l'intérieur de la popup parent selon la configuration QGIS Glisser&Déposer.
Le même comportement existe lors de la modification d'une entité.
De nouveaux boutons pour ajouter des entités liées ont été ajoutés, par exemple dans la table attributaire ci-dessous :
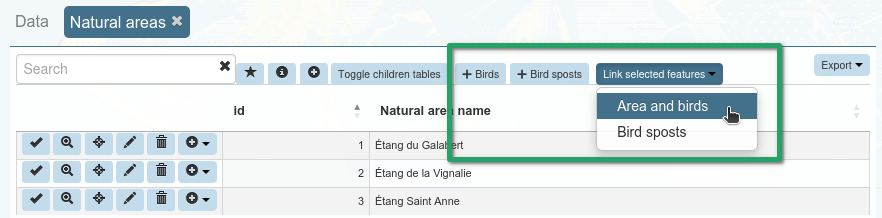
Cette nouvelle fonctionnalité a été développée par Faunalia.
Lors de la numérisation, il y a un bouton Effacer tout.
PopupNous avons introduit un nouveau composant HTML
lizmap-features-tablepour avoir une liste compacte d'entités et les étiquettes d'une couche vecteur. Le Nom d'affichage (Display name) de QGIS est utilisé comme étiquette de l'entité : une expression peut être utilisée pour modifier son contenu, configuré dans l'onglet Info-bulle des propriétés de la couche vecteur de QGIS. Par exemple :CONCAT("quartiers_libquart", ' - ', "libsquart", ' (', to_int(area(@geometry)/10000), ' ha)')produira un texte comme
MONTPELLIER CENTRE - Les Aubes (85 ha)
Vous pouvez trouver plus d'informations sur la page dédiée sur GitHub sur la syntaxe de ce composant HTML.
Cette nouveauté a été financée par la ville d'Avignon.
AdministrationDans le panneau d'administration, sur la page Information serveur, similaire à la liste des extensions QGIS Serveur installées, on peut désormais retrouver la liste des modules Lizmap installés, avec sa version correspondante.
Concernant les extensions, nous avons ajouté un lien HTML vers la page d'accueil de l'extension, afin de vous guider vers quelques informations complémentaires. Cette dernière fonctionnalité viendra également sur les modules plus tard.
Chargement du JavaScript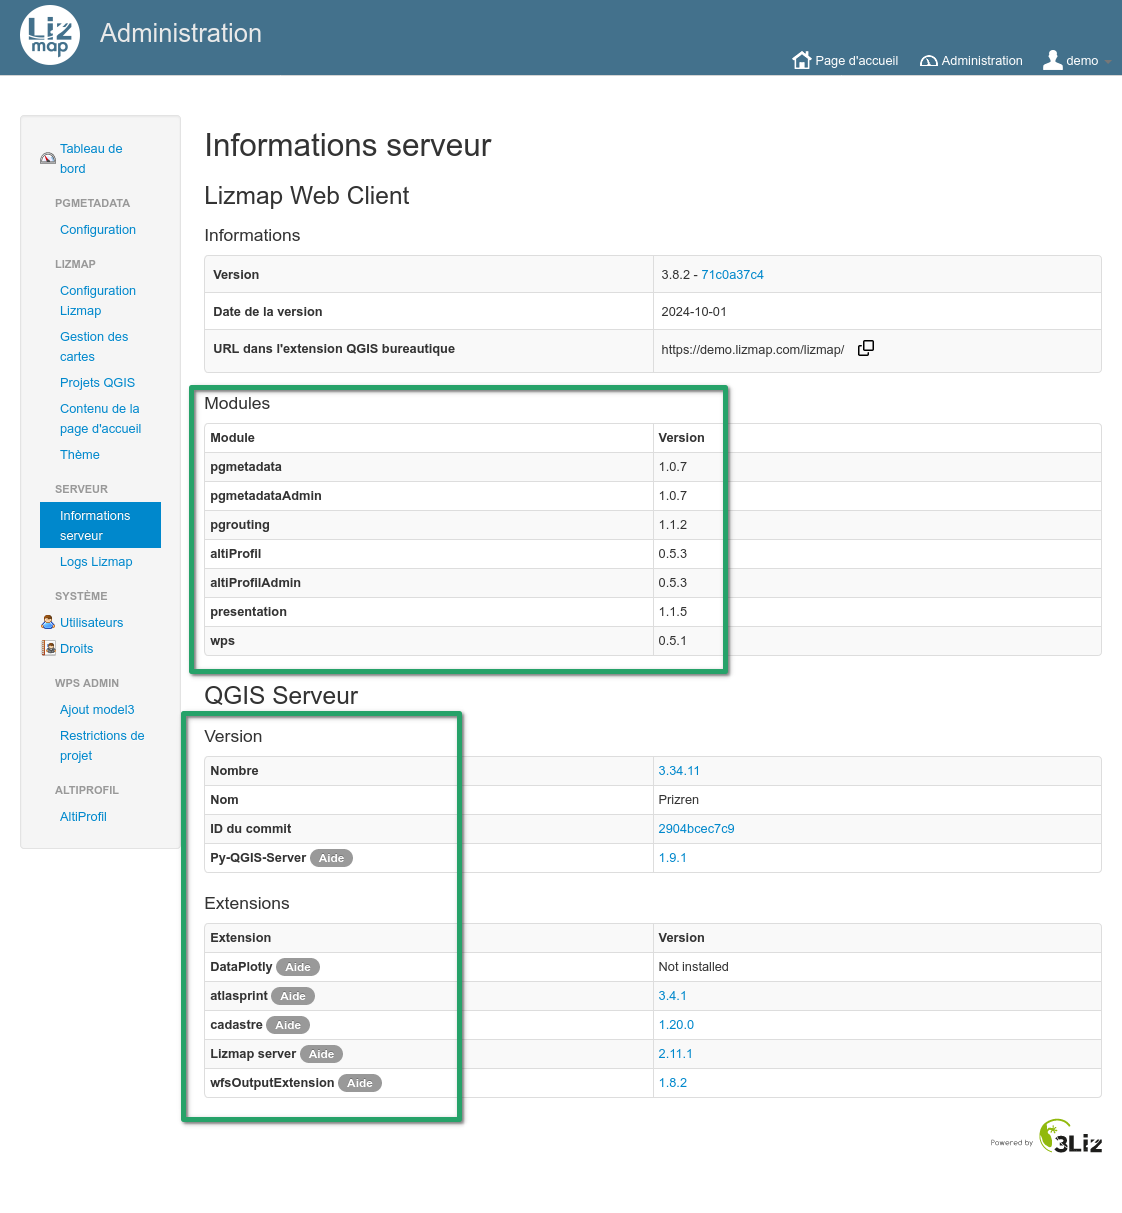
Si un JavaScript génère une erreur lors du chargement de la carte, il existe désormais un bouton pour ouvrir temporairement la carte sans JavaScript complémentaire grâce au paramètre
no_user_defined_js=1dans l'URL. Cela vous permet de charger la carte et vérifiez si l'erreur provient d'un script complémentaire.En passant, nous avons également travaillé sur XSS. Ce travail a commencé il y a quelques versions (en 3.6), mais maintenant en 3.8, il n'est plus possible d'intégrer directement du code JavaScript dans l'info-bulle HTML de QGIS. Vous devez utiliser un fichier
Sous le capot*.jsdédié.La carte OpenLayers 10 est maintenant par-dessus la carte "historique" OpenLayers 2. Certains outils ont été migrés d'OpenLayers 2 vers OpenLayers 10, comme les popups et la localisation par surbrillance d'une couche. Par conséquent, cette version supprime à nouveau certaines dépendances d'OpenLayers 2.
Vous devrez peut-être adapter des scripts JavaScript complémentaires définis par l'utilisateur pour dessiner vos couches OpenLayers par-dessus la carte OpenLayers 10, par exemple.
Documentation sur le codeDepuis la version 3.7, de nombreuses refactorisations de code ont été effectuées du côté JavaScript et PHP. Nous pouvons désormais fournir une documentation HTML sur ces deux langages. Elles sont disponibles sur docs.3liz.org par exemple pour PHP ou pour JavaScript.
Nous vous recommandons fortement d'utiliser la nouvelle API JavaScript lors de l'écriture d'un script JavaScript complémentaire personnalisé.
TéléchargementVous pouvez télécharger le dernier zip sur notre page des sorties.
Pensez à installer la dernière version
3.8.X(et non pas3.8.0par exemple)Vous pouvez également consulter la liste des modifications complètes ("changelog") de la version 3.8.0, en anglais.
ModulesÀ la date du 15 octobre 2024, voici la liste des modules qui ont été mis à jour pour 3.8 :
Les autres modules sont en cours.
Nous espérons que vous allez apprécier cette nouvelle version ?
L'équipe 3Liz
-
14:00
3liz: Release of Lizmap Web Client 3.8
sur Planet OSGeoLizmap Web Client 3.83Liz is pleased to announce the release of Lizmap Web Client 3.8, the new major version of the application.
Funders
Pre-requirements and installation
It is now required to have a minimum QGIS server 3.28. However, we highly recommend using the latest LTR version, i.e. version 3.34. Check the QGIS roadmap.
To take full advantage of this version 3.8, don't forget to update your Lizmap plugin in QGIS desktop. We've written an article dedicated to this version.
Features Single tile request for all layersUntil version 3.7, Lizmap Web Client was doing one HTTP request to QGIS server per visible layer.
Now, thanks to Faunalia which contributed to the source code, Lizmap Web Client can make a single HTTP request
GetMapto QGIS Server for all visible layers (except for layers having a cache enabled).Both methods have strengths and weaknesses. This new option in the plugin, can be very useful for heavy projects.
Quick tip which is available on latest 3.7 as well, it's now possible to disable the automatic permalink with the checkbox.
SnappingWhen snapping is enabled on a layer, the user can now select from the web interface on which layer to snap on.
This new feature have been developed by Faunalia.
TooltipThe "Tooltip" feature in Lizmap Web Client got a great improvement in this latest version. Before, on the left side of the screenshot, you could only select one field to display while hovering a feature in the web browser. Now, as we can see on the right side, we can write an HTML template. We can support QGIS expression, se we encourage you to migrate your "old" configuration to add some nice HTML.
This new feature have been funded by PNR Ballons des Vosges.
Map viewerDue to the transition, under the hood, from OpenLayers 2 to OpenLayers 10, the map transition between different zoom level is now smoother than in the 3.7 release.
In 3.7, the choice in Lizmap about the legend was to follow exactly what QGIS Desktop is doing when clicking in the legend about groups, subgroups and layers.
After some user feedbacks, we could introduce the double click in the legend to toggle all child items.
Attribute filterWhen a layer has an attribute filtering about user or groupes, it's now possible to have a comma separated list of values in the field :
id name filter_field 1 one group_a,group_b 2 two group_b 3 three group_b,all 4 four all This new feature have been funded by Calvados province.
Digitizing and relations within the projectFor both 1:n and n:m relations, when displayed in a popup, the child items are correctly placed inside the parent popup according to the QGIS Drag&Drop configuration relations have been improved.
The same behavior exists when editing a feature.
New buttons to add linked features have been added, for instance in the attribute table below :
This new feature have been developed by Faunalia.
When digitizing, there is a button Erase all.
PopupWe have introduced a new HTML component
lizmap-features-tableto have a nice compact list of vector layer features and labels.The QGIS Display name is used as the feature label: an expression can be used to tweak its content, configured in the Tooltip tab of the QGIS vector layer properties. For example:
CONCAT("quartiers_libquart", ' - ', "libsquart", ' (', to_int(area(@geometry)/10000), ' ha)')will produce a text like
MONTPELLIER CENTRE - Les Aubes (85 ha)You can find more information on the dedicated page on GitHub about the syntax of this HTML component.
This new feature have been funded by Avignon city.
AdministrationIn the administration panel, on the Server information page, similar to the list of QGIS Server plugins installed, we can now find the list of Lizmap modules installed with its own version.
About the plugins, we have added an HTML link to the plugin home page, we can lead you to some information about the plugin itself. This latest feature will come as well on modules later.
JavaScript loadingIf a JavaScript raises an error while loading the map, there is now a button to temporarily open the map without additional user JavaScript script thanks to the flag in the
no_user_defined_js=1. This allows you to ty the map and check if the error come from an additional script.Side note, we have also worked on XSS. This work started a few version ago (in 3.6), but now in 3.8, it's not possible to embed JavaScript code into QGIS HTML maptip directly. You must use a dedicated
Under the hood*.jsfile.The OpenLayers 10 map is now on top on the legacy OpenLayers 2 map. Some tools were migrated from OpenLayers 2 to OpenLayers 10, like popup and locate by layer highlight. Therefore, this version removes again some OpenLayers 2 dependencies.
You might need to adapt some additional user defined JavaScript to draw your OpenLayers layers on top of the OpenLayers 10 map for instance.
Documentation about the codeSince version 3.7, a lot of code refactoring was done on the JavaScript and PHP side. Therefore, we can now provide an HTML documentation about these two languages. Both are available on docs.3liz.org for instance for PHP or for JavaScript.
We strongly recommend you to use the new JavaScript API when writing custom additional JavaScript script.
JavascriptDue to the work which have been done during the legend or other features in Lizmap, some previous Javascript script might not work anymore and need to be adapted.
DownloadYou can download the latest zip on our releases page.
Do not forget to install the latest
3.8.X(and not3.8.0for instance).You can also check the full changelog of version 3.8.0.
ModulesAs of October 15th 2024, this is the list of modules which have been released for 3.8 :
Other modules are work-in-progress.
We hope you will enjoy this new version ?
The 3Liz team
-
13:00
Mappery: Worn Clothing
sur Planet OSGeoPièce jointe: [télécharger]
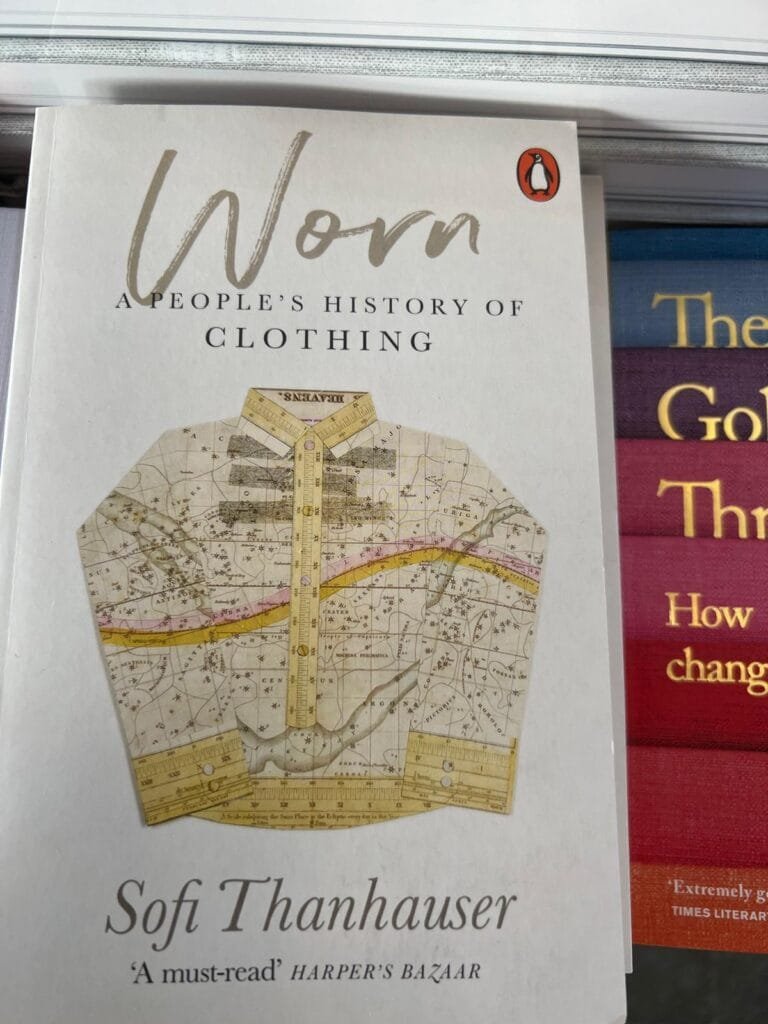
Elizabeth sent me this, beyond the cover I am not sure that this is a book for map lovers.
“A captivating and deeply researched study of the five main fabrics from which clothing is made: linen, cotton, silk, synthetics, and wool. Positing that “there is scarcely a part of the human experience, historic or current, that the story of clothes does not touch,” – Publishers Weekly
-
16:00
Fernando Quadro: 8 Funções do GIS na Inteligência de Negócios
sur Planet OSGeoO Sistema de Informações Geográficas (GIS) é uma tecnologia que pode ser usada para inteligência de negócios de diversas formas, como:
 Análise de Localização
Identifica localizações ideais para novas lojas, armazéns e instalações com base em dados geográficos e demográficos. Segmentação de Mercado
Estratégias de marketing adaptadas para regiões específicas. Otimização da Cadeia de Suprimentos
Planejamento de rotas, logística e gerenciamento de estoque identificando os caminhos mais eficientes para transporte. Gerenciamento de Riscos
Mapeia riscos ambientais e geopolíticos, zonas de desastres naturais, instabilidade política ou pontos críticos de crimes. Insights sobre o Comportamento do Cliente
O GIS rastreia os comportamentos do consumidor geograficamente, identificando padrões e preferências de compra regionais. Gerenciamento de Ativos
Gerenciamento e monitoramento de ativos físicos como equipamentos, veículos ou infraestrutura em vários locais. Análise de Concorrentes
Mapeia as localizações e o alcance de mercado dos concorrentes, fornecendo insights sobre lacunas ou oportunidades. Integração de dados em tempo real
GIS integra dados em tempo real de várias fontes, permitindo a tomada de decisões dinâmicas para ambientes de rápida mudança.Fonte: webgis.tech
Instagram: [https:]]
LinkedIn: [https:]]Gostou desse post? Conte nos comentários

-
14:32
WhereGroup: Mapbender 4 – Praxisbericht nach dem Major Release
sur Planet OSGeoSeit dem Major Release Mapbender 4.0.0. gibt es erste positive Rückmeldungen. Wir berichten über bereits umgezogene Projekte und nehmen noch einmal Bezug auf unser QGIS2Mapbender-Plugin, mit dem Sie Mapbender-Anwendungen direkt aus QGIS erstellen können. -
13:00
Mappery: Another embroidery from Anne
sur Planet OSGeoPièce jointe: [télécharger]
Anne L. shared this Map In The Wild, crafted over a weekend while enjoying the sun in her courtyard.
-
0:03
Fernando Quadro: Interpolação de dados usando GDAL
sur Planet OSGeoInterpolação espacial é uma técnica para estimar valores desconhecidos em locais com base em valores conhecidos em pontos próximos, criando uma superfície contínua a partir de dados discretos.
 Como pode ser útil?
? Prevê valores em locais não amostrados.
? Preenche lacunas de dados para cobertura de área completa.
? Cria superfícies contínuas a partir de dados de pontos.
? Suporta tomada de decisão em vários campos.
? Permite mapeamento temático e visualização de padrões. A interpolação espacial com GDAL aprimora seus dados GISA interpolação espacial é uma técnica crucial de engenharia de recursos em GIS que estima valores desconhecidos entre pontos de dados conhecidos.
GDAL (Geospatial Data Abstraction Library) oferece ferramentas poderosas para implementar vários métodos de interpolação. Aqui está uma visão geral das principais técnicas:
Ponderação de distância inversa (IDW)
? Método simples e rápido
? Assume que pontos próximos têm mais influência
? Ideal para estimativas rápidasKrigagem
? Método geoestatístico
? Considera a autocorrelação espacial
? Fornece estimativas de incertezaVizinho Natural
? Adapta-se a dados irregularmente espaçados
? Interpolação suave, sem efeito de alvo
? Bom para modelagem de terrenoSpline
? Cria uma superfície suave
? Útil para fenômenos gradualmente variáveis
? Suporta parâmetros de tensão e regularizaçãoA escolha do método de interpolação correto depende das características dos seus dados e dos requisitos do seu projeto.
Gostou desse post? Conte nos comentários
Fonte: webgis.tech
Instagram: [https:]]
LinkedIn: [https:]] -
13:00
Mappery: The World with Chandeliers
sur Planet OSGeoPièce jointe: [télécharger]
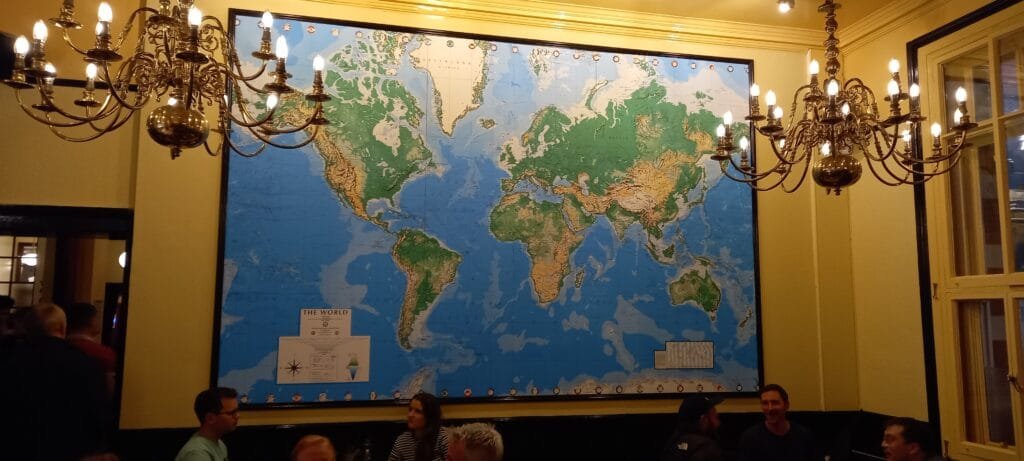
Berl sent me this, he said “Seen on one of the walls of the ‘Leyton Engineer’ pub in East London in what used to be Leyton Town Hall. I was on my way to see a Leyton Orient game and popped in to have a bite to eat and a tipple and meet my son.”
Glad to see that Leyton Council had such a global view.
For those of our readers who don’t know of Leyton Orient, they are a football club based in East London. The name apparently came about as a suggestion from one of their players, Jack R Dearing, who had worked on the Orient Stream Navigation Company (otherwise known as the Orient Line).
-
6:15
Sean Gillies: Mastodon #20albums
sur Planet OSGeoThere was this trend a few weeks ago on Mastodon where once a day, for 20 days, you posted the cover of an album that was, for whatever reason, a big deal in your life. I really got into it, thanks to Ed Summers.
20 albums are threaded in the link below. They are in an order that is kind of chronological, enough that you can see me evolve from teenage headbanger to aging hipster.
Post by @sgillies@mastodon.social View on Mastodon
-
13:00
Mappery: Chart of Knowledge
sur Planet OSGeoPièce jointe: [télécharger]
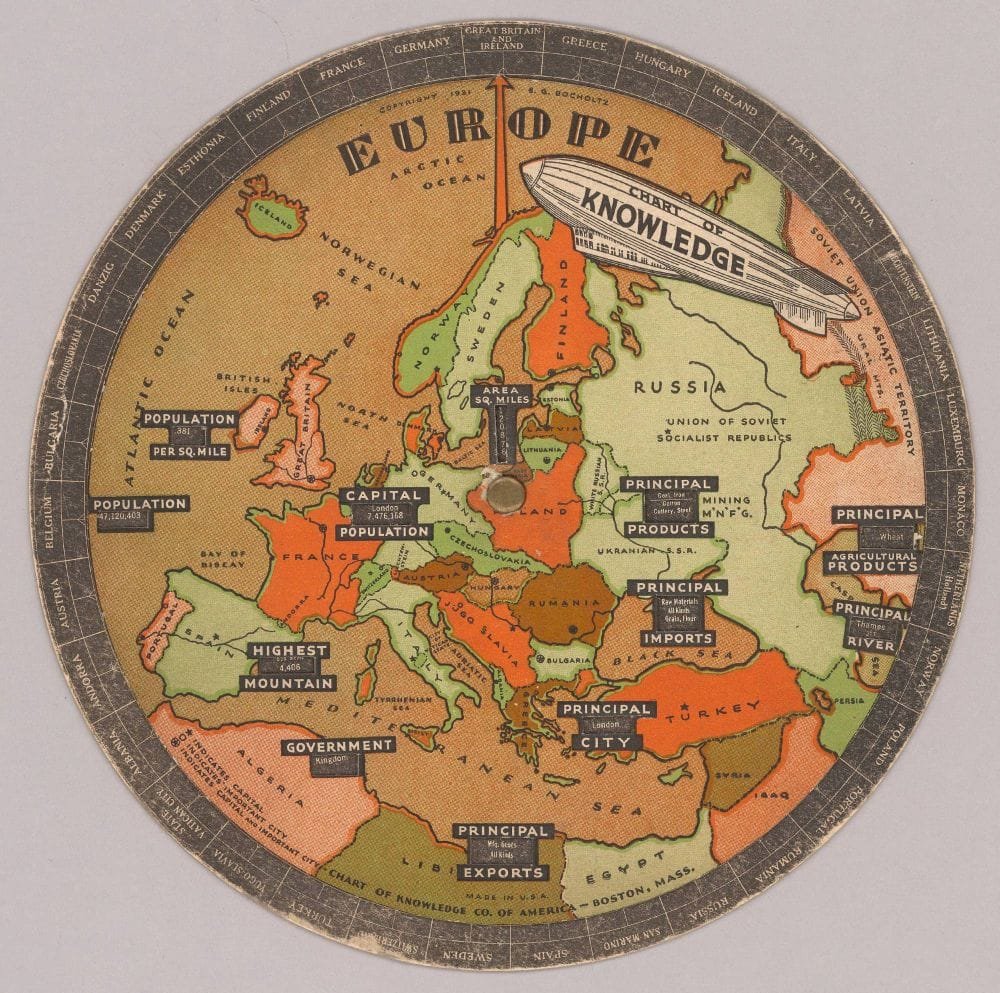
Monsieur LeCartograhe, now also on BlueSky, shared this Chart of Knowledge, 1931 – Bocholtz, S.G.
-
10:42
GeoSolutions: FREE Webinar: GeoServer 2.26.0 and Beyond
sur Planet OSGeoYou must be logged into the site to view this content.
-
13:00
Mappery: A Street Guide that is not Mobile
sur Planet OSGeoPièce jointe: [télécharger]

Scott Simmons found this street guide in his hotel, “Just got into my room in Taichung, Taiwan and found the wall to be a handy guide. Problem is, I cannot easily carry the wall into the streets, so the picture will have to do. This hotel is just a few blocks from GIS.FCU (GIS Research Center at Feng Chia University), a huge contributor to international standardization ( [https:]] ).”
I wonder what the thinking was to use this street map as decoration?
-
3:51
Sean Gillies: Running again
sur Planet OSGeoAfter I gave up on The Bear 100 and Black Squirrel in August, I stopped running for 6 weeks to let my Achilles tendonitis subside. I quit using the stair stepper and elliptical machines at the gym, too. My only activities were bike commuting, yoga, weight lifting, and a weekly "HIIT the water" class. I've joked about aquasizing, but have really been getting into this class. The instructor is gung ho, the regulars are friendly, and it's a good, low impact, workout. I'm going to keep doing it this fall and winter, for sure.
On the 20th of September I went for a flat 2 mile run at Pineridge Open Space. It felt great to run outdoors on dirt, and I didn't feel any worse afterwards. I did another easy, flat trail run 4 days later. This week I did two 3.5 mile runs on trails and another session on an elliptical trainer. 2 hours in all. I'm going to try to increase to 3 hours a week by the end of the year.
I'm grateful to be able to run again. With some luck, 2025 could be a good year.
-
13:00
Mappery: Spot the Map
sur Planet OSGeoPièce jointe: [télécharger]

Reinder sent this pic of a shop window in Mafra in Portugal. He said there is quite a lot of Mappery in there. I found 6 and maybe 7, how about you?
-
5:35
Sean Gillies: Rasterio 1.4.0
sur Planet OSGeoA month ago I wrote a long-ish post about Fiona 1.10.0. I'll try to keep this one shorter. Rasterio 1.4.0 has three main changes: Python openers, detailed error chaining, and a new statistics API.
Python openers can connect filesystems implemented in Python, like fsspec or tiledb.vfs, to GDAL's own virtual filesystem machinery. In most cases, you should reply on GDAL's built-in virtual filesystem handlers. On the other hand, if you have unique or proprietary data access protocols, then Rasterio's new openers may be useful.
Often enough, I want more visibility into the errors that occur during GDAL I/O functions. I'd like to see all the errors, not just the last one. So, I've implemented Python-like chaining of GDAL errors. It's not perfectly analogous, because we don't have frames for GDAL code like we do for Python, but look at the kind of details you can get now:
>>> src.read()
rasterio._err.CPLE_AppDefinedError: TIFFFillTile:Read error at row 512, col 0, tile 3; got 38232 bytes, expected 47086

The above exception was the direct cause of the following exception:

rasterio._err.CPLE_AppDefinedError: TIFFReadEncodedTile() failed.

The above exception was the direct cause of the following exception:

Traceback (most recent call last):
  File "rasterio/_io.pyx", line 968, in rasterio._io.DatasetReaderBase._read
    io_multi_band(self._hds, 0, xoff, yoff, width, height, out, indexes_arr, resampling=resampling)
  File "rasterio/_io.pyx", line 207, in rasterio._io.io_multi_band
    with stack_errors() as checker:
  File "rasterio/_io.pyx", line 213, in rasterio._io.io_multi_band
    return checker.exc_wrap_int(retval)
  File "rasterio/_err.pyx", line 307, in rasterio._err.StackChecker.exc_wrap_int
    raise last
rasterio._err.CPLE_AppDefinedError: /app/tests/data/corrupt.tif, band 1: IReadBlock failed at X offset 1, Y offset 1: TIFFReadEncodedTile() failed.

The above exception was the direct cause of the following exception:

Traceback (most recent call last):
  File "<console>", line 1, in <module>
  File "rasterio/_io.pyx", line 650, in rasterio._io.DatasetReaderBase.read
    out = self._read(indexes, out, window, dtype, resampling=resampling)
  File "rasterio/_io.pyx", line 971, in rasterio._io.DatasetReaderBase._read
    raise RasterioIOError("Read or write failed. See context for details.") from cplerr
rasterio.errors.RasterioIOError: Read or write failed. See context for details.
Lastly, the flawed, multimodal
statistics()method of datasets has been deprecated and is replaced by new, simplerstats(),clear_stats(), andupdate_stats()methods.Rasterio 1.4.0 remains limited to "classical" rasters, those with a handful of bands or channels all of the same type. For hyperspectral data cubes and the like, you should use h5py, xarray, or other emerging software. I'm quite interested in working on new software in that area, but I'd like to do so without any classical raster legacy.
-
13:00
Mappery: Arctic Circle
sur Planet OSGeoPièce jointe: [télécharger]

Matthew Edney sent us this, he said “My father in law at the Arctic Circle, in Dalton, Alaska, the dot for the location is right by his head”
Pretty Cool
-
12:00
WhereGroup: Treffen der QGIS-Gemeinschaft in Bratislava
sur Planet OSGeoUnser Kollege Johannes Kröger besuchte auch dieses Jahr die QGIS User Conference und fasst hier voller Enthusiasmus seine Highlights zusammen. -
22:22
TorchGeo: v0.6.1
sur Planet OSGeoTorchGeo 0.6.1 Release NotesThis is a bugfix release. There are no new features or API changes with respect to the 0.6.0 release.
This release fixes an important security vulnerability and properly documents a lack of support for rasterio 1.4. All users are recommended to update to TorchGeo 0.6.1 if they are using
Dependenciestorchgeo.models.get_weight.- rasterio: 1.4 not yet supported (#2327)
- Datamodule: use persistent workers for parallel data loading (#2291)
- OSCD: update normalization statistics (#2282)
- Datasets: add support for
os.PathLike(#2273) - GeoDataset: allow a mix of
strandpathlibpaths (#2270)
- API: avoid use of
evalinget_weight(#2323)
- CD: set up continuous deployment to PyPI (#2342)
- CI: install tensorboard to speed up notebooks (#2315)
- CI: install TorchGeo from checked out repo (#2306)
- dependabot: only update npm lockfile (#2277)
- prettier: ignore cache directories (#2278)
- prettier: prefer single quotes (#2280)
- pytest: set default
--covand--cov-report(#2275) - pytest: set matplotlib backend locally too (#2326)
- pytest: silence numpy 2 warnings in PyTorch (#2302)
- ruff: remove NPY tests now that we test numpy 2 in CI (#2287)
- Alternatives: add scikit-eo to list of TorchGeo alternatives (#2340)
- Contributing: installation-agnostic prettier usage (#2279)
- Datasets: move dataset CSV to subdirectory (#2281, #2304)
- Datasets: update NAIP resolution (#2325)
- Tutorials: fix NAIP downloads by signing URL (#2343)
- Tutorials: update recommended strategy for raster datasets containing images and masks (#2293)
This release is thanks to the following contributors:
@adamjstewart
@calebrob6
@MathiasBaumgartinger
@Nowosad
@sfalkena -
13:00
Mappery: Samsonite is a Global Brand
sur Planet OSGeoPièce jointe: [télécharger]
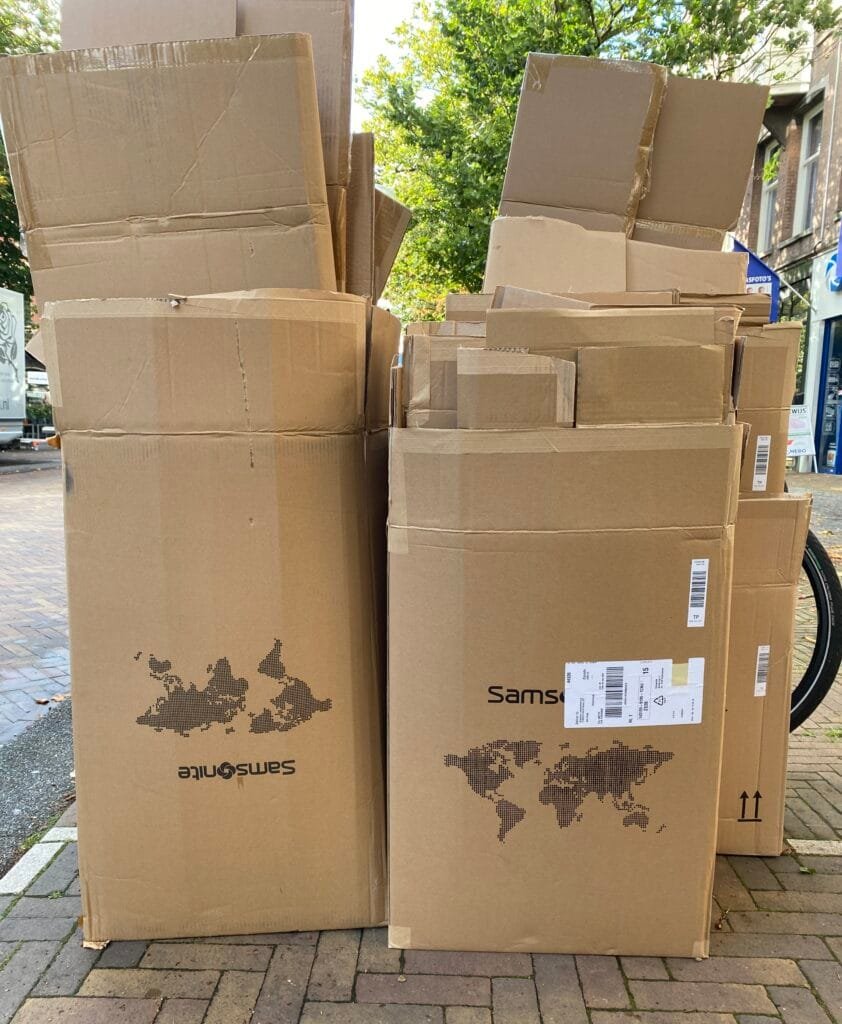
Spotted by Reinder ” in a street with many shops in The Hague, it’s Wednesday throwing away cardboard boxes day”
-
18:46
OTB Team: OTB User Days 2024
sur Planet OSGeoDear all, The OTB User Days 2024 will be held from November 21th to November 22th in Toulouse, France. The event will be held at Artilect Fablab On November 21th, presentations will be held in the morning, and brainstorming in the afternoon : On November 22th : Please register here if you plan to come and you […] -
13:04
Oslandia: (Fr) Du nouveau pour [CityBuilder] CityForge
sur Planet OSGeoSorry, this entry is only available in French.
-
13:00
Mappery: Gordon the Globe
sur Planet OSGeoPièce jointe: [télécharger]

Elizabeth spotted this advert on the London Underground. Is Gordon smiling or shocked or ..?
-
19:46
Oslandia: New release for QField : 3.4 “Ebo”
sur Planet OSGeoOslandia is the main partner of OPENGIS.ch around QField. We are proud today to forward the announcement of the new QField release 3.4 “Ebo”.
Main highlights
A new geofencing framework has landed, enabling users to configure QField behaviors in relation to geofenced areas and user positioning. Geofenced areas are defined at the project-level and shaped by polygons from a chosen vector layer. The three available geofencing behaviours in this new release are:
- Alert user when inside an area polygon;
- Alert user when outside all defined area polygons and
- Inform the user when entering and leaving an area polygons.
In addition to being alerted or informed, users can also prevent digitizing of features when being alerted by the first or second behaviour. The configuration of this functionality is done in QGIS using QFieldSync.

Pro tip: geofencing settings are embedded within projects, which means it is easy to deploy these constraints to a team of field workers through QFieldCloud. Thanks Terrex Seismic for sponsoring this functionality.
QField now offers users access to a brand new processing toolbox containing over a dozen algorithms for manipulating digitized geometries directly in the field. As with many parts of QField, this feature relies on QGIS’ core library, namely its processing framework and the numerous, well-maintained algorithms it comes with.
The algorithms exposed in QField unlock many useful functionalities for refining geometries, including orthogonalization, smoothing, buffering, rotation, affine transformation, etc. As users configure algorithms’ parameters, a grey preview of the output will be visible as an overlay on top of the map canvas.

To reach the processing toolbox in QField, select one or more features by long-pressing on them in the features list, open the 3-dot menu and click on the process selected feature(s) action. Are you excited about this one? Send your thanks to the National Land Survey of Finland, who’s support made this a reality.
QField’s camera has gained support for customized ratio and resolution of photos, as well as the ability to stamp details – date and time as well as location details – onto captured photos. In fact, QField’s own camera has received so much attention in the last few releases that it was decided to make it the default one. On supported platforms, users can switch to their OS camera by disabling the native camera option found at the bottom of the QField settings’ general tab.
Wait, there’s moreThere are plenty more improvements packed into this release from project variables editing using a revamped variables editor through to integration of QField documentation help in the search bar and the ability to search cloud project lists. Read the full 3.4 changelog to know more, and enjoy the release!
Contact us !A question concerning QField ? Interested in QField deployment ? Do not hesitate to contact Oslandia to discuss your project !
-
13:00
Mappery: The Map Shop
sur Planet OSGeoPièce jointe: [télécharger]

Reinder spotted this selection of maps for sale in a souvenir shop at Wawel Castle, Cracow, Poland. They like a map there!

-
8:45
OPENGIS.ch: QField 3.4 “Ebo”: Geofencing and processing out of the box
sur Planet OSGeoQField 3.4 is out, and it won’t disappoint. It has tons of new features that continue to push the limits of what users can do in the field.
Main highlights
A new geofencing framework has landed, enabling users to configure QField behaviors in relation to geofenced areas and user positioning. Geofenced areas are defined at the project-level and shaped by polygons from a chosen vector layer. The three available geofencing behaviours in this new release are:- Alert user when inside an area polygon;
- Alert user when outside all defined area polygons and
- Inform the user when entering and leaving an area polygons.
In addition to being alerted or informed, users can also prevent digitizing of features when being alerted by the first or second behaviour. The configuration of this functionality is done in QGIS using QFieldSync.
Pro tip: geofencing settings are embedded within projects, which means it is easy to deploy these constraints to a team of field workers through QFieldCloud. Thanks Terrex Seismic for sponsoring this functionality.
QField now offers users access to a brand new processing toolbox containing over a dozen algorithms for manipulating digitized geometries directly in the field. As with many parts of QField, this feature relies on QGIS’ core library, namely its processing framework and the numerous, well-maintained algorithms it comes with.
The algorithms exposed in QField unlock many useful functionalities for refining geometries, including orthogonalization, smoothing, buffering, rotation, affine transformation, etc. As users configure algorithms’ parameters, a grey preview of the output will be visible as an overlay on top of the map canvas.
To reach the processing toolbox in QField, select one or more features by long-pressing on them in the features list, open the 3-dot menu and click on the process selected feature(s) action. Are you excited about this one? Send your thanks to the National Land Survey of Finland, who’s support made this a reality.
QField’s camera has gained support for customized ratio and resolution of photos, as well as the ability to stamp details – date and time as well as location details – onto captured photos. In fact, QField’s own camera has received so much attention in the last few releases that we have decided to make it the default one. On supported platforms, users can switch to their OS camera by disabling the native camera option found at the bottom of the QField settings’ general tab.
Wait, there’s moreThere are plenty more improvements packed into this release from project variables editing using a revamped variables editor through to integration of QField documentation help in the search bar and the ability to search cloud project lists. Read the full 3.4 changelog to know more, and enjoy the release!
-
20:49
QGIS Blog: Plugin Update – September, 2024
sur Planet OSGeoIn September a total of 20 new plugins were published in the QGIS plugin repository.
HighlightIn the last month some AI-related plugins became available for users, namely IntelliGeo and TreeEyed, which in addition to the increasing number of tools, greatly contribute for the adaptation of QGIS to current and future needs, showcasing it as one of the best options for beginners and experts alike to conduct a number of geospatial analyses.
As stated by their authors, with IntelliGeo there’s a chat interface where users can detail their requests, and the output is either a PyQGIS code or a graphical processing model, which can in turn be executed directly in QGIS.

As for the TreeEyed plugin, its main objective is the monitoring of trees by generating vector and raster datasets from high resolution RGB imagery.
 Overview
Here follows the quick overview in reverse chronological order. If any of the names or short descriptions catches your attention, you can find the direct link to the plugin page in the table below:
Project Setup Sets up a QGIS project to my personal specs. Continuous Network Analysis (Processing) Processing plugin that adds several scripts to assist in decision making and validation of line-type vector networks by generating inconsistencies, further expanding the “Network Analysis” tool. Oslandia Official plugin for Oslandia customers. Reach Enables the use of real transit time as a spatial predicate for selects and joins. Data Clock Polar plot of seasonal data. QGIS Light QGIS made simple – a light user interface for core GIS functions. Attribute Searcher A minimalistic plugin to search for values in attributes quick and easy. Topo Maps ????????Generate Topographic Maps. IntelliGeo IntelliGeo is QGIS plugin that facilitates interaction with Large Language Models in QGIS environment. CartAGen Cartographic generalization. RiverBankErosionAndAccretion This plugin calculates the erosion and accretion along a river’s course. VectorStats Plugin for descriptive and statistical analysis of vectors, with chart generation. Jilin1Info(2023) 2023???50cm???????????? Historique Parcelle Historique des parcelles (cadastre français). String Writer Writes QGIS layers to Surpac string file format. TreeEyed TreeEyed is a QGIS plugin for tree monitoring using AI. SHP Buddy Quickly create shapefiles for breeding experiments. TEKSI Wastewater TEKSI Wastewater plugin to manage wastewater networks. KGR Finder By simply drawing polygons or clicking on existing polygons, this extension makes it possible to download data from OpenStreetMap (OSM) or the iDAI.gazetteer and display it on the map, including all existing attributes. The plugin is designed so that other services can also be easily integrated in the future. layer_style_master This QGIS plugin copies symbology, labels, and rendering settings from one layer to multiple other layers. -
13:00
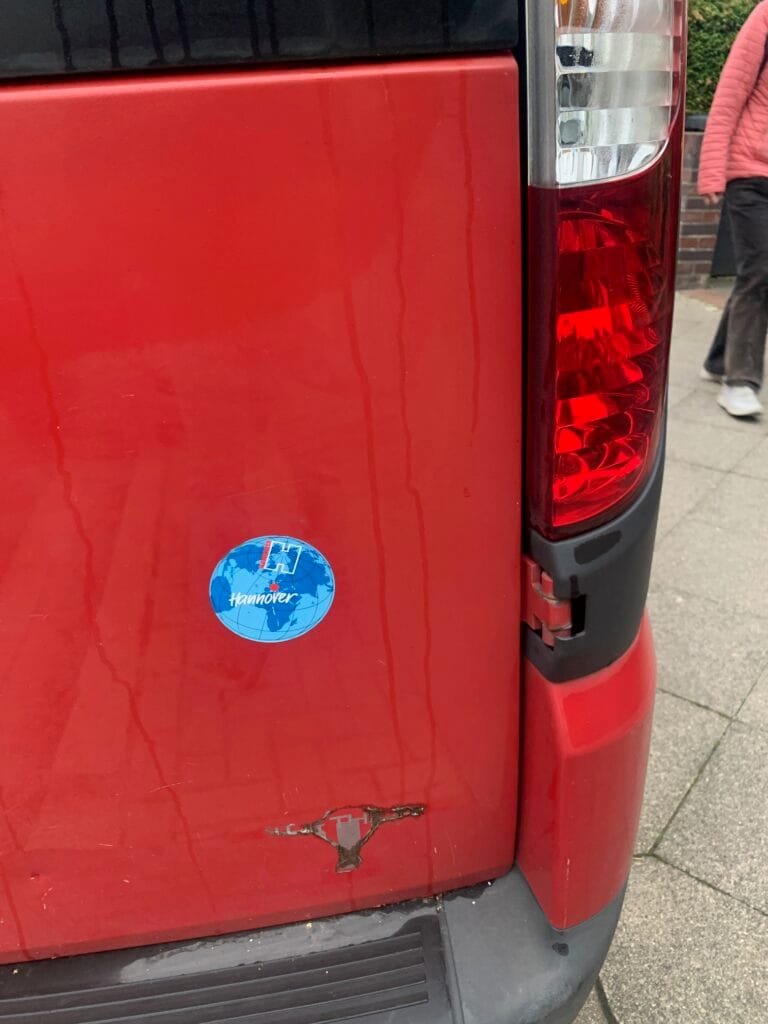
Mappery: Hannoverian Bumper Sticker
sur Planet OSGeoPièce jointe: [télécharger]

Marc-Tobias shared this. I like that Hannover becomes the centre of the world.
-
23:25
Free and Open Source GIS Ramblings: LLM-based spatial analysis assistants for QGIS
sur Planet OSGeoAfter the initial ChatGPT hype in 2023 (when we saw the first LLM-backed QGIS plugins, e.g. QChatGPT and QGPT Agent), there has been a notable slump in new development. As far as I can tell, none of the early plugins are actively maintained anymore. They were nice tech demos but with limited utility.
However, in the last month, I saw two new approaches for combining LLMs with QGIS that I want to share in this post:
IntelliGeo plugin: generating PyQGIS scripts or graphical modelsAt the QGIS User Conference in Bratislava, I had the pleasure to attend the “Large Language Models and GIS” workshop presented by Gustavo Garcia and Zehao Lu from the the University of Twente. There, they presented the IntelliGeo Plugin which enables the automatic generation of PyQGIS scripts and graphical models.
The workshop was packed. After we installed all dependencies and the plugin, it was exciting to test the graphical model generation capabilities. During the workshop, we used OpenAI’s API but the readme also mentions support for Cohere.
I was surprised to learn that even simple graphical models are actually pretty large files. This makes it very challenging to generate and/or modify models because they take up a big part of the LLM’s context window. Therefore, I expect that the PyQGIS script generation will be easier to achieve. But, of course, model generation would be even more impressive and useful since models are easier to edit for most users than code.
 Image source: https://github.com/MahdiFarnaghi/intelli_geo
ChatGeoAI: chat with PyQGIS
Image source: https://github.com/MahdiFarnaghi/intelli_geo
ChatGeoAI: chat with PyQGIS
ChatGeoAI is an approach presented in Mansourian, A.; Oucheikh, R. (2024). ChatGeoAI: Enabling Geospatial Analysis for Public through Natural Language, with Large Language Models. ISPRS Int. J. Geo-Inf., 13, 348.
It uses a fine-tuned Llama 2 model in combination with spaCy for entity recognition and WorldKG ontology to write PyQGIS code that can perform a variety of different geospatial analysis tasks on OpenStreetMap data.
The paper is very interesting, describing the LLM fine-tuning, integration with QGIS, and evaluation of the generated code using different metrics. However, as far as I can tell, the tool is not publicly available and, therefore, cannot be tested.
 Image source: [https:]]
Are you aware of more examples that integrate QGIS with LLMs? Please share them in the comments below. I’d love to hear about them.
-
13:00
Mappery: Johannes Kepler
sur Planet OSGeoPièce jointe: [télécharger]

This portrait of Johannes Kepler was spotted by Reinder at the Collegium Maius in Cracow. Don’t you love the way old paintings so often have a globe or a map in the background (presumably a symbol of status)?
-
13:00
Mappery: Fire Finding with an Alidade
sur Planet OSGeoPièce jointe: [télécharger]

Have you heard of an alidade? I hadn’t until Walter Schwartz sent me these pics.
He said “Behold the ingenious alidade, a surveying instrument here used as a fire finder. This one is displayed at the Cole Land Transportation Museum in Bangor, Maine. Forest rangers used these atop fire towers to report the distance and, in conjunction with another tower, the coordinates of fires. The map on this table covers an approximately 25 mile diameter (40 KM) inclusive of Augusta to Rockport Maine. The user viewed through a rectangular slot on one upright and rotated the metal structure to view the fire. Some tables were on slides so that the view would not be obstructed by parts of the tower structure. GPS and cameras solve the same problem today. “
Well who knew that? I found this great explanation of the alidade.

-
19:49
OSGeo Announcements: [OSGeo-Announce] FOSS4G 2022 Firenze (Italy) recordings are online
sur Planet OSGeosee news item: FOSS4G 2022 Firenze (Italy) recordings are online - OSGeo
FOSS4G 2022 has been a great event Firenze (Italy). The videos are now published on Youtube.
We hope you will enjoy them.
You find the videos of the talks at our FOSS4G Youtube Channel.
355 videos were uploaded.
We hope you like the videos and get valuable information. We would like to spread the world and we hope you will learn about our great software and our community.
We would like to thank all people involved organizing FOSS4G 2022.
About OSGeo
-------------------
The Open Source Geospatial Foundation (OSGeo) [13] is a non-profit organization dedicated to the development and promotion of open-source geospatial technologies and data. OSGeo serves as an umbrella organization for the collaborative development of open source geospatial software, and provides financial, organizational, and legal support to the broader geospatial community._______________________________________________
Announce mailing list
Announce@lists.osgeo.org
[https:]]1 post - 1 participant
-
18:35
Markus Neteler: Migration of grass-dev mailing list to OSGeo Discourse
sur Planet OSGeoThe post Migration of grass-dev mailing list to OSGeo Discourse appeared first on Markus Neteler Consulting.
-
13:00
Mappery: Your world at Pied a Terre
sur Planet OSGeoPièce jointe: [télécharger]

Reeinder said “At the Amsterdam bookstore Scheltema, one can put a post-it on a kind of world map display, to mark the spot where one has been.”
-
4:00
GeoServer Team: GeoServer 2024 Q4 Developer Update
sur Planet OSGeoThe GeoServer team working on sharing our roadmap plans plans and providing greater transparency on our community participation and funding goals.
GeoServer Developer ForumIf you have sent email to
geoserver-devellist this week you have been met with the following reply:This list is now closed, join us on geoserver developer forum: [https:]That is right, developer communication has moved to GeoServer Developer on discourse.
- To post join the geoserver-developer group.
- About the GeoServer Developer category has all the details (even email).
- There are improved instructions on how to sign up using github.
How to help:
- Accept the invite - it is quick and easy joining the group and navigate to the forum in one go.
- Update communication details for website and developer guide.
GeoServer 3 Crowdfunding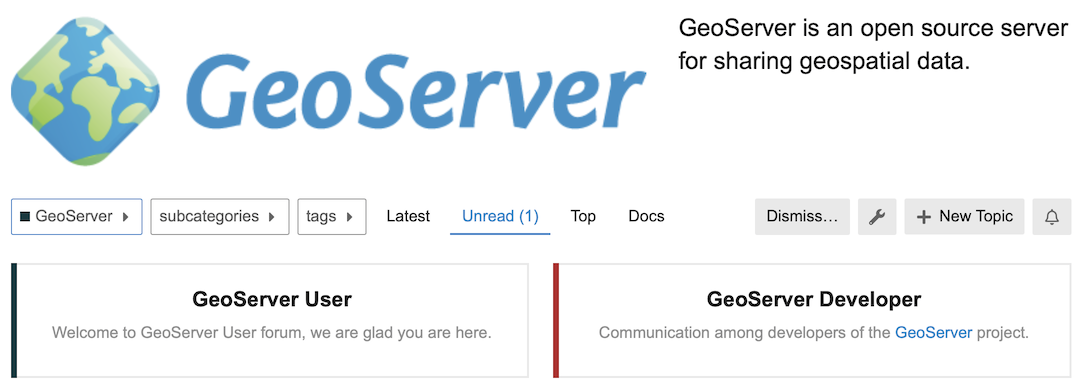
The consortium of Camptocamp, GeoSolutions and GeoCat have responded to our roadmap challenge with a bold GeoServer 3 Call for Crowdfunding established as a multi-party contract.
- The fundraising target has now been set, see updated post, and milestone deliverables established.
- GSIP-226 - GeoServer 3
How to help:
- Share the call for crowdfunding in your region.
- To express your interest or pledge support contact us directly at gs3-funding@googlegroups.com, or via online form.
Wicket 9 upgrade
GEOS-11275: Brad and David have made considerable progress on Wicket UI updates. After a year of effort the first results towards Wicket 10 are being merged onto the
mainbranch.Thanks to Brad for doing much of the difficult work starting this activity, and to David for working hard to stabilize this work for testing.
Peter and Jody started a wicket test plan and evaluated an initial 2.26-M0 milestone release.
How to help:
- Test a 2.27.x nightly build, clearly noting problems in the Wicket Test Plan.
- Urgent: Developer assistance is needed to restore JUnit tests for the Wicket modules. Many are failing just due to the contents of the page being slightly altered.
- Developer assistance is needed to resolve the content-security-policy warnings reported during testing.
- David has outlined what is needed for a new GSModalDialog to replace the functionality being removed in Wicket 10.
Spring Security 5.8 updatedocker pull docker.osgeo.org/geoserver:2.27.x docker run -it -p8081:8080 docker.osgeo.org/geoserver:2.27.xGEOS-11271: Andreas Watermeyer (ITS Digital Solutions) has completed this activity ahead of the GeoServer 2.26.0 release.
How to help:
- The next step is going through the Preparing for 6.0 checklist
GEOS-11272: Andreas Watermeyer (ITS Digital Solutions) set up new community modules to work on this activity. This is a new implementation as the spring security internals have changed, and the new spring api allows for a cleaner implementation.
How to help:
- This work will require extensive testing in different environments.
- Ideas on unit testing and increasing test coverage with test containers are very welcome.
We would like to welcome a new project sponsor:
Route4Me - Simplify Last Mile Complexity: proven route planning and route optimization software.

The GeoServer project steering committee seeks sponsorship to fund maintenance activities, code sprints, and research and development that is beyond the reach of an individual contributor or organization.
- We have worked with OSGeo to provide sponsorship guidance for individual consultants, small organisation, companies and public institutions of different sizes.
- GeoServer has a new sponsorship page on our website collecting this information for our project.
- GeoServer now lists sponsors logos on our home page, alongside core contributors.
We would like to thank everyone who has responded thus far:
- Sponsors: How 2 Map, illustreets, and Route4Me.
- Individual Donations: Peter Rushforth, Marco Lucarelli, Gabriel Roldan, Jody Garnett, Manuel Timita, Andrea Aime
-
13:00
Mappery: 3D Globe
sur Planet OSGeoPièce jointe: [télécharger]

Elizabeth shared this with us. She said “Would you call this a map? It is certainly a navigation aid.” I am not sure how you would describe this but it certainly is an interesting piece.
-
13:00
Mappery: I can’t explain
sur Planet OSGeoPièce jointe: [télécharger]
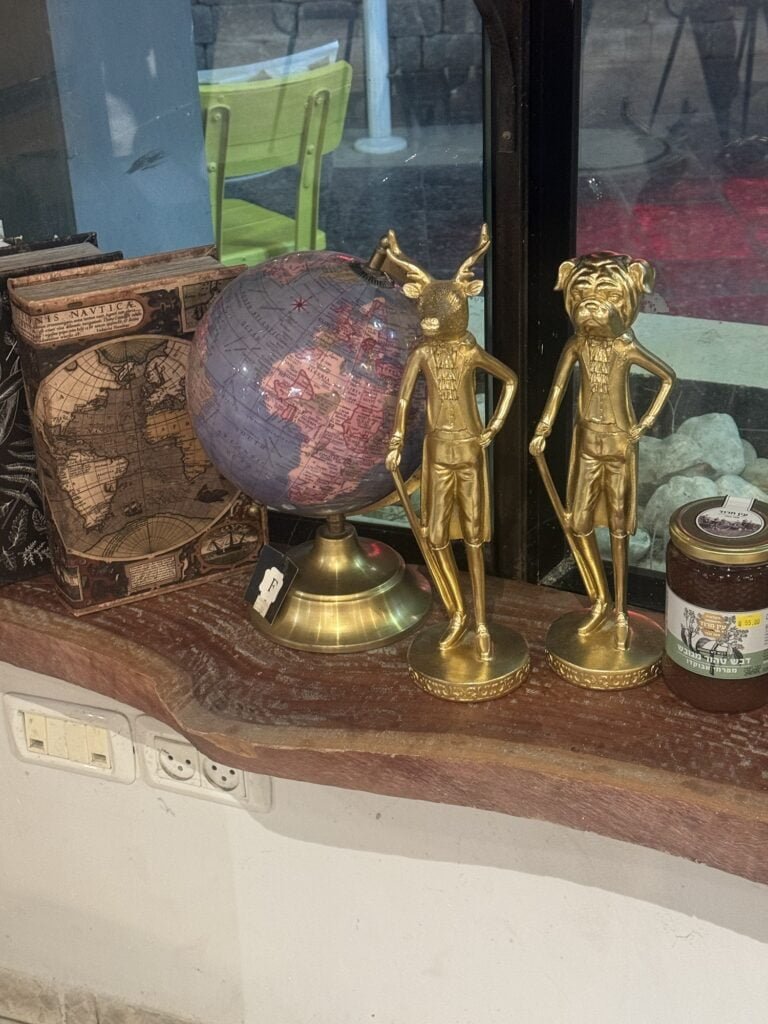
I spotted this globe at a wedding venue recently. I’ve no idea who the two figures aren’t? Feel free to make suggestions
-
11:12
GeoSolutions: GeoSolutions Participating at GIS-Pro 2024 in Portland, ME October 7-10
sur Planet OSGeoYou must be logged into the site to view this content.
-
13:00
Mappery: A Wild Map in a Nuclear Bunker
sur Planet OSGeoPièce jointe: [télécharger]
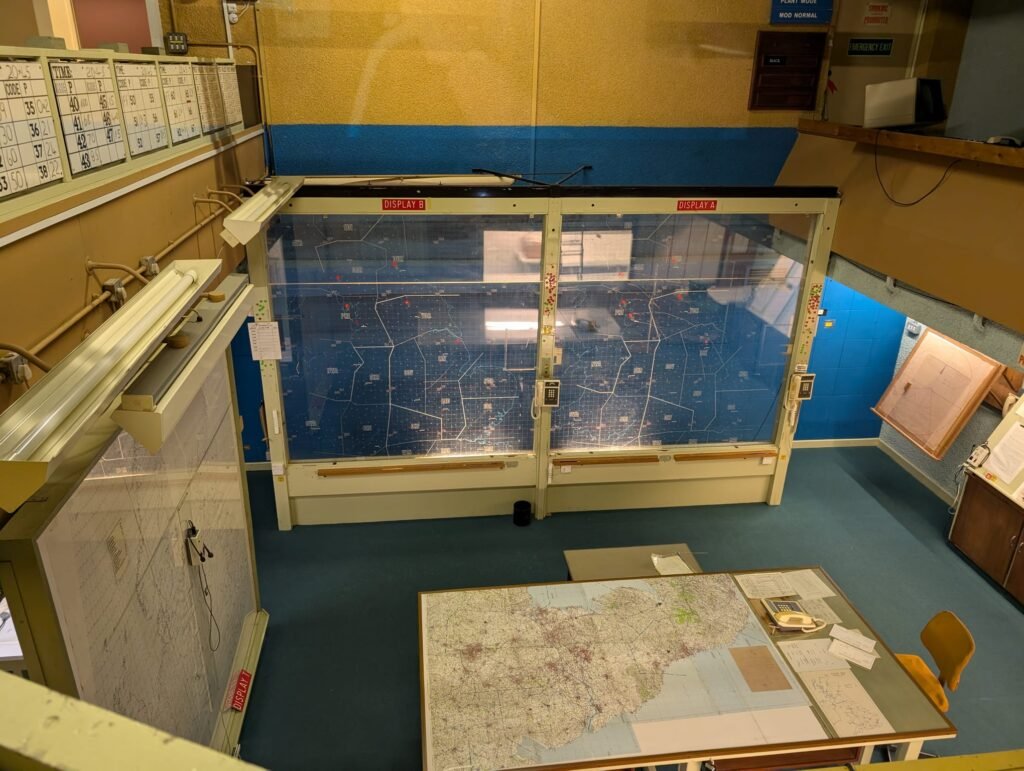
Rollo spotted this Mapsinthewild in a late 1940’s nuclear bunker operations room in York with the ‘most advanced map of the time’ laid out. This facility was designed to monitor impact and fall out. It would support a team of 60 for 30 days underground…. apparently design was out dated almost immediately (1950) but was still manned for 30 years!!!!
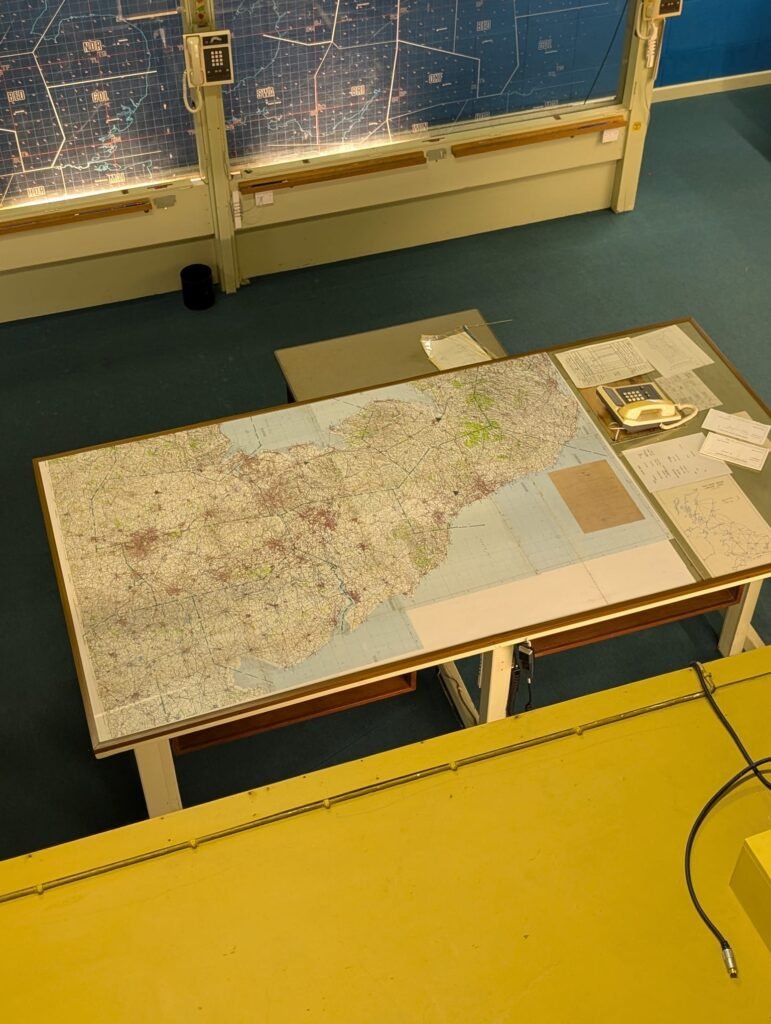
And here is the 1980’s tech update …

-
4:00
Camptocamp: Generative AI in geospatial: A Pyramid of Increasing Complexity
sur Planet OSGeoPièce jointe: [télécharger]
Large Language Models LLMs like GPT have emerged as game-changers in the way we interact with technology, automate processes and generate content. -
20:16
OSGeo Announcements: [OSGeo-Announce] We are pleased to announce that OTB version 9.1.0 is out!
sur Planet OSGeoReady to use binary packages are available on the package page of the website:
* OTB-9.1.0-Linux.tar.gz
<https://www.orfeo-toolbox.org/packages/OTB-9.1.0-Linux.tar.gz>\(Ubuntu/Debian\)
* OTB-9.1.0-Linux_RedHat.tar.gz
<https://www.orfeo-toolbox.org/packages/OTB-9.1.0-Linux_RedHat.tar.gz>\(Linux\)
* OTB-9.1.0-Win64.zip
<https://www.orfeo-toolbox.org/packages/OTB-9.1.0-Win64.zip>\(Windows
64 bits)Docker images are available with different python versions (3.8 by default, 3.10 for 9.1.0_ubuntu22, 3.12 for 9.1.0_ubuntu24) :
|docker pull orfeotoolbox/otb:9.1.0|
It is also possible to checkout the branch with git:
|git clone Main Repositories / otb · GitLab OTB -b release-9.1|
The documentation for OTB 9.1.0 can be found here <https://www.orfeo-toolbox.org/CookBook-9.1/>\.
To download the packages one by one for a modular installation, you can download them here < [https:]] follow the instructions in the cookbook <https://www.orfeo-toolbox.org/CookBook-9.1/Installation.html>\.
*Changes*
This release introduces bug fixes, important dependencies update (jpeg turbo, geotiff and GDAL), documentation improvement and *the support of SPOT5* (previously drop in OTB8 as OSSIM dependency was removed).
The full changelog can be accessed here <https://gitlab.orfeo-toolbox.org/orfeotoolbox/otb/-/blob/release-9.1/RELEASE_NOTES.txt>\.
We welcome your feedback and requests on OTB’s GitLab <Sign in · GitLab; and if you find a bug, please report it!
*Reminder from OTB 9.0:*
The *whole new packaging system* is entirely made with CMake / CPack, to make the toolbox more modular. You still have the possibility to have a full package for Linux and Windows, but for those who want to install only a part of the toolbox it is possible since v9. The modules list is available in the cookbook with their associated applications. All the packages are now in tar.gz and the installation is movable unlike OTB < 9.
*All GUI has been dropped*. QGIS is now the official visualization tool. We support the development of a plugin which you can use with the following instructions <https://www.orfeo-toolbox.org/CookBook/QGISInterface.html>\. Thus *like 9.0 the version 9.1 does not include Monteverdi or Mapla*.
Like version 9.0, Mac version is not supported, you can use docker image.
Laurent Tristan
OTB Team1 post - 1 participant
-
13:00
Mappery: Battersea Park Playground
sur Planet OSGeoPièce jointe: [télécharger]

The Geomob speaker, known as the Geospatial Index, shared this picture from a Battersea Park playground in London.
-
4:00
Paul Ramsey: Cancer 12
sur Planet OSGeoBack to entry 1
I was glancing at the New York Times and saw that Catherine, the Princess of Wales, had released an update on her treatment. And I thought, “wow, I hope she’s doing well”. And then I thought, “wow, I bet she gets a lot of positive affirmation and support from all kinds of people”.
I mean, she’s a princess.

Even us non-princesses, we need support too, and I have to say that I have been blown away by how kind the people around me in my life have been. And also how kind the other folks who I have never really talked with before have been.
I try to thank my wife as often as I can. It is hard not to feel like a burden when I am, objectively, a burden, no matter how much she avers I am not. I am still not fully well (for reasons), and I really want to be the person she married, a helpful full partner. It is frustrating to still be taking more than I’m giving.
From writing about my experience here, I have heard from other cancer survivors, and other folks who have travelled the particular path of colorectal cancer treatment. Some of them I knew from meetings and events, some from their own footprint on the internet, some of them were new to me. But they were all kind and supportive and it really helped, in the dark and down times.
From my work on the University of Victoria Board of Governors, I have come to know a lot of people in the community there, and they were so kind to me when I shared my diagnosis. My fellow board members stepped in and took on the tasks I have not been able to do the past few months, and the members of the executive and their teams were so generous in sending their well-wishes.
And finally, my employers at Crunchy Data were the best. Like above and beyond. When I told them the news they just said “take as much time as you need and get better”. And they held to that. My family doctor asked “do you need me to write you a letter for your employer” and I said “no, they’re good”, and he said, “wow! don’t see that very often”. You don’t. I’m so glad Crunchy Data is still small enough that it can be run ethically by ethical people. Not having to worry about employment on top of all the other worries that a cancer diagnosis brings, that was a huge gift, and not one I will soon forget.
I think people (and Canadians to a fault, but probably people in general) worry about imposing, that communicating their good thoughts and prayers could be just another thing for the cancer patient to deal with, and my personal experience was: no, it wasn’t. Saying “thanks, I appreciate it” takes almost no energy, and the boost of hearing from someone is real. I think as long as the patient doesn’t sweat it, as long as they recognize that “ackknowledged! thanks!” is a sufficient response, it’s all great.
Fortunately, I am not a princess, so the volume was not insuperable. Anyways, thank you to everyone who reached out over the past 6 months, and also to all those who just read and nodded, and maybe shared with a friend, maybe got someone to take a trip to the gastroenterologist for a colonoscopy.
Talk to you all again soon, inshala.
-
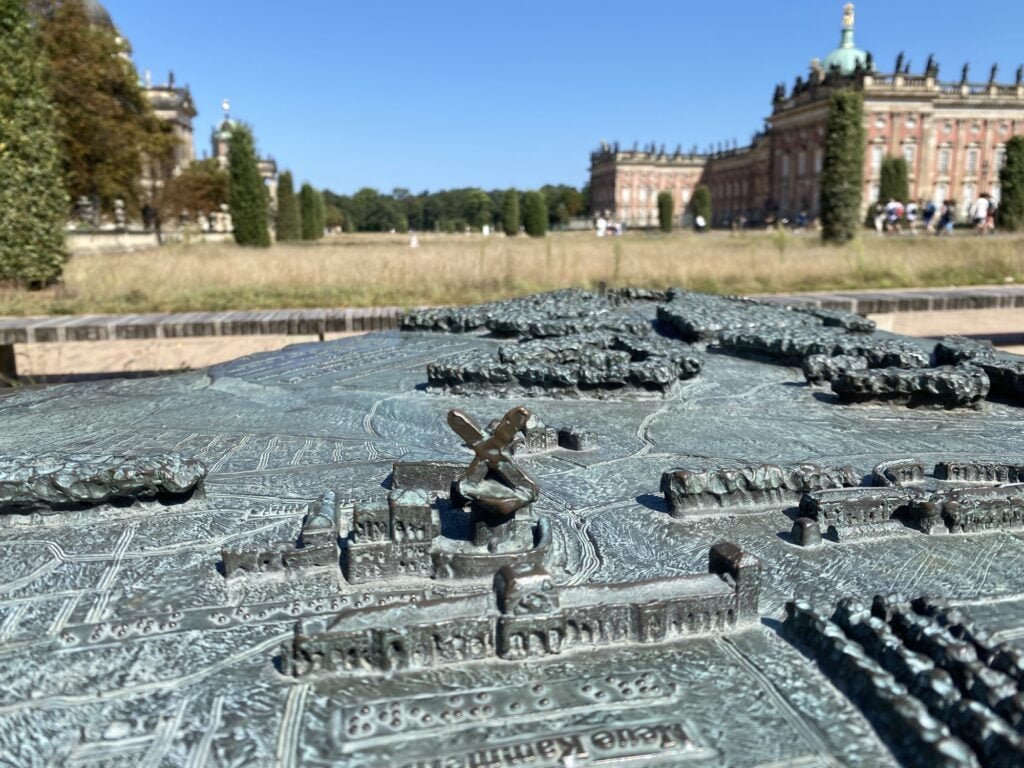
13:00
Mappery: Sanssouci Park
sur Planet OSGeoPièce jointe: [télécharger]

Reinder said “These images show a 3D plan in bronze or something, from the park ‘Sanssouci’ in Potsdam. A beautiful place with an unrivaled amount of quite impressive palaces. [https:]] “
-
13:00
Mappery: Globe 1639 at Magic Mushroom
sur Planet OSGeoPièce jointe: [télécharger]
 Screenshot
Reinder spotted this on Spuistraat, Amsterdam.
“Now it is a branch of Magic Mushroom – but in 1639 a globe was bricked into the facade.”
I had to check that Magic Mushroom was what I thought it was, and it was! No endorsement but I guess your maps get super wild afgter a trip to this place.
-
21:26
QGIS Blog: Catching up with the QGIS User Conference 2024 & Save the Date for 2025
sur Planet OSGeoThis year’s user conference took place in Bratislava, organized by the Slovak QGIS User Group and hosted at the Slovak University of Technology Faculty of Civil Engineering. The event was sold out early and the venue was full of energy and excitement.
If you missed the conference or couldn’t make it to a talk due to too many great overlapping sessions, you now have the opportunity to catch up with everything on the UC 2024 playing list:
Thanks to the organizers, speakers, sponsors, and all participants for the wonderful event.
If you want to read some personal reports from community members, here’s Ujaval Gandhi’s report: [https:]] ; and here’s Hans van der Kwast’s: [https:]]
Last but not least, we want you to save the date for next year’s user conference:

The QGIS User Conference will be in Norrköping, Sweden from 2-3 June 2025, and contributor meeting there after 4-7.
-
17:41
Markus Neteler: GRASS GIS PSC Elections 2024: nomination period ongoing
sur Planet OSGeoThe post GRASS GIS PSC Elections 2024: nomination period ongoing appeared first on Markus Neteler Consulting.
-
13:00
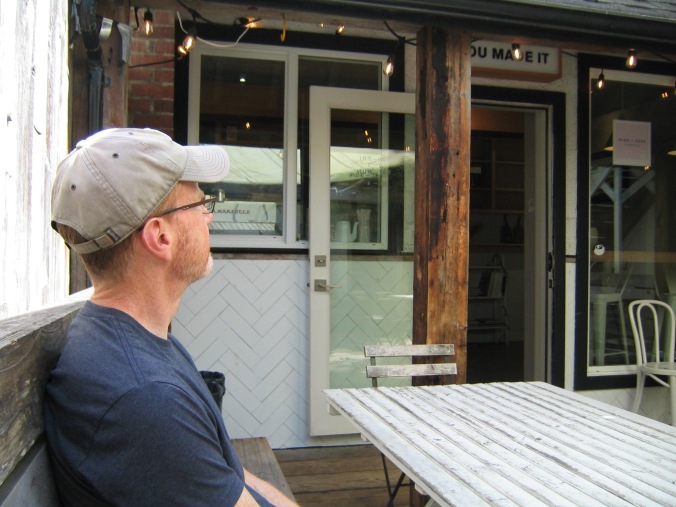
Mappery: Tire-Lire bookshop
sur Planet OSGeoPièce jointe: [télécharger]
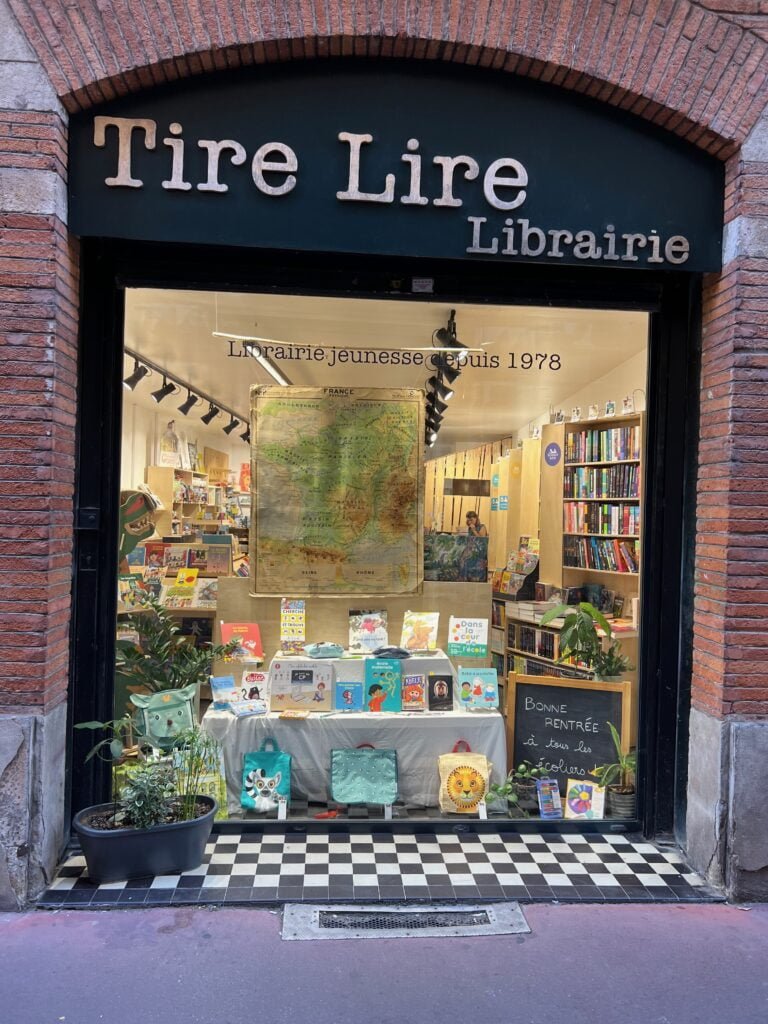

A bookshop in Toulouse, France, displaying a vintage school map
-
22:52
OTB Team: OTB Release 9.1.0
sur Planet OSGeoDear OTB community, We are happy to announce that OTB version 9.1.0 has been released! Ready to use binary packages are available on the package page of the website: The Docker image is available :docker pull orfeotoolbox/otb:9.1.0 For those who want to use docker with python 3.10 or 3.12, you can respectively pull images 9.1.0_ubuntu22 […] -
13:00
Mappery: Place Mat
sur Planet OSGeoPièce jointe: [télécharger]
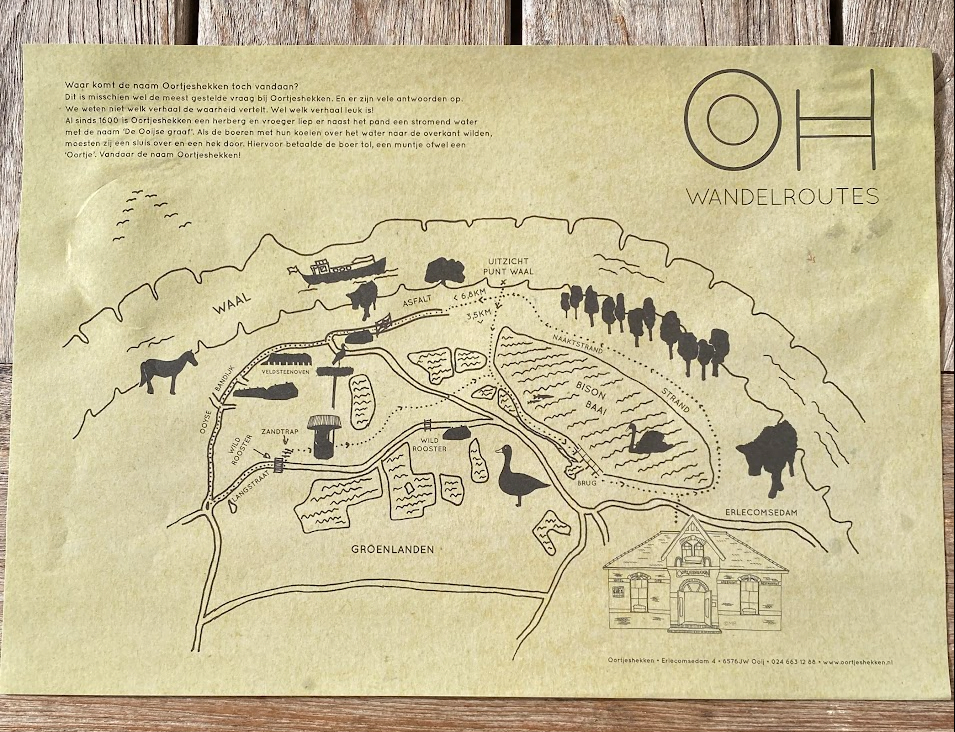
This is clever. Reinder shared this place mat from the restaurant ‘Oortjeshekken’, in the Ooijpolder, near Nijmegen. Yes it is a place mat for your plate and cutlery in the restaurant and it is also a place map for the surrounding area.
-
6:24
OSGeo Announcements: About the Announce category
sur Planet OSGeo -
0:52
Even Rouault: Those concepts in the geospatial field that have cost us millions of $$$
sur Planet OSGeoEvery domain has its baggage of concepts, which at first sight don't appear to be that terrible, but which are in practice.
Let's start with a non-geospatial example. A lot of programming languages have the concept of a "null" pointer. It is available in the C and C++ programming languages in particular, but in Java as well, or Python, etc.. Tony Hoare, null's creator, regrets its invention: "I call it my billion-dollar mistake." While very useful in some contexts, that feature also happens to cause a lot of bugs, with severe criticity in some cases. The Rust language has for example (almost) removed the null pointer concept and replace it with optional references, where the compiler enforces that the code explictly checks for the validity of the reference before using it. At the minute, I'm writing this, I'm debating about that very issue with a colleague.
The geospatial field is not free of concepts that are a never-ending source of troubles, and I will come with my own list, with my perspective of software developer.
- Geometry model. Point, lines, polygons. What could be most simple than that? Well, the commonly-used OGC Simple Features model allows those objects to be empty. How is that useful in practice? Hard to tell: NULL geometries are (somewhat paradoxically given the above paragraphy) actually a better replacement. My own perception of that "feature" is that it is mostly a huge headache that goes into your way when trying to write robust code. One evidence of that is that the same standard that invented it neglected to specify how to export an empty point in the Well Known Binary representation. Over the years, the tradition has become to use the Not-A-Number value for the X and Y value of an empty point. Which by itself may cause interesting consequences for applications that would neglect to make a special case. A Not-A-Number is ... well ... not a number, and for example it is not equal to itself ... (and in the IEEE-754 representation, there are litteraly billions of different binary potential encodings of a NotANumber). Everything you learnt at school in your math courses will break with it (this is actually quite general when crunching numbers with computers. Finite precision break a lot of the expected properties of ideal numbers). An empty line has the undesirable property of not having a start or end point: any algorithm must be ready for that. Another annoyance is that there is not just one "geometry empty" object, but a "point empty", a "line empty", a "polygon empty", etc. What is the expected intersection of an empty line with an empty polygon ? An empty line, an empty polygon, an empty point, ... ? The developers of the GEOS library or the PostGIS spatial extension have unfortunately to regularly debate at length about those topics. One can but think there would be a better use of their expertise and time than having to deal with such esoteric subjects (I didn't ask them, so they may actually be thrilled by them. You never know...)
- Coordinate reference system (CRS) axis order. CRS, such as WGS 84 geographic, or UTM 31N / ETRS89 have several axis. For geographic CRS, this will be the longitude, the latitude, and optionally the ellipsoidal height. When expressing coordinates in a CRS, one must decide in which order they are specified. They are lengthy debates whether this should be longitude first, latitude second, or the reverse. The ISO 19111 / OGC Abstract Topic 2 specification or geodetic registries have decided to not take a firm stance on that, and have allowed authorities responsible for CRS definition and maintenance, to submit CRS definitions with the axis order they wish. Excellent! Well no. The issue is that while non-geomaticians user may chose to express a coordinate in prose like "50 degree of latitude north, 15 degree of longitude east", or "15 degree of longitude east, 50 degree of latitude north", that doesn't mean it is a good idea that the software systems reflect that liberty of speech. Some GIS formats have no way of clearly expressing the CRS, or if they have, they might use an incomplete way of specifying it, in particular lacking the way to express the axis order. The usual practice is to generally specify the longitude as the first value (as corresponding to the X/horizontal axis of a Cartesian plan) and latitude next (Y/vertical axis), refleting the natural mapping to make a graphical representation. Other formats (GML in particular) require that the coordinates are expressed in the order of the CRS definition, which require access to a database to get the axis order, given that in GML vector files, the CRS is only referenced through a code, and not defined inline. Depending on whether the persons responsible to design the protocol/file format, the order may be the "GIS friendly one" (longitude-latitude), or the "CRS pedantic one" (latitude-longitude for example for geographic CRS defined by the EPSG geodetic registry). This is an eternal source of confusion. Sometimes with absurd situations. The OGC GeoPackage file format captures a full definition of the CRS used in the vector tables it contains, including in particular the official axis order, but to reflect the long-GIS tradition, as an amendment, specify that the encoding of coordinates in its (extension of) the WKB format mentionned in the previous paragraph should be longitude-latitude (for geographic CRS) or easting-northing (for projected CRS). I will not blame anyone particular for this. This is an "overall system error". In the ideal situation, a courageous geomatician in a standard organization or in a geodetic registry should have said "here, we are geomaticians: geographic CRS are always longitude-latitude, and projected CRS are always easting-northing. It is your responsibility as users of our system to provide data always in that order". Failing to have access to a time-travel machine to warn in advance my glorious predecessors about the incoming catastrophe, the only solution I see to solve the issue it is to ask all population to relocate on the line of longitude=latitude, and exclude any mapping outside of it.
- Raster cell registration issues, a.k.a pixel-centre versus pixel-corner, or pixel-is-point versus pixel-is-area, a.k.a the half-pixel shift error. A raster cell is both an entity you reference with a (column, line) integer pair, so perceived as a discrete point, but when displayed, it actually occupies a non-zero area on your display device. When that raster cell is registered against geospatial coordinates, one debate is: "what exact place in that cell does this (longitude, latitude) or (easting, northing) refer to? Is that the center of the pixel, or maybe its top-left corner?" . Obviously, whenever there is a choice, file format and service specifications never agree together. The GDAL software has courgeously decided to "standardize" its internal model to the convention where that the georeferenced coordinate associated to a pixel qualifies the location of the top-left corner. GDAL format drivers do the necessary dance of applying and de-applying a half-pixel shift to go into that convention ... when they have access to the convention of the underlying format.
A temptative conclusion could be that any proposed standard or specification should go to the step of having an actual real-world implementation of it, not just a "working prototype" ("toy implementation" more casually), to check whether some apparently minor details are not a major source of inconvenience.
-
0:33
GeoTools Team: GeoTools 32.0 released
sur Planet OSGeoGeoTools 32.0 released The GeoTools team is pleased to announce the release of the latest stable version of GeoTools 32.0: geotools-32.0-bin.zip geotools-32.0-doc.zip geotools-32.0-userguide.zip geotools-32.0-project.zip This release is also available from the OSGeo Maven Repository and is made in conjunction with GeoServer 2.26.0 and GeoWebCache 1.26.0 -
16:00
Fernando Quadro: Como ganhar dinheiro com o código aberto?
sur Planet OSGeoDe tempos em tempos as pessoas costumam me fazer essa pergunta. A resposta curta é que ser código aberto não significa que tudo é de graça – você geralmente precisa de especialistas na área para ajudá-lo.
Por exemplo, GeoServer, QGIS e PostGIS você pode baixá-los, instalá-los e usá-los de graça. Claro. Mas sua empresa provavelmente ainda precisará pagar por:
Qualquer nova funcionalidade que você queira implementar no software principal, especialmente se for bem específica ou de nicho para apenas uma pequena parte da base de usuários
Consertar um bug crítico no código que afeta seu fluxo de trabalho de forma rápida (especialmente se afetar apenas uma parte muito pequena da base de usuários)
Criar uma extensão/módulo/plugin que simplificaria algumas das tarefas específicas para sua organização
Obter SLA (Acordo de Nível de Serviço), para que suas dúvidas/problemas com o software possam ser discutidos/resolvidos com prioridade e não bloqueiem seu trabalho
Treinar sua equipe com os principais especialistas da área
Migrar de soluções proprietárias para o ecossistema de código aberto, já que é preciso muito conhecimento para unir todos os componentes de código aberto para que funcionem bemO bom do código aberto é que se empresas ou usuários apoiam financeiramente o projeto, todas as novas funcionalidades, correções e melhorias (como documentação) chegam a todos.
Então, se sua empresa quer ajudar um projeto de código aberto a crescer, uma ótima ideia é patrociná-lo. E se você estiver procurando por um desenvolvimento personalizado de WebGIS, treinamento, migração ou suporte em torno disso, você pode entrar em contato com a Geocursos. É isso que fazemos desde 2012

-
13:00
Mappery: Wine map in a Tapas bar
sur Planet OSGeoPièce jointe: [télécharger]
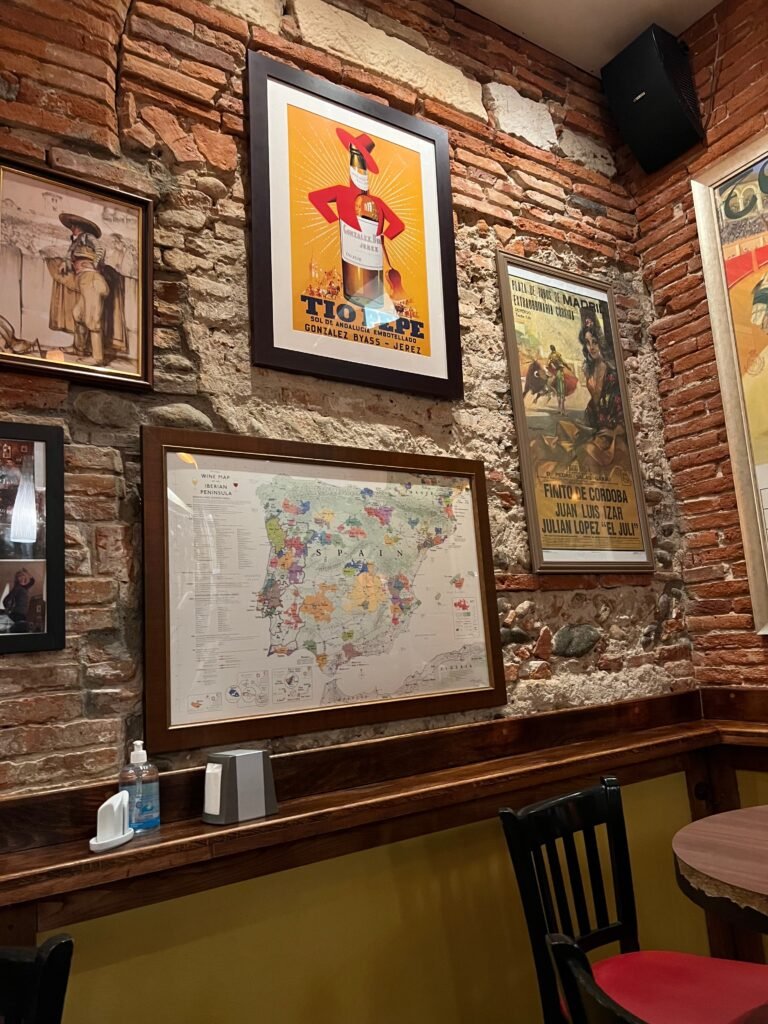
I found this map of Spain showing the various wines per region in a tapas bar in Toulouse, France
-
4:00
PostGIS Development: PostGIS 3.5.0
sur Planet OSGeoThe PostGIS Team is pleased to release PostGIS 3.5.0! Best Served with PostgreSQL 17 RC1 and GEOS 3.13.0.
This version requires PostgreSQL 12 - 17, GEOS 3.8 or higher, and Proj 6.1+. To take advantage of all features, GEOS 3.12+ is needed. SFCGAL 1.4+ is needed to enable postgis_sfcgal support. To take advantage of all SFCGAL features, SFCGAL 1.5 is needed.
3.5.0-
Cheat Sheets:
This release is a feature release that includes bug fixes since PostGIS 3.4.3, new features, and a few breaking changes.
-
16:00
Fernando Quadro: 4 dicas para melhorar sua aplicação GIS Mobile
sur Planet OSGeoA demanda por soluções geoespaciais acessíveis e em movimento está maior do que nunca. Como uma empresa de desenvolvimento de software que atende ao setor de GIS, você precisa entender a importância de fornecer aplicativos amigáveis ??para dispositivos móveis que atendam às necessidades de seus clientes.
Você precisa criar soluções inovadoras e amigáveis ??que capacitem os profissionais a acessar e utilizar dados espaciais a qualquer hora, em qualquer lugar.
Alguns recursos principais de seus aplicativos GIS móveis devem incluir:Recursos offline: Projete seus aplicativos para funcionar perfeitamente, mesmo em áreas com conectividade limitada à Internet, garantindo acesso ininterrupto a dados geoespaciais críticos.Coleta de dados em tempo real: Os usuários devem ser capazes de capturar e atualizar informações espaciais em movimento, agilizando as operações de campo e melhorando a precisão dos dados.Interfaces intuitivas: Priorize interfaces de usuário intuitivas e responsivas, facilitando a navegação e a interação dos profissionais com dados geoespaciais em seus dispositivos móveis.Integração perfeita: Você deve ser capaz de integrar aplicativos GIS móveis com plataformas GIS existentes de desktop e baseadas em nuvem, garantindo um fluxo de trabalho coeso e eficiente.Ao aproveitar o poder da tecnologia móvel, seus clientes podem aumentar sua produtividade, tomar decisões mais bem informadas e fornecer serviços superiores aos seus usuários finais.
Fonte: webgis.tech
Instagram: [https:]]
LinkedIn: [https:]] -
13:00
Mappery: Atlas in Potsdam
sur Planet OSGeoPièce jointe: [télécharger]

Reinder sent this pic of Atlas holding up the world from the roof of the Alte Rathaus at the Alte Markt, Potsdam, Germany (he wasn’t actually on the roof but you know what I mean)
-
16:00
Fernando Quadro: Como ser tornar um Desenvolvedor WebGIS?
sur Planet OSGeoSe você já se perguntou como se tornar um especialista em desenvolvimento WebGIS, este roteiro o guiará passo a passo pelas ferramentas e habilidades essenciais:
Fundamentos do WebGIS: Aprenda a arquitetura e os termos chave. Desenvolvimento do lado do cliente (front-end): domine JavaScript, HTML/CSS e estruturas de UI (User Interface) como Bootstrap, por exemplo. Bibliotecas WebGIS: use o poderoso OpenLayers, Leaflet, Turf.js e muito mais e crie seu projeto. Domínio do lado do servidor (back-end): Aprenda Python, PostGIS, Django, GeoServer e obtenha a experiência que faz com que as empresas de GIS precisem de você. Crescimento na carreira: procure oportunidades para desenvolvedor WebGIS no mercado, mas enquanto ela não aparece, você pode começar como freelancer ou criar seu próprio WebGIS para ir adquirindo experiência!E ai, o que você está esperando?
Fonte: webgis.tech
Instagram: [https:]]
LinkedIn: [https:]] -
13:00
Mappery: Afghan Carpet
sur Planet OSGeoPièce jointe: [télécharger]

Raymond pointed out that the Afghani restaurant we featured a few weeks ago also had this carpet map on the wall and this one is slightly different to this carpet map
-
12:12
GRASS GIS: Growing GRASS GIS with NSF Support: Progress and Next Steps
sur Planet OSGeoIn 2023, our team of researchers from four U.S. universities announced a two-year project with support from an NSF grant (award 2303651). This project aims to modernize and expand the GRASS GIS platform, strengthen its role as a key geospatial processing engine, and build a diverse, vibrant global community of users and developers. We are excited to share the progress we have made so far toward these goals in the first half of the project. -
10:00
From GIS to Remote Sensing: Random Forest Classification of Sentinel-2 image in Python using Remotior Sensus
sur Planet OSGeoThis video tutorial illustrates how to perform Random Forest classification of a Copernicus Sentinel-2 image using Remotior Sensus, a Python package that allows for the processing of remote sensing images and GIS data.The tutorial is available as Jupyter notebook in Google Colab, a free service by Google that allows for executing a Jupyter notebook in the cloud. Following the video of this tutorial.
Read more » -
4:00
Paul Ramsey: Cancer 11
sur Planet OSGeoBack to entry 1
What happened there, I didn’t write for three months! Two words: “complications”, and “recovery”.
In a terrifying medical specialty like cancer treatment, one of the painful ironies is that patients spend a lot of time recovering from complications and side effects of the treatments, rather than the cancer. In my case and many others, the existence of the cancer isn’t even noticable without fancy diagnostic machines. The treatments on the other hand… those are very noticable!

A lot of this comes with the territory of major surgery and dangerous chemicals. My surgery included specific possible complications including, but not limited to: incontinence, sexual disfunction, urinary disfunction, and sepsis.
Fortunately, I avoided all the complications specific to my surgery. What I did not avoid was a surprisingly common complication of spending some time in a hospital while taking broad spectrum antibiotics–I contracted the “superbug” clostridioides difficile, aka c.diff.
Let me tell you, finding you have a “superbug” is a real bummer, and c.diff lives up to its reputation. Like cancer, it is hard to kill, it does quite a bit of damage while it’s in you, and the things that kill it also do a lot of damage to your body.

Killing my c.diff required a couple of courses of specialized antibiotics (vancomycin), that in addition to killing the c.diff also killed all the other beneficial bacteria in my lower intestine.
So, two months after surgery, I was recovering from:
- having my lower intestine handled and sliced in a major surgery
- having that same intestine populated with c.diff and covered in c.diff toxins
- having the microbiotic population living in my intestine nuked with a modern antibiotic developed to kill resistant superbugs
Not surprisingly, having all those things at once makes for a much longer recovery, and a pretty up-and-down one. My slowly recovering microbiota is in constant flux, which results in some really surprising symptoms.
- highly variable stomach discomfort (ok)
- highly variable appetite (makes sense)
- random days of fatigue (really?)
- random days of anxiety (what?!?)
I had not really understood the implications of gut/brain connection, until this journey showed me just how tightly bound my mental state was to the current condition of my guts. The anxiety I have experienced as a result of my c.diff exposure has been worse, amazingly, than what I felt after my initial cancer diagnosis. One was in my head, but the other was in my gut.

I have also developed a much more acute sympathy for people suffering from long Covid and other chronic diseases. The actual symptoms are bad enough, but the psychological effect of the symptom variability is really hard to deal with. Bad days follow good days, with no warning. I have mostly stopped voicing any optimism about my condition, because who knows what tomorrow will bring.
When people ask me how I’m doing, I shrug.
One thing I have got going for me, that chronic disease sufferers do not, is a sense that I am in fact improving. I started journaling my symptoms early in the recovery process, and I can look back and see definitively that while things are unpredictable day to day, or even week to week, the long term trajectory is one of improvement.
Without that, I think I’d go loopy.
Anyways, I am now rougly three months out from my last course of antibiotics, and I expect it will be at least another three months before I’m firing on all cylinders again, thanks mostly to the surgical complication of acquiring c.diff. If I was just recovering from the surgery, I imagine I would be much closer to full recovery.

-
4:00
GeoServer Team: Using Spatial Operators in GeoServer Filters
sur Planet OSGeoGeoSpatial Techno is a startup focused on geospatial information that is providing e-learning courses to enhance the knowledge of geospatial information users, students, and other startups. The main approach of this startup is providing quality, valid specialized training in the field of geospatial information.
( YouTube | LinkedIn | Facebook | X )
Spatial Operators in GeoServer FiltersIn this session, we want to talk about the Spatial operators in GeoServer in detail. If you want to access the complete tutorial, click on the link.
Introduction
GeoServer supports various spatial operators that filter geospatial data based on their location or spatial relationships with other features. These operators are commonly used with other filter expressions to create complex queries. These queries are useful for extracting specific subsets of data from a larger dataset.
The spatial operators are Topological, Distance, and Bounding Box operators. We’ll explain them in more detail below.
Note. This video was recorded on GeoServer 2.22.4, which is not the most up-to-date version. Currently, versions 2.24.x and 2.25.x are supported. To ensure you have the latest release, please visit this link and avoid using older versions of GeoServer.
Topological operatorsIn GeoServer, topological operators are used for spatial analysis and processing of geographic data. These operators perform geometric operations that preserve the spatial relationship or topology between geometric features. Some common topological operators in GeoServer include: Intersects, Within, Contains, etc.
IntersectsThe Intersects filter in GeoServer is used to query spatial data based on the intersection of two geometry objects. For example, you can use this operator to extract all features that intersect with a specified Point, Line, or Polygon.
Here are some examples of how you can use this filter in an XML request to filter the
Stateslayer by theState_Nameattribute:- Navigate to the Demos page, then select Demo requests.
- From the Request section, select the WFS_getFeatureIntersects1.0.xml request.
- The address will be filled in automatically, in the URL section.
- Now, we will explain some elements:
- The first thirteen lines include explanations in the form of comments.
- Line 14 describes the XML version and the
getFeatureIntersectsoperation of the WFS service being used. - Line 15 specifies the default output format for the WFS service as
GML2. Additionally, GeoServer supports several other commonly used formats such as “gml3, shapefile, geojson, and csv.” - Lines 16 to 22 define the start of the XML request and declare the namespaces used in the request.
- Line 23 specifies the type name of the feature to be queried. In this case, it requests features of the
topp:states. - Lines 25 to 30 define the filter criteria for the query. On these lines, we use the Intersects filter, to retrieve all states that intersects with a Point defined by latitude and longitude.
- Press the Submit button.
Note. For GeoServer 2.25.2 the Demo Request page has been improved to show response Headers, and provide the option to pretty print XML output.
WithinThis operator is used to retrieve features that are completely within the specified geometry. For example, you can use this operator to extract all features that are within a polygon.
Here’s an example of how you can define a
Withinfilter in XML. As an example of using this filter in a WFS getFeature request, use the following block codes to replace lines 24 to 31:<Filter> <Within> <PropertyName>the_geom</PropertyName> <gml:Polygon xmlns:gml="http://www.opengis.net/gml" srsName="EPSG:4326"> <gml:outerBoundaryIs> <gml:LinearRing> <gml:coordinates>-90.73,29.85 -90.73,35.92 -80.76,35.92 -80.76,29.85 -90.73,29.85</gml:coordinates> </gml:LinearRing> </gml:outerBoundaryIs> </gml:Polygon> </Within> </Filter>Press the Submit button. As you can see, the result includes two states named
ContainsAlabamaandGeorgia.This operator is used to filter data that is completely contained within a given geometry. For example, you can use this operator to extract all features that are completely contained within a polygon that represents a state boundary.
Here’s an example of how you can define a
Containsoperator in XML:<Filter> <Contains> <PropertyName>the_geom</PropertyName> <gml:LineString srsName="EPSG:4326"> <gml:coordinates>-89.35,31.46 -89.35,32.11 -89.49,32.23 -90.21,32.23</gml:coordinates> </gml:LineString> </Contains> </Filter>Press the Submit button. As you can see, the state that contains the given geometry is
Mississippi.You will need to adjust the filter and shape to match your data and SRS. Assuming you have a data source with a geometry column named the_geom that uses the EPSG:4326 coordinate system.
Distance operatorsIn GeoServer, Distance operators like “DWithin” and “Beyond” filters, are used to filter and retrieve features based on their spatial relationship and proximity to a given geometry or location. These operators can be used in WFS requests and are useful for performing spatial analysis and finding nearby features.
DWithinThe ‘DWithin’ or ‘Distance Within’ filter, will return records that are located within a specific distance of a defined point, much like a buffer. As well as the point geometry, you must specify the value of the distance from this point and the unit of measure. The units for the DWithin are: Feet, meters, kilometers and miles.
Here’s an example of how to use the
DWithinfilter in a GeoServer XML configuration file. To find all the features that are within10000meters of a given point in a layer called “sf:archsites”, the following WFS request can be used.<wfs:GetFeature service="WFS" version="1.0.0" outputFormat="application/json" xmlns:wfs="http://www.opengis.net/wfs" xmlns:ogc="http://www.opengis.net/ogc" xmlns:gml="http://www.opengis.net/gml" xmlns:xsi="http://www.w3.org/2001/XMLSchema-instance" xsi:schemaLocation="http://www.opengis.net/wfs [schemas.opengis.net] <wfs:Query typeName="sf:archsites"> <ogc:Filter> <ogc:DWithin> <ogc:PropertyName>the_geom</ogc:PropertyName> <gml:Point srsName="http://www.opengis.net/gml/srs/epsg.xml#26713"> <gml:coordinates>593250,4923867</gml:coordinates> </gml:Point> <ogc:Distance units="meter">10000</ogc:Distance> </ogc:DWithin> </ogc:Filter> </wfs:Query> </wfs:GetFeature>This will return all the features in “sf:archsites” layer, that are within 10000 meters of the given point. Remember that, the EPSG code mentioned in line 11 is very important because it serves as a reference point for importing coordinates and distance values.
Press the Submit button.
Bounding Box operatorsThe Bounding Box operator is used to filter data based on a specified bounding box. A bounding box is a rectangular region defined by its lower left and upper right coordinates: minx, miny, maxx, and maxy. For example, you can use this operator to extract all features that are located or partially located inside a box of coordinates.
As an example of using this operator, select the WFS_getFeatureBBOX1.0.xml from the Request section. Now the filters block code is as follows:
<Filter>
  <BBOX>
    <PropertyName>the_geom</PropertyName>
    <gml:Box srsName="http://www.opengis.net/gml/srs/epsg.xml#4326">
       <gml:coordinates>-75.102613,40.212597 -72.361859,41.512517</gml:coordinates>
    </gml:Box>
  </BBOX>
</Filter>
In this case, we just get the
STATE_NAMEandPERSONSattribute. Using the range specified in the code specifies the features that are completely or partially located in this area. The result includes four states namedNew York,Pennsylvania,Connecticut, andNew Jerseyas you see on the screen.In this session, we took a brief journey through the “Spatial operators in GeoServer”. If you want to access the complete tutorial, click on the link.
-
13:00
Mappery: Jo Spier
sur Planet OSGeoPièce jointe: [télécharger]

A cartographic book cover by Jo Spier (1900-1978) spotted by Reinder – exquisite.
-
13:00
Mappery: Oh, Toulouse!
sur Planet OSGeoPièce jointe: [télécharger]

Exploring the heart of Toulouse, France, a city steeped in history and culture. This tiny map highlights some of the must-see spots in the city center:
- Capitole: The grand city hall and opera house.
- Place du Capitole: A bustling square with cafes, shops, and street performers.
- Saint-Sernin Basilica: A UNESCO World Heritage Site known for its Romanesque architecture and impressive cloister.
-
18:34
Free and Open Source GIS Ramblings: Trajectools tutorial: trajectory preprocessing
sur Planet OSGeo
Today marks the release of Trajectools 2.3 which brings a new set of algorithms, including trajectory generalizing, cleaning, and smoothing.
To give you a quick impression of what some of these algorithms would be useful for, this post introduces a trajectory preprocessing workflow that is quite general-purpose and can be adapted to many different datasets.
We start out with the Geolife sample dataset which you can find in the Trajectools plugin directory’s sample_data subdirectory. This small dataset includes 5908 points forming 5 trajectories, based on the trajectory_id field:

We first split our trajectories by observation gaps to ensure that there are no large gaps in our trajectories. Let’s make at cut at 15 minutes:

This splits the original 5 trajectories into 11 trajectories:

When we zoom, for example, to the two trajectories in the north western corner, we can see that the trajectories are pretty noisy and there’s even a spike / outlier at the western end:

If we label the points with the corresponding speeds, we can see how unrealistic they are: over 300 km/h!

Let’s remove outliers over 50 km/h:

Better but not perfect:

Let’s smooth the trajectories to get rid of more of the jittering.
(You’ll need to pip/mamba install the optional stonesoup library to get access to this algorithm.)

Depending on the noise values we chose, we get more or less smoothing:

Let’s zoom out to see the whole trajectory again:

Feel free to pan around and check how our preprocessing affected the other trajectories, for example:


-
13:00
Mappery: Eugeniusz Romer
sur Planet OSGeoPièce jointe: [télécharger]

This came from Reinder
Portrait of Eugeniusz Romer
It hangs above the desk of the director of the Institute of Geography and Regional Development at the University of Wroclaw. It shows the eminent geographer and cartographer depicted against the background of a planiglobium map.Romer, (1871-1954) was the founder of modern Polish cartography and co-founder of the Ksiaznica-Atlas publishing house in Lwow, one of the most important Polish publishing houses in the interwar period. It was a house publishing textbooks and teaching aids for teachers and students, cartographic publications, children’s and young adult literature, and encyclopaedias. After the Second World War, the publishing house resumed its activities in Wroctaw, where many atlases of Poland and the world were published under Romer’s editorship.
-
13:00
Mappery: Seated on the Helsinki Tram Network
sur Planet OSGeoPièce jointe: [télécharger]

Maarten Pullen sent me this. “Helsinki has a fair number of tram lines in its city center. A great way of doing sightseeing when you’re tired of walking. The seats in the tram also have a network map.”
-
3:00
Nick Bearman: New Website - Quarto
sur Planet OSGeoI’ve been thinking for a bit of time that I need to redo my website as some of the pages had evolved a bit, and were getting a bit too long. What you see now is what I have come up with:

I also took the opportunity to ‘rebrand’ myself. Previously I’d used the name Geospatial Training Solutions to market my freelance work. I was never completely happy with the name - it was a bit long and a bit generic - and after some thought I decided I would be better trading under my own name - Nick Bearman - as that is a name already known in the GIS community and it is me that I am selling. I am freelance and have no current plans to expand or to hire other people - I am just me!
Anyway, once I’d made that decision, the question was how to make my new website. I’ve been using WordPress which worked reasonably well, but it has a relatively complex infrastructure under the hood (database, etc.) which:
opens it up to more vulnerabilities and
upgrading WordPress was always something that needed to be done every so often, and then I had to make sure everything worked as I wanted.
I looked around and found various examples that were similar to what I wanted to achieve:
- Kate Berg / Pokateo [https:]] Wix
- James Cheshire [https:]] WordPress
- Mike Spencer [https:]] Start Bootstrap - Agency (using Respond.js)
- Alessia Calafiore [https:]] Hydejack theme on Jekyll
- Caitlin Robinson [https:]] Wix
- Andy Kirk [https:]] WordPress
- Robin Wilson [https:]] Jekyll
I mostly used these to think about content, but it was also helpful to consider the different technologies as well. More people were using WordPress that I thought, and often they were not ‘obviously’ WordPress sites. I wanted something simple, and certainly something I could update easily. Easy of updating was a common theme! To quote Pokateo / Kate:
From [https:]]
At this point, Quarto had been released and they had some interesting possibilities for websites. I’d dabbled a bit with Quarto for PDF documents and websites (including A geographer’s introduction to QGIS & R) after using RMarkdown for several years. Quarto looked ideal, so I started experimenting with it. It is plain text, and can work with GitHub, which I am using fairly regularly.
Quarto also has a very good website, with lots of examples including creating a website [https:]] and you can also choose from a variety of different themes [https:]] .
After various rounds of development, I came up with this site, [https:] It is (I hope) a simple site which has what I need on it. It also supports blogs, which I do contribute to semi-regularly. It is also all static pages, so once it is updated it can just sit there and doesn’t need any database provision or anything else to run. The new site also incorporated a search, which is handy.
You can host it through GitHub Pages, and there are various options to automatically compile it using continuous integration, but I decided to keep things simple, to compile the site locally and the push to GitHub. Sometimes the potential to automate things isn’t worth the time to set it up!
from [https:]] CC license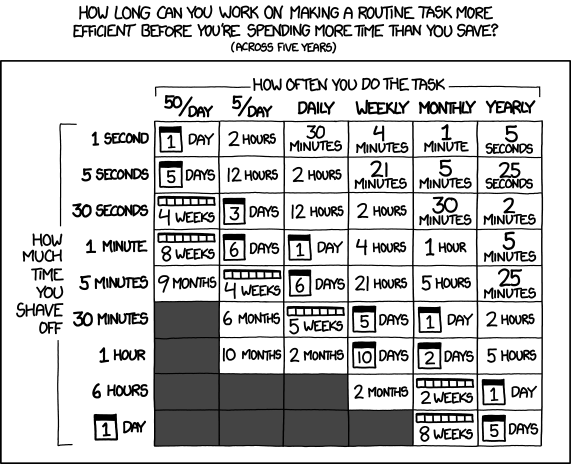
Transferring my blog posts from WordPress (geospatialtrainingsolutions.co.uk and nickbearman.me.uk) was a bit of a faff but it is getting there. It is a work in progress. I have found a semi-automated">[https%3A%2F%2Fgithub,folder%20in%20your%20quarto%20blog">semi-automated] way of doing this, but it will still take some time. I’m also trying to extract a static copy of the WordPress sites for archiving, with the Simpy Static WordPress plugin looking useful.
I also used to have a contact form, which I received some useful contacts through so I wanted to include this. Quarto as such doesn’t include such a form, as there is no interaction, but I had a brainwave and decided to use a Google Forms instead. We’ve used these a lot at OSGeo:UK and they work really well.
I hope you found this useful - do let me know what you think!
And if you want to learn more about GIS, checkout my new Training Courses page and if you want a bespoke course, make use of my new Contact Form!


-
17:00
OGC Membership approves OGC API – Maps – Part 1: Core as an official OGC Standard
sur Open Geospatial Consortium (OGC)The Open Geospatial Consortium (OGC) Membership has approved OGC API – Maps – Part 1: Core as an official OGC Standard.
The OGC API – Maps – Part 1: Core Standard defines a web interface for portraying geographic information. One of the main benefits of this Standard is the ability to generate maps by combining data from one or more servers into a single view, ensuring fast and efficient cartographic portrayal.
Additional features include options for retrieving data layers within specific areas of interest (AOIs) as well as specifying transparency, styles, scales, and device display settings. The Standard also provides the ability to specify map orientation and supports multiple Coordinate Reference Systems (CRS).
The OGC API – Maps – Part 1: Core Standard is designed as a modern, API-based alternative to the Web Map Service (WMS) and Web Map Tile Service (WMTS) Standards. It can be integrated with the OGC API – Tiles – Part 1: Core Standard to support more advanced capabilities.
To help developers quickly implement products that support this standard, example API definitions and schemas are available on the OGC API – Maps webpage. These resources conform to OpenAPI Specification v3.0, making them easy to integrate into various Web APIs.
OGC API – Maps – Part 1: Core is the outcome of the work and dedication of the OGC API – Maps Standards Working Group. Development of the Standard was led by:
- Editors:
- Joan Masó, Universitat Autònoma de Barcelona (CREAF)
- Jérôme Jacovella-St-Louis, Ecere Corporation
- Submitters:
- Jeff Harrison, US Army Geospatial Center (AGC)
- Satish Sankaran, Esri
As with any OGC standard, the OGC API – Maps – Part 1: Core Standard is free to download and implement. Interested parties can learn more on the OGC API – Maps Standard webpage.
The post OGC Membership approves OGC API – Maps – Part 1: Core as an official OGC Standard appeared first on Open Geospatial Consortium.
- Editors:
-
13:00
Mappery: Archimedes
sur Planet OSGeoPièce jointe: [télécharger]

Reinder sent this from his visit to Warsaw
“… in the beautifully 18th C. baroque decorated main hall, Aula Leopoldina, in the University Museum in Wroc?aw, Poland. “
-
22:59
pycsw Team: Using keywords from a thesaurus as queryables
sur Planet OSGeoUsing keywords from a thesaurus as queryablesA common convention in catalogues is the use of keywords from a dedicated thesaurus. The assignment of these keywords can then later be used to filter or query the catalogue by these terms. To achieve this use case in pycsw, some configuration needs to be tailored. This blog post indicates the changes needed for this scenario.
For this example we’ll use a keyword from the INSPIRE Themes thesaurus. We will define a new queryable
inspiretheme, which will be populated with the relevant keyword (if present).You can repeat these steps for any other thesaurus.
Extra database columnExtend the records table in the database with an extra field for the selected thesaurus. This is usually a manual operation on the database.
Add parameter to pycswALTER TABLE records ADD inspiretheme VARCHAR(255);In
pycsw/core/config.pythe newly created database column can be registered to pycsw.
Add column to mapping'pycsw:InspireTheme': 'inspiretheme',etc/mappings.pylinks the pycsw parameter to the columnname in the table.
Define parameter as queryable'pycsw:InspireTheme': 'inspiretheme',Which of the parameters are queryable is defined in
pycsw/core/repository.py.
Add parameter to record results?'inspiretheme': self.dataset.inspiretheme,Keywords are already published in records, so there is generally no need to extend the record with the new parameter. If needed you can do so in
Populate the parameter from record importspycsw/ogc/api/records.py(Line 1150).We have 2 options here, either manage the population of the column within the database as part of an insert trigger on the
record.themesfield. Alternatively updatepycsw/core/metadata.pyso the column is populated when records are imported.For the second option consider the following code. For each of the keyword blocks, it tries to match the thesaurus title or uri and, if matched, adds the keywords to the new parameter.
Add parameter to OGC API - Records facets_set(context, recobj, 'pycsw:InspireTheme', ", ".join( [", ".join(k.name for k in t.keywords if k.name not in [None,'']) for t in md_identification.keywords if ( hasattr(t,'thesaurus') and t.thesaurus not in [None,''] and (( 'title' in t.thesaurus and t.thesaurus['title'] not in [None,''] and t.thesaurus['title'] in ['GEMET - INSPIRE themes, version 1.0','GEMET Themes, version 2.3'] ) or ( 'uri' in t.thesaurus and t.thesaurus['uri'] not in [None,''] and t.thesaurus['uri'] == 'http://inspire.ec.europa.eu/theme')))]))Facets enable to further limit search results. Keywords from thesauri are very useful to add as facet. Add the paremeter to
default.yml.facets: - type - inspiretheme
-
17:00
OGC Membership approves OGC API – Features – Part 3: Filtering as an official OGC Standard
sur Open Geospatial Consortium (OGC)The Open Geospatial Consortium (OGC) Membership has approved OGC API – Features – Part 3: Filtering as an official OGC Standard.
OGC API – Features defines a web interface for creating, modifying, and querying feature data. Part three of this standard is focused on defining query parameters and the Queryables resource, allowing users to specify filter criteria in API requests.
OGC API – Features – Part 3: Filtering extends the ability to extract data subsets that meet specific criteria beyond bounding boxes or date and time attributes. This enhanced query functionality is specified using the Common Query Language (CQL2) – a recently approved OGC Standard.
Part 3 is designed to extend and interoperate with other parts of the OGC API – Features Standard. It builds on Part 1, which defines basic server behavior and is compatible with Part 2, which extends support for different Coordinate Reference Systems.
To help developers quickly implement products that support this standard, example API definitions and schemas are available on the OGC API – Features webpage. These resources conform to the OpenAPI Specification v3.0, making them easy to integrate into various Web APIs.
OGC API – Features – Part 3: Filtering is the outcome of the work and dedication of the OGC API – Features Standards Working Group. Development of the standard was led by:
- Editors:
- Panagiotis (Peter) A. Vretanos, CubeWerx Inc.
- Clemens Portele, interactive instruments GmbH
- Submitters:
- Andrea Aime, GeoSolutions di Giannecchini Simone & C. s.a.s.
- Jeff Harrison, US Army Geospatial Center (AGC)
- Jérôme Jacovella-St-Louis, Ecere Corporation
As with any OGC Standard, the OGC API – Features – Part 3: Filtering Standard is free to download and implement. Interested parties can learn more on the OGC API – Features Standard webpage.
The post OGC Membership approves OGC API – Features – Part 3: Filtering as an official OGC Standard appeared first on Open Geospatial Consortium.
- Editors:
-
13:00
Mappery: North Quabbin Lager
sur Planet OSGeoPièce jointe: [télécharger]

Doug shared this can of North Quabbin Lager from the Honest Weight Brewing co. Nice spot.
In case you have never heard of North Quabbin, it is not a place in a Harry Potter novel, it’s halfway between Albany and Boston
-
4:00
GeoServer Team: GeoServer 2.26.0 Release
sur Planet OSGeoGeoServer 2.26.0 release is now available with downloads (bin, war, windows), along with docs and extensions.
This is a stable release of GeoServer recommended for production use. GeoServer 2.26.0 is made in conjunction with GeoTools 32.0, GeoWebCache 1.26.0, ImageIO-EXT 1.4.13, and JAI-EXT 1.1.27.
Thanks to Peter Smythe (AfriGIS) and Jody Garnett (GeoCat) for making this release and everyone who has helped out during this release cycle. Special thanks Andrea for helping with release announcement, and Torben for troubleshooting the build server and docker environment for this release.
Nightly build testing
This release cycle we asked our new user forum to test a nightly build, as we did not have capacity to make a release candidate.
Thanks to Daniel Calliess for responding during our public testing cycle. Daniel noted that he had to add
Security Considerations/geoserver/webresourcesto his proxy for the OpenLayers preview to function. This change is due to an ongoing effort to move all CSS and JS to external resources allowing Content Security Policy headers to be introduced.This release addresses security vulnerabilities and is a recommended upgrade for production systems.
- CVE-2024-34711 Improper ENTITY_RESOLUTION_ALLOWLIST URI validation in XML Processing (SSRF) (High 7.3)
- CVE-2024-35230: Welcome and About GeoServer pages communicate version and revision information (Moderate 5.3)
See project security policy for more information on how security vulnerabilities are managed.
- GEOS-11400 About Page Layout and display of build information
The binary distribution and the Windows installer now work with Java 17.
When using the war distribution with Tomcat and Java 17 double check the Server status page. If the Java Rendering Engine is listed as “Unknown”, double check the Running in Java 17 production considerations.

Thanks to Andrea Aime and everyone who worked on testing this in different environments.
- GEOS-11467 Update Marlin, make the bin package compatible with Java 17
The base image
tomcat:9.0.95-jdk17-temurin-jammyis now used - providing the latest Tomcat 9 and Java 17. The docker crew changed from usingubuntu:22.04with our own Tomcat install script earlier in the year.To try out GeoServer 2.26.0 with docker:
docker pull docker.osgeo.org/geoserver:2.26.0
docker run -it -p8080:8080 docker.osgeo.org/geoserver:2.26.0
Thanks to Nils Bühner (terrestris) and everyone who has contributed to the Docker build.
Search improvementA small but fun change for the layer preview - it is now easier to find just the layer you are looking for using quotes to isolate an individual word.

Thanks to Alessandro Ricchiuti for this work.
- GEOS-11351 Exact term search in the pages’ filters
Thanks to Natural Resources Canada for sponsoring an extensive set improvements for the MapML extension.

This update was carried out by a group of GeoSolutions devs, Andrea Aime, Daniele Romagnoli and Joseph Miller.
- GEOS-11322 MapML WMS Vector Representation include query filter
- GEOS-11324 MapML WMS Vector Representation Style Classes
- GEOS-11337 Support feature tiles in MapML
- GEOS-11349 MapML Use WMS Resource Consumption Limit to specify max image size
- GEOS-11461 Enable MapML Viewer output for WFS getFeature.
- GEOS-11486 Adding custom dimensions to MapML
- GEOS-11528 Update MapML viewer to latest release 0.14.0
- GEOS-11471 Remove Sharding configuration support from MapML
The Demo Request page has been rewritten to use JavaScript to issue POST examples. This provides a much better user experience:
- Show Result lists the response headers to be viewed along side the returned result (with an option for XML pretty printing).
- Show Result in a New Page is available to allow your browser to display the result.
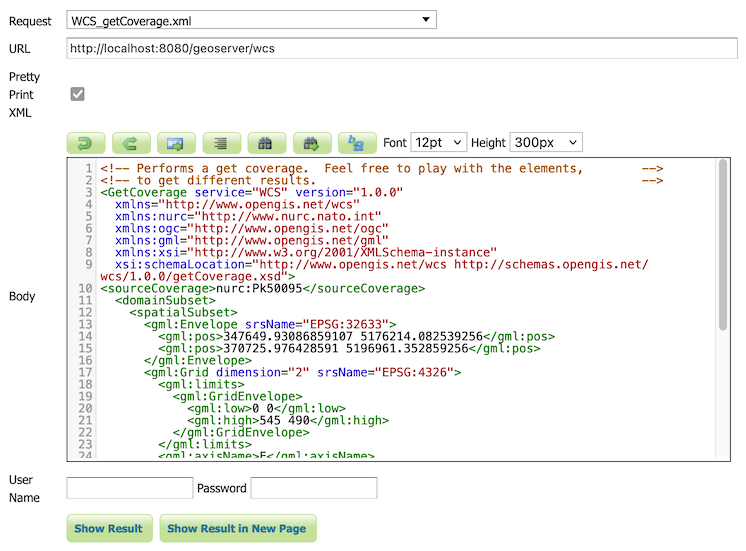
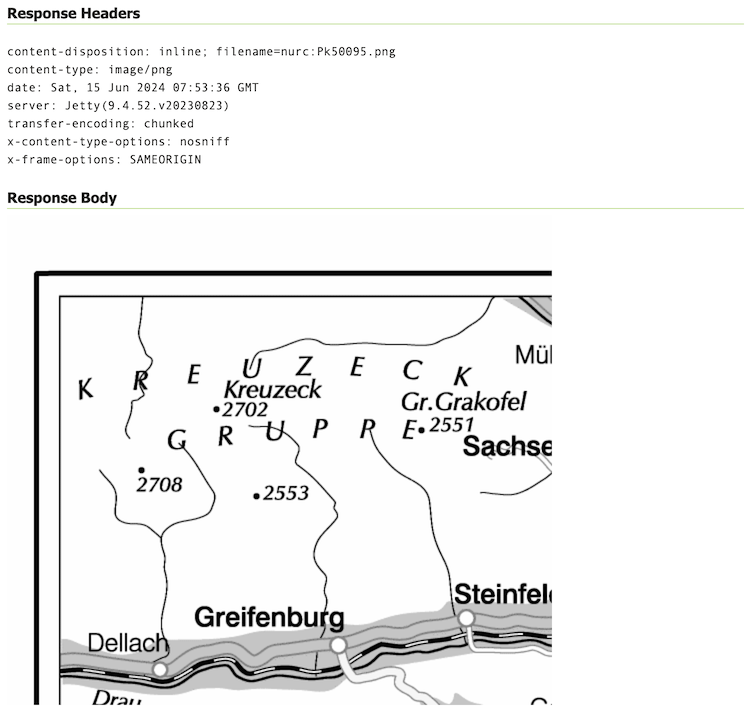
The WCS Request Builder and WPS Request Builder demos now have the option to show their results in Demo Requests page. Combined these changes replace the previous practice of using an iframe popup, and have allowed the TestWfsPost servlet to be removed.
For more information please see the Demo requests in the User Guide.
Thanks to David Blasby (GeoCat) for these improvements, made on behalf of the GeoCat Live project.
- GEOS-11390 Replace TestWfsPost with Javascript Demo Page
We are overjoyed to update to the latest JTS 1.20.0 release which includes a new implementation of spatial relationships.
Use
-Djts.relate=ngto try out the new implementation (replacingRelateOpwith theReleateNGnext generation implementation). Let us know how it goes, a future update will make this setting the default and expand the approach to “prepaired geometry” bulk operations used for WFS Queries.Thanks to Martin Davis (CrunchyDB) for the JTS improvements, and Jody Garnett (GeoCat) for the release and GeoServer update.
- GEOS-11532 Update to JTS 1.20.0
A new extension is available that takes advantage of the GDAL Raster Attribute Table (RAT). This data structure provides a way to associate attribute information for individual pixel values within the raster. This provides a table that links each cell value in the raster to one or more attributes on the fly.
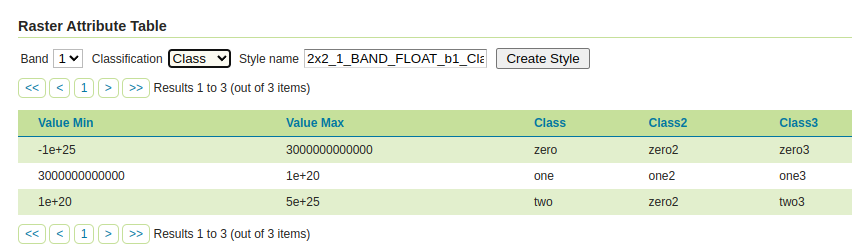
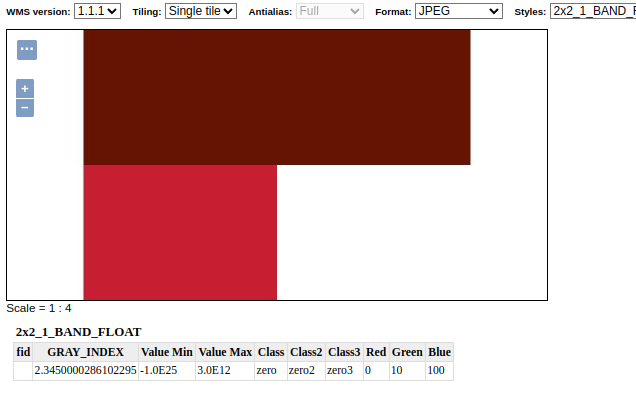
Thanks to Andrea Aime (GeoSolutions) for the development and NOAA for sponsoring this new capability. Please see the user guide Raster Attribute Table support for more information.
- GEOS-11376 Graduate Raster Attribute Table to extension
GeoCSS can now perform scale dependent rendering by the zoom level, assuming web mercator by default, but allowing the configuration of a different gridset as well. It’s also possible to create multi-layer styles and use them as style groups.
@mode 'Flat';
@TileMatrixSet 'WorldCRS84Quad'

tiger:poly_landmarks {

  /* @title parks and green spaces */
  [CFCC in ('D82', 'D32', 'D84', 'D85')] {
    fill: #B4DFB4;
    stroke: #88B588;
  };
  …
}

tiger:tiger_roads [@z > 12] {
  stroke: #666666, #FFFFFF;
  stroke-width: 6, 4;
  z-index: 1, 2;
  …
}

…
Thanks to Andrea Aime (GeoSolutions) for this work, performed in preparation for the FOSS4G-NA 2024 vector tiles workshop.
- GEOS-11495 Support multi-layer output in CSS
- GEOS-11515 Add support for zoom level rule filtering in CSS
- GEOS-11414 Adding css-uniqueRoleName
AUTO:97004has been introduced as a new vendor extension to WMS AUTO codes. It implements the geostastionary satellite project and allows to change the central meridian as part of the GetMap request.
Thanks to Andrea Aime (GeoSolutions) for this work, and Eumetsat for sponsoring it.
labelPoint function improvedThe
labelPointfunction has been improved with more precise calculation of the polygon label points, and not requiring to specify a tolerance any longer. This helps get better maps, especially with tiling enabled (fixed labelling point no matter which tile is requested):<sld:TextSymbolizer> <sld:Geometry> <ogc:Function name="labelPoint"> <ogc:PropertyName>the_geom</ogc:PropertyName> </ogc:Function> </sld:Geometry> </sld:TextSymbolizer>

Thanks to Andrea Aime (GeoSolutions) for this work, performed in preparation for the FOSS4G-NA 2024 vector tiles workshop.
Improved vector tiles generationA few new vendor options have been added in GeoServer, that control how vector tiles are built, with the objective of producing smaller, faster, more useful vector tiles.
vt-attributes: comma separated list of attributes included in the vector tilevt-labels: when true, generates a sidecar-labellayer for polygons, with the label point of the polygon (vector tile clients generally cannot produce a good label placement otherewise)vt-label-attributes:: attributes included in the label point layervt-coalesce: if true, takes all features in the tile sharing the same attribute values, and coalesces their geometries into a single multi-geometry.
Here is an example style using the above vendor options, in GeoCSS:
@mode "Flat";

tiger:poly_landmarks {
  fill: gray;
  vt-attributes: 'CFCC,LANAME';
  vt-labels: true;
}

tiger:tiger_roads [@z > 11] {
  stroke: black;
  vt-attributes: 'NAME';
  vt-coalesce: true;
}

tiger:poi [@z > 12] {
  mark: symbol(square);
}
The GWC layer preview has also been improved to show the vector tile feature attributes on hover:

Thanks to Andrea Aime (GeoSolutions) for this work, performed in preparation for the FOSS4G-NA 2024 vector tiles workshop.
GeoPackage QGIS Compatibility ImprovementsA number of issues affecting interoperability with QGIS have been addressed:
GeoPackage extension output could contain field types that are not supported by GDAL. It turns out the GeoPackage export was picking up some of the file type information intended for PostGIS resulting output that could not be read by other programs such as QGIS.
We were also able to fix up the TIMESTAMP information representation as DATETIME, making the file format timezone agnostic as intended.

Thanks to David Blasby (GeoCat) for these fixes made on behalf of Zeeland and South Holland.
- GEOS-11416 GeoPackage output contains invalid field types when exporting content from PostGIS
These two new image mosaic merge modes activate when multiple images overlap with each other, choosing respectively the minimum and maximum value amongst the super-imposed pixels.

Thanks to Andrea Aime for the work, and the US National Research Laboratory for sponsoring it.
Release notesNew Feature:
- GEOS-11322 MapML WMS Vector Representation include query filter
- GEOS-11324 MapML WMS Vector Representation Style Classes
- GEOS-11352 REST service for URL checks
- GEOS-11376 Graduate Raster Attribute Table to extension
- GEOS-11390 Replace TestWfsPost with Javascript Demo Page
- GEOS-11414 Adding css-uniqueRoleName
Improvement:
- GEOS-11271 Upgrade spring-security to 5.8
- GEOS-11325 Add properties to set additional security headers
- GEOS-11337 Support feature tiles in MapML
- GEOS-11338 CapabilityUtil SearchMinMaxScaleDenominator should include support for multiple NamedLayers
- GEOS-11349 MapML Use WMS Resource Consumption Limit to specify max image size
- GEOS-11351 Exact term search in the pages’ filters
-
GEOS-11369 Additional authentication options for cascaded WMS WMTS data stores - GEOS-11370 Refactor inline JavaScript in the TestWfsPost Page
- GEOS-11371 Refactor inline JavaScript in the GetMap OpenLayers format
- GEOS-11379 Refactor inline JavaScript in the OGC API modules
- GEOS-11400 About Page Layout and display of build information
- GEOS-11401 Introduce environmental variables for Module Status page
- GEOS-11427 metadata: “fix all” to support changing config repeatable field
- GEOS-11443 REST API does not take effect immediately due to 10 minute authentication cache
- GEOS-11461 Enable MapML Viewer output for WFS getFeature.
- GEOS-11467 Update Marlin, make the bin package compatible with Java 17
- GEOS-11477 Add a max and a min merge mode for image mosaics
- GEOS-11486 Adding custom dimensions to MapML
- GEOS-11488 Double-Click-to-Copy featurecaption variable reference
- GEOS-11495 Support multi-layer output in CSS
- GEOS-11502 Permit resize on user/group/role palette textbox to allow for extra long role names
- GEOS-11503 Update mongo schemaless DWITHIN to support non-point geometry
- GEOS-11515 Add support for zoom level rule filtering in CSS
- GEOS-11526 GeoFence: slow GeoServer response when there are many roles and layergroups
- GEOS-11527 Add new vector tiles generation options in style body: vt-attributes, vt-coalesce, vt-labels, vt-label-attributes
- GEOS-11528 Update MapML viewer to latest release 0.14.0
- GEOS-11531 When coalescing linestrings in vector tiles output, fuse them to create a single long line
Bug:
- GEOS-7183 Demo request/wcs/wps pages incompatible with [HTTPS]
- GEOS-11202 CAS extension doesn’t use global “proxy base URL” setting for service ticket
- GEOS-11266 csw-iso: missing fields in summary response
- GEOS-11314 Error in IconService when style has multiple FeatureTypeStyle
- GEOS-11385 Demo Requests functionality does not honour ENV variable PROXY_BASE_URL
- GEOS-11416 GeoPackage output contains invalid field types when exporting content from PostGIS
- GEOS-11422 MapML License Metadata Stored With Incorrect Keys
- GEOS-11430 CiteComplianceHack not correctly parsing the context
- GEOS-11446 [INSPIRE] Incorrect behavior for unsupported languages
- GEOS-11462 500 error thrown when double adding a user to a group via REST with JDBC user/group services
- GEOS-11484 DirectRasterRenderer is not respecting advancedProjectionHandling and continuosMapWrapping format_options
- GEOS-11530 Adding or removing a grid subset in the layer caching tab, causes the grid dropdown to get duplicated
Task:
- GEOS-11341 Upgrade NetCDF to 5.3.3
- GEOS-11360 Upgrade Apache POI from 4.1.1 to 5.2.5
- GEOS-11362 Upgrade Spring libs from 5.3.32 to 5.3.33
- GEOS-11374 Upgrade Spring version from 5.3.33 to 5.3.34
- GEOS-11375 GSIP 224 - Individual contributor clarification
- GEOS-11393 Upgrade commons-io from 2.12.0 to 2.16.1
- GEOS-11395 Upgrade guava from 32.0.0 to 33.2.0
- GEOS-11397 App-Schema Includes fix Integration Tests
- GEOS-11402 Upgrade PostgreSQL driver from 42.7.2 to 42.7.3
- GEOS-11403 Upgrade commons-text from 1.10.0 to 1.12.0
- GEOS-11404 Upgrade commons-codec from 1.15 to 1.17.0
- GEOS-11407 Upgrade jackson from 2.15.2 to 2.17.1
- GEOS-11464 Update Jackson 2 libs from 2.17.1 to 2.17.2
- GEOS-11470 Upgrade the version of Mongo driver for schemaless plugin from 4.0.6 to 4.11.2
- GEOS-11471 Remove Sharding configuration support from MapML
- GEOS-11472 Upgrade freemarker from 2.3.31 to 2.3.33
- GEOS-11473 Upgrade guava from 33.2.0 to 33.2.1
- GEOS-11475 Upgrade commons-codec from 1.17.0 to 1.17.1
- GEOS-11478 Upgrade commons-lang3 from 3.14.0 to 3.15.0
- GEOS-11479 Upgrade junit from 4.13.1 to 4.13.2
- GEOS-11480 Update map fish-print-lib 2.3.1
- GEOS-11506 Upgrade Spring version from 5.3.37 to 5.3.39 and Spring security from 5.8.13 to 5.8.14
- GEOS-11508 Update OSHI from 6.4.10 to 6.6.3
- GEOS-11512 Upgrade jasypt from 1.9.2 to 1.9.3
- GEOS-11532 Update to JTS 1.20.0
- GEOS-11533 Update org.apache.commons.vfs2 to 2.9.0
- GEOS-11544 Upgrade to ImageIO-EXT 1.4.13
- GEOS-11545 Update to JAI-EXT 1.1.27
For the complete list see 2.26.0 release notes.
Community UpdatesCommunity modules are shared as source code to encourage collaboration. If a topic being explored is of interest to you, please contact the module developer to offer assistance.
Community module development:
- GEOS-10690 Task manager plugin is missing dependencies
- GEOS-10824 gs-flatgeobuf extension can clash with “directory of shapefiles” datastores
- GEOS-11331 OAuth2 can throw a “ java.lang.RuntimeException: Never should reach this point”
- GEOS-11358 Feature-Autopopulate Update operation does not apply the Update Element filter
- GEOS-11381 Error in OIDC plugin in combination with RoleService
- GEOS-11412 Remove reference to JDOM from JMS Cluster (as JDOM is no longer in use)
- GEOS-11466 move reusable elements of the graticule plugin to GeoTools
- GEOS-11469 Datadir catalog loader does not decrypt [HTTPStoreInfo] passwords
- GEOS-11518 DGGS JDBC store SQL encoder should not force the timezone to CET
- GEOS-11519 Make DGGS rHealPix tests run again
- GEOS-11521 Expose a JNDI variant of the DGGS Clickhouse datastore
- GEOS-11541 STAC search endpoint sortby query not working with POST
OGC API modules now nicely slot into the home page in the corresponding functional section, e.g., since both provide raw vector data, both OGC API Features and WFS show up in the same area:

Thanks to David Blasby (GeoCat) for this work.
- GEOS-11445 OGCAPI ServiceDescriptors
The “Data Directory loader”, by Gabriel Roldan (Camptocamp), is a replacement data directory loader, reading the XML configuration files at startup. It has been optimized to achieve better parallelism and be more efficient over network file systems.
It can be found amongst the nightly builds, it’s a simple drop in replacement, just unzip the plugin in
WFS HTML Freemarker outputWEB-INF/liband restart. Let us know how it works for you.The WFS HTML Freemaker output format is a community module generating HTML in response to GetFeature, using the GetFeatureInfo Freemarker templates.
Thanks to Alessio Fabiani (GeoSolutions) for starting this activity.
Graticule moduleThe graticules module is the combination of a data store and a rendering transformation allowing to generate graticules at multiple resolutions, and optionally placing the graticule labels at the map borders.

Thanks to Ian Turton for working on this activity. Ian needs a few more people to try this out before it can be included in our GeoServer roadmap.
Developer UpdatesGeoServer team has identified quite the challenges for GeoServer 2024 Roadmap Plannings.
Wicket ProgressAfter initial testing of 2.26-M0 milestone release we held off including Wicket 9 until after the 2.26.0 release. Thanks to Peter Smythe and Jody Garnett for testing.
Thanks to Brad Hards who started this work in November 2023, and David Blasby who helped bring this up to a state it could be tested ahead of the 2.26.0 release.
Spring Security 5.8Thanks to Andreas Watermeyer (ITS Digital Solutions) completed this important update.
This is the last stopping place before Spring Security 6, and the last chance to work with the OAuth2 community modules.
- GEOS-11271 Upgrade spring-security to 5.8
Additional information on GeoServer 2.26 series:
-
13:00
Mappery: Watervliet Shaker Village
sur Planet OSGeoPièce jointe: [télécharger]

Patrick Curley shared this – A map of the Watervliet Shaker Village at the Shaker Heritage Society in Albany, NY.
-
13:23
geomatico: Misión exploratoria de visualización raster serverless: COG en Maplibre y más allá
sur Planet OSGeoJornadas SIG Libre 2024
Conferencia sobre cómo consumir y visualizar datos en formato raster desde la nube en la XVII Edición de las Jornadas de SIG Libre, ponentes: Francisco Pérez Sampayo y Óscar Fonts
-
13:00
Mappery: 50 Yard Line Map of Illinois
sur Planet OSGeo

Doug shared this, he said “Go Penn State!” whatever that means to a Brit?
-
10:00
From GIS to Remote Sensing: Tutorial: Random Forest Classification Using the Semi-Automatic Classification Plugin
sur Planet OSGeoThis is a tutorial about the land cover classification using the Random Forest algorithm in the Semi-Automatic Classification Plugin (SCP).Please note that the installation of the dependency scikit-learn is required (see Plugin Installation). It is assumed that you have already read the Basic Tutorials.Following the video tutorial.
Read more » -
4:00
PostGIS Development: PostGIS 3.5.0rc1
sur Planet OSGeoThe PostGIS Team is pleased to release PostGIS 3.5.0rc1! Best Served with PostgreSQL 17 RC1 and GEOS 3.13.0.
This version requires PostgreSQL 12 - 17, GEOS 3.8 or higher, and Proj 6.1+. To take advantage of all features, GEOS 3.12+ is needed. SFCGAL 1.4+ is needed to enable postgis_sfcgal support. To take advantage of all SFCGAL features, SFCGAL 1.5 is needed.
3.5.0rc1This release is a release candidate of a major release, it includes bug fixes since PostGIS 3.4.3 and new features.
Changes since 3.5.0beta1 are as follows:
-
4:00
PostGIS Development: PostGIS 3.5.0beta1
sur Planet OSGeoThe PostGIS Team is pleased to release PostGIS 3.5.0beta1! Best Served with PostgreSQL 17 RC1 and GEOS 3.13.0.
This version requires PostgreSQL 12 - 17, GEOS 3.8 or higher, and Proj 6.1+. To take advantage of all features, GEOS 3.12+ is needed. SFCGAL 1.4+ is needed to enable postgis_sfcgal support. To take advantage of all SFCGAL features, SFCGAL 1.5 is needed.
3.5.0beta1This release is a beta of a major release, it includes bug fixes since PostGIS 3.4.3 and new features.
-
14:00
WhereGroup: Artenvielfalt, Naturschutz und Rohstoffe? Kein Widerspruch! Die bundesweite Biodiversitätsdatenbank der Baustoff-Steine-Erden-Industrie
sur Planet OSGeoInterview mit Tanja Lenz, Leiterin Reporting und Statistik beim Bundesverband Baustoffe - Steine und Erden e.V. -
14:00
Mappery: The Travels of Marco Polo
sur Planet OSGeoPièce jointe: [télécharger]

Reinder spotted this exquisite flyleaf detailing the travels of Marco Polo. I could gawp at this for ages without ever turning a page. The cover is pretty amazing too.
BTW, today is Marco Polo’s birthday (born in 1254)

-
13:00
Mappery: Dena’ina
sur Planet OSGeoPièce jointe: [télécharger]

Greg Fiske said “Admiring the nexus of #IndigenousArt and #mapsinthewild this week. Dena’ina land” In case you are wondering Dena’ina is in south Alaska (the map shows the whole of Alaska)

-
13:00
Mappery: World Time
sur Planet OSGeoPièce jointe: [télécharger]

Michel Stuyts asks “Am I the only one who sees this kind of clock in a shop and the first thing that comes to mind is: I wonder what kind of projection they used?”
The answer is definitely not! There are thousands of map lovers here who would love to answer you Michel
-
16:00
Fernando Quadro: 5 maneiras de usar IA generativa em seus aplicativos geoespaciais
sur Planet OSGeoA IA generativa claramente faz jus ao hype. Onde a localização importa, os LLMs trazem muitas oportunidades para melhorar seus aplicativos GIS e facilitar as interações com os usuários ao introduzir solicitações de linguagem natural.
Aqui estão 5 maneiras de usar IA generativa em seus aplicativos geoespaciais:
 Melhore a busca por dados com pesquisa semântica
A pesquisa semântica melhora drasticamente os resultados de uma pesquisa lexica simples porque a IA entende o significado das solicitações, sem prestar atenção às palavras escolhidas.
A pergunta “Quando as lixeiras são recolhidas” encontrará resultados sobre “Política de coleta de lixo”, enquanto a pesquisa lexica não pode corresponder a nenhuma palavra.
Você pode ir além e usar uma abordagem híbrida (mesclando léxico e semântico) para ajustar sua pesquisa. Enriqueça seu conjunto de dados extraindo dados estruturados de texto não estruturado
Os LLMs podem extrair valores estruturados de dados não estruturados, como texto. Quando você tem apenas um título e/ou uma descrição sobre seu conjunto de dados, a IA pode extrair palavras-chave, temas ou qualquer outra informação contextual contida na descrição. Essas informações extraídas podem então ser indexadas para ajustar a pesquisa. Este método pode ser usado para enriquecer registros de metadados e conjuntos de dados.
Por exemplo, extrair pontos de vista de uma descrição de trilha Conduza seu aplicativo geoespacial com ferramentas e chamadas de função
Com a chamada de função, os modelos de IA fornecem uma maneira de especificar diferentes ações que o LLM deve entender de sua solicitação e chamar os métodos apropriados com os argumentos correspondentes diretamente do seu código. Você pode então conduzir seu aplicativo por solicitações naturais (texto ou voz).
Por exemplo: Adicione ciclovias ao mapa, ative o modo escuro etc. Desenvolva habilidades de inteligência de localização com modelos text2sql específicos
Modelos de IA específicos realmente brilham ao transformar uma solicitação do usuário em uma consulta SQL. Isso permite que o usuário solicite qualquer informação complexa oculta em seu banco de dados. O modelo definitivo para aplicações geoespaciais pode ser um modelo text2postgis que permite qualquer consulta espacial para sua aplicação, como junções espaciais, buffers, agrupamento, distribuições h3 e muito mais possibilidades.
Por exemplo: encontre todos os restaurantes a 1 km de qualquer hotel em Paris. Crie seu chatbot personalizado com agentes
Com agentes, você pode usar LLMs para escolher uma sequência de ações a serem tomadas. Isso significa que a IA escolherá por conta própria quais métodos chamar, sequencialmente, para responder à sua solicitação. Uma dessas ações pode ser pedir esclarecimentos ao usuário sobre sua solicitação, criando uma conversa com o usuário. Além disso, ajuda a entender como a IA constrói os resultados, pois o agente está lhe dizendo o que ele está realmente fazendo para atender à sua demanda.Por exemplo: encontre todos os restaurantes a 1 km de qualquer hotel em Paris.
Extraindo a geometria de Paris
Colocando todos os hotéis contidos nessa geometria
Construindo um buffer de 1 km ao redor das geometrias de pontos de hotéis
Colocando todos os restaurantes contidos nesses buffersComo você vê, a IA Generativa oferece habilidades inestimáveis ??para impulsionar seus aplicativos geoespaciais para o próximo nível e realmente ajudar seus aplicativos a serem realmente consumidos pelos usuários. Ao combinar todas essas técnicas, você pode acabar construindo um chatbot de inteligência de localização para resolver quaisquer preocupações territoriais e ajudar no processo de tomada de decisão em qualquer escala.
Fonte: webgis.tech
Instagram: [https:]]
LinkedIn: [https:]] -
13:00
Mappery: Salt Lake City Woodcarving
sur Planet OSGeoPièce jointe: [télécharger]

Matt Malone shared this, he said “Stumbled upon this excellent woodcarved street map of Salt Lake City recently. Airports should have their own #MapsInTheWild category.” We don’t really do categories on Mappery because I would forget to tag things and Arnaud or Dan would probaly tag them differently and there chaos lies.
Cracking piece of woodwork though!
-
4:00
GeoServer Team: CVE-2024-36401 Remote Code Execution (RCE) vulnerability in evaluating property name expressions
sur Planet OSGeoThe GeoServer community has been under considerable strain responding to CVE-2024-36401. This vulnerability stems from GeoTools library CVE-2024-36404.
This vulnerability, in the handling of XPath expressions, affords a “remote code execution” attack that is under active exploit. A remote code execution (RCE) attack allows an attacker to run malicious code on your computer or network.
For more information:
- GeoServer 2.25.2 Release (Jun 18, 2024)
- GeoServer 2.24.4 Release (Jun 18, 2024)
- CVE-2024-36401 (July 1, 2024)
- CISA Warns of Actively Exploited RCE Flaw in GeoServer GeoTools Software (The Hacker News, July 18, 2024)
- GeoServer Vulnerability Targeted by Hackers to Deliver Backdoors and Botnet Malware (The Hacker News, September 6, 2024)
You are responsible for running a GeoServer instance that has not been updated.
-
CVE-2024-36401 provides mitigation instructions which you should perform immediately.
Please stop reading and do this now.
-
Update your instance: Upgrading existing versions (User Guide)
The instructions include notes on upgrading specific versions. Please read carefully to see if any manual changes are required.
With such a serious issue several service providers have stepped forward to make fixes available for prior releases.
Full release:
- GeoServer 2.23.6 Release (GeoCat)
Patch provided with CVE-2024-36401 report:
- GeoServer 2.25.1 (GeoSolutions)
- GeoServer 2.24.3 (GeoSolutions)
- GeoServer 2.24.2 (GeoSolutions)
- GeoServer 2.23.2 (GeoSolutions)
- GeoServer 2.22.2 (GeoSolutions)
- GeoServer 2.21.5 (GeoSolutions)
- GeoServer 2.21.4 (GeoSolutions)
- GeoServer 2.20.7 (GeoSolutions)
- GeoServer 2.20.4 (GeoSolutions)
- GeoServer 2.19.2 (GeoSolutions)
- GeoServer 2.18.0 (GeoSolutions)
Free software is a participation sport - to create a patch for a prior release volunteer with community development.
Q: How often should I upgrade GeoServer?GeoServer operates with a time boxed release cycle, maintaining “stable” and “maintenance” releases, over the course of a year.
-
Upgrade GeoServer twice a year as new stable releases are made.
-
Once the release you are using has entered “maintenance” it is a good idea to upgrade (before the release is no longer supported).
-
GeoServer security policy provides one year of support. You may also contact our service providers for extended support beyond this timeframe.
Stay up to date:
-
Please monitor release announcements for the heading “Security Considerations”.
Security Considerations
This release addresses security vulnerabilities and is considered an essential upgrade for production systems.
- CVE-2024-36401 Critical
You can review the release announcement, and in this case with a “Critical” vulnerability decide to update.
-
When everyone has had an opportunity to update the details of the vulnerability are announced.
Security Considerations
This release addresses security vulnerabilities and is considered an essential upgrade for production systems.
- CVE-2024-36401 Remote Code Execution (RCE) vulnerability in evaluating property name expression (Critical)
-
As GeoServer has now adopted use CVEs for publication you may also have success with vulnerability scanning tools.
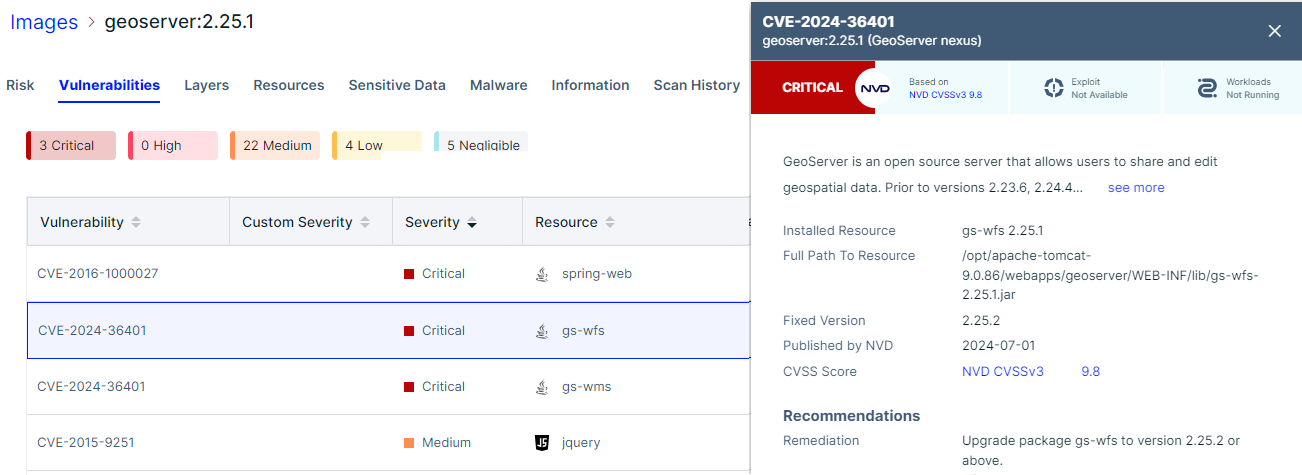
These tools function when the vulnerability is published, and do not provide any advance notice.
As security reports contain sensitive information they are only shared with representatives of the geoserver-security email list.
Participation in geoserver-security, like commit access, is volunteer based and reflects trust.
Please review GeoServer Security Policy if you are in a position to help out.
-
17:00
Bentley Systems increases investment in OGC and reinforces commitment to Open Standards following Cesium acquisition
sur Open Geospatial Consortium (OGC)The Open Geospatial Consortium (OGC) is pleased to announce that infrastructure engineering software company Bentley Systems is increasing its investment and engagement in OGC—and further strengthening its commitment to growing an open ecosystem.
Bentley recently acquired Cesium, a fellow OGC member and the creator of 3D Tiles, an OGC Community Standard for massive heterogenous 3D geospatial content.
Bentley’s increased investment in OGC, coupled with its acquisition of Cesium, signals their commitment to a future built around open standards, data, and infrastructure. OGC’s trusted community of problem solvers leverages the power of geography, open standards, and interconnected systems to address real-world problems while opening up opportunities for commercial growth.
“We are pleased to see this increased investment in OGC by Bentley, and their support to us as a Principal member,” said Peter Rabley, Chief Executive Officer, OGC. “As a Principal Member of OGC, Bentley will play a significant role serving on OGC’s Executive Planning Committee and participating in final approval decisions for all OGC Standards and nominations to the Board of Directors.”
Patrick Cozzi, Chief Platform Officer, Bentley, and Cesium founder, commented, “The success and impact of 3D Tiles as an open standard reinforces our belief that openness and interoperability are essential to making the best use of location information to benefit society. We look forward to continuing to work within the OGC community as part of Bentley.”
“Bentley is a strong supporter of open data ecosystems,” added Julien Moutte, Chief Technology Officer, Bentley Systems. “As a principal member of OGC, we are committing further resources to accelerate the development and adoption of open standards that benefit applications for the built and natural environment.”
About OGC
The Open Geospatial Consortium (OGC) is a membership organization dedicated to using the power of geography and technology to solve problems faced by people and the planet. OGC unlocks value and opportunity for its members through Standards, Innovation, and Policy & Advocacy. Our membership represents a diverse and active global community drawn from government, industry, academia, international development agencies, research & scientific organizations, civil society, and advocates.
Visit ogc.org for more information about our work.About Bentley Systems
Bentley Systems (Nasdaq: BSY) is the infrastructure engineering software?company. Bentley provides innovative software to advance the world’s infrastructure – sustaining both the global economy and environment. Bentley’s industry-leading software solutions are used by professionals, and organizations of every size, for the design, construction, and operations of roads and bridges, rail and transit, water and wastewater, public works and utilities, buildings and campuses, mining, and industrial facilities. Bentley’s offerings, powered by the iTwin?Platform for infrastructure digital twins, include MicroStation and Bentley Open?applications for modeling and simulation, Seequent’s software for geoprofessionals, and Bentley Infrastructure Cloud encompassing ProjectWise?for project delivery, SYNCHRO?for construction management, and AssetWise?for asset operations. Bentley Systems’ 5,200 colleagues generate annual revenues of more than $1 billion in 194 countries.About Cesium
Cesium is the open platform for 3D Geospatial. Cesium created 3D Tiles, the Open Geospatial Consortium community standard for streaming massive 3D geospatial datasets. Use Cesium ion to optimize, host, and combine your data with curated global 3D content and stream to any device. With unique expertise at the intersection of 3D geospatial and computer graphics, Cesium is deeply committed to openness and interoperability through open standards, open APIs, and open source offerings like CesiumJS, Cesium for Unreal, Cesium for Unity, and Cesium for Omniverse. Originally built for Aerospace, Cesium is now used to power thousands of applications in industries like Defense, Architecture, Engineering, Construction and Operations, Commercial real estate, urban planning, and more.The post Bentley Systems increases investment in OGC and reinforces commitment to Open Standards following Cesium acquisition appeared first on Open Geospatial Consortium.
-
13:00
Mappery: La Tharee
sur Planet OSGeoPièce jointe: [télécharger]

Julien Minet shared this spectacular mappy beer bottle. “Here again an association of cartography and beers, a hand-drawn map of some part of the Ardenne printed on a special edition of the Belgian beer La Tharée”
-
5:16
Sean Gillies: Fiona 1.10.0
sur Planet OSGeoI made a software release last Tuesday. One with new features, deprecations, major refactoring, and packaging and dependency changes, not just bug fixes. Fiona 1.10.0 has three main changes: Python openers, CLI filter commands, and new data classes.
Python openers can connect filesystems implemented in Python, like fsspec or tiledb.vfs, to GDAL's own virtual filesystem machinery. In most cases, you should reply on GDAL's built-in virtual filesystem handlers. On the other hand, if you have unique or proprietary data access protocols, then Fiona's new openers may be useful. As far as I know, Fiona (and Rasterio) have the only open source implementations of GDAL's virtual filesystem plugin system. David Hoese had the initial idea, Even Rouault helped a lot, and I got it over the finish line. I think this is right up there with MemoryFile for my favorite feature that didn't exist in Python-GIS software before.
Fiona's CLI has three new commands, filter (strictly speaking, a new mode of this command), map, and reduce. These provide some great features for Unix-style data processing pipelines and are designed to work well with jq and programs of that nature. Think of them as the data processing part of ogr2ogr, split into 3 simpler commands, reading and writing to stdin/stdout by default, with no SQL and no need to know about different SQL dialects. The documentation contains a new tutorial about using filter, map, and reduce. This work began in planetlabs/fio-planet and now lives in the Fiona CLI core. Thank you, Tim Schaub, for stewarding the transition.
Lastly, Fiona now longer represents GIS features (and their geometries and properties) as Python dicts, but as Python classes:
fiona.model.Feature,fiona.model.Geometry, andfiona.model.Properties. These classes provide dict-like access for backwards compatibility, but raise warnings when mutated. These data classes will be immutable in version 2.0.A lot of GIS-Python attention has moved on to columnar data and massive amounts of time series, trajectories, telemetry, etc, using Parquet and Arrow. But, there's still a need to reason about persistent spatial things in our world and their relationships to each other. Classic GIS features, in other words. Watersheds, counties, neighborhoods. That's what Fiona remains concerned about.
-
4:00
Camptocamp: GeoServer 3 Call for Crowdfunding
sur Planet OSGeoPièce jointe: [télécharger]
GeoServer is at a critical turning point and it needs your help to continue its journey as the leading free and Open Source platform for geospatial data. With GeoServer 3 we are transforming the way you interact with geospatial data—making it faster, more intuitive, and more secure. -
23:49
Fernando Quadro: GeoServer 3 – Campanha de Crowdfunding
sur Planet OSGeoO GeoServer precisa da sua ajuda para continuar sua jornada como a principal plataforma gratuita e de código aberto para dados geoespaciais. Com o GeoServer 3, estamos transformando a maneira como você interage com dados geoespaciais, tornando-os mais rápidos, intuitivos e seguros.
Esta grande atualização, liderada pela Camptocamp, GeoSolutions e GeoCat, fornecerá:
- Desempenho futuro: um núcleo modernizado para compatibilidade com as mais recentes tecnologias de gerenciamento e implantação de dados.
- Processamento de imagem aprimorado: manuseio mais rápido e suave de imagens espaciais e conjuntos de dados maiores.
- Segurança e conformidade aprimoradas: atenda aos padrões regulatórios e proteja seus dados com os mais recentes aprimoramentos de segurança.
- Experiência do usuário simplificada: navegação mais fácil, integração de novos serviços e capacitação de usuários em todos os níveis.
O escopo deste trabalho está além de atualizações de rotina ou manutenção, já que a transição para o GeoServer 3 requer um amplo redesenvolvimento dos sistemas principais, bem como a implementação de práticas de segurança modernas e também testes e validação completos em todas as extensões do GeoServer.
Os membros do consórcio – Camptocamp, GeoSolutions e GeoCat – têm uma longa história de suporte e contribuição ao GeoServer e estão totalmente comprometidos com o sucesso desta migração. No entanto, este é um grande esforço que não pode ser concluído sem o suporte da comunidade.
Ao apoiar esta campanha de crowdfunding, você está investindo no futuro do GeoServer e ajudando a sustentar a comunidade geoespacial inovadora e de código aberto.
1. Por que GeoServer 3?
À medida que o cenário digital evolui, manter-se atualizado com as últimas tecnologias não é mais opcional — é essencial. O GeoServer 3 está sendo desenvolvido para enfrentar desafios cruciais e garantir que o GeoServer continue sendo uma plataforma confiável e segura para o futuro. Vários fatores-chave tornam esta atualização crítica agora:
- Conformidade regulatória: Novas regulamentações, incluindo a lista de vulnerabilidades exploradas conhecidas da CISA, exigem que os sistemas sejam totalmente corrigidos para garantir a prontidão operacional. Sem as últimas atualizações, o GeoServer corre o risco de ficar aquém desses padrões, e é por isso que migrar para o Spring 6 é essencial.
- Fim do suporte para o Spring 5: Em janeiro de 2025, o Spring 5 não receberá mais atualizações de segurança, deixando os sistemas vulneráveis. Como o GeoServer opera como middleware entre serviços da web e camadas de dados essenciais, esta atualização para o Spring 6 é crucial para manter conexões seguras e proteger dados de possíveis violações.
- Melhorias de segurança: A atualização para o Spring 6 habilita protocolos OAuth2 para autenticação segura, especialmente crítica para uso em larga escala ou em nível empresarial. Esses avanços ajudarão as organizações a atender aos requisitos de segurança em evolução e proteger dados geoespaciais confidenciais.
- Mudança para o JDK 17: Esta atualização também marca a transição do GeoServer para o JDK 17, que traz melhorias em desempenho, segurança e suporte de longo prazo. Manter o GeoServer alinhado com as versões mais recentes do Java garante compatibilidade com as modernas tecnologias de implantação Tomcat 10 e Jakarta e prepara a plataforma para o futuro.
- Processamento de imagem aprimorado: O GeoServer 3 substituirá a biblioteca Java Advanced Imaging (JAI) desatualizada pelo kit de ferramentas ImageN mais moderno e flexível. Esta mudança aumentará significativamente os recursos de processamento de imagem, permitindo um manuseio mais rápido de grandes conjuntos de dados espaciais e melhorando a compatibilidade com Java.
- Conjunto de tecnologia à prova do futuro: Com a migração para o Spring 6 e a mudança para o JDK 17, o GeoServer 3 garante viabilidade de longo prazo. Abordar toda a pilha do GeoServer, incluindo os componentes corporativos GeoFence e Cloud Native GeoServer, permite que as organizações adotem perfeitamente a infraestrutura moderna e os modelos de implantação sem comprometer o desempenho ou a segurança.
Com este trabalho, o GeoServer está caminhando para um futuro mais seguro e de alto desempenho, pronto para atender às necessidades em evolução da comunidade geoespacial.
2. Sobre a Campanha de Crowdfunding
Embora o consórcio esteja totalmente comprometido com esse esforço, o tamanho da tarefa significa que precisamos de suporte financeiro adicional para que isso aconteça. É aqui que você entra. Ao contribuir para esta campanha de financiamento coletivo, você está apoiando diretamente os desenvolvedores e engenheiros que realizarão a atualização, garantindo o sucesso contínuo do GeoServer.
Seu suporte, seja como indivíduo, instituição pública ou provedor de serviços, é vital. Ao contribuir para esta campanha de financiamento coletivo, você está investindo no futuro da tecnologia geoespacial de código aberto. O financiamento coletivo será estruturado em duas fases para garantir o sucesso:
- Fase de compromisso: patrocinadores e membros da comunidade prometerão seu suporte financeiro durante esta fase, mas nenhum fundo será coletado. O objetivo é atingir uma meta predefinida que cubra todo o escopo de trabalho necessário para a migração.
- Ativação do financiamento: assim que a meta for atingida, o financiamento coletivo será ativado e os patrocinadores serão faturados pelos valores prometidos. Isso garante que haja suporte financeiro suficiente para concluir a migração sem correr o risco de subfinanciamento.
Essa abordagem estruturada garante que o GeoServer 3 seja totalmente financiado antes de qualquer trabalho começar, evitando o risco de uma migração incompleta. Isso garante que o projeto terá os recursos necessários para ser concluído em sua totalidade.
3. Como participar
O GeoServer tem a confiança de milhares de organizações no mundo todo. Agora é a hora de dar um passo à frente e se juntar a essa comunidade de apoiadores.
Ao doar, você ajudará a garantir o futuro do GeoServer como uma plataforma de alto desempenho e código aberto. Cada contribuição conta.
Pronto para dar suporte ao GeoServer 3? Entre em contato pelo e-mail gs3-funding@googlegroups.com para expressar seu interesse ou prometer seu apoio.
Juntos, podemos garantir o futuro do GeoServer nos próximos anos.
-
19:35
GeoCat: GeoServer 3 Call for Crowdfunding
sur Planet OSGeoGeoServer is at a critical turning point and it needs your help to continue its journey as the leading free and open-source platform for geospatial data. With GeoServer 3 we are transforming the way you interact with geospatial data—making it faster, more intuitive, and more secure.
This major upgrade, led by Camptocamp, GeoSolutions, and GeoCat, will deliver:
-
Future-Proof Performance: A modernized core for compatibility with the latest data management and deployment technologies.
-
Enhanced Image Processing: Faster, smoother handling of spatial imagery and larger datasets.
-
Improved Security and Compliance: Meet regulatory standards and protect your data with the latest security enhancements.
-
Streamlined User Experience: Easier navigation, integrating new services, and empowering users at all levels.
The scope of this work is beyond routine updates or maintenance since the transition to GeoServer 3 requires extensive redevelopment of core systems as well as implementing modern security practices and also thorough testing and validation across all GeoServer extensions.
The consortium members – Camptocamp, GeoSolutions, and GeoCat– have a long-standing history of supporting and contributing to GeoServer and are fully committed to the success of this migration. However, this is a major effort that cannot be completed without community support.
By supporting this crowdfunding campaign, you are investing in the future of GeoServer and helping to sustain the innovative, open-source geospatial community.
Why GeoServer 3As the digital landscape evolves, staying up-to-date with the latest technology is no longer optional — it’s essential. GeoServer 3 is being developed to address crucial challenges and ensure that GeoServer remains a reliable and secure platform for the future. Several key factors make this upgrade critical right now:
-
Regulatory Compliance: New regulations, including the CISA known exploited vulnerabilities list, demand that systems be fully patched to ensure operational readiness. Without the latest updates, GeoServer risks falling short of these standards, which is why migrating to Spring 6 is essential.
-
End of Support for Spring 5: By January 2025, Spring 5 will no longer receive security updates, leaving systems vulnerable. As GeoServer operates as middleware between web services and essential data layers, this upgrade to Spring 6 is crucial to maintaining secure connections and protecting data from potential breaches.
-
Security Enhancements: Upgrading to Spring 6 enables OAuth2 protocols for secure authentication, especially critical for large-scale or enterprise-level use. These advancements will help organizations meet evolving security requirements and protect sensitive geospatial data.
-
Switching to JDK 17: This upgrade also marks GeoServer’s transition to JDK 17, which brings improvements in performance, security, and long-term support. Keeping GeoServer aligned with the latest Java versions ensures compatibility with modern deployment technologies Tomcat 10 and Jakarta and future-proofs the platform.
-
Improved Image Processing: GeoServer 3 will replace the outdated Java Advanced Imaging (JAI) library with the more modern and flexible ImageN toolkit. This switch will significantly enhance image processing capabilities, enabling faster handling of large spatial datasets and improving Java compatibility.
-
Future-Proof Technology Stack: With the migration to Spring 6 and the shift to JDK 17, GeoServer 3 ensures long-term viability. Addressing the entire GeoServer stack, including enterprise components GeoFence and Cloud Native GeoServer, allows organizations to seamlessly adopt modern infrastructure and deployment models without compromising performance or security.
With this work, GeoServer is moving into a more secure, high-performing future—ready to tackle the evolving needs of the geospatial community. For more information on the work to be performed and its phases, please visit this document.
Crowdfunding structureThe crowdfunding will be structured in two phases to ensure success:
- Commitment Phase: Sponsors and community members will pledge their financial support during this phase, but no funds will be collected. The goal is to reach a predefined target that covers the full scope of work necessary for the migration.
- Funding Activation: Once the target is reached, the crowdfunding will be activated, and sponsors will be invoiced for their pledged amounts. This ensures there is enough financial backing to complete the migration without risking underfunding.
This structured approach ensures that GeoServer 3 is fully funded before any work begins, preventing the risk of an incomplete migration. This guarantees that the project will have the necessary resources to be completed in its entirety.
This structure forms a multi-party agreement:
- Consortium: Three companies are forming a consortium (Camptocamp, GeoSolutions, and GeoCat) providing expertise, a proven track record, and capacity. These companies are also taking on responsibility for project management, estimating, and importantly risk.
- Supporters: We are seeking organisations to pledge their support via funding during the commitment phase. No funds will be collected until we reach the target established below for the full scope of work necessary.
- Community: We ask that our community step forward to match the contributions above with both financial contributions and in-kind development and testing.
The financial target is ambitious, 550,000.00 €. CamptoCamp, GeoCat and GeoSolutions have generously stepped up and will provide an initial seed fund of 50,000.00€ each, which means the current funding goal starts at 400,000.00 €. Here below you will find the live updated situation as far as committed funding is concerned.
How to participateIf you are ready to support GeoServer 3, please, fill this online form or contact us at gs3-funding@googlegroups.com to express your interest and pledge your support.
Together, we can secure the future of GeoServer for years to come.
The post GeoServer 3 Call for Crowdfunding appeared first on GeoCat bv.
-