Warning: Undefined array key "georezo_cookies_accepted" in /var/www/html/web/inc/menu.php on line 10
Nous utilisons des cookies pour vous garantir la meilleure expérience sur notre site. Si vous continuez à utiliser ce dernier, nous considèrerons que vous acceptez l'utilisation des cookies. J'ai compris ! ou En savoir plus !.

Planet GeoRezo

Agrégateur de flux RSS - Actualités et contenus géomatiques


Providing Global Relief

Providing Global Relief

Bert Spaan has taken Mapterhorn's global terrain data to create an interactive global Relief map. What is particularly interesting about this new map is that, unlike traditional topographic maps with a fixed colour-to-elevation scale, the map's colour spectrum adapts dynamically to the specific region or bounds currently in view.

As you pan and zoom across different landscapes, the colour grading shifts to highlight local topographic variations, producing a striking and constantly changing view of the world's mountains, valleys and plains. This works particularly well when switching between very different environments: the colour range changes to bring out the relief at the scale you're viewing, rather than leaving low-lying terrain looking uniformly flat.

...
Lire la suite →
Suivi de la pollution atmosphérique dans plus de 32 000 villes (Banque mondiale)

Suivi de la pollution atmosphérique dans plus de 32 000 villes (Banque mondiale)


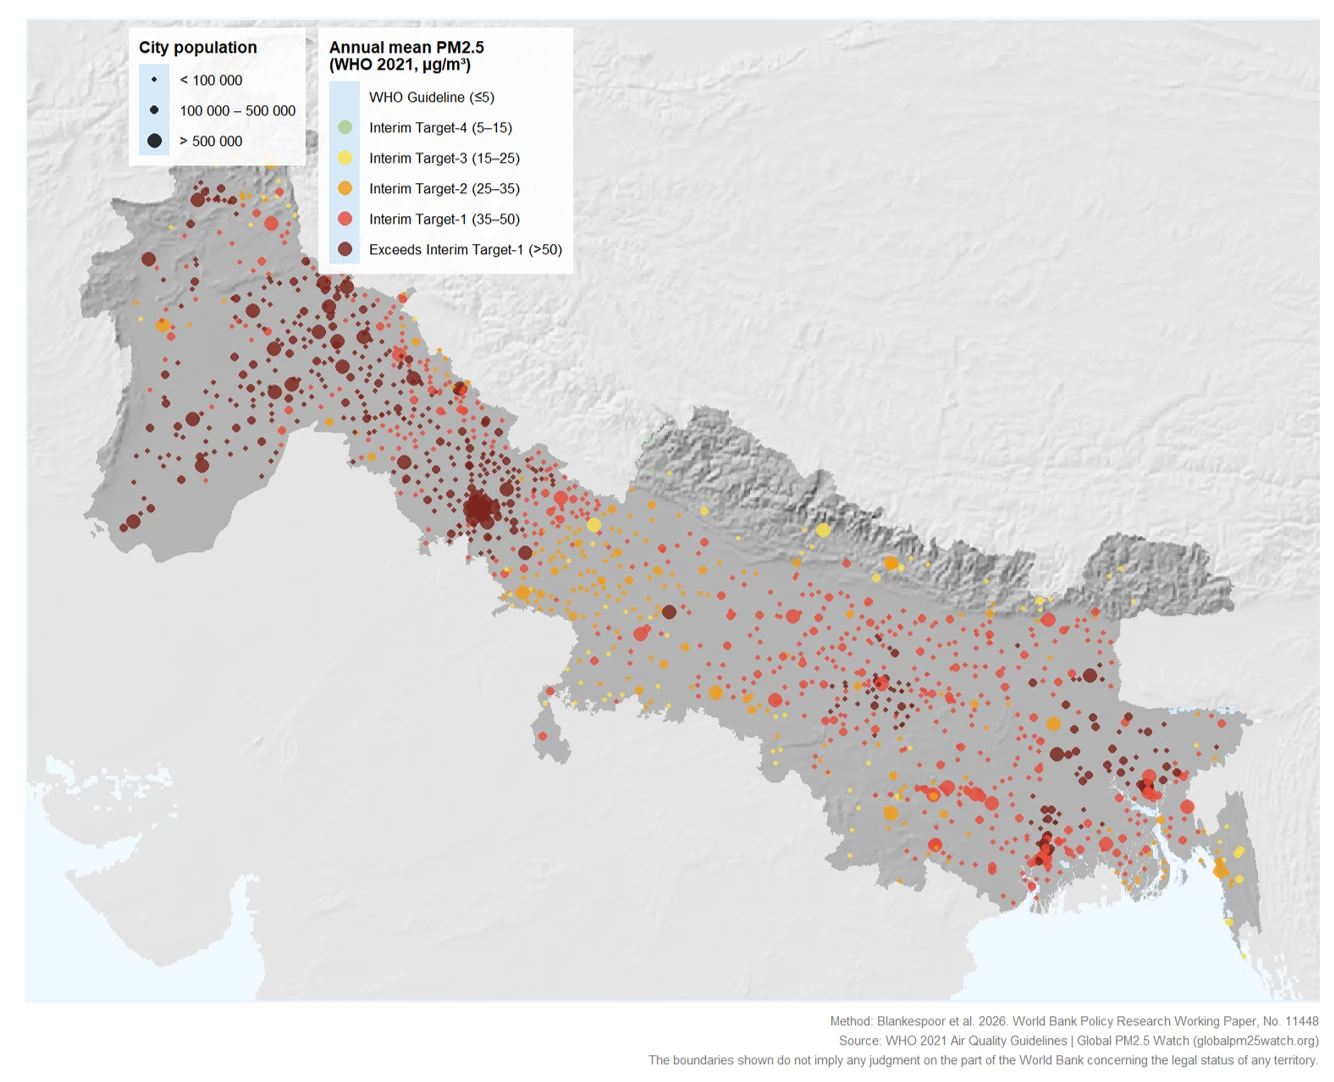
Quel est le niveau de pollution de l'air dans votre ville ? De nouvelles donnĂ©es de la Banque mondiale suivent les concentrations quotidiennes de PM₂.₅ dans plus de 32 000 villes Ă  travers le monde, pour la pĂ©riode 2018-2026. Ces donnĂ©es peuvent aider Ă  identifier les zones critiques et Ă  surveiller l'Ă©volution de la qualitĂ© de l'air urbain

1) Types de polluants et finalités de la surveillance atmosphérique

...
Lire la suite →
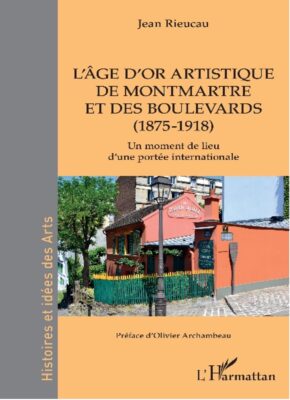
CafĂ© gĂ©o de Paris, mardi 13 octobre 2026 : « L’ñge d’or artistique de Montmartre, 1875-1918 », avec Jean Rieucau

CafĂ© gĂ©o de Paris, mardi 13 octobre 2026 : « L’ñge d’or artistique de Montmartre, 1875-1918 », avec Jean Rieucau

Mardi 13 octobre 2026, de 19h à 21h, Café de Flore, salle du premier étage, 172 boulevard Saint-Germain, 75006 Paris

Mardi 13 octobre 2026, notre deuxiĂšme cafĂ© gĂ©o de la saison 2026-2027 accueillera le gĂ©ographe Jean Rieucau qui viendra prĂ©senter la gĂ©ohistoire de Montmartre au moment de son Ăąge d’or artistique entre 1875 et 1918.

Les mĂ©dias parlent « d’ñge d’or », de lĂ©gende, d’esprit des lieux. De leur cĂŽtĂ©, les gĂ©ographes du tourisme ont forgĂ© le concept de « moment de lieu » pour caractĂ©riser certains lieux qui incarnent des situations de portĂ©e gĂ©nĂ©rale, quasi universelle. Ainsi le quartier de Montparnasse, Ă  partir de 1920 durant les AnnĂ©es folles, puis celui de Saint-Germain-des-PrĂ©s Ă  partir de la LibĂ©ration, succĂšderont Ă  la butte Montmartre comme « moments de lieux » artistiques parisiens.

...
Lire la suite →
The El Niño Forcast Map

The El Niño Forcast Map

Much has been written about how this year's El Niño is already breaking records. Climate Dashboard's new interactive map lets you explore how this unusually strong El Niño could affect climate conditions around the world, including what it might mean for the weather where you live.

El Niño is a naturally occurring climate phenomenon in which unusually warm ocean temperatures in the central and eastern tropical Pacific disrupt atmospheric circulation, shifting rainfall and temperature patterns around the world. These effects can mean wetter conditions in some regions and drought in others.

...
Lire la suite →
52 North: Increasing the value of research outputs

52 North: Increasing the value of research outputs

How to increase the reusability of research outputs?

Sure, Open Science has gained some momentum during the last decade. The Horizon Europe programme supports a number of open infrastructure projects, one of them being AquaINFRA, and the next call is already out. The German National Research Data Infrastructure (NFDI) has just announced that funding will continue until 2038. And let’s not forget the local initiatives in universities, such as Open Science Communities, reproducibility networks, and research data management centers. We also talked about 52°North’s efforts in our blog post on Lire la suite →

La NASA publie un nouveau modÚle 3D du géoïde de la Terre

La NASA publie un nouveau modÚle 3D du géoïde de la Terre


La Terre n'est pas une sphÚre parfaite : la NASA a révélé le 15 juillet 2026 un nouveau modÚle 3D de la planÚte. Cette nouvelle représentation de la Terre est bien loin de l'image d'une sphÚre lisse et brillante (la Bille bleue) que l'on voit d'habitude sur les photographies prises depuis l'espace.

Nouveau modÚle 3D du géoïde de la Terre à découvrir en version animée sur le site de la NASA.(Attention à l'échelle : cette visualisation exagÚre la hauteur du géoïde d'un facteur 10 000)

...
Lire la suite →
Free and Open Source GIS Ramblings: QGIS tabbed ribbon UI experiments

Free and Open Source GIS Ramblings: QGIS tabbed ribbon UI experiments

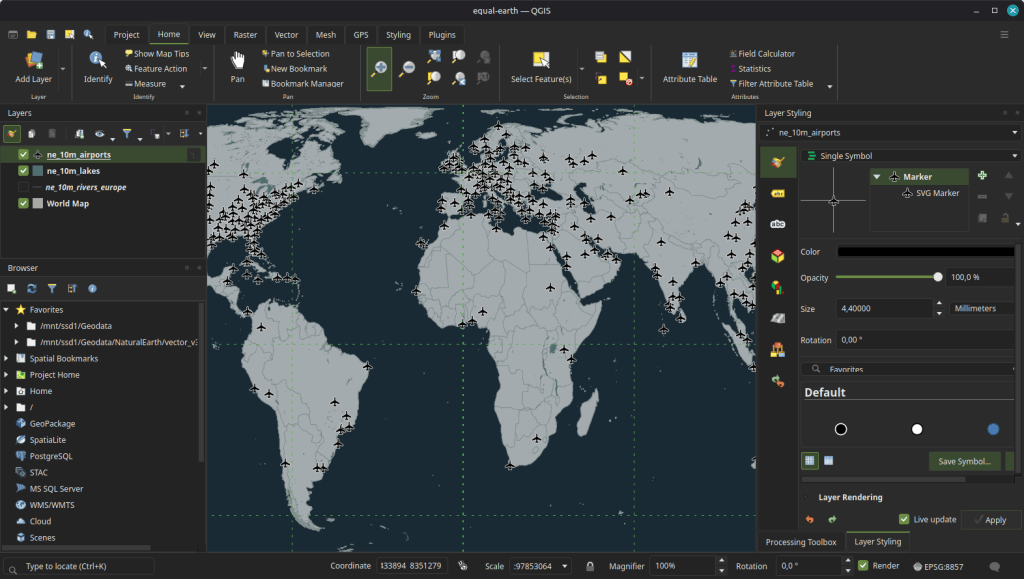
A long-standing feature request in the QGIS repo has been an option for a ribbon-style GUI to replace the plethora of toolbars that usually characterize the top rows of any QGIS window.

A couple of months ago Eithan published an experimental “Ribbon Toolbar” plugin for QGIS 3 that implemented a first version of this idea.

I recently picked up the threads, ported the plugin to QGIS 4 and continued refining the structure of the tabs and ribbons, cleaning up truncated labels, design logical groups, and making icons for the most commonly used functions (based on my subjective experience, not objectively measured) large / more prominent:

...
Lire la suite →
Utiliser les outils de mesure

Utiliser les outils de mesure

Voir la transcription ci-dessous

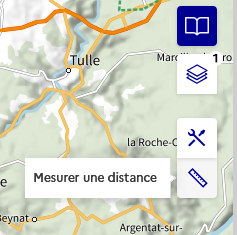
Outils de mesure : activez le son pour suivre ce tutoriel. Des informations plus détaillées se trouvent dans la suite de la page. Mesurer une distance #

L’outil « Mesurer une distance » permet de dessiner une ligne sur la carte et d’en connaĂźtre en temps rĂ©el la longueur.

Cliquez sur l’icîne de l’outil :

Vous pouvez alors cliquer sur la carte pour commencer Ă  crĂ©er la ligne. Chaque nouveau clic permet d’ajouter un sommet supplĂ©mentaire Ă  la ligne :

...
Lire la suite →
Choisir un fond de carte

Choisir un fond de carte

Voir la transcription ci-dessous

Choisir un fond de carte : activez le son pour suivre ce tutoriel. Des informations plus détaillées se trouvent dans la suite de la page. Ouvrir le catalogue de cartes #

Le catalogue de cartes est l’outil principal du service « Explorer les cartes ». Cliquez sur l’icĂŽne suivante pour l’ouvrir :

Il vous permet de naviguer parmi l’ensemble des cartes publiĂ©es depuis la GĂ©oplateforme.

...
Lire la suite →
Gérer ses couches

Gérer ses couches

Voir la transcription ci-dessous

Gérer ses couches : activez le son pour suivre ce tutoriel. Des informations plus détaillées se trouvent dans la suite de la page. Ouvrir le gestionnaire de couches #

Une fois votre carte sĂ©lectionnĂ©e depuis le catalogue de cartes, elle apparaitra dans le « Gestionnaire de couches ». Il s’agit de l’outil permettant de manipuler les donnĂ©es sĂ©lectionnĂ©es, de les organiser, les superposer et de gĂ©rer leur apparence.

Le chiffre indiquĂ© sur l’icĂŽne vous indique combien de couches contient le gestionnaire de couches. Une fois ouvert, il ressemble Ă  ceci :

Chaque couche dispose d’outils qui auront une action sur celle-ci.

...
Lire la suite →

Even Rouault: Aujourd'hui j'ai mangé un homme

Aujourd'hui j'ai mangĂ© un homme. Cela faisait longtemps que je rĂ©flĂ©chissais Ă  rĂ©aliser cette expĂ©rimentation. Dans mon enfance, le dimanche matin, ma famille se mettait en ordre de marche dans la sĂ©rĂ©nitĂ© pour se rendre Ă  la messe sur le coup des onze heures, accompagnĂ©e de la grand-mĂšre, figure tutĂ©laire dont le corps avait Ă©tĂ© marquĂ© par la rĂ©pĂ©tition des travaux agricoles et dont je revois encore le visage rougi par les braises de l'Ăątre du fournil alors qu'elle enduisait la galette de l'onction d'une gĂ©nĂ©reuse noix de beurre. ArrivĂ©s devant l'Ă©glise du village, les paroissiens franchissaient le seuil en pierre de taille pour s’assoir sur les bancs, dominĂ©s par un Christ en croix qui avant d'effrayer ces Ăąmes paysannes sĂ©journait au Parlement de Bretagne. Pendant une petite heure, la succession de lectures et chants conduisait l'esprit Ă  se vider pour se prĂ©parer Ă  la dĂ©gustation insipide du corps du Christ, cette hostie qui vous collait au palais...

Lire la suite →
GeoSolutions: Print Composer for MapStore and GeoNode, built on the GeoServer stack: the crowdfunding campaign is open

GeoSolutions: Print Composer for MapStore and GeoNode, built on the GeoServer stack: the crowdfunding campaign is open

Dear Reader,

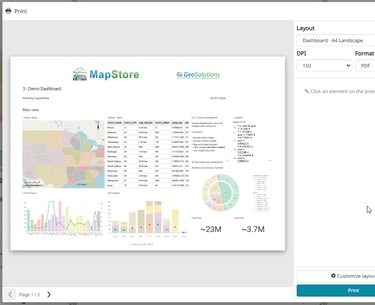
Printing in MapStore and GeoNode still relies on an ageing integration with MapFish Print 2, built around a single map. Dashboards, GeoStories and multi-page documents cannot be printed properly.

This year we built a working prototype of a new Print Composer: design the page, preview it live, print it. Maps, dashboards, GeoStories and atlases with one page per feature, rendered by a new open-source print engine built on GeoTools. You can see it in action in the 5-minute demo.

Atlas mode: one layout, one page per feature. Watch the full demo on YouTube.

...
Lire la suite →

TorchGeo: v0.10.1

TorchGeo 0.10.1 Release Notes

This is a bugfix and maintenance release. While there are no new features or API changes, this release includes important bug fixes, documentation improvements, and enhancements across datasets, models, tasks, and testing.

...
Lire la suite →
The Satellites of Mars

The Satellites of Mars

There are lots of 3D maps that visualize the tens of thousands of human-made satellites orbiting the Earth, such as SatelliteeXplorer and James Darpinian's See a Satellite Tonight, which uses Google's Street View imagery to show you exactly where to look in the night sky if you want to watch a satellite passing overhead.

Perigee takes a rather broader view of humanity's presence in space. As well as visualizing thousands of satellites orbiting the Earth, this impressive 3D viewer lets you explore spacecraft orbiting the Moon and Mars, and even track probes travelling through the wider Solar System.

...
Lire la suite →

« Ici, on n’est pas au tertiaire ! » Enjeux de localisation des activitĂ©s productives et contestations de la mĂ©tropole post-industrielle par les grossistes franco-chinois d’Aubervilliers

MalgrĂ© sa caractĂ©risation frĂ©quente comme « post-industrielle », la zone des grossistes d’Aubervilliers est l’un des derniers espaces Ă  proximitĂ© immĂ©diate de Paris Ă  hĂ©berger des activitĂ©s productives. S’insĂ©rant dans des chaĂźnes de production qui le relient Ă  la Chine et l’Europe, cet espace demeurĂ© jusqu’à rĂ©cemment productif et non rĂ©sidentiel a vu s’amorcer un processus de gentrification par tertiarisation et crĂ©ation de logements. Cet article combine la littĂ©rature Ă©mergente consacrĂ©e Ă  la ville productive et la littĂ©rature sur la gentrification Ă©largie aux acteurs Ă©conomiques non-rĂ©sidents. Prenant pour objet les interprĂ©tations et les critiques par les grossistes de cette situation de recomposition fonctionnelle, l’article propose trois nouvelles pistes de recherche et d’analyse. La premiĂšre porte sur la façon dont les ambivalences de la planification et le caractĂšre indirect des amĂ©nagements urb...

Lire l'article complet ↗

Les Mardis de l’Outre-mer : un nouveau cycle de webinaires (29/09/2026)

La FĂ©dĂ©ration nationale des agences d’urbanisme (Fnau) et Interco’ Outre-mer lancent, Ă  compter de septembre 2026, un nouveau cycle de webinaires consacrĂ© aux territoires ultramarins : « Les Mardis de l’Outre-mer ».

Ce cycle a pour ambition de faire dialoguer les bassins Atlantique, Indien et Pacifique, en croisant les regards des Ă©lus, chercheurs, opĂ©rateurs publics, services de l’État, collectivitĂ©s et acteurs coutumiers, afin de contribuer Ă  la construction d’une parole collective portĂ©e par Interco’ Outre-mer et les agences d’urbanisme.

Trois rendez-vous sont programmés entre septembre 2026 et février 2027, sous la forme de webinaires  :

...
Lire la suite →

Adam Steer: Australian ski regions and the Avalanche Terrain Exposure Scale

In 2020 I wrote about terrain analysis related to avalanche risk factors in the snowy regions of New South Wales, Australia. That approach used a slope classifier and metrics about terrain convexity to show where areas with more or less avalanche hazard exist. I’ve wanted to make an update to align better with state of
 Read More »Australian ski regions and the Avalanche Terrain Exposure Scale
Lire l'article complet ↗
Ce que la rĂ©vision de la carte des argiles dĂ©place en Île-de-France

Ce que la rĂ©vision de la carte des argiles dĂ©place en Île-de-France


La carte nationale d'exposition au retrait-gonflement des argiles a Ă©tĂ© revue par l'arrĂȘtĂ© du 9 janvier 2026, applicable depuis le 1er juillet. À l'Ă©chelle de la France hexagonale, les zones d'exposition moyenne et forte passent de 48 % Ă  55 % du territoire. Le chiffre dit qu'il y a davantage de surface classĂ©e. Il ne dit pas oĂč, et c'est pourtant la seule question qui change quelque chose pour un propriĂ©taire, un notaire ou un service instructeur.

...
Lire la suite →
Using AI to Annotate Vintage Maps

Using AI to Annotate Vintage Maps

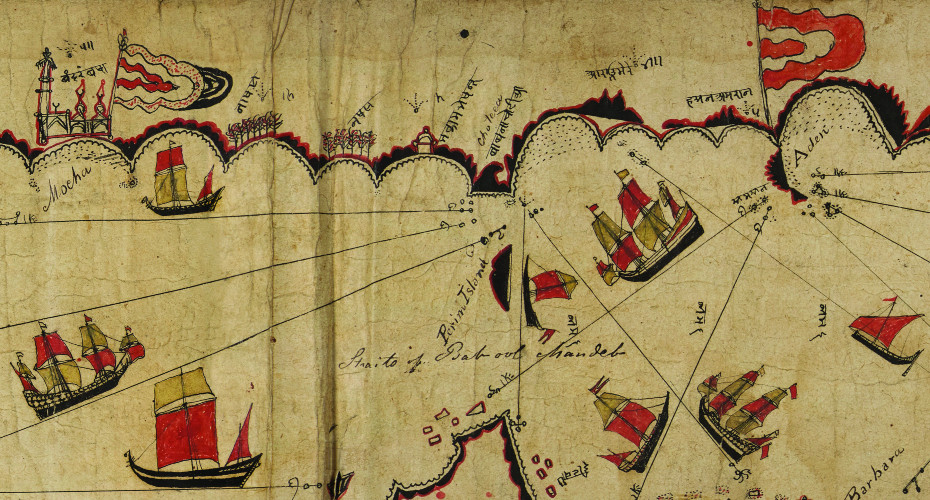
Bosphore 1819 is an interactive version of a beautiful 1819 topographical map of the Bosphorus. The original Plan Topographique du Bosphore de Thrace ou Canal de Constantinople et de ses environs was surveyed by François Kauffer between 1776 and 1786, before being redrawn and expanded by Jean-Denis Barbié du Bocage and published in 1819.

The original map is wonderfully detailed, but navigating it isn't particularly easy - particularly if you can't speak or read French. Hundreds of villages, palaces, fortifications, streams, capes and other landmarks are labelled using French spellings of Ottoman Turkish names. Bosphore 1819 turns all those labels into a database that can be searched using the modern place-names of the region.

...
Lire la suite →
GeoServer Team: GeoServer Security Update - September 2026

GeoServer Team: GeoServer Security Update - September 2026

This post provides a recap of the security advisories published over the summer of 2026, covering recently published Common Vulnerability and Exploits (CVE), along with a supply chain advisory affecting the GeoServer project. This activity has resulted in an update to our security policy covering AI-assisted vulnerability reports.

If you are responsible for a GeoServer instance, the short version is: please update to GeoServer 3.0.1, GeoServer 2.28.5, or GeoServer 2.27.6.

...
Lire la suite →
Vandoeuvre-lÚs-Nancy: Réunion OpenStreetMap, Le mercredi 28 octobre 2026 de 18h00 à 20h00.

Vandoeuvre-lÚs-Nancy: Réunion OpenStreetMap, Le mercredi 28 octobre 2026 de 18h00 à 20h00.


Le groupe local Nancy de l’association OpenStreetMap France vous propose de participer aux rĂ©unions mensuelles ouvertes Ă  tou·te·s !


Avec OpenStreetMap, participez Ă  la construction d’une carte en ligne libre et gratuite, partagĂ©e avec le monde entier!

Le lieu la Fabrique des possibles nous est librement accessible lors de nos réunions.

Lire l'article complet ↗
Kingdom Conquest Games

Kingdom Conquest Games

You would think that interactive mapping platforms are the perfect tool for building territory expansion games. However, I can think of very few good map conquest games.

There are a few popular 'Risk'-type games, such as War.app, that involve claiming and conquering territories on a map. There have also been a few 'Monopoly'-type games, such as Upland, that involve buying and selling virtual real estate on an interactive map tied directly to actual addresses in major global cities.

InkDom, however, may be the territory-grabbing game that we have all been waiting for. It turns the real world into a giant game board where you can draw a loop around your neighbourhood and claim everything inside it as your own. Even better, you also claim the people who live there.

...
Lire la suite →
Rédiger sa documentation

Rédiger sa documentation

Avant de commencer vos modifications, pensez Ă  effectuer les Ă©tapes prĂ©alables indiquĂ©es page prĂ©cĂ©dente. Vous Ă©viterez ainsi d’éventuels conflits.

Modifier et prévisualiser avec VS Code #

À la suite de l’installation de VS Code, vous pouvez prĂ©visualiser l’écriture de contenu de plusieurs facons. NĂ©anmoins, cette prĂ©visualisation n’englobera pas les composants DSFR. Il faudra dĂ©ployer le site en local pour avoir une image complĂšte de prĂ©visualisation (cf. page prĂ©cĂ©dente).

Cliquez sur le bouton de prévisualisation (ou utilisez les raccourcis claviers Crtl + K puis V) :

...
Lire la suite →

GEODATADAYS 2026 🌍 1500 MERCIS !

GEODATADAYS 2026 🌍 1500 MERCIS ! GEODATADAYS 2026 🌍 1500 MERCIS ! AfigĂ©o

Salles combles, confĂ©rences passionnantes, dĂ©luge d’innovations, sans oublier les nombreux moments de discussions, de rencontres : l’AfigĂ©o ainsi que les partenaires locaux et nationaux investis dans l’organisation de cette 9Ăšme Ă©dition vous remercient vivement pour votre mobilisation ! Vous avez participĂ© aux GeoDataDays 2026 ? Donnez nous votre avis ⭐ + 1500 participants, + 100 exposants, + 130 expertises partagĂ©es
 Toute la [
]

The post GEODATADAYS 2026 🌍 1500 MERCIS ! first appeared on AfigĂ©o.
Lire l'article complet ↗
Shine a Light

Shine a Light

There are plenty of maps that show you where the world's lighthouses are. Lighthouses, live does something much more interesting: it shows you how they actually work. Instead of just showing each lighthouse as a static point on a map this map gives you a sense of what its light signal actually looks like at sea.

Lighthouses, live plots charted coastal lights on a dark, night-time relief map and animates each one according to its real-world light characteristics. Some lights sweep continuously across the sea, while others flash in distinctive sequences, with the timing and colour of each beam taken from nautical charts. Impressively, terrain data is also used to block the light based on the surrounding topography, so you can actually see how each lighthouse's beam is constrained by the coastline and landscape.

...
Lire la suite →

Kartoza: QGIS vs. the Browser

For most of its history, QGIS has been a desktop application. You installed it on your machine, loaded your data, ran your analyses, and produced your maps, all within the four walls of a single window. The browser was a separate universe. If you wanted your maps on the web, you exported them as images or handed them off to a completely different stack.

That boundary is dissolving. Over the past decade, QGIS has been quietly expanding beyond the desktop, first through server-side rendering, then through web standards, and now through WebAssembly. The line between “QGIS” and “the browser” is blurring, and the implications for how we build geospatial applications are significant.

Lire l'article complet ↗

Kartoza: The Rise of Cloud-Native Geospatial

For most of GIS history, the workflow has been the same: find a dataset, download it, unzip it, load it into your desktop software, and then work with it locally. It is a process that has served us well for decades, but it breaks down the moment your datasets are measured in terabytes, your users are spread across continents, and your analysis needs to be reproducible and collaborative.

A quiet revolution has been building in the geospatial community over the past few years. It does not have a single flagship product or a dominant vendor behind it. Instead, it is a collection of open specifications, open source tools, and a shift in thinking about how geospatial data should live in the world. This movement is called cloud-native geospatial, and it is changing the game.

Lire l'article complet ↗
GIScussions: ///rocky.year.survived – for how long?

GIScussions: ///rocky.year.survived – for how long?

Thanks to Zachary DeBottis

what3words’ 2025 accounts

I am fascinated by what3words, it defies the laws of finance that apply to most businesses and shows how little my old fashioned understanding of business models is relevant in the modern tech economy.

The idea of a verbal description of a 3m square as a proxy for coordinates might have sounded like a good idea a decade ago but adoption seems to have been slow and new technology may be about to overtake the idea.

...
Lire la suite →
Building Age Maps: From NYC to LA

Building Age Maps: From NYC to LA

I recently featured New York in 1.67 Million Buildings - a building age map created by Block and Paper, who have developed similar animated timelines for 80 other US cities and lots of other cities around the world.

One of those other cities is Los Angeles. However, if you want an even wider perspective, Parcelscope's Every Building in Los Angeles County lets you view an animated construction history for the entire county. Their map visualizes nearly 3 million buildings constructed since 1880.

...
Lire la suite →
NouveautĂ© – La plateforme gĂ©ospatiale OneGeo Suite dĂ©sormais accessible dans le cloud

NouveautĂ© – La plateforme gĂ©ospatiale OneGeo Suite dĂ©sormais accessible dans le cloud

NEOGEO franchit une nouvelle étape avec le lancement de OneGeo Suite en version SaaS. Les entreprises et collectivités peuvent désormais accéder à une plateforme complÚte de gestion, de publication et de valorisation de leurs données géographiques directement depuis un cloud souverain sans avoir à installer ni administrer leur propre infrastructure. 

Depuis plusieurs années, la solution OneGeo Suite accompagne les acteurs publics et privés dans la gestion et la valorisation de leurs données géographiques. 

Elle s’appuie sur des technologies open source, une architecture modulaire et Ă©volutive, les standards OGC et la directive Inspire afin de favoriser l’interopĂ©rabilitĂ© et la pĂ©rennitĂ© des plateformes. 

...
Lire la suite →
Cartes et données sur l'évolution de la population européenne (1961-2024)

Cartes et données sur l'évolution de la population européenne (1961-2024)


L'Europe se trouve à un tournant : la population de l'UE a connu une croissance continue pendant des décennies, atteignant environ 450 millions d'habitants en 2025. Cependant, les experts prévoient que cette tendance s'inversera bientÎt. Ils estiment que le pic sera atteint vers 2029, aprÚs quoi la population diminuera progressivement. Ils anticipent que cette évolution variera considérablement d'une région à l'autre et que les migrations ne compenseront pas le déclin persistant du taux de natalité. La qualité de vie dans les zones rurales est menacée.

1) Une série chronologique exceptionnelle sur l'évolution démographique au niveau de l'UE

...
Lire la suite →
Espace de travail dédié

Espace de travail dédié

Rendez-vous dans votre tableau de bord en cliquant sur votre profil en haut Ă  droite de la page.

Dans la partie « Espaces de travail », vous pourrez faire une « Demande de crĂ©ation d’un espace de travail », ou bien « Rejoindre un espace de travail existant » :

Rejoindre un espace de travail existant #

Si l’entrepît que vous souhaitez rejoindre est public, vous pourrez le rechercher dans la liste :

Vous pouvez ajouter un message optionnel à votre demande :

...
Lire la suite →
Connexion

Connexion

Cartes.gouv.fr est une interface qui se base sur l’infrastructure GĂ©oplateforme. Ainsi, un compte personnel cartes.gouv.fr est en rĂ©alitĂ© un compte GĂ©oplateforme.

1 - Créer un compte Géoplateforme : #

Tout d’abord, cliquez sur « Se connecter » dans l’en-tĂȘte de la page :

Si vous ne possédez pas encore de compte Géoplateforme, ciquez sur « Pas encore de compte » :

...
Lire la suite →
The World Drawn by 3,000 People

The World Drawn by 3,000 People

These are the countries of the world as drawn by over 3,000 people on the Borderline country border game.

The object of Borderline is very simple. You are shown a map without borders and asked to draw the outline of a named country. You are then scored on the accuracy of your drawn border.  The scoring appears to be based on two measures of accuracy. The game calculates how far the real border is, on average, from your drawn line. The game also compares the length of your line with the actual length of the country's land border (drawing substantially more line than the real border can therefore hurt your score).

...
Lire la suite →
52 North: Open Science Capacity Building

52 North: Open Science Capacity Building

How to integrate Open Science principles into the research cycle?

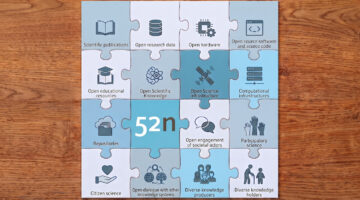
Open Science is about increasing the transparency, reproducibility, and reusability of research results. It touches upon data, software, infrastructure, Open Access to scientific papers and many other aspects relevant throughout the research process. However, for some reason (some people refer to the strong commercialization of scientific journals), Open Science used to be a niche topic and sharing research outputs was not the norm. Who hasn’t read about the infamous “We will share data upon request”? Fortunately, for more than a decade now, there has been a movement towards more openness; whether it’s the European Open Science Cloud, national initiatives like NFDI, or conferences pushing for more reproducibility like AGILE. UNESCO even released a whole Recommendation on Open Science a few years ago (see Fig. 1), which also considered societal aspects (e.g., Open engagement, Open dialogue) in addition to techn...

Lire la suite →
Élections rĂ©gionales 2026 en Allemagne : montĂ©e de l'extrĂȘme-droite, mais la gauche l'emporte Ă  Berlin

Élections rĂ©gionales 2026 en Allemagne : montĂ©e de l'extrĂȘme-droite, mais la gauche l'emporte Ă  Berlin


L'Allemagne traverse une pĂ©riode de bouleversements politiques majeurs suite aux Ă©lections rĂ©gionales de septembre 2026, marquĂ©es par des percĂ©es historiques de l'extrĂȘme droite et de la gauche radicale :

  • En Saxe-Anhalt : l'AfD a provoquĂ© un vĂ©ritable sĂ©isme politique en enregistrant son meilleur rĂ©sultat historique avec environ 44 % des voix.
  • Au Mecklembourg et en PomĂ©ranie-Occidentale : l'AfD (extrĂȘme droite) est arrivĂ©e en tĂȘte du scrutin avec un score historique de 38,2 % des voix.
  • À Berlin : la gauche radicale (Die Linke) a remportĂ© les Ă©lections dans la capitale. L'AfD y rĂ©alise Ă©galement une progression en obtenant plus de 16 % des suffrages.

...
Lire la suite →

Ajout du statut UNPUBLISHED pour les offres + Évolutions de l’API d’Extraction + Corrections de bugs sur l’entrepît

Changements # Ajout du statut UNPUBLISHED pour les offres #

Afin de gĂ©rer la dĂ©sactivation de couches sans les supprimer (pour en garder l’ID, les permissions et les statistiques), on ajoute un statut UNPUBLISHED aux offres. Ce statut implique les nouveaux comportement suivants :

...
Lire la suite →
GeoSolutions: Meet GeoSolutions at Smart City Expo World Congress 2026 (Hall 2, Stand C161): open source geospatial platforms for cities

GeoSolutions: Meet GeoSolutions at Smart City Expo World Congress 2026 (Hall 2, Stand C161): open source geospatial platforms for cities

Dear Reader,

From November 3 to 5, 2026, GeoSolutions will be at Smart City Expo World Congress in Barcelona, Fira Gran Via, as part of the Italian Pavilion organised by ITA, the Italian Trade Agency. You will find Eleonora Fontana and the GeoSolutions team in Hall 2, Stand C161. If you are planning to attend and want to talk about geoportals, urban digital twins or open data infrastructure for your city, write to sales@geosolutionsgroup.com and we will book a slot at the stand.

...
Lire la suite →

Du 8 au 10 décembre 2026 à Lille : Formation 3 jours "Savoir utiliser DV3F"

Publié le 22 septembre 2026

Une session de formation "Savoir utiliser DV3F" se tiendra du 8 au 10 dĂ©cembre 2026 dans les locaux du Cerema Hauts-de-France Ă  Lille.Cette session est Ă  destination des bĂ©nĂ©ficiaires des fichiers donnĂ©es fonciĂšres (Fichiers Fonciers et DV3F) et des bureaux d'Ă©tudes.Vous trouverez le contenu et le coĂ»t de la formation dans la rubrique (
)

Lire l'article complet ↗
The US Deportation Map

The US Deportation Map

Since January 2025, the United States has deported at least 25,447 people to countries that are not their own. According to The Guardian those deported 'include those who spent most of their lives in the US, parents detained on the school run, (and) the adult children of elderly relatives who depend on them for care.'

The Deportation Project Map lets you explore the Trump administration's global network of deportations. Click on a country on the map and you can see the number of people who have been deported there alongside a breakdown of the nationalities of those who have been deported.

...
Lire la suite →

Le Géoportail rejoint le site cartes.gouv.fr


Source : « Le Géoportail rejoint cartes.gouv.fr » (Carte.gouv.fr)

Le site GĂ©oportail Ă©volue et rejoint cartes.gouv.fr,  nouveau point d’accĂšs unique Ă  l’ensemble des cartes, photographies aĂ©riennes et donnĂ©es gĂ©ographiques publiques produites par l’IGN et ses partenaires sur l’ensemble du territoire français. Le site GĂ©oportail reste disponible jusqu’au 30 septembre 2026, date de sa fermeture dĂ©finitive. 

Pourquoi le site Géoportail évolue ? 

...
Lire la suite →

Socio-Spatial Inequalities in a Wealthy Capital: Revisiting Urban Models in Luxembourg City

Socio-spatial inequalities remain a significant feature of contemporary cities, even in contexts of high affluent contexts. This paper examines neighbourhood-level inequalities in Luxembourg City, one of Europe’s wealthiest capitals, where aggregate statistics often mask substantial internal disparities.
This paper makes two main contributions. First, it analyses a rich and globalised capital city that has rarely been studied at the neighbourhood scale. Second, it draws on an original and uniquely integrated dataset combining socio-economic, demographic, housing, and welfare indicators assembled from multiple administrative and institutional sources that have not previously been examined jointly.
Using a classical factorial ecology approach, the study identifies the principal dimensions of socio-spatial differentiation and situates Luxembourg City within broader comparative debates on contemporary urban forms and the drivers of social segregatio...

Lire l'article complet ↗
Tout savoir sur les bùtiments de la BD TOPOŸ et le lien avec le RNB

Tout savoir sur les bùtiments de la BD TOPOŸ et le lien avec le RNB

L’information bĂątimentaire de la BD TOPOÂź a Ă©tĂ© initialisĂ©e dans les annĂ©es 1990 Ă  partir des anciennes bases de donnĂ©es cartographiques et mise Ă  niveau en 2010 avec les donnĂ©es du parcellaire cadastral (Plan Cadastral InformatisĂ©) dans le but d’ĂȘtre interopĂ©rable avec les autres rĂ©fĂ©rentiels IGN.

La mise Ă  jour des emprises au sol du bĂąti est dĂ©sormais effectuĂ©e majoritairement par restitution photogrammĂ©trique Ă  partir des images aĂ©riennes acquises par l’IGN (une trentaine de dĂ©partements volĂ©s par an), ce qui permet de cartographier de maniĂšre quasi exhaustive tous les bĂątiments ayant une emprise au sol de plus de 20 mÂČ tous les 3 ans. La BD TOPOÂź est aussi entretenue avec des bases locales de rĂ©fĂ©rence produites par des collectivitĂ©s comme l’EuromĂ©tropole de Strasbourg ou la MĂ©tropole europĂ©enne de Lille.

...
Lire la suite →
Oslandia recrute : Assistant·e polyvalent·e ADV/commercial·e

Oslandia recrute : Assistant·e polyvalent·e ADV/commercial·e

OSL2609A – Assistant·e polyvalent·e ADV/commercial·e

Cette offre est clÎturée, les candidatures ne seront plus analysées à partir du 28 Septembre 2026.

Oslandia

Oslandia est une sociĂ©tĂ© de services en informatique spĂ©cialisĂ©e dans les logiciels de systĂšme d’information gĂ©ographique opensource. Nous travaillons avec une excellence technique, pour amĂ©liorer les solutions SIG Opensource, afin de fournir des solutions pertinentes Ă  nos clients et valoriser les donnĂ©es gĂ©ographiques. Nous avons une structure efficiente avec un business model OpenSource prouvĂ©, et un impact sur les technologies et la sociĂ©tĂ©.

Nous recherchons

Oslandia recherche un·e assistant·e administration des ventes à temps plein, en télétravail.

...
Lire la suite →
The 540 Million Year History of the USA

The 540 Million Year History of the USA

This animated map shows the movement of the land that now makes up the United States (outlined in red) over the course of 540 million years. It was recorded from the Pangea Map, a new interactive map that “lets you explore 540 million years of continental drift, from the Cambrian explosion all the way to the present day”.

Maps such as Esri's Dance of the Continents, GPlates and Ancient Earth Globe already allow you to explore how the Earth has changed over time through shifting plate tectonics and continental drift.

...
Lire la suite →

Séminaire "Les satellites au service de la Guyane" du CNES

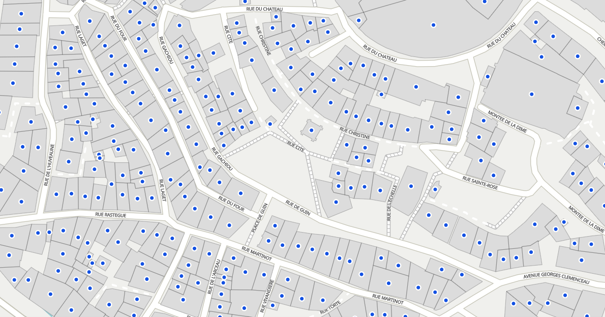
Du lundi 21 au vendredi 25 septembre 2026, s'est tenu à Cayenne le séminaire « Les Satellites au service de la Guyane », organisé par le CNES.

Le sĂ©minaire s’organisait autour des Ă©vĂšnements suivants :

  • PlĂ©niĂšre d'ouverture et plĂ©niĂšre de synthĂšse
  • 10 Ateliers thĂ©matiques
  • 2 ConfĂ©rences
  • 1 Formation 

Les échanges ont été riches, permettant d'identifier 27 enjeux et 91 actions à réaliser sur le territoire guyanais. Une charte d'engagement a été signée lors de la pléniÚre de synthÚse, dans l'objectif de mettre concrÚtement le spatial et la donnée satellitaire au service du développement de la Guyane. 

Un compte-rendu détaillé sera bientÎt transmis par le CNES.

Guyane-SIG a également présenté la plateforme territoriale dans le cadre de l'atelier « Structurer la donnée : accÚs, traitements, usages ».

...
Lire l'article complet ↗

VSC - Ingénieur informatique - géomatique F/H (SEAS Guyane)

L’IRD recrute un(e) VSC - IngĂ©nieur informatique / gĂ©omatique Ă  Cayenne, au sein de l’UMR ESPACE-DEV.

Pour une durĂ©e initiale de 12 mois, renouvelable, la mission porte notamment sur l’exploitation et l’administration du dispositif SEAS-Guyane, l’intĂ©gration et le traitement de donnĂ©es gĂ©ographiques et d’imagerie satellitaire, ainsi que le dĂ©ploiement et l’automatisation de chaĂźnes de traitement.

Profil recherchĂ© : diplĂŽme de niveau 6-7 (Licence, Master 2 ou diplĂŽme d’ingĂ©nieur) en  traitement d’images et programmation, informatique gĂ©omatique et tĂ©lĂ©dĂ©tection / traitement de donnĂ©es., avec des compĂ©tences en QGIS, OTB, R, Python et/ou Bash, ainsi qu’en environnement Linux.

...
Lire l'article complet ↗
Fernando Quadro: GeoServer + LDAP: autenticação centralizada, grupos e roles na pråtica

Fernando Quadro: GeoServer + LDAP: autenticação centralizada, grupos e roles na pråtica

Prezado leitor,

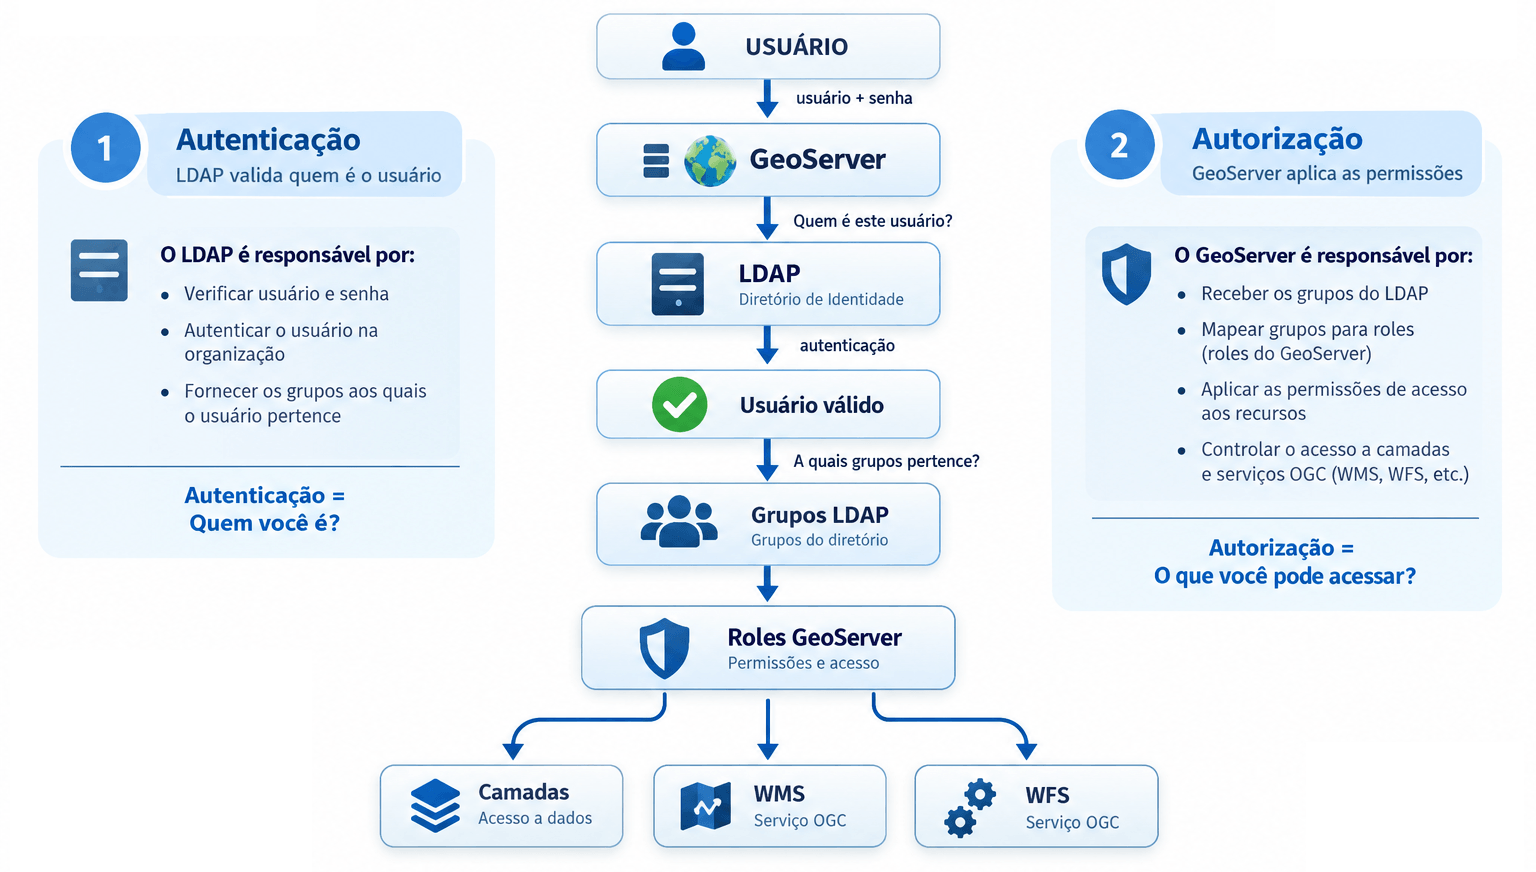
O intuito do post de hoje Ă© que vocĂȘ aprenda como integrar o GeoServer a um servidor LDAP, autenticar usuĂĄrios, transformar grupos LDAP em roles e preparar essas roles para utilização nas regras de segurança do GeoServer. O laboratĂłrio utiliza GeoServer 3, OpenLDAP e Docker Compose.

Em instalaçÔes simples do GeoServer Ă© comum administrar usuĂĄrios diretamente pela interface da aplicação. Esse modelo funciona bem em laboratĂłrios, treinamentos e ambientes pequenos. Em ambientes corporativos, porĂ©m, normalmente a organização jĂĄ possui uma infraestrutura centralizada de identidade. É nesse cenĂĄrio que entra o LDAP (Lightweight Directory Access Protocol).

Em vez de manter usuårios e senhas dentro do próprio GeoServer, podemos integrå-lo a um diretório LDAP e utilizar os usuårios e grupos existentes na organização. A arquitetura passa a ser semelhante a esta:

...
Lire la suite →
GeoWhisperer - See How the World Has Changed

GeoWhisperer - See How the World Has Changed

Since 2012, the London Legacy Development Corporation has gradually transformed the Queen Elizabeth Olympic Park from an essential local green space into a high-density residential hub driven by foreign investment. The before-and-after aerial imagery above provides a striking illustration of how the landscape of the Olympic 'park' is being built over.

This before and after image was created in a matter of seconds by GeoWhisperer. GeoWhisperer is a new tool from Henk van Ess that attempts to take some of the guesswork out of comparing satellite imagery. Designed for OSINT researchers, journalists and visual mappers, it automatically searches historical satellite imagery and uses AI to identify physical changes between different dates.

...
Lire la suite →
Mise à jour de la cartographie nationale des ouvrages et aménagements littoraux (Géolittoral)

Mise à jour de la cartographie nationale des ouvrages et aménagements littoraux (Géolittoral)


Une nouvelle version de la cartographie nationale des ouvrages et amĂ©nagements littoraux (Ă©dition 2026) est disponible sur GĂ©oLittoral. RĂ©alisĂ©e par le Cerema, avec le soutien du ministĂšre chargĂ© de la Transition Ă©cologique, cette cartographie recense les principaux ouvrages et amĂ©nagements prĂ©sents le long du front de mer, dans l’Hexagone, en Corse et dans les dĂ©partements et rĂ©gions d’outre-mer.
...
Lire la suite →
Free and Open Source GIS Ramblings: How to QGIS 4.2 on Linux Mint (Sept ’26)

Free and Open Source GIS Ramblings: How to QGIS 4.2 on Linux Mint (Sept ’26)

For a while now, my preferred way of installing QGIS has been from conda-forge. However, while we’re waiting for QGIS 4 to become available on conda-forge, there are alternatives:

Option 1: Flatpak

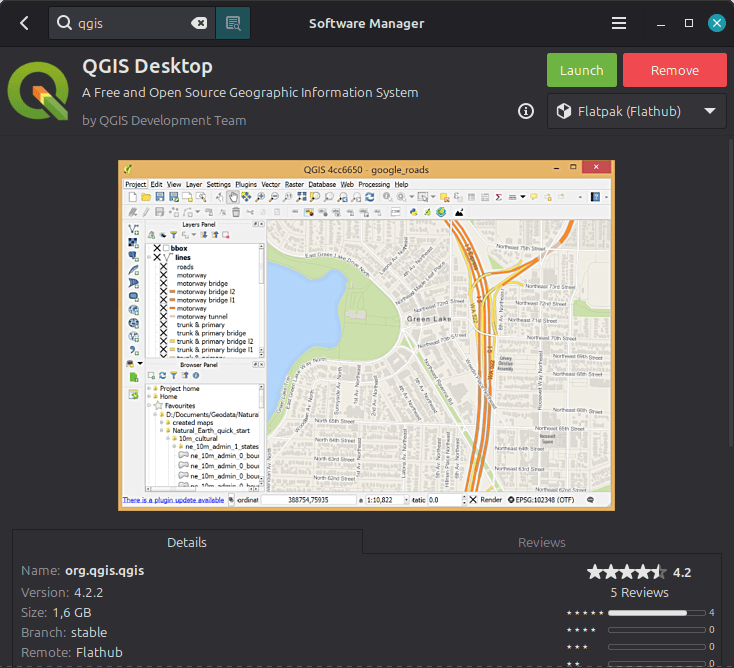
In the Software Manager, you can find QGIS from Flathub in two different versions: stable and lts. And stable should give you 4.2 (even if the Software Manager preview shows an older one):

Option 2: Meet the official QGIS Docker Images

...
Lire la suite →
GIScussions: How to Categorise 2,400 WordPress Posts

GIScussions: How to Categorise 2,400 WordPress Posts

On the Mappery site we have almost 2,400 posts on WordPress and we had never used the Category feature to sort them when we were adding posts. When we built the new Mappery Map Plugin for WordPress we included the option to only map posts in a specific category which we thought would be useful to some users in the future.Yesterday afternoon I wanted to see if there was a smart way to categorise 2,400 posts without stepping through each one in the WordPress edit interface which would have required time and dedication that I didn’t have!

I started out with this prompt:

...
Lire la suite →
Mapping the Last Ice Age

Mapping the Last Ice Age

During the Last Glacial Maximum, the European landscape looked radically unrecognizable compared to today. Enormous ice sheets flattened Northern Europe, global sea levels dropped dramatically, and the sheer weight of the ice compressed Earth's crust downward by hundreds of meters.

Europe Under the Ice is an impressive interactive mapped visualization that tracks these massive geophysical changes step-by-step from 24,100 BC all the way to the present day. Press play on the map and you can watch the ice sheets spread and retreat across Northern Europe over the millennia.

...
Lire la suite →
57000 METZ: Exposition MAKERLAND Metz 2026, Du samedi 19 septembre 2026 Ă  14h00 au dimanche 20 septembre 2026 Ă  18h00.

57000 METZ: Exposition MAKERLAND Metz 2026, Du samedi 19 septembre 2026 Ă  14h00 au dimanche 20 septembre 2026 Ă  18h00.

Le GRAOULUG, avec le BUG-Metz (Blender Users Group) et le Groupe OpenStreetMap Metz participeront aux 2 journées Makerland Metz 2026 (3000 à 4000 visiteurs attendus).

À cette occasion nous mettront en avant Linux et les Logiciels Libres incluant les logiciels graphiques et tout l'Ă©co systĂšme OpenStreetMap. Les visiteurs pourront avoir un aperçu de Linux et des Logiciels Libres sur diffĂ©rents PC sur notre stand et prendre connaissance de nos prochaines install party et ateliers logiciels graphiques et Openstreetmap.

Nous sommes Ă©galement partenaires de l'Arob@se, espace numĂ©rique des mĂ©diathĂšques de Metz. Ils  ne pourront pas ĂȘtre prĂ©sent cette annĂ©e sur notre stand mais nous diffuseront leurs informations.

Lire l'article complet ↗

Kartoza: Publishing biodiversity data to GBIF, straight from BIMS

Biodiversity data is most valuable when it is shared. A river survey stored in a single database helps one team, but the same records, shared openly, can inform researchers, conservationists, and policymakers around the globe.

That is exactly what the Global Biodiversity Information Facility (GBIF) is for. It is the world’s largest open network of biodiversity data.

...
Lire l'article complet ↗
GIScussions: You CAN teach an old dog new tricks

GIScussions: You CAN teach an old dog new tricks

Yesterday I gave a talk at Geomob London on my adventures in vibe coding. The slides are pretty but probably don’t tell the whole story unless you have been reading my regular posts on my projects.

The images in the slides are all cartoons of an old dog learning new tricks and got some praise, the way I made them was interesting, so i thought I would post about it.

I started out by building an empty slide deck on Google Slides, each slide had a title and a few had a handful of words, they all had spaces for an image. I asked Claude:

...
Lire la suite →

TerraVisu Ă©volue : tour d’horizon des nouveautĂ©s 2025-2026

Entre 2025 et 2026, Terra­Visu a béné­fi­cié de nombreuses évolu­tions pour rendre les données terri­to­riales plus simples à explo­rer, à analy­ser et à valo­ri­ser. Nouveaux modes de repré­sen­ta­tion, graphiques enri­chis, recherche amélio­rée, outils colla­bo­ra­tifs ou encore évolu­tions du back
Lire l'article complet ↗
Where’s the Perfect Weather?

Where’s the Perfect Weather?

Maps such as Pack Lightly's Best Time to Travel and Find the Best Time to Travel translate complex historical weather data into interactive heatmaps. By taking the guesswork out of trip timing, they make it easy to either match a destination with its optimal season or discover which parts of the world offer ideal weather for your travel dates.

For travelers who want deeper control over their planning, SeasonMap takes climate-based travel visualization a step further. Rather than relying on simple, static temperature averages, SeasonMap converts multi-source climate data into dynamic, activity-specific comfort scores (0–100) mapped globally for every month.

...
Lire la suite →

[Témoignage] Jérémie ORY, responsable du PÎle SIG au Département du Calvados

Jérémie Ory est responsable du PÎle SIG du Département du Calvados depuis 8 ans. Avec son équipe, il déploie et assure la maintenance des applications cartographiques du portail Mapéo Calvados, permettant aux communes, aux EPCI et aux partenaires du Département de consulter et de mettre à jour de nombreuses données géographiques. Le portail compte plus de 2 000 utilisateurs réguliers. Il revient sur le projet de diffusion PCRS :

Le projet PCRS – Plan Corps de Rue SimplifiĂ©

Depuis deux ans, le PĂŽle SIG travaille sur le projet PCRS (Plan Corps de Rue SimplifiĂ©), qui consiste Ă  produire et diffuser, Ă  l’échelle de l’ensemble du Calvados, des images aĂ©riennes de trĂšs haute prĂ©cision pour faciliter la gestion, l’amĂ©nagement et le suivi du territoire.

...
Lire la suite →
Bilan environnemental de la France (SDES)

Bilan environnemental de la France (SDES)


En mai 2026, le site Statistique publique de l'Energie, des Transports, du Logement et de l'Environnement (SDES) a mis en ligne son rapport Bilan environnemental de la France - Édition 2025. PubliĂ©s depuis 2020, ces bilans annuels font un Ă©tat de l'environnement en France et donnent les tendances et indicateurs clĂ©s en matiĂšre d'environnement.

1) Principaux résultats 

Les activitĂ©s Ă©conomiques, sources de pressions sur l’environnement

...
Lire la suite →
GIScussions: Mapping a Google Sheet – reworking the Geomob events map

GIScussions: Mapping a Google Sheet – reworking the Geomob events map

When Ed challenged me to make a map of Geomob Events on a podcast, I jumped in scraped the data and produced quite a nice map despite fighting a battle with Gemini to extract the data for the map from the markdown files of the Geomob website. The problem, as Ed pointed out retrospectively was that the events map was going to be difficult to maintain as further events got scheduled, it was very much a snapshot at a point in time and my suggestion that someone could edit the json file of events was not very practical.

...
Lire la suite →
170,000 Movies - One Interactive Map

170,000 Movies - One Interactive Map

I recently reviewed the Movie Scene Map, an interactive map that makes it easy to find which iconic movie scenes were filmed right around the corner from your house.

However, the fact that a film was shot near you doesn't necessarily mean that the movie is set in your neighborhood. In many cases, filmmakers use one location to stand in for another, either because it's cheaper, more convenient, or simply looks the part.

For example, Stanley Kubrick's Eyes Wide Shut, while set almost entirely in the moody, nocturnal streets of Greenwich Village and Manhattan, was shot almost entirely in London. Even more astonishingly, London was also used to create some of the iconic, sweat-soaked Vietnam jungle scenes in Full Metal Jacket.

...
Lire la suite →
52 North: 52°North Here and Now

52 North: 52°North Here and Now

Developing Challenge-based Services

20 years of 52°North! What a brilliant opportunity to reflect a little. Time to look back in time? Nah, Albert Remke, co-founder of 52°North, already did this successfully in his blog post 52°North – 20 Years of Exploring Horizons. So, shall we take a look ahead instead? Honestly, with the constant changes brought on by AI, predicting the next year is anyone’s guess. How about reflecting a bit on what we do right now?

At 52°North, we design and develop open-source software and infrastructure solutions with a geospatial background. Clear enough? No? Yeah, we get it, it sounds pretty abstract and generic. So how can we describe our services more specifically and showcase the ambitions we share with our partners from research and beyond? In other words:

What are the key challenges 52°North aims to address,

...
Lire la suite →
GeoSolutions: GeoSolutions at FOSS4G 2026 in Hiroshima

GeoSolutions: GeoSolutions at FOSS4G 2026 in Hiroshima

Dear Reader,

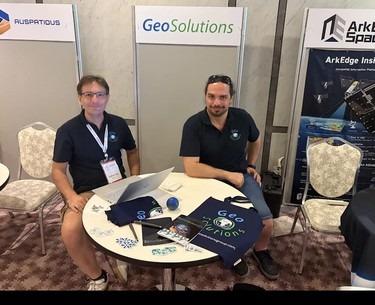
We are back from FOSS4G 2026 in Hiroshima, Japan, and we want to share what we presented and what we brought home. With up to 14 parallel tracks, this year's global edition was dense: two days of workshops, three days of talks, and plenty of conversations at the booth.

GeoSolutions attended with one representative per product line: Andrea Aime for GeoServer, Lorenzo Natali for MapStore and Stefano Bovio for GeoNode. Together they delivered 5 workshops and 14 presentations, and GeoSolutions supported the event as a sponsor, continuing our long-standing commitment to the OSGeo community and to open geospatial standards.

...
Lire la suite →

Propulsé par FreshRSS | 1568 articles au total